framework for a life cycle assessment of paper in …...life cycle assessment of paper in the mail...
TRANSCRIPT

The Aspen Institute
Initiative for the
International Mailing Industry
Framework for a
Life Cycle Assessment
of Paper in the Mail
Prepared by

2

3
Contacts:
Charles M. Firestone
Patricia K. Kelly
Communications & Society Program The Aspen Institute One Dupont Circle, NW Suite 700 Washington, DC 20036 USA
Phone +1 [202] 736-5818 Fax +1 [202] 467-0790
E-mail [email protected] [email protected]
Internet www.aspeninstitute.org/c&s
Contacts:
Nuno Da Silva
Jim Fava
Coppelia Marincovic
PE Americas 344 Boylston Street Boston, MA 02116 USA
Phone +1 [617] 247-4477 Fax +1 [617] 236-2033
E-mail n.dasilva@ pe-international.com [email protected] [email protected]
Internet www.pe-americas.com

4
ACKNOWLEDGEMENTS: ORGANIZATIONS THAT CONTRIBUTED TO THIS REPORT
All of this was made possible by the generous contributions of time, knowledge, data, and financial support from the Aspen Institute Initiative on the International Mailing Industry: Members of the Initiative included Pitney Bowes and Siemens as Senior Sponsors, and Austrian Post, Bank of America, Bookspan (Bertelsmann), Bulgarian Post, DRAFTFCB Advertising, Federal Express, Groupe La Poste, KEBA, Kodak, Latvian Post, Postel (Poste Italiane), RR Donnelley Logistics, Sandd, Solystic, UPS Europe, USPS, Xerox, University of Southern California, and Mt. Allison University, as Members.
The following organizations contributed specifically to the Life Cycle Assessment contained within this report: Austrian Post; Bank of America; Canada Post; Dow Chemical Co.; International Paper; La Poste; Pitney Bowes; Post Danmark; Quad Graphics; Siemens; SLS Consulting; Solystic; and the United States Postal Services (USPS).

5
TABLE OF CONTENTS
Foreword.....................................................................................................................................................11
Executive Summary.....................................................................................................................................15
1 Context and Goal of the Study............................................................................................................17
1.1 Goal of the Study .......................................................................................................................17
1.2 LCA description ..........................................................................................................................17
1.3 ISO’s LCA Standards ...................................................................................................................19
1.4 LCA Software and Databases..................................................................................................... 20
2 Scope of the Study ..............................................................................................................................22
2.1 Description of the Life Cycle of Mail.......................................................................................... 22
Production of Mail Phase....................................................................................................................22
Transportation, Operations and Delivery Phase.................................................................................23
Use Phase............................................................................................................................................24
End of Life ...........................................................................................................................................25
2.2 System Boundaries for this project ...........................................................................................25
2.2.1 Time coverage .......................................................................................................................26
2.2.2 Technological and Geographical coverage............................................................................27
2.2.3 Specifications for this LCA system.........................................................................................27
‐ Allocation ..........................................................................................................................................27
‐ Emissions to Air, Water and Soil .......................................................................................................28
‐ Cut‐off criteria...................................................................................................................................28
‐ Data Quality check ............................................................................................................................28
2.3 Functional Unit ..........................................................................................................................29
2.3.1 Complexity of definition of a functional unit for this system ...............................................29
2.3.2 Functional Unit ......................................................................................................................29
2.4 Selection of relevant Life Cycle Inventory Assessment methodology and types of impacts ....29

6
3 Methodological Considerations ..........................................................................................................32
3.1 From the flow chart to a modeling phase .................................................................................32
3.1.1 Software and Database .........................................................................................................32
3.1.2 Overview of the Model .........................................................................................................32
Production of Mail ..............................................................................................................................34
Transportation, Collection and Distribution phase.............................................................................37
Use phase............................................................................................................................................37
End of Life ...........................................................................................................................................38
3.2 Data Collection ..........................................................................................................................38
3.2.1 Methodology for Data Collection..........................................................................................40
‐ Production phase..............................................................................................................................40
‐ Transportation, Operations and Distribution ................................................................................... 41
‐ Use phase..........................................................................................................................................41
‐ End of Life .........................................................................................................................................41
3.2.2 Background Data ...................................................................................................................42
‐ Fuels and energy...............................................................................................................................42
‐ Raw and process materials ...............................................................................................................42
4 Challenges and some tips on approach ..............................................................................................43
4.1 Identifying the key value chain stages and Industry players: the diversity of the mailing system ...................................................................................................................................................43
4.2 Soliciting and obtaining data .....................................................................................................43
4.3 Ensuring consistent data quality and representativeness of the data......................................44
4.4 Identifying the critical review panel .......................................................................................... 44
5 Recommendations and Next Steps.....................................................................................................46
5.1 Full ISO compliant LCA report....................................................................................................46
5.2 Complementary tool: the i‐report for customized assessment ................................................48
5.3 Comparison Study......................................................................................................................51
References ..................................................................................................................................................53

7
Appendix A. Detailed description of the Life Cycle of Mail ........................................................................55
Appendix B. Detailed description of a model .............................................................................................58
Production of Mail ..............................................................................................................................58
Transportation, Operations and Distribution .....................................................................................64
Use Phase............................................................................................................................................68
End of Life ...........................................................................................................................................68

8
LIST OF FIGURES
Figure 1. Description of the Life Cycle of Mail (overview) ..........................................................................22
Figure 2. Production phase of the mail piece .............................................................................................23
Figure 3. Transportation, Operations and Delivery phase..........................................................................24
Figure 4. Use phase.....................................................................................................................................24
Figure 5. End of Life ....................................................................................................................................25
Figure 6. Description of system boundaries ...............................................................................................26
Figure 7. Overview of the model ................................................................................................................33
Figure 8. Legend for reading model in GaBi 4.............................................................................................33
Figure 9. Model for Production of Mail (part 1) .........................................................................................35
Figure 10. Model for Production of Mail (part 2) .......................................................................................36
Figure 11. Model for Transportation, Operations and Distribution ...........................................................37
Figure 12. Model for End of Life .................................................................................................................38
Figure 13. Overview of the i‐report ............................................................................................................49
Figure 14. How does i‐report work? ...........................................................................................................49
Figure 15. Example of parameters in i‐report.............................................................................................51
Figure 16. Detailed LC for production of mail.............................................................................................55
Figure 17. Detailed LC for transport of mail ...............................................................................................56
Figure 18. Detailed LC for End of Life..........................................................................................................57
Figure 19. Overview of the model ..............................................................................................................58
Figure 20. Model for Production of Mail (part 1) .......................................................................................60
Figure 21. Model for Production of Mail (part 2) .......................................................................................61
Figure 22. Model for Printing phase ...........................................................................................................62
Figure 23. Model for Inserting and Postage printing..................................................................................63
Figure 24. Model for Transportation phase................................................................................................64
Figure 25. Model for Transportation by the post in Canada ...................................................................... 66
Figure 26. Model for Secondary packaging.................................................................................................67
Figure 27. Model for End of Life .................................................................................................................68

9
LIST OF TABLES
Table 1. System boundaries (key flows) .....................................................................................................26
Table 2. Life Cycle Impact Assessment categories, indicators of contribution to environmental issues, units of measure, & brief descriptions .......................................................................................................30
Table 3. Description of data requirements .................................................................................................39
Table 4. Data Collection methodology for production phase.....................................................................40
Table 5. Data collection methodology for Transportation phase...............................................................41
Table 6. Data collection methodology for Use phase.................................................................................41
Table 7. Data collection methodology for Disposal phase .........................................................................41
Table 8. Description of potential parameters in i‐report............................................................................50

10

11
Foreword
The Aspen Institute Initiative for the International Mailing Industry
Framework for a Life Cycle Assessment of Paper in the Mail
The Aspen Institute Initiative. The mail, courier and express package delivery industries – the communications media which include the delivery of information that has a physical element – have many important and positive qualities for society and the economy. But they encounter doubts within and misperceptions from the outside. Although there is a significant business ecology surrounding this sector, those within it often do not see the opportunities of the large whole, and those outside under‐appreciate its value and potential.
The Aspen Institute Initiative for the International Mailing Industry convened sector leaders from the entire mailing ecology (posts, competitors, vendors, technology companies, advertising agencies, mailers, paper and envelope manufacturers, and intellectual leaders) to help reposition the industry for growth, innovation, and broad public appreciation.
The objective of the Initiative was to create a forward‐looking vision of the global mailing sector, broadly conceived, as a trusted, valued and respected medium of communication; to encourage a mindset in the industry that identifies new opportunities and rewards growth and innovation; and to develop proposals and initiatives for cross‐industry collaboration.
Members of the Initiative included Pitney Bowes and Siemens, Senior Sponsors, and Austrian Post, Bank of America, Bookspan (Bertelsmann), Bulgarian Post, DRAFTFCB Advertising, Federal Express, Groupe La Poste, KEBA, Kodak, Latvian Post, Postel (Poste Italiane), RR Donnelley Logistics, Sandd, Solystic, UPS Europe, USPS, Xerox, University of Southern California, and Mt. Allison University, as Members.
During the course of this Initiative, the group sought to develop an environmental initiative that looked to increase sustainability in the decisions that mailing industry organizations make. This involved research into ways that firms can benefit the environment while becoming more efficient in how they conduct business. In short, benefiting the environment can be an economic opportunity as well as a social benefit, and this may be enhanced through collaborations among firms (e.g., sharing truck deliveries, and/or jointly evaluating the true costs of alternatives). To move this effort forward, the Group determined to explore the environmental implications of paper in the mail.
The Framework for a Life Cycle Assessment. Corporate sustainability impacts all components of the value chain within which a company exists. Within the international mailing industry, that value chain is extensive, from paper producers through vendors and postal operators to disposal by the final customer. Corporate sustainability takes into consideration not only the value to be gained from environmental initiatives, but also the impact those initiatives have throughout the mailing cycle.
Environmental sustainability within the international mailing industry is a constantly evolving effort that requires a renewed focus on international cooperative efforts among key participants of the international mailing ecology.

12
The Aspen Institute Communications and Society Program is proud to contribute to this effort with this extensive report describing a framework for a life cycle assessment of paper within the international mailing ecology. This is the first comprehensive and collaborative study to establish a series of standards that can be used for future life cycle assessments within the international mailing industry.
This report, then, is an attempt to document a complete process that includes a measurement framework, critical measurement categories that go beyond the traditional carbon footprint, a mailing industry environmental process model, and a summary of possible analytical software programs that could be used to perform what‐if analyses to improve overall performance.
The aim is to aid readers and industry participants in establishing a full organizational sustainability process that includes:
1. Developing an organizational sustainability and climate change policy that includes key metrics for environmental, social and economic performance;
2. A comprehensive sustainability strategy supported by proper assessment tools; and,
3. An implementation framework that supports organizational goals, and goals for the entire mailing industry.
The Report. This report was the product of a working group of the Aspen Institute Initiative which brought in others to help develop the model for an LCA (life cycle assessment) of paper in the mail. The report provides context on what an LCA is, how one is constructed, and the elements necessary to meet international standards. It details the mailing process, cradle‐to‐grave, including an extensive appendix on the subject. Were we able to collect sufficient data, the Initiative would have had a fully ISO‐ compliant LCA to present. In light of the restrictions of our data set, we determined instead to provide this as a framework for future efforts to construct such an LCA. That is, we present what data and conclusions we have in a way designed to contribute to a general understanding of the environmental impact of mail, and in a form that can be used by others to develop more detail on the subject in the future. The report concludes with options for future courses of action.
Acknowledgments. This effort comes at the end of a lengthy process. The Intitiative itself began as the brainchild of Michael Critelli, former CEO of Pitney Bowes, and Ruth Goldway, currently Chairman of the U.S. Postal Regulatory Commission. The environmental LCA project was first suggested at an Aspen Institute Initiative CEO Roundtable by Jean‐Paul Bailly, CEO of Groupe La Poste. In addition to the extensive work of our members and their representatives to the Initiative, we thank the following people who worked tirelessly to make the Initiative a reality: Luis Jiminez and Stefano Gori, both formerly of Pitney Bowes, Gene Columbo, Adviser, and Patricia Kelly, Assistant Director, Aspen Institute Communications and Society Program. We also thank Jim Fava, president of Five Winds, Nuno Da Silva and Coppelia Marincovic, PE Americas, for their excellent work on this report.

13
All of this was made possible by the generous contributions of time, knowledge, data, and financial support from the Aspen Institute Initiative on the International Mailing Industry: Members of the Initiative included Pitney Bowes and Siemens, Senior Sponsors, and Austrian Post, Bank of America, Bookspan (Bertelsmann), Bulgarian Post, DRAFTFCB Advertising, Federal Express, Groupe La Poste, KEBA, Kodak, Latvian Post, Postel (Poste Italiane), RR Donnelley Logistics, Sandd, Solystic, UPS Europe, USPS, Xerox, University of Southern California, and Mt. Allison University, as Members.
Charles M. Firestone Executive Director
Communications and Society Program The Aspen Institute
December 2009

14

15
EXECUTIVE SUMMARY
The Aspen Institute Initiative for the International Mailing Industry was created to foster a forward‐looking vision of the global mailing sector, broadly conceived, as a trusted, valued and respected medium of communication; to encourage a mindset in the industry that identifies new opportunities and rewards growth and innovation; and to develop proposals and initiatives for cross‐industry collaboration.
The Initiative’s ultimate objective was to create new visions and design collaborative models for the global mailing industry. The group consisted of companies up and down the value chain and Posts from both sides of the Atlantic. This publication is the result of the group’s visioning to develop a Life Cycle Assessment that looks to understand the environmental impacts of the international mailing industry and develop increased sustainability in the decisions that mailing industry organizations make. The Aspen Institute Communications and Society Program in partnership with PE‐Americas conducted the process by developing the basic framework, identifying the types of data needs, modeling characteristics, and outlining possible paths forward.
The Initiative:
• Defined the international mailing ecology to include creation and production of the mail pieces, collection, sorting and distributing of the mail, use, and end of life management of mail pieces;
• Identified key players among the international mailing ecology;
• Described the data needs and life cycle model at each stage of the mailing life cycle;
• Discussed the challenges faced throughout this effort, including:
o Identifying the key value chain stages and players
o Soliciting and obtaining data
o Ensuring consistent data quality and representativeness of the data
o Identifying a critical review panel
o Understanding the complexity of the mail piece
• Recommended next steps including the creation of:
o A full ISO compliant report
o Complementary tools – e.g., i‐reports
o Comparison studies.

16
1
17
FRAMEWORK FOR A LIFE CYCLE ASSESSMENT OF PAPER IN THE MAIL
CONTEXT AND GOAL OF THE STUDY
1.1 GOAL OF THE STUDY
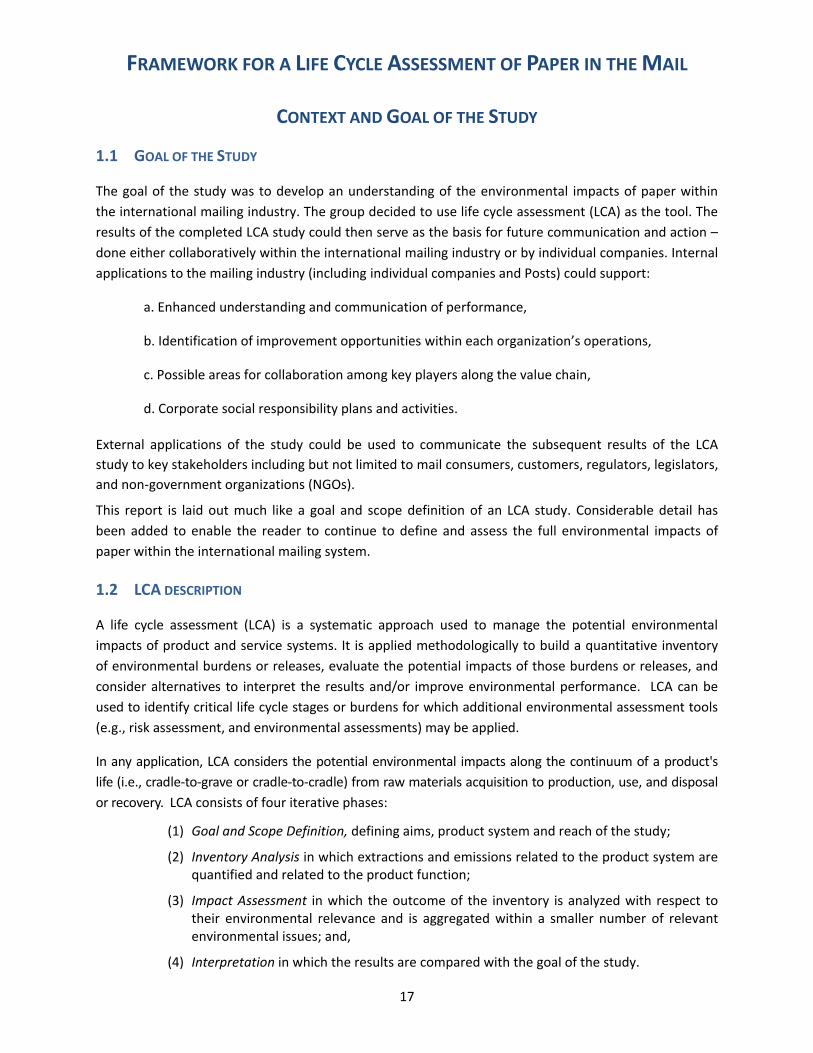
The goal of the study was to develop an understanding of the environmental impacts of paper within the international mailing industry. The group decided to use life cycle assessment (LCA) as the tool. The results of the completed LCA study could then serve as the basis for future communication and action – done either collaboratively within the international mailing industry or by individual companies. Internal applications to the mailing industry (including individual companies and Posts) could support:
a. Enhanced understanding and communication of performance,
b. Identification of improvement opportunities within each organization’s operations,
c. Possible areas for collaboration among key players along the value chain,
d. Corporate social responsibility plans and activities.
External applications of the study could be used to communicate the subsequent results of the LCA study to key stakeholders including but not limited to mail consumers, customers, regulators, legislators, and non‐government organizations (NGOs).
This report is laid out much like a goal and scope definition of an LCA study. Considerable detail has been added to enable the reader to continue to define and assess the full environmental impacts of paper within the international mailing system.
1.2 LCA DESCRIPTION
A life cycle assessment (LCA) is a systematic approach used to manage the potential environmental impacts of product and service systems. It is applied methodologically to build a quantitative inventory of environmental burdens or releases, evaluate the potential impacts of those burdens or releases, and consider alternatives to interpret the results and/or improve environmental performance. LCA can be used to identify critical life cycle stages or burdens for which additional environmental assessment tools (e.g., risk assessment, and environmental assessments) may be applied.
In any application, LCA considers the potential environmental impacts along the continuum of a product's life (i.e., cradle‐to‐grave or cradle‐to‐cradle) from raw materials acquisition to production, use, and disposal or recovery. LCA consists of four iterative phases:
(1) Goal and Scope Definition, defining aims, product system and reach of the study;
(2) Inventory Analysis in which extractions and emissions related to the product system are quantified and related to the product function;
(3) Impact Assessment in which the outcome of the inventory is analyzed with respect to their environmental relevance and is aggregated within a smaller number of relevant environmental issues; and,
(4) Interpretation in which the results are compared with the goal of the study.

18
LCA helps identify trade‐offs and opportunities for improvement
Many of the approaches to environmental protection continue to be based on “end‐of‐pipe” solutions, focused on single media (e.g., air, water, soil) or on a single stage in the life‐cycle of a product (e.g., production, use, disposal), or single issue (e.g., single chemical limits). These solutions do not always lead to an overall reduction in environmental impacts. Pollution control resources are spent on activities that are required by laws and regulations, and do not always provide the most efficient use of those resources in terms of reducing impacts.
This approach has often allowed unanticipated environmental impacts to occur. For example, it may solve one environmental problem while generating other, often unexpected problems elsewhere (e.g., in another environmental medium or location). Because they are not designed to address a full understanding of the trade‐offs and their implications in a systematic fashion, single issue approaches often diminish opportunities for achieving net environmental improvements.
The result of an LCA study helps identify both opportunities and risks of a product or technology, from raw materials to final disposition. A life cycle starts with raw materials and energy generation, and then includes manufacturing and transport, use, and eventually final disposal or recycling. A life cycle assessment helps society recognize how choices influence each of these stages so leaders can choose to make positive impacts on the economy, the environment and society.
Life cycle assessment means recognizing that choices and decisions are not isolated, but are connected to and influence a larger system. A life cycle assessment is not about making “right” or “wrong” decisions; it simply helps decision makers make decisions in context and understand the intentional and unintentional impacts of our actions. Decision makers can also try to avoid decisions that fix one environmental problem, like polluting the air, but cause other unexpected, or costly environmental problems, such as polluting the water.
LCA can assist in:
• Identifying opportunities to improve the environmental aspects of products at various points in their life cycle;
• Decision‐making in industry, governmental or non‐governmental organizations (e.g. building design, material and product selection);
• Selection of relevant indicators of environmental performance, including measurement techniques; and,
• Marketing (e.g. an environmental claim, eco‐labeling scheme or environmental product declarations).

19
Core LCA Principles:
The new ISO 14040, formulated by the International Standards Organization, articulates a number of principles:
1 Life Cycle Perspective: LCA is unique in considering the whole physical life cycle of a product (or service) system, from raw material extraction, over energy and material production, manufacturing, use and end of life operations. Through such a perspective, burden shifting among life cycle stages or individual processes can be identified and avoided.
2 Comprehensiveness: LCA ideally includes all environmental aspects, such as raw material extraction, ecologic systems integrity, and human health considerations. By including all aspects into one common assessment, trade‐off opportunities can be identified.
3 Transparency: Due to the inherent complexity in LCA system assessments, transparency is an important guiding principle in executing LCA studies, and is necessary in order to ensure a proper interpretation of the results.
4 Flexibility: The ISO standard provides overall principles and guidelines for LCA. The methodology allows specific LCA studies sufficient flexibility in applying this standard while maintaining a common methodological framework.
5 Iterative Nature: LCA consists of phases: Goal and Scope Definition, Life Cycle Inventory, Life Cycle Impact Assessment (if performed), and Life Cycle Interpretation. This standard defines LCA as iterative in nature, where the individual phases of an LCA incorporate results of the preceding phases and require the standard user to continually observe the given goal and scope of the study. The iterative approach within and among the phases of LCA is important, because it contributes to the comprehensiveness and consistency of the study and the reported results.
6 Environmental Focus: LCA studies the environmental aspects of a product system. Typically economic and social aspects are outside the study.
7 Science Based: The LCA methodology and LCA studies should be science based. While the state of scientific knowledge constantly changes, LCA studies are a snapshot of a given state of knowledge at a certain time.
8 Relative Nature: LCA’s relate environmental aspects to a product system. All findings are measured and expressed according to environmental aspect per functional unit. In addition, LCA relates a product’s life cycle impact assessment aspects to reference substances, such as Green House Gas (GHG) equivalents, which are expressed in equivalent units of carbon dioxide (CO2).
9 Potential Environmental Impacts: LCA studies only potential environmental impacts. Due to the relative expression of impacts to a reference unit, the integration of environmental releases over space and time, the inherent uncertainty in modeling environmental impacts, and the fact that some possible impacts are clearly future impacts, all impacts are potential in nature.
1.3 ISO’S LCA STANDARDS
The International Organization for Standardization (ISO) develops worldwide standards in an effort to standardize and thus streamline the international marketplace for industry. Among the tools under development are environmental management systems, auditing, environmental performance evaluation, life‐cycle assessment, and eco‐labeling. The development of the ISO 14000 series has been a global effort, with more than 30 countries participating. As of 2009 there are more than 20 specific standards with others in various stages of development (see www.iso.org).

20
Within ISO, Technical Committee (TC) 207 has the responsibility for the development of environmental management standards including those dealing with LCA. The scientific community uses the following ISO LCA standards and Technical Reports:
• ISO 14040 – General Principles and Framework. Provides the basic description and framework for the LCA from which the remaining LCA standards are based. This standard also defines the comparative assertion requirements including critical review.
• ISO 14044 – Environmental management – Life cycle assessment – Requirements and guidelines.
• ISO 14047 – Technical Report on “Illustrative examples on how to apply life cycle impact assessment.”
• ISO 14048 – LCA Data Documentation Format. This standard provides guidance on factors to consider when documenting LCA data.
• ISO 14049 – Technical Report on “Illustrative examples on how to apply goal and scope definition and inventory analysis.”
Additional ISO Standards that are related to LCA include:
• ISO 14025 — Environmental labeling and declarations — Type III environmental declarations — Principles and procedures. This standard specifically establishes the use of the life cycle assessment ISO 14040 series of standards in the development of Type III environmental declaration programs and Type III environmental declarations. The declarations covered by this standard are primarily intended for use in business to business communication, but their use from business to consumers is not precluded. [Note: There are three basic types of labeling program as defined by ISO; see ISO 14021: Type II ‐ Product Claims; ISO 14024: Type I ‐ Product Labels; and ISO 14025: Type III Product Declarations.]
• ISO 14062 – Environmental management — Guidelines to integrating environmental aspects in product development. This technical report is intended for use by those involved in the design and development of products.
• Guide 64 – Guide for the inclusion of environmental aspects in product standards. This guide is intended for product standard writers for a variety of purposes—including raising awareness that provisions in product standards can affect the environment both negatively and positively, and recommending the use of life cycle thinking and recognized scientific techniques when addressing the environmental aspects of the product that is being standardized.
Value of ISO LCA Standards
ISO standards provide an excellent source of information for understanding the basic elements and requirements for an LCA study. They also provide insights into factors to consider when evaluating the results of an LCA study or selecting a practitioner to complete an LCA study.
1.4 LCA SOFTWARE AND DATABASES
The GaBi software and database was used for the preliminary modeling of the Aspen Institute International Mailing Initiative Life Cycle Assessment.
GaBi 4 is an all‐in‐one software tool for modeling complex product systems from a life cycle perspective. Users can build product models, balance input and output flows, aggregate results, generate charts/graphs, and even create interactive reports using GaBi. The GaBi software contains the GaBi

21
database (described below), as well as other sources of data such as Eco‐invent and PlasticEurope. GaBi is designed to meet a broad range of client needs and is widely used in the industrial world for Life Cycle Assessment studies.
The GaBi database was developed in GaBi 4 by PE International. The database is based on 20 years of experience and collected data and is regularly updated with information derived from industry sources, scientific research, technical literature, and internal patent information, creating a solid foundation for assessing materials, products, services and processes.

22
2 SCOPE OF THE STUDY
2.1 DESCRIPTION OF THE LIFE CYCLE OF MAIL
The scope of the study is to develop a “cradle‐to‐grave” life cycle assessment of paper in the mail, which includes forest management, production of paper and envelope mail for both single letters and flats, transport, use (reading), and end of life management of the mail for the U.S. and Europe. The data sampling size should include annual representative data for a baseline year or best available when those data are not available. For this initial effort the Aspen Institute Initiative selected the year 2007 and focuses on a single delivered mail piece. Where differences exist within each of the life cycle stages (e.g., sorting for flats and letters) these should be identified. Additional guidance on mail pieces is discussed in section 2.3.
Figure 1. Description of the Life Cycle of Mail (overview)
The Initiative identified four main steps in the Life Cycle of the mail: the production phase, transport1 of the mail, the use phase, and the end of life. Each of these phases is detailed below. Section 3, below, and Appendix A “Detailed Description of the Life Cycle of the Mail“ provide additional information.
PRODUCTION OF MAIL PHASE
The production phase comprises all the steps from “cradle‐to‐gate“ for the production of the mail, from the production of the raw materials (chemicals, paper), the production of envelopes, and through the printing process. It also includes the “creation“ of the mail, from the design perspective (use of energy for creating a mail piece on a computer and maintaining it in memory on a server) to the final step: insertion of the printed paper into the envelope, and postage printing.
1 This transportation stage includes the collection, sorting, and delivery of the mail pieces – typically completed by the Posts.

23
Production of Mail
Paper Production
Envelope Production
Chemicals production
Manufacturing
Mail Design
Printing
Ink production
Printing process
Inserting
Postage Printing
Figure 2. Production phase of the mail piece
TRANSPORTATION, OPERATIONS AND DELIVERY PHASE
The transportation phase comprises all transportation means used for the travel of an average mail piece, for collection and delivery. On average, a mail piece travels through “n“ transport modes, with an average distance “x“ within each mode of transportation. Additionally, the “transportation phase” category includes the Posts’ facilities (electricity consumption for sorting and lighting, heating, water use, etc.).

24
Transport, Operations and Delivery
Transport fromproduction facility to
Post
Transport by Posts(from Post to
consumer)
Transport mean 1
Transport mean 2
Transport mean n
Final delivery box
Figure 3. Transport (collections), operations (e.g., sorting) and delivery phase
USE PHASE
The use phase is taken into account in this full life cycle, but no impact is associated with it.
Figure 4. Use phase

25
END OF LIFE
Three options for end of life management should be considered: the paper is either recycled, goes to the landfill, or is incinerated. If the paper goes to the landfill or incineration, some energy credit 2 can be taken into account from the energy recovered due to its burning or the electricity production from the methane in the landfill.
End of Life
Recycling
Landfilling
Incineration
Energy credit
Energy credit
Figure 5. End of Life
2.2 SYSTEM BOUNDARIES FOR THIS PROJECT
This study is intended to include the complete life cycle, cradle‐to‐grave, for the mailing system as outlined in the scope of the study. The basic system boundaries are presented in Figure 6, and Table 1 presents the key flows that are included and excluded. Between each of these major phases and subsequently in the figures, transportation between each step of the life cycle is included if applicable.
2 “Energy credits” correspond in the model to energy recovered from incineration of goods (energy recovery from burning), and from some landfills (where the methane produced at the landfill is extracted and used for electricity production). In the model, the “energy credits” subtract from the overall primary energy demand (PED), a certain amount of energy recovered, thus lowering the PED. The boundaries of the system should be defined in the Goal and Scope, including the choice of “taking into account or not” the energy recovery in end of life.

26
Figure 6. Description of system boundaries
Table 1. System boundaries (key flows)
Included Excluded
• Operation of equipment – e.g., energy • Operation (heating, lighting) of
post/facilities • Raw materials • Processing of materials • Consumables – direct cost items • Transportation of raw and processed
materials • Transportation of finished product • Manufacture of packaging materials • Use of product • Product disposal
• Manufacturing of maintenance and capital equipment
• Human labor • Manufacturing of vehicles and other
transportation • Transportation of employees
2.2.1 TIME COVERAGE
Primary data should be collected from different participants for their operational activities representative of a base year (e.g., 2007).

27
2.2.2 TECHNOLOGICAL AND GEOGRAPHICAL COVERAGE
In the planning for this work, data for the mail are representative of North American and European Industry technology, representative of the reference year (e.g. 2007) wherever possible. The description of each unit process should include a basic understanding of the range of technologies available within the unit process, and a statement from the representative who provided the data with respect to that range of technologies.
For other ancillary processes or materials, such as the production of inks, adhesives, fuels and power, the average industry mix of data from commercially available databases are acceptable in the absence of direct manufacturing data. More information on sources of data is detailed in Section 3.
2.2.3 SPECIFICATIONS FOR THIS LCA SYSTEM
‐ ALLOCATION
Life Cycle Assessment (LCA) is intended to quantify the inputs and outputs associated with a specific product system. In practice, however, industrial processes usually result in more than one product (co‐products). In order to understand a single product system, it may be necessary to apply an allocation process to the LCA model. Allocation is the partitioning of the input and output flows of a product system. For instance, allocation could be applied at the post office level where different types of mail pieces are collected and sorted (e.g. flat mail or letters). Some of the energy used to sort the mail pieces has to be “allocated” partly to letters, and partly to the flat mail.
According to the ISO 14040 and ISO 14044 standards there is a hierarchy of procedures for addressing this issue:
• If possible avoid allocation by either: dividing the unit processes so that inputs and outputs can be assigned to specific products OR expanding the system to include the function of co‐products.
• If dividing the unit processes and system expansion are not possible, allocation should be done according to the intention of the process.
• If allocation cannot be accomplished based on physical relationships, then other relationships between the co‐products should be used. The most commonly used allocation schemes allocate on the basis of:
—Mass
—Energy content
—Physical properties.
• ISO 14044, Section 4.3.4.2 (Allocation procedure) states, in part, “Where allocation cannot be avoided, the inputs and outputs of the system should be partitioned between its different products or functions in a way that reflects the underlying physical relationships between them.”
The Life Cycle Inventory is based on material balances between input and output. Allocation procedures should therefore approximate as much as possible fundamental input/output relationships and characteristics.

28
‐ EMISSIONS TO AIR, WATER AND SOIL
All emissions reported by companies for the specific operational phases within the system boundaries should be taken into account.
Data for all upstream materials and electricity and energy carriers can be obtained from the GaBi 4 database 2006.
Emissions associated with transportation should be determined by capturing the logistical operations of transport of mail. Energy use and the associated emissions can be calculated using pre‐configured transportation models from the GaBi 4 database 2006.
End‐of‐life emissions are determined by municipal waste operations data associated with landfilling.
‐ CUT‐OFF CRITERIA
The following cut‐off criteria should be applied during data collection and environmental analysis:
• Mass – If a mass is less than 1% of the cumulative mass of reliable estimates of inputs into the LCI model, it may be excluded, providing its environmental relevance is not a concern.
• Energy – If a flow is less than 1% of the cumulative energy of reliable estimates of inputs into the LCI model, it may be excluded, providing its environmental relevance is not a concern.
• Environmental relevance – If a flow meets the above criteria for exclusion, yet is thought to potentially have a significant environmental impact, it will be included. All material flows which leave the system (emissions) and whose environmental impact is over 1% of the whole impact of an impact category considered in the assessment must be covered.
The sum of the excluded material flows must not exceed 5% of the total mass, energy or environmental relevance. Environmental relevance will be estimated based on expertise and references.
‐ DATA QUALITY CHECK
The study should be subjected to a thorough quality assurance (QA) process at every major milestone. The objective of the QA is to ensure that the Life Cycle Inventory model and data collection questionnaire3 are designed such that results of the study meet the intended goal and scope and to ensure consistency and deliver the required information. An internal review should be performed by staff members who are knowledgeable in the field and have not been involved in the study.
To protect the intellectual property of each participating company:
• Only LCA consultant personnel have access to company specific primary data collected as part of this project;
• The LCA consultant presents data in only aggregated form in all project related internal discussions, meetings, workshops, and conferences;
• None of the Mailing Industry or their representatives has access or discusses company‐specific data; and,
3 The “data collection questionnaire” is a questionnaire given to all data providers to collect data on all relevant flows for the study (raw materials, energy consumption, emissions, etc.).

29
• The LCA consultant is restricted from using disaggregated results of the LCA study for the purposes of additional analyses beyond the scope this work.
2.3 FUNCTIONAL UNIT
2.3.1 COMPLEXITY OF DEFINITION OF A FUNCTIONAL UNIT FOR THIS SYSTEM
The mail system is complex; there is not one type of product being produced and transported, but rather several types of mail pieces—standard, first class, periodicals, flats, priority, etc. However, a functional unit is a way to normalize the different streams of mail, independently, and it should be applicable to all types of mail.
Among the differences between mail pieces:
‐ Physical differences (e.g. weight/size)
‐ Transport paths (e.g. first class vs. priority)
‐ Production phase (e.g. letter vs. flat – they do not go through the same inserting/sorting/printing machines)
‐ Addressee (addressed vs. unaddressed mail)
‐ Geographical differences (standard mail in the U.S. is different from standard mail in Europe).
Many additional differences could be listed that illustrate the complexity of defining a single functional unit for the system.
Consequently, to be representative of the “mailing industry” as a whole, the functional unit should be representative of the various types of mail and geographical areas involved. Thus, the system chosen for the definition of the functional unit is not a “letter,” but a “mail piece” and it should be normalized to a standard weight basis, as described below.
2.3.2 FUNCTIONAL UNIT
The selected functional unit should be consistent with the goal and scope of this study. It must provide a reference to which the input and output data can be normalized. The flows that measure the outputs of life cycle steps require fulfilling the function expressed by the functional unit:
The functional unit will be 1 gram of a delivered mail piece.
This functional unit was commonly accepted since it can be scaled to any type of mail piece (independently of its type), and thus gives the system more flexibility, and more usability.
2.4 SELECTION OF RELEVANT LIFE CYCLE INVENTORY ASSESSMENT METHODOLOGY AND TYPES OF
IMPACTS
A standard state‐of‐the‐practice of life cycle impact assessment includes a comprehensive set of environmental impact categories (Energy, Climate change, Eutrophication, Acidification, Ozone depletion). The typical indicators related to these impact categories are: Primary Energy Demand,

30
Global Warming Potential, Eutrophication Potential, Acidification Potential, and Photochemical Oxidant Potential (smog formation potential). The details of each impact category are shown in Table 2.
Table 2. Life Cycle Impact Assessment categories, indicators of contribution to environmental issues, units of measure, & brief descriptions
Impact Category (issue)
Indicator Description Unit Reference
Energy Use Primary Energy Demand (PED)
A measure of the total amount of primary energy extracted from the earth. PED is expressed in energy demand from non‐renewable resources (e.g. petroleum, natural gas, etc.) and energy demand from renewable resources (e.g. hydropower, wind energy, solar, etc.). Efficiencies in energy conversion (e.g. power, heat, steam, etc.) are taken into account.
MJ
An operational guide to the ISO‐standards (Guinée et al.) Centre for Milieukunde (CML), Leiden 2001.
Climate Change Global Warming Potential (GWP)
A measure of greenhouse gas emissions, such as CO2 and methane. These emissions are causing an increase in the absorption of radiation emitted by the earth, magnifying the natural greenhouse effect.
kg CO2 equivalent
Intergovernmental Panel on Climate Change (IPCC). 2006 IPCC Guidelines for National Greenhouse Gas Inventories. 2006.
Eutrophication Eutrophication Potential (EP)
A measure of emissions that cause eutrophying effects to the environment. The eutrophication potential is a stoichiometric procedure, which identifies the equivalence between N and P for both terrestrial and aquatic systems.
kg Nitrogen equivalent
An operational guide to the ISO‐standards (Guinée et al.) Centre for Milieukunde (CML), Leiden 2001.
Bare et al., TRACI: the Tool for the Reduction and Assessment of Chemical and Other Environmental Impacts JIE, MIT Press, 2002.

31
Acidification Acidification Potential (AP)
A measure of emissions that cause acidifying effects to the environment. The acidification potential is assigned by relating the existing S‐, N‐, and halogen atoms to the molecular weight.
kg SO2 equivalent
kg H+ equivalent
An operational guide to the ISO‐standards (Guinée et al.) Centre for Milieukunde (CML), Leiden 2001.
Bare et al., TRACI: the Tool for the Reduction and Assessment of Chemical and Other Environmental Impacts JIE, MIT Press 2002.
Ozone creation in troposphere
Photo chemical Oxidant Potential (POCP)/ Smog Potential
A measure of emissions of precursors that contribute to low level smog, produced by the reaction of nitrogen oxides and VOCs under the influence of UV light.
kg Ethene‐equivalent
g NOx equivalent
An operational guide to the ISO‐standards (Guinée et al.) Centre for Milieukunde (CML), Leiden 2001.
Bare et al., TRACI: the Tool for the Reduction and Assessment of Chemical and Other Environmental Impacts JIE, MIT Press 2002.
While there are other impacts categories (e.g., eco‐toxicity) which could be included, those identified above are the most internationally recognized and recorded.

32
3 METHODOLOGICAL CONSIDERATIONS
3.1 FROM THE FLOW CHART TO A MODELING PHASE
The model is constructed according to the flow charts presented in Figure 1 to 5. The model can be adjusted depending on the format of the data provided. Each block in the flow chart is created in GaBi 4, and then populated with industry data from the data providers. These data include all relevant material flows (raw materials, operating materials, products, etc.), all relevant energy flows (electricity, thermal energy, fuel consumption, etc.), and all relevant emissions.
3.1.1 SOFTWARE AND DATABASE
The LCA model uses the GaBi 4 Software system. GaBi 4 is a dedicated software package to model product systems and carry out Life Cycle Assessments. The GaBi Life Cycle Information (LCI) database provides a large amount of inventory data for several of the raw and process materials as well as for energy sources. If no suitable life cycle information from independent sources is available on materials and processes, data from the GaBi LCI database can be used.
The software quantifies the environmental impacts of the mailing products based on the selected functional unit. After the LCA model is established in GaBi, as has been done with this study, it is possible to adjust the model to accommodate changes in technology and evaluate improvements in the specific business processes or in the mailing industry as a whole.
3.1.2 OVERVIEW OF THE MODEL
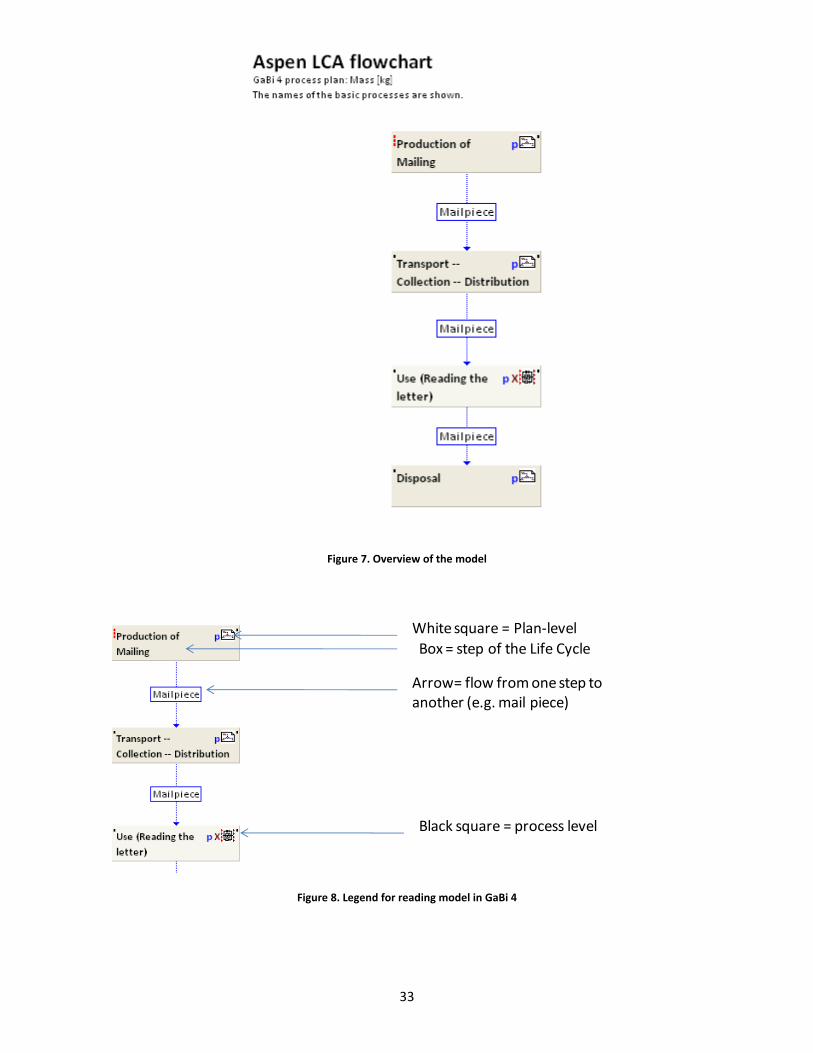
The following figure (figure 7) gives an overview of the model; each part is detailed in the Appendix section “Detailed description of a model.“
The model follows the flow charts presented in Section 2. Figure 8 gives guidance for reading the model in GaBi 4. Each step of the life cycle is modeled in a grey box. There are two types of grey boxes: the plan‐level and the process‐level. The plan‐level means there is a more detailed plan supporting the box (e.g. production of mail is a “plan‐level” and is more detailed in subsequent sections), and the process‐level is the most simple level (e.g. the use has just one input and one output, and does not need to be more detailed). The arrows are “flows” that link the processes to each other (e.g. the mail piece from production to transport).
33
Figure 7. Overview of the model
White square = Plan‐levelBox = step of the Life Cycle
Arrow= flow from one step to another (e.g. mail piece)
Black square = process level
Figure 8. Legend for reading model in GaBi 4

34
PRODUCTION OF MAIL
The production of paper and the production of envelopes are two separate processes, categorized in the “production of mail“ step, in which the mass of the envelope and paper inside the envelope are parameterized4 and can be fixed to a desired weight. The user can decide what type of mail he/she wants to create: flat mail or letter mail. Once the mail piece is created, it goes through the appropriate stream (flat/letter) for the inserting phase and in‐house postage printing. After the postage printing phase, the mail piece is transported (or drop shipped) to the Post facility.
The model for the production of mail is described in 9 and 10. For more details, please go to Appendix “detailed description of the model.“
4 There are two ways to build a model. The first one is the static way (values are hard coded in the model). The second one is to “parameterize” the system, which means using variables that can be fixed with flexibility by the user, to track changes over time or analyze different scenarios, (e.g. parameters may allow for weight of paper, geographic distances traveled, etc.).

Page 35 of 68
Figure 9. Model for Production of Mail (part 1)

Page 36 of 68
Figure 10. Model for Production of Mail (part 2)

Page 37 of 68
TRANSPORTATION, COLLECTION AND DISTRIBUTION PHASE
This step of the life cycle demonstrates that after the “production” of the main piece, it is “packaged” (plastic strapping, shrink wrap, pallet, etc.), and then transported to the post center, where it is sorted and treated. After the post, it is transported again and delivered.
The transportation phase should also be parameterized, so that the user can choose through which country the mail piece travels ‐ see Figure . The secondary packaging is detailed in Figure, and the transport is detailed in Figure and Figure.
Figure 11. Model for Transportation, Operations and Distribution
For each country, the mail piece travels through “an average path” or average distance for each means of transportation. The initial data provided by Aspen participants included:
‐ Total production of mail per year for the company (weight), and
‐ Total distance travelled for the year through each mode of transport (rail, different types of trucks, airplane, etc.).
The details for the calculations and specific country examples are shown in the Appendix “Detailed description of a model.” Details for secondary packaging also appear in the Appendix.
USE PHASE
The Use phase is considered to have no impact. It is conceptualized in the model to fix the functional unit. Also, it should be noted that the functional unit is parameterized and can be adjusted for subsequent modeling.
Page 38 of 68
END OF LIFE
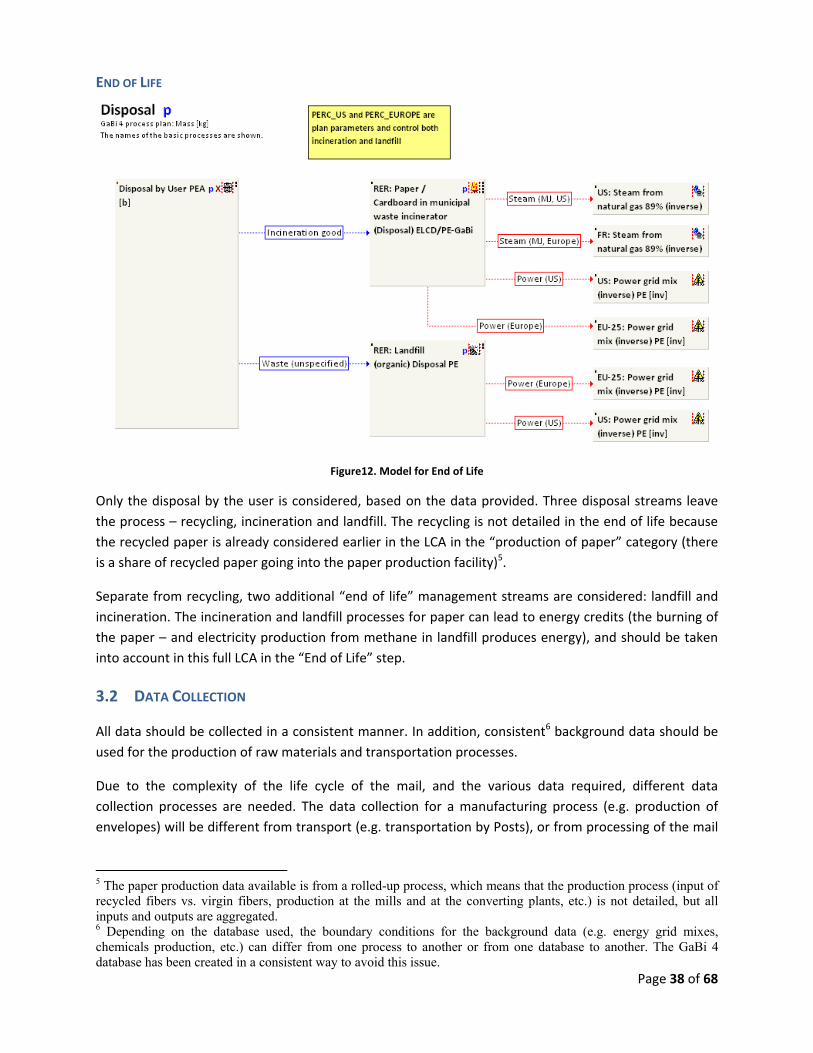
Figure12. Model for End of Life
Only the disposal by the user is considered, based on the data provided. Three disposal streams leave the process – recycling, incineration and landfill. The recycling is not detailed in the end of life because the recycled paper is already considered earlier in the LCA in the “production of paper” category (there is a share of recycled paper going into the paper production facility)5.
Separate from recycling, two additional “end of life” management streams are considered: landfill and incineration. The incineration and landfill processes for paper can lead to energy credits (the burning of the paper – and electricity production from methane in landfill produces energy), and should be taken into account in this full LCA in the “End of Life” step.
3.2 DATA COLLECTION
All data should be collected in a consistent manner. In addition, consistent6 background data should be used for the production of raw materials and transportation processes.
Due to the complexity of the life cycle of the mail, and the various data required, different data collection processes are needed. The data collection for a manufacturing process (e.g. production of envelopes) will be different from transport (e.g. transportation by Posts), or from processing of the mail
5 The paper production data available is from a rolled-up process, which means that the production process (input of recycled fibers vs. virgin fibers, production at the mills and at the converting plants, etc.) is not detailed, but all inputs and outputs are aggregated. 6 Depending on the database used, the boundary conditions for the background data (e.g. energy grid mixes, chemicals production, etc.) can differ from one process to another or from one database to another. The GaBi 4 database has been created in a consistent way to avoid this issue.

Page 39 of 68
(e.g. printing process with materials use and energy use). Table 3 describes the different types of data needed for each step of the life cycle for the mailing industry model.
Table 3. Description of data requirements
Type of Process Description of Data Requirements
MANUFACTURING For each sub-process of the manufacturing: Inputs: - Energy consumption (power and thermal energy) - Raw materials (water, chemicals, solvents, etc.) Outputs: - Products - By-products - Emissions (to air, water, soil) UNITS Energy: MJ, kWh, etc. per kg (or lb) of mail Materials: kg (or lb) per kg (or lb) of mail
TRANSPORT - Type of truck (class, weight, fuel, etc.) - Other modes of transportation? Rail, etc. - Average distance traveled - Payload (weight of mail transported) - Fuel economy if available UNITS Distance: km (or mile), payload: (kg or ton)
MATERIAL USE/ MACHINE USE
- Energy required for the use of the machine, per weight of mail - Materials used during the use of the machine, per weight of mail (ink, plates, etc.) - Use of materials (plastic wrap, etc.) per weight of mail UNITS Energy: MJ, kWh, etc. per kg (or lb) of mail Materials: kg (or lb) per kg (or lb) of mail
DISPOSAL/ RECYCLING
- Amount of paper sent to disposal (incineration, landfill, etc.) per weight of mail - Amount of paper recycled UNITS - kg (or lb) of paper sent to disposal/recycling per kg (or lb) of mail or - percentage of paper going to recycling vs. landfill vs. incineration

Page 40 of 68
3.2.1 METHODOLOGY FOR DATA COLLECTION
For each phase of the Life Cycle of the mail, key data and potential data providers are identified. PE Americas as owners of GaBi are also identified as sources.
‐ PRODUCTION PHASE
The main phases of data collection for the production of mail are detailed in Table 4.
Table 4. Data Collection methodology for Production phase
PRODUCTION PHASE
Data to collect
PLAN/CREATE Creation of mail DATA Mailing lists management FORESTRY Forest management
Paper production Pulp production ENVELOPES Manufacturing INK Offset Flexography Digital Gravure FILM Polystyrene (PS) Polylactic acid (PLA) Polyethylene (PE) ADHEASIVES Seal Flap Seam Window PRINT PROCESS Offset Flexography Digital (inkjet / toner) Gravure FINISHING, BINDING, ADDRESSING
Finishing, Inserting, Postage printing
DISTRIBUTION drop ship

Page 41 of 68
‐ TRANSPORTATION, OPERATIONS AND DISTRIBUTION
The main phases of data collection for transport are detailed in Table 5.
Table 5. Data collection methodology for Transportation phase
TRANSPORTATION PHASE
Data to collect
SECONDARY PACKAGING
12 pt fiberboard
shrink wrap IPE Plastic Strapping Pallet plastic/wood TRANSPORT transport to and from
operations centers SORT AND TRANSPORT Machine sorting COLLECT AND DELIVERY
Transportation by Post to the customer
‐ USE PHASE
For the use phase, there is no data to collect. See Table 6. Recall this is a process level portion of the analysis.
Table 6. Data collection methodology for Use phase
USE PHASE Data to collect READING letter / flat No data to collect
‐ END OF LIFE
The data collection methodology for the disposal is detailed in Table 7.
Table 7. Data collection methodology for Disposal phase
DISPOSAL PHASE Data to collect
BY USER Recycling of paper Incineration Landfill BY POST Recycling of paper incineration landfill TRANSPORT transport to and from operations
centers

Page 42 of 68
3.2.2 BACKGROUND DATA
In instances when primary data cannot be collected, data may be available from the GaBi 4 database. All the background data for energy, fuels and upstream raw materials are available from the GaBi database7.
‐ FUELS AND ENERGY
National averages for fuel inputs and electricity grid mixes are available in the GaBi 4 database. Datasets on average mixes for fuels (e.g. natural gas, diesel, heavy fuel oil and petroleum coke) and electricity should be used for the study to be representative of an average for a region. The study should differentiate grid mixes by regional areas (U.S., Canada and Europe) when applicable.
‐ RAW AND PROCESS MATERIALS
Primary data for the production of adhesives should be collected, as well as for the production of ink. Data for all other upstream raw materials (plastics, paper, etc.) can obtained from the GaBi 4 database 2006.
7 Documentation on GaBi 4 database can be found at http://documentation.gabi-software.com/.

Page 43 of 68
4 CHALLENGES AND SOME TIPS ON APPROACH
The mailing industry is complex and offers challenges in conducting an LCA. The following section characterizes these challenges, identifies ways to overcome them and gives some tips on approaching the analysis.
4.1 IDENTIFYING THE KEY VALUE CHAIN STAGES AND INDUSTRY PLAYERS: THE DIVERSITY OF THE MAILING SYSTEM
The previous sections that describe the Life Cycle of a mail piece outline the complexity of the system. From the raw materials production, through production and transport, numerous players have a key role in the value chain. The mailing system gathers very different industries, which vary from forest management, to mail transportation, to the chemical industry, the printing industry, the mail machines production, and so forth. The challenge for such a wide range of stakeholders is to gather all components of the value chain and engage their stakeholders in a common sustainability commitment.
Another challenging aspect of the study is its geographic scope. The intent of this study is to be representative of North America and Europe. However, the key stakeholders on one continent are not the same on the other. For instance, in Europe, each country has its own post. Thus, it is difficult to arrive at a number that is representative of the European post system as a whole. The same challenges occur within each main step of the Life Cycle.
The Aspen Institute Initiative designed, at the highest level of detail possible, the exact life cycle of the mail, through flow charts, to identify all possible stakeholders at each stage. Then, the group created a matrix of Life Cycle phases and sub‐phases, linking each sub‐phase to one or several specific players (see flow charts presented in Figures 1 to 5). In future efforts, researchers should consider working closely in collaboration with industry associations, since they are likely to gather “industry representative” data.
4.2 SOLICITING AND OBTAINING DATA
Following the defined goal and scope and sound methodology, the next challenge is data. Obtaining primary data from the companies is crucial. The LCA cannot be completed with the appropriate level of quality if there are gaps in the data collection, leading to uncertainties about the results. However, experience shows that obtaining the data is a challenging task. Companies’ main concerns include confidentiality and spending a significant amount of time on data gathering.
Confidentiality agreements can protect the source and integrity of the data. Since a specific company’s data is combined with other providers’ data and then aggregated at a whole “phase” level, the process is intended to prevent revealing a company’s specific numbers and their potential environmental impact.
Data collection can be made easier if the data provider understands the exact needs in terms of data for the LCA study (see section 3.2 on data collection and requirements). Often the company has already gathered the necessary data, either for another similar study, or an internal environmental assessment, or in a different department (e.g. accounting team, engineers, etc.).

Page 44 of 68
4.3 ENSURING CONSISTENT DATA QUALITY AND REPRESENTATIVENESS OF THE DATA
The next step is to make sure the data is representative and consistent.
Representativeness is important to ensure accuracy, and reduce uncertainty. To make the data representative, data providers must include the key companies of an industry sector. To be sure the study captures data that is “representative enough,” cut‐off criteria should be proposed. For example, the data is representative of the industry if the data providers represent x% of the combined market share for the product. In the context of the study we need to make sure that the geographic coverage (U.S. and Europe) is large enough to ensure the quality of the data and its representativeness.
When there are multiple data providers there is a need for collecting the data in a consistent way to ensure the quality of the results. The challenge with consistency is that companies gather raw data in different ways or have access to different information. For instance the Posts do not gather data the same way regarding transportation modes (aggregated data vs. non aggregated data), or a production process could differ from one company to another. The LCA should ensure the linkage between the raw data gathered by each company and the data needs for the study. In addition, there should be a quality check for each data set received, to make sure the data complies with public documentation (e.g. Best Available Technologies (BAT), U.S. EPA, etc.) and with each other (see section 2.2.3, § data quality).
4.4 IDENTIFYING THE CRITICAL REVIEW PANEL
Participants agreed that the study should follow the ISO LCA standards and undergo a critical review. The ISO standard recommends that a critical review be completed by an independent expert in LCA. With potential business and policy implications for multiple industries and the public, all parties should have the benefit of a critical review panel (CRP).
The CRP is generally composed of at least three members: a Chair (knowledgeable about LCA and the industry field), and two members (one knowledgeable about LCA, and the other about the industry field). However, in the mailing ecology, there is not one industry but a wide panel of industries interacting with each other. It is recommended that the Chair be someone familiar with LCA, with additional members including one individual familiar with Postal operations, one representing the environmental community, and additional reviewers to include representatives from the mail production and end of life production.
The review by the Critical Review Panel should contain three stages8:
Stage 1: Review of the Study Purpose, Boundaries, and Data Categories ‐ Goal of Stage 1:
• Ensure purpose and goal of study is clearly defined,
• Ensure that all necessary data categories (inventory and impact) are identified to meet the goal,
• Understand how results will be used,
8 This procedure is based upon the paper by Fava and Pomper published in the Journal of LCA.

Page 45 of 68
• Ensure that the study meets quality requirements.
Stage 2: Mid‐project review at point of LCI completion ‐ Goal of Stage 2:
• Ensure recommendations of Stage 1 are addressed,
• Verify adequacy of data collection and model,
• Ensure that data quality meets quality requirements.
Stage 3: Review of the Draft Final Report ‐ Goal of Stage 3:
• Ensure feedback of Stage 2 is addressed,
• Confirm that the observations and conclusions from the study are consistent with the stated purpose,
• Ensure overall study quality and that the study meets the data quality specifications that are relevant to the stated purpose.
A successful implementation of a CRP would include the following steps:
Stage 1: Review of the Study Purpose, Boundaries, and Data Categories
1. Convene brief teleconference with reviewers to make introductions and determine a Chairperson of Technical Review Committee (who will be the primary communication point);
2. Web presentation of goal and scope (G&S) to reviewers; feedback from panel;
3. Incorporate reviewer feedback into G&S; distribute Final G&S to panel.
Stage 2: Mid‐project review at point of LCI completion
1. Presentation/ discussion of LCI model with panel;
2. Panel discusses potential revisions/adjustments to LCI model and communicates feedback;
3. Incorporate feedback into revised LCI model.
Stage 3: Review of the Draft Final Report
1. Preparation of draft Final Report and web conference to present results/report to reviewers; feedback from panel;
2. Incorporate feedback into revised Draft Final Report and distribute by email to all reviewers for final comment;
3. Incorporate final comments and prepare Final Report for presentation.

Page 46 of 68
5 RECOMMENDATIONS AND NEXT STEPS
The Aspen team made considerable progress in defining the international mailing system, identifying key players along the value stream, describing the data needs and life cycle model at each stage of the mailing life cycle, and discussing the challenges faced throughout this effort. The information in this report lays a solid foundation for possible next steps. There are a several options to complete the study. One option is to complete the LCA study, defined by the Aspen Initiative and reported in this document, describing the environmental impacts of paper in the mail, in a fashion to ensure conformity with the ISO 14040/44 compliant report.
A second option is to create a tool for individualized environmental evaluation, such as an “i‐report.”
A third option is to complete a comparison of delivery of information through the current mailing systems with alternative systems such as electronic mail. Each of these options is described below.
5.1 FULL ISO COMPLIANT LCA REPORT
One of the next steps envisioned for this project is the creation of a full ISO 14040 compliant report. The ISO compliant report enables the stakeholders to publish the results of the study.
The procedure for Goal & Scope, data collection and modeling are similar to what has been described in this report. Two phases are necessary to get from the current status of the project to the full ISO compliant report: completion of the data collection to fill the current data gaps, and the review by a designated Critical Review Panel (see section 4.4 for a description of the review process). The report should follow the requirements outlined in the ISO 14040/44 standards and include the following elements as stated in ISO 14044:
1. General aspects: a. Entity commissioning the LCA , practitioner of LCA (internal or external); b. Date of report (completion of the study); c. Statement that the study has been conducted according to the requirements of this
International Standard.
2. Goal of the study: a. Reasons for carrying out the study; b. Intended applications; c. Target audiences; d. Statement whether the study intends to support comparative assertions intended to be
disclosed to the public.
Page 47 of 68
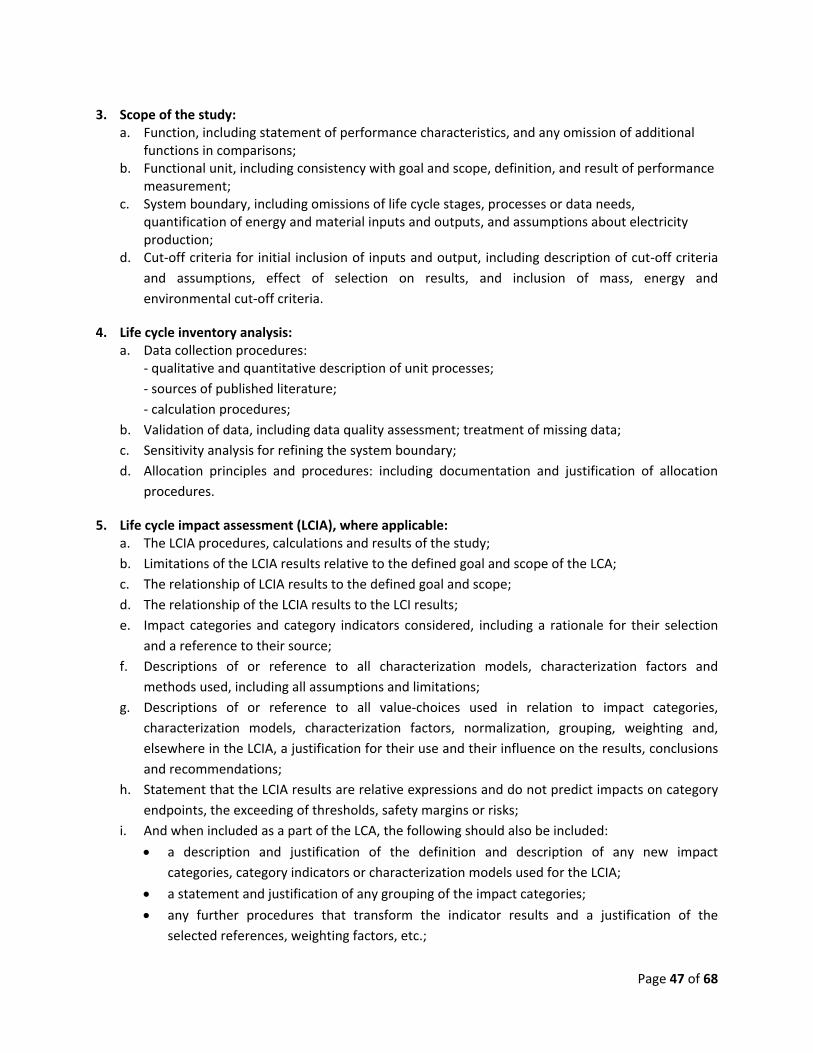
3. Scope of the study: a. Function, including statement of performance characteristics, and any omission of additional
functions in comparisons; b. Functional unit, including consistency with goal and scope, definition, and result of performance
measurement; c. System boundary, including omissions of life cycle stages, processes or data needs,
quantification of energy and material inputs and outputs, and assumptions about electricity production;
d. Cut‐off criteria for initial inclusion of inputs and output, including description of cut‐off criteria and assumptions, effect of selection on results, and inclusion of mass, energy and environmental cut‐off criteria.
4. Life cycle inventory analysis: a. Data collection procedures:
‐ qualitative and quantitative description of unit processes; ‐ sources of published literature; ‐ calculation procedures;
b. Validation of data, including data quality assessment; treatment of missing data; c. Sensitivity analysis for refining the system boundary; d. Allocation principles and procedures: including documentation and justification of allocation
procedures.
5. Life cycle impact assessment (LCIA), where applicable: a. The LCIA procedures, calculations and results of the study; b. Limitations of the LCIA results relative to the defined goal and scope of the LCA; c. The relationship of LCIA results to the defined goal and scope; d. The relationship of the LCIA results to the LCI results; e. Impact categories and category indicators considered, including a rationale for their selection
and a reference to their source; f. Descriptions of or reference to all characterization models, characterization factors and
methods used, including all assumptions and limitations; g. Descriptions of or reference to all value‐choices used in relation to impact categories,
characterization models, characterization factors, normalization, grouping, weighting and, elsewhere in the LCIA, a justification for their use and their influence on the results, conclusions and recommendations;
h. Statement that the LCIA results are relative expressions and do not predict impacts on category endpoints, the exceeding of thresholds, safety margins or risks;
i. And when included as a part of the LCA, the following should also be included:
• a description and justification of the definition and description of any new impact categories, category indicators or characterization models used for the LCIA;
• a statement and justification of any grouping of the impact categories;
• any further procedures that transform the indicator results and a justification of the selected references, weighting factors, etc.;

Page 48 of 68
• any analysis of the indicator results, for example sensitivity and uncertainty analysis or the use of environmental data, including any implication for the results;
• data and indicator results reached prior to any normalization, grouping or weighting shall be made available together with the normalized, grouped or weighted results.
6. Life cycle interpretation: a. The results:
• assumptions and limitations associated with the interpretation of results, both methodology and data related;
• data quality assessment;
• full transparency in terms of value‐choices, rationales and expert judgments. b. Critical review, where applicable:
• name and affiliation of reviewers;
• critical review reports;
• responses to recommendations.
5.2 COMPLEMENTARY TOOL: THE I‐REPORT FOR CUSTOMIZED ASSESSMENT
The i‐report is a complementary tool that aims at helping companies assess the environmental impact of their business decisions. In this instance, it assesses the environmental impact of a specific mail piece. The GaBi i‐report is a powerful feature for creating interactive reports fusing GaBi compiled results. It simplifies the external and internal communication of LCA results, and enables companies to perform customized “what if” scenarios both within their business processes and along the value chain.
Thus, another next step envisioned during the project is the completion of the i‐report tool to make it usable by all interested companies and customized to their needs.
Since the model is completely parameterized, or segmented, the i‐report enables the user to fix the parameters that best apply to a specific situation: e.g., weight of a specific mail piece (weight of envelope, weight of paper inside), geographical area (U.S. or Europe), printing process used, etc. Moreover, the i‐report enables the user to compare different scenarios, thus supporting the decision making process.
As described below in Figure 13, the i‐report comprises two sections:
‐ Parameters: the section on the left where the parameters for each scenario (e.g. Strategy A,
Strategy B) can be fixed. In the upper left side the scaling factor can be fixed (e.g. impact of 1 gram of mail or 5 tons). In the lower section, the parameters for region, weight of mail, etc. can be fixed.
‐ Environmental Impacts: in the section on the right the environmental impacts are calculated instantaneously and shown in tables and graphs.

Page 49 of 68
Figure 13. Overview of the i‐report
Figure 14, shown below, details how the i‐report is connected to the model. Each time the user adjusts a parameter in the i‐report, it recalculates all environmental impacts automatically and shows it in the “report” section.
Figure 14. How does an i‐report work?

Page 50 of 68
The lower left section is more detailed in the screen shot below (Figure 15) and the description is given in Table 8.
Table 8. Description of potential parameters in an i‐report
i-report parameter section Capabilities
Production of mailing Choose the geographical area
Paper production Choose the type of paper used
Envelope paper Chose the type of paper for the envelope
Transport – facilities operations Choose the geographical area for transport
Disposal Choose the geographical area
Choose % for recycling vs. landfill vs. incineration
Production of letter Choose the weight of the envelope and paper inside the envelope
Production of flat Choose the weight of the envelope and paper inside the envelope
Printing Choose the printing process used
Reduction factors Choose a % of reduction of energy used for the facility – and/or for the fuel consumption of the trucks

Page 51 of 68
Figure 15. Example of parameters in i‐report
5.3 COMPARISON STUDY
A third option is to complete a comparison between delivery systems, such as the delivery of information via the current mail stream versus other various options such as electronic mail.
Such a study allows answers to questions people are trying to answer in a century where digitally delivered information becomes the fastest and most common way to communicate. Is communication through the Internet more beneficial for the environment? Or is the energy involved for running servers all over the world more than the energy used all through the value chain of paper mail? Such a study could perhaps help find trade‐offs among competing mailing systems.

Page 52 of 68
Within the ISO LCA framework, this type of study is referred to as a comparative assertion.
Users of LCA results are sometimes interested in making an environmental claim regarding the superiority or equivalence of their product versus a competing product that performs the same function. The LCA standards have been written in a fashion to ensure flexibility in use of the standards within an organization; whether that application may be to help focus research, or for other internal prioritization. However, when the ISO 14040 series is used to support an environmental claim regarding the superiority or equivalence of one product versus a competing product that performs the same function (i.e., comparative assertion), and that information is disclosed to the public, additional requirements must be met. For example,
• The boundaries of the system have to be defined clearly and similarly. The comparative systems may have such different elements that finding a common scheme may be challenging.
• The data quality requirements should address: time‐related coverage, geographical coverage, technology coverage, precision, completeness and representativeness of the data, consistency and reproducibility of the methods used throughout the LCA, sources of the data and their representativeness, and uncertainty of the information.
• The LCA study should be peer reviewed in accordance with the critical review process. • An impact assessment should be performed and the category indicators of the impact
assessment used to support the comparative assertion shall be: sufficiently comprehensive, internationally accepted, scientifically and technically valid, and environmentally relevant. Weighting shall not be used.
• Systems should be compared using the same functional unit and equivalent methodological considerations, such as performance, system boundaries, data quality, allocation procedures, decision rules on evaluating inputs and outputs and impact assessment. Any differences between systems regarding these parameters shall be identified and reported. For example, one gram of delivered mail piece is a physical flow which can be modeled. What is the functional unit for electronic delivery of information? How reliable would this functional unit be? Is it tractable physically in an LCA?
• Gathering stakeholders is the final challenge. This mailing industry LCA study shows the complexity of the paper mailing value chain itself. Adding stakeholders from the electronics industry and the web‐based information industry, makes it is even more challenging. Both parties should be represented.
Additional information on how LCA results can be used to make claims can be found in ISO 14025. Moreover, within the U.S., the Federal Trade Commission (FTC) has developed Guides for the Use of Environmental Marketing Claims, which prohibits unfair or deceptive advertising claims.

Page 53 of 68
REFERENCES
• ISO 14040‐ Environmental management‐ Life cycle assessment‐ Principles and framework‐ 2006 • ISO 14044‐ Environmental management — Life cycle assessment —Requirements and guidelines –
2006 • ISO 14047 Environmental management ‐‐ Life cycle impact assessment ‐‐ Examples of application of
ISO 14042 • ISO 14049 Environmental management ‐‐ Life cycle assessment ‐‐ Examples of application of ISO
14041 to goal and scope definition and inventory analysis • EPA http://www.epa.gov/nrmrl/std/sab/traci/ • Documentation of GaBi 4 database: http://documentation.gabi‐software.com/ • An operational guide to the ISO‐standards (Guinée et al.) Centre for Milieukunde (CML), Leiden
2001. • Intergovernmental Panel on Climate Change (IPCC). 2006 IPCC Guidelines for National Greenhouse
Gas Inventories. 2006. An operational guide to the ISO‐standards (Guinée et al.) Centre for Milieukunde (CML), Leiden 2001.
• Bare et al., TRACI: the Tool for the Reduction and Assessment of Chemical and Other Environmental Impacts JIE, MIT Press, 2002. An operational guide to the ISO‐standards (Guinée et al.) Centre for Milieukunde (CML), Leiden 2001.
• The Environmental Impacts of the Mail: Initial Life Cycle Inventory Model and Analysis. Environmental Policy and Programs U.S. Postal Service, Washington, DC. June 2008.

Page 54 of 68

Page 55 of 68
APPENDIX A. DETAILED DESCRIPTION OF THE LIFE CYCLE OF MAIL
Production of Mail
Paper Production
Envelope Production
Chemicals production
Manufacturing
Mail Design
Printing
Ink production
Printing process
Inserting
Postage Printing
Paperproduction
Forestry
Pulpproduction
Paperproduction
Mail Design
Creation/design
Data management
Printing
Ink production
• Offset• Flexography• Digital• Gravure
Printing process
• Offset• Flexography• Digital• Gravure
Envelopeproduction
Seal/windowchemicals
production
Manufacturing
Inserting / Postage Printing
For flats
For letters
Figure16. Detailed life cycle for production of mail

Page 56 of 68
Transport
Transport fromproduction facility to
Post
Transport by Posts(from Post to
consumer)
Transport mean 1
Transport mean 2
Transport mean n
Facilities operations
Heating, lighting, etc.
Sorting
Transport fromproduction
facility to Post
Drop ship
SecondaryPackaging
12 pt fiberboard
Plastic Strapping
shrink wrap
Pallet plastic/wood
Facilityoperations
Building consumption
(Heating, water, etc.)
Machines consumption(sorting, etc.)
Transport by Post
By road
By rail
By plane
Figure 17. Detailed life cycle for transport (collection, operations and delivery) of mail

Page 57 of 68
End of Life
Recycling
Landfilling
Incineration
Energy credit
Energy credit
Transport fromconsumer to
disposal
Transport by truck
Disposal by User
Recycling
Landfill
Incineration
Archive
Disposal by Post
Recycling
Landfill
Incineration
Figure 7. Detailed life cycle for End of Life
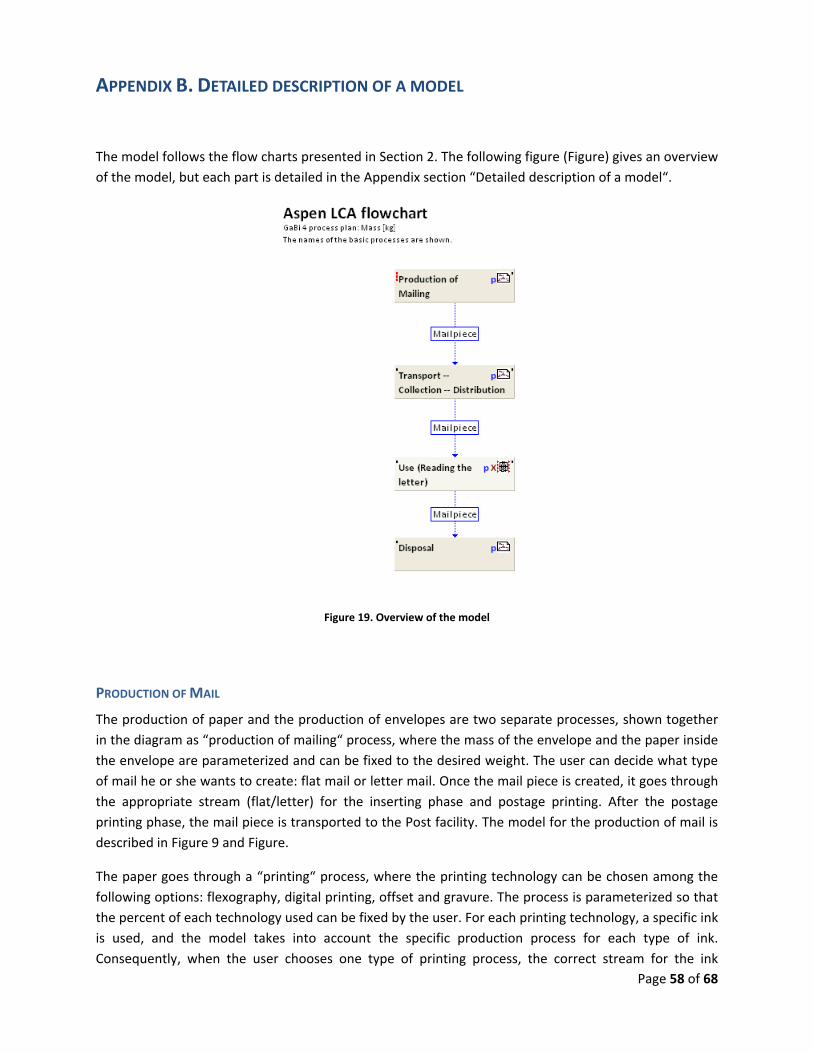
Page 58 of 68
APPENDIX B. DETAILED DESCRIPTION OF A MODEL
The model follows the flow charts presented in Section 2. The following figure (Figure) gives an overview of the model, but each part is detailed in the Appendix section “Detailed description of a model“.
Figure 19. Overview of the model
PRODUCTION OF MAIL
The production of paper and the production of envelopes are two separate processes, shown together in the diagram as “production of mailing“ process, where the mass of the envelope and the paper inside the envelope are parameterized and can be fixed to the desired weight. The user can decide what type of mail he or she wants to create: flat mail or letter mail. Once the mail piece is created, it goes through the appropriate stream (flat/letter) for the inserting phase and postage printing. After the postage printing phase, the mail piece is transported to the Post facility. The model for the production of mail is described in Figure 9 and Figure.
The paper goes through a “printing“ process, where the printing technology can be chosen among the following options: flexography, digital printing, offset and gravure. The process is parameterized so that the percent of each technology used can be fixed by the user. For each printing technology, a specific ink is used, and the model takes into account the specific production process for each type of ink. Consequently, when the user chooses one type of printing process, the correct stream for the ink

Page 59 of 68
production process is used. Moreover, the gird mix (electricity use) can be adjusted to the appropriate country (U.S. or European).The model for printing is described in Figure.
The Inserting phase and Postage printing are mail‐specific (letter/flat), where the energy use per mail piece will vary. Again, the regional gird mix is parameterized and can be adjusted. The inserting‐postage printing phase is described in Figure.

Page 60 of 68
Figure 20. Model for Production of Mail (part 1)

Page 61 of 68
Figure 21. Model for Production of Mail (part 2)
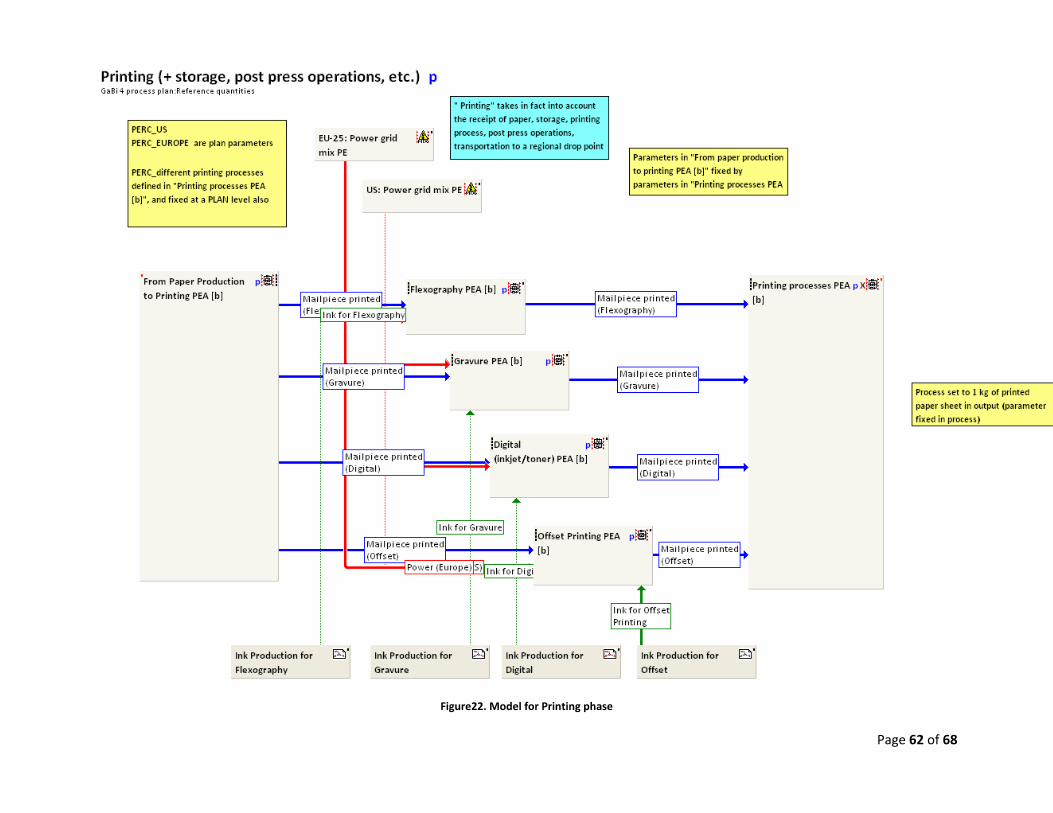
Page 62 of 68
Figure22. Model for Printing phase

Page 63 of 68
Figure 23. Model for Inserting and Postage printing

Page 64 of 68
TRANSPORTATION, OPERATIONS AND DISTRIBUTION
The transportation phase is parameterized as well, so that the user can chose through which country the mail piece travels. See Figure.
Figure 23. Model for Transportation phase
For each country, the mail piece travels through “an average path” (average distance for each means of transportation). Data was provided by the participants in the following format:
‐ Total production of mail per year
‐ Total distance travelled for the year through each mode of transport
The “average” distance was calculated in the following way:
tripsofnumberdistaveragedisttotal ×=
rationutilizatiopayloadmasstotaltripsofnumber
×=
masstotalrationutilizatiopayloaddisttotaldistAverage ××
=
Total dist is the total distance travelled.
Average dist is the average distance travelled, used in the model.

Page 65 of 68
Total mass is the annual mass of mail transported by the Post.
Payload is the payload of the mode of transportation (e.g. truck – 45,000 lbs).
Utilization ratio is the utilization of the mode of transport, e.g. the truck is not full but is assumed to be full at 80% ‐‐ 80% is the utilization ratio.
Number of trips is the total number of trips, that are necessary to transport the annual production of mail.
An Example of Transportation models is showed below for Canada (Figure):
For other countries for which we have information, there are different streams according to the type of mail (letter, flat, periodicals, etc).
The example below shows the “average path“ of the mail for aggregated mail types.
In the transportation phase, there is also “secondary packaging“ which is included. This phase describes all the packaging used for processing of the mail piece: Shrink wrap, poly wrap, plastic strapping, and pallets. Also, for additional energy, such as in shrink wrap when a special machine is used, the regional grid mix can be adjusted. The “secondary packaging“ model is showed in Figure.

Page 66 of 68
Figure 25. Model for Transportation by the post in Canada

Page 67 of 68
Figure 26. Model for Secondary packaging

Page 68 of 68
USE PHASE
The Use phase is considered to have no impact. It is used in the model to fix the functional unit, which is parameterized.
END OF LIFE
Figure 27. Model for End of Life
Only the disposal by the user is considered. Three streams go out of the process – recycling, incineration and landfill. The recycling is not detailed in the end of life since the “recycled” paper is already considered in the production of paper (there is a share of recycled paper going into the paper production facility – not detailed in this model, the paper production is a rolled‐up process).
The incineration and landfill processes for paper are associated with energy credits (the burning of the paper – and electricity production from methane in landfill) produces energy, and is taken into account in this full LCA.
###