fracture liaison service database annual report …...is an enviable achievement. the number of...
TRANSCRIPT
Fracture Liaison Service DatabaseAnnual report December 2018 Achieving effective service delivery by Fracture Liaison ServicesData from January to December 2017
In association with: Commissioned by:

Key messages – report at a glanceA fracture liaison service (FLS) aims to reduce the risk of subsequent fractures by systematically identifying, assessing, treating and referring to appropriate services all eligible patients aged 50 and over who have suffered a fragility fracture.
Demographics and data completenessWe congratulate the achievement of the 55 FLSs* across England and Wales that submitted data which contributed towards this report.
53%of FLSs had good levels of data completeness, defined as fewer than five fields (out of 17) with more than 20% missing data.
52,731patient records
were included in 2017, an increase from 42,589 in 2016.
Of the 52,731 records, the index fracture site was:
6%
19%
69%
spine
hip
other fragility fractures
There has been an improvement in most key performance indicators (KPIs) but further work is needed for effective and efficient service delivery.
Key findings Key recommendations
Identification – In 2017 identification of all fractures had improved at to 43% compared with 40% in 2016.
43%FLSs should ensure identification is above 50% of their expected caseload.
Identification – On average 6% of patients had a spine fracture in 2017, compared with 4% in 2016.6%
FLSs with >10% of all submitted patients presenting with a spine fracture should work together to define the best practice pathways for spinal fracture identification.
Treatment recommendation – The percentage of patients being recommended anti-osteoporosis medication increased to 43% in 2017 from 38% in 2016.
43% FLSs should ensure their services meet with NICE and NOGG* guidelines for treatment.
Falls assessment – 46% of patients received (or were referred for) a falls assessment compared with 40% in 2016.46%
FLSs that are not routinely recommending or referring their patients for falls assessment should pilot an agreed falls pathway in their FLS.
Monitoring contact – There was a decline in monitoring in 2017 with only 38% of patients recommended anti-osteoporosis medication being contacted at 12–16 weeks post fracture compared with 41% in 2016.
50%
>10%
FLSs with >50% identification of their expected fracture caseload are advised to prioritise improving monitoring over improving identification.
38% >50%
* Page 15 gives details about the number of commissioned FLSs in England and Wales.
* National Osteoporosis Guideline Group (NOGG)

Fracture Liaison Service Database (FLS-DB) annual report. December 2018
© Healthcare Quality Improvement Partnership 2018 3
Secondary fracture prevention in the NHS: Achieving effective service delivery by FLSs Falls and Fragility Fracture Audit Programme The Fracture Liaison Service Database (FLS-DB) is commissioned by the Healthcare Quality Improvement Partnership (HQIP) and managed by the Care Quality Improvement Department of the Royal College of Physicians (RCP) as part of the Falls and Fragility Fracture Audit Programme (FFFAP) alongside the National Hip Fracture Database (NHFD) and Falls Prevention Audit. FFFAP aims to improve the delivery of care for patients having falls or sustaining fractures through effective measurement against standards and feedback to providers. Healthcare Quality Improvement Partnership The Healthcare Quality Improvement Partnership (HQIP) is led by a consortium of the Academy of Medical Royal Colleges, the Royal College of Nursing and National Voices. Its aim is to promote quality improvement in patient outcomes, and in particular, to increase the impact that clinical audit, outcome review programmes and registries have on healthcare quality in England and Wales. HQIP holds the contract to commission, manage and develop the National Clinical Audit and Patient Outcomes Programme (NCAPOP), comprising around 40 projects covering care provided to people with a wide range of medical, surgical and mental health conditions. The programme is funded by NHS England, the Welsh Government and, with some individual projects, other devolved administrations and crown dependencies. www.hqip.org.uk/national-programmes. The Royal College of Physicians The Royal College of Physicians (RCP) is a registered charity that aims to ensure high-quality care for patients by promoting the highest standards of medical practice. It provides and sets standards in clinical practice, education and training, conducts assessments and examinations, quality assures external audit programmes, supports doctors in their practice of medicine, and advises the government, the public and the profession on healthcare issues. Citation for this report: Royal College of Physicians. Secondary fracture prevention in the NHS: Achieving effective service delivery by FLSs. London: RCP, 2018. Copyright All rights reserved. Applications for the copyright owner’s written permission to reproduce significant parts of this publication (including photocopying or storing it in any medium by electronic means and whether or not transiently or incidentally to some other use of this publication) should be addressed to the publisher. Brief extracts from this publication may be reproduced without the written permission of the copyright owner, provided that the source is fully acknowledged. Copyright © Healthcare Quality Improvement Partnership 2018 ISBN 978-1-86016-743-0 eISBN 978-1-86016-744-7 Royal College of Physicians 11 St Andrews Place, London NW1 4LE www.rcplondon.ac.uk Registered Charity No 210508

Fracture Liaison Service Database (FLS-DB) annual report. December 2018
4 © Healthcare Quality Improvement Partnership 2018
Acknowledgements Thank you to all the FLS teams that have contributed data to the audit; without your considerable effort, this report would not have been possible. Fracture Liaison Service Database team Kassim Javaid, clinical lead Naomi Vasilakis, project manager Rosie Dickinson, programme manager Bonnie Wiles, programme coordinator Nuffield Department of Orthopaedics, Rheumatology and Musculoskeletal Sciences (NDORMS), University of Oxford Anjali Shah, epidemiologist/biostatistician Rafael Pinedo-Villanueva, health economist Fracture Liaison Service Database advisory group Rachel Bradley, British Geriatrics Society Will Carr, National Osteoporosis Society Andrew Judge, University of Bristol Gavin Clunie, The British Society for Rheumatology Clare Cockill, Royal College of Nursing Neil Gittoes, Society for Endocrinology Celia Gregson, University of Bristol Xavier Griffin, British Orthopaedic Association Debbie Janaway, Royal College of Nursing Tim Jones, National Osteoporosis Society Iona Price, Royal College of Physicians, Patient and Carer Network David Stephens, Royal College of General Practitioners Michael Stone, Cardiff and Vale University Health Board Alison Smith, National Osteoporosis Society, patient representative Crown Informatics The FLS-DB data collection webtool is provided by Crown Informatics (http://crowninformatics.com)
Glossary of terms BOA – British Orthopaedic Association (BOA), the surgical specialty association for trauma and orthopaedics in the UK.
DXA – (dual-energy X-ray absorptiometry) scan – a test that assesses whether you have normal bone density, low bone density (also referred to as osteopenia), or osteoporosis.
Fragility fracture – a fracture that occurs after low trauma (equivalent to a fall from standing height or less), excluding skull, face, fingers and toes.
Fracture liaison service (FLS) – a service that systematically identifies, treats and refers to appropriate services eligible for patients aged 50 years and over within a local population who have suffered a fragility fracture, with the aim of reducing their risk of subsequent fractures.
Monitoring – includes any review performed at the patient level to ascertain anti-osteoporosis medication use, re-fracture and/or falls. This can be at a clinic, via a letter or telephone call.
NICE – National Institute for Health and Care Excellence (NICE) provides national guidance and advice to improve health and social care.
NOGG – the National Osteoporosis Guideline Group (NOGG).
NOS – the National Osteoporosis Society (NOS), the only UK-wide charity dedicated to improving the prevention, diagnosis and treatment of osteoporosis
Site – defined as a hospital, primary care practice, network and/or other community service managing fragility fractures.
Fracture Liaison Service Database (FLS-DB) annual report. December 2018
© Healthcare Quality Improvement Partnership 2018 5
Contents Foreword by the National Osteoporosis Society .................................................................................... 6
Patients’ perspective............................................................................................................................... 7
Information for patients ......................................................................................................................... 8
Why monitoring is important ............................................................................................................. 8
Summary of recommendations .............................................................................................................. 9
Recommendations for fracture liaison services ................................................................................. 9
Recommendations for commissioners and local health boards ....................................................... 10
Recommendations for executive teams for NHS trusts and community service boards ................. 10
Recommendations for national policy makers ................................................................................. 10
Introduction .......................................................................................................................................... 11
Methods ............................................................................................................................................ 11
Quality improvement ........................................................................................................................ 11
National performance against KPIs: summary ...................................................................................... 14
Key findings and improvement opportunities ...................................................................................... 15
Data completeness and demographics ............................................................................................. 15
Summary of the key results .............................................................................................................. 17
Results ................................................................................................................................................... 18
KPIs 2 and 3 – Identification of patients with any fragility fracture and those with a spine
fracture as their index fracture site .................................................................................................. 18
Case study: Improving the identification of spinal fracture patients ............................................... 20
KPI 7 – Bone therapy recommended ................................................................................................ 21
KPIs 6 and 8 – Falls assessment and strength and balance class training ........................................ 23
Case study: Increasing the number of patients receiving a falls assessment ................................... 24
KPI 9 – Monitoring ............................................................................................................................ 25
Case study: identification and assessment of patients ..................................................................... 26
Appendices ............................................................................................................................................ 27
Notes on the appendices .................................................................................................................. 27
Appendix 1. Index fracture site proportion and total number of fragility fracture records
submitted by FLSs in 2017 ................................................................................................................ 28
Appendix 2. KPI achievement in 2016 vs. 2017 by FLS ..................................................................... 29
Fracture Liaison Service Database (FLS-DB) annual report. December 2018
6 © Healthcare Quality Improvement Partnership 2018
Foreword by the National Osteoporosis Society
The National Osteoporosis Society (NOS) is the only UK-wide charity that supports people living with osteoporosis and the families, friends and professionals who care for them. As chief executive of the charity I’m delighted to welcome you to the latest FLS-DB audit report on patient data in England and Wales.
This annual report presents findings from the only national secondary fracture prevention patient-level audit in the world. In its own right, this is an enviable achievement. The number of participating services continues to increase and the improvements in standards of care can start to be seen; this is further testament to the hard work of NHS staff who provide services that people with osteoporosis need.
Across a range of specialties, national audit has been shown to be a vital tool in facilitating quality improvement and narrowing inequality in healthcare provision. Highlighting variation and reinforcing best practice will help all those working in secondary fracture prevention. The FLS-DB is still embryonic – this is just the third report – yet it has provided the required catalyst for service transformation. Our charity understands the impact that fractures have on the lives of people with osteoporosis and we share an ambition to see positive changes in the identification and management of fragility fractures. I am confident that the focus this year on several key performance indicators will continue to drive progress in standards of care in a targeted fashion.
The report shows us that there is still more work to be done; but importantly, it shows us where improvements are required and how to achieve them. Thank you to everyone who has contributed to the audit and to the team at FFFAP for their work to compile the report.
Claire Severgnini
Chief executive, National Osteoporosis Society

Fracture Liaison Service Database (FLS-DB) annual report. December 2018
© Healthcare Quality Improvement Partnership 2018 7
Patients’ perspective Across England and Wales, 300,000 fragility fractures were sustained in 1 year by patients aged over 50. This is not merely a statistic in an academic paper, these numbers represent individuals, and for many these injuries will have been traumatic with far-reaching consequences. Patients deserve an efficient, effective, caring and joined-up treatment pathway following such a fracture. The local FLS can provide this, but in order to do so needs to be properly resourced – this includes staff to carry out follow-up checks on patients after 12–16 weeks and 1 year. Identifying those at risk of osteoporosis or falling is simply the start. If the patient has problems with their medication and stops taking it, or falls and suffers a fracture during the long wait for strength and balance training, the FLS has not successfully prevented a secondary fracture. The value of a successful FLS can be easily demonstrated when it knows and can prove the long-term outcomes for its patients. We have an ageing population and can expect the number of fragility fractures to increase. Let us ensure now that caring and comprehensive pathways exist for these individuals. Pathways that bridge the systems across hospitals, primary care, local authorities and public health enable comprehensive monitoring to make sure these patients receive the best ongoing care. A patient’s story can be very powerful and often has far more impact than any number of statistics. Therefore I am delighted to report we now have a FFFAP Patient Panel working with the advisory teams. This panel is made up of ten patients and carers all with experience of one or more of the three areas of the programme, either personally or through those they care for. Iona Price Chair FFFAP Patient Panel
Fracture Liaison Service Database (FLS-DB) annual report. December 2018
8 © Healthcare Quality Improvement Partnership 2018
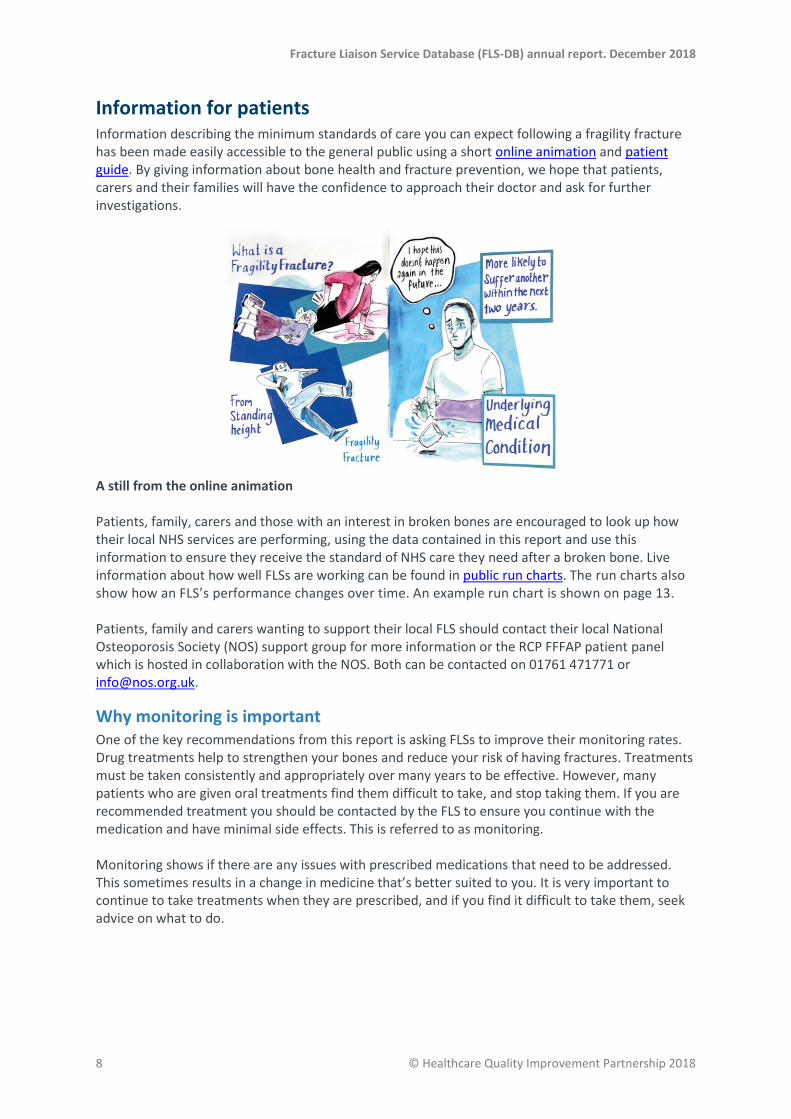
Information for patients Information describing the minimum standards of care you can expect following a fragility fracture has been made easily accessible to the general public using a short online animation and patient guide. By giving information about bone health and fracture prevention, we hope that patients, carers and their families will have the confidence to approach their doctor and ask for further investigations.
A still from the online animation Patients, family, carers and those with an interest in broken bones are encouraged to look up how their local NHS services are performing, using the data contained in this report and use this information to ensure they receive the standard of NHS care they need after a broken bone. Live information about how well FLSs are working can be found in public run charts. The run charts also show how an FLS’s performance changes over time. An example run chart is shown on page 13.
Patients, family and carers wanting to support their local FLS should contact their local National Osteoporosis Society (NOS) support group for more information or the RCP FFFAP patient panel which is hosted in collaboration with the NOS. Both can be contacted on 01761 471771 or [email protected].
Why monitoring is important One of the key recommendations from this report is asking FLSs to improve their monitoring rates. Drug treatments help to strengthen your bones and reduce your risk of having fractures. Treatments must be taken consistently and appropriately over many years to be effective. However, many patients who are given oral treatments find them difficult to take, and stop taking them. If you are recommended treatment you should be contacted by the FLS to ensure you continue with the medication and have minimal side effects. This is referred to as monitoring. Monitoring shows if there are any issues with prescribed medications that need to be addressed. This sometimes results in a change in medicine that’s better suited to you. It is very important to continue to take treatments when they are prescribed, and if you find it difficult to take them, seek advice on what to do.

Fracture Liaison Service Database (FLS-DB) annual report. December 2018
© Healthcare Quality Improvement Partnership 2018 9
Summary of recommendations Local commissioners and FLSs should use this report to improve the effectiveness in post-fracture care delivery through service improvement and/or additional commissioning to reduce the number of preventable subsequent fragility fractures. FLSs should work towards improving one key performance indicator (KPI) to green and one KPI to amber in 2019 while maintaining existing green/amber status. FLSs should share good practice and work with local NHS quality improvement teams.
Recommendations for fracture liaison services 1. General recommendations a) Develop, implement and assess at least two local service improvement plans in the next 6
months by working with local NHS quality improvement teams, including the Getting it Right First Time (GIRFT) programme, and the NOS Service Delivery Team.
b) Attend at least one regional or national FLS workshop to share experiences and improve the efficiency of participating in the FLS-DB in 2019.
2. KPI recommendations a) Data quality
i) Aim to develop IT solutions that enable and combine clinical service delivery with automatic uploading of patient data to the FLS-DB, releasing nurse and administrative time to provide direct clinical care.
b) Identification i) Improve the identification of patients and uploading of patient data onto the FLS-DB
before April 2019, by implementing a service improvement plan informed by learning and sharing of good practice from high performing FLSs and the NOS (for FLSs submitting less than 50% of their estimated fragility fracture caseload).
ii) Form a network to define best practice pathways for effective and efficient spinal fracture identification and share these with other FLSs before April 2019. This could be a virtual network which meets regularly to share experiences of successful and unsuccessful service improvement plans with the aim of developing a toolkit to support other FLSs (for FLSs submitting more than 10% of their patients as spine fractures).
c) Falls assessment and strength and balance training i) Co-develop, with expertise from local falls services, an agreed falls pathway within their FLS
by April 2019 (for FLSs that are not routinely recommending or referring their patients for falls assessment).
ii) Demonstrate evidence of working with other stakeholders (such as falls services, community physiotherapy teams, local authorities and third sector providers) towards implementing effective strength and balance training provision for this frail population in their locality by 2019.
d) Treatment recommendation i) Review data entry methods for the FLS-DB before April 2019 (for FLSs with missing
treatment recommendation rates of more than 10%). ii) Audit treatment recommendation data to ensure services meet NICE and NOGG guidelines
for when to recommend anti-osteoporosis medication. e) Monitoring contact
i) Review method of checking adherence. ii) Prioritise improving monitoring over further improving identification for 2019 (for FLSs that
are achieving at least 50% in the identification KPI).
Fracture Liaison Service Database (FLS-DB) annual report. December 2018
10 © Healthcare Quality Improvement Partnership 2018
Recommendations for commissioners and local health boards 3. Find out what secondary fracture prevention services are available in your area. a) If you do commission an FLS you should:
i) work with the local champion(s) to align the KPIs for your FLS(s) with the 11 KPIs that are detailed on page 15 of this report, to reduce duplication and improve transparency
ii) review the FLS’s performance and prioritise the improvement of KPIs with less than 50% attainment and review commissioning of additional services so FLS can make the improvement required.
b) If you do not commission an FLS you should:
i) quantify the impact of effective secondary fracture prevention in your local population to inform priority commissioning of FLSs, with support from the NOS and NHS RightCare
ii) identify and engage with your local clinical champions and the NOS ([email protected]) to co-develop the specification for a sustainable and effective FLS to prevent further avoidable fractures and their significant consequences for your local patients.
Recommendations for executive teams for NHS trusts and community service boards The FLS-DB is a mandatory National Clinical Audit and Patient Outcomes Programme (NCAPOP) audit. NHS foundation trusts are required to participate in NCAPOP audits that are relevant to the services they provide as part of their NHS contract. Those services that are not currently participating should implement an urgent action plan to address this. 4. Find out what secondary fracture prevention services are available in your area. a) If you do have an FLS covering your local fracture population, you should:
i) understand the full potential impact of an effective FLS to your organisation’s provision of effective healthcare
ii) provide evidence at board level of support for the FLS’s participation in the FLS-DB audit – this could be by sharing regular data at the meeting
iii) provide evidence at board level of support for the FLS’s service improvement and development plans, by reviewing these plans.
b) If you do not have an FLS covering your local fracture population, you should:
i) quantify the impact of effective secondary fracture prevention in your local population to inform a priority application for business case for an FLS in 2019/20, with support from the NOS and NHS RightCare
ii) identify and engage with your local clinical champion(s), the NOS ([email protected]) and NHS RightCare delivery partners to co-develop a business case for a sustainable and effective FLS to prevent further avoidable fractures and their consequences for your local patients.
Recommendations for national policy makers 5. Develop an effective integrated commissioning model(s) by April 2020 that reduces the
primary-secondary provision gap, focusing on secure and easy communication regarding initiation, adherence and tolerability to anti-osteoporosis medications and falls prevention interventions. Multidisciplinary staff such as primary care advanced nurse practitioners may be specifically supported in this role.
6. Develop options for delivering effective strength and balance training provision for this frail population.

Fracture Liaison Service Database (FLS-DB) annual report. December 2018
© Healthcare Quality Improvement Partnership 2018 11
Introduction There are over 300,000 fragility fractures in the England and Wales every year in patients aged 50 years and over. This includes 66,668 hip fractures (NHFD, 2018) and 70% survive at least a year (Schnell et al, 2010) with one in two needing to start using walking aids (Keene et al, 1993) and one in five having to move to a care home setting (Griffin et al, 2015). This has a life-changing impact on the patient and their family, as well as presenting a burden to health and social care. Having a fragility fracture identifies a patient at risk of another fracture and each patient needs to be assessed for their risk of osteoporosis and falling. Those assessed to be at high risk must be offered effective interventions to reduce their risk of future fractures. This post-fracture care requires joint working between specialties in hospitals, GP surgeries and community services. A major challenge for the NHS is the translation of evidence-based therapies into routine care that is effective, efficient and provides a good patient experience. FLSs were recommended by the Department of Health in 2009 to provide this vital link, guiding patients through the different parts of the NHS to ensure the patient gets the right treatment at the right time. FLSs need to deliver effective care at scale to realise the potential benefits of secondary fracture prevention for their communities. The FLS-DB began collecting patient level data on a continuous basis from 1 January 2016. There has been tremendous engagement from the FLS community and to date 65 FLSs have submitted patient data from over 135,000 patients across the NHS in England and Wales. The FLS-DB is the only national secondary fracture prevention patient-level audit in the world. Following our first national benchmark report in 2016, we developed 11 KPIs critical for an FLS to be effective and highlighted variation in each of them, particularly in identification and monitoring. These were derived from NICE technology appraisals and guidance on osteoporosis and falls and the NOS clinical standards for FLSs and quality standards for osteoporosis and prevention of fragility fractures. Documents mapping the datasets to evidence-based guidance are available on the RCP website.
Methods A detailed description of the methodology, including the analysis plan, is available on the RCP website. Since the last report we have changed KPI number 7 (treatment recommendation) to represent the proportion of patients being recommended anti-osteoporosis medication (it was previously the proportion where treatment was recorded as being inappropriate). This change was informed by feedback from the clinical community to previous audit data and to make it easier to interpret the findings. As the target proportion of patients who require recommendations for bone therapy is not known, we have used 50% as a standard based on the current performance of more effective FLSs. In line with the NHFD, we have restricted KPI number 8 (the proportion of patients having started strength and balance training by first follow-up) by excluding patients with a hip fracture. This report describes the assessment and treatment for osteoporosis for 52,731 patients who sustained a fragility fracture in 2017.
Quality improvement To support local service improvement, the FLS-DB provides feedback in a number of formats, including annual reports, patient reports, run charts and regional workshops.

Fracture Liaison Service Database (FLS-DB) annual report. December 2018
12 © Healthcare Quality Improvement Partnership 2018
Since the last report run chart lines have been added for all the KPIs described on page 14. Live run charts allow FLSs to monitor their performance over time and to measure the impact of the implementation of service improvement plans, by comparing performance measures before and after as well as assessing whether any improvement was sustained. FFFAP has also pioneered the release of real-time clinical audit data to the general public making its analyses openly available so that clinical teams, hospital management and the public can share the same access to live information about services in their area. The availability of these public reports gives KPI data access to the wider stakeholder group (www.fffap.org.uk/FLS/charts.nsf). Fig 1: Example run chart showing an FLS’s percentage of patients receiving a falls assessment with the national average for comparison
In March 2018 we ran two workshops in Nottingham and York for 58 FLS-DB participants representing various disciplines. The learning objectives were to know how to use the FLS-DB outputs to improve and monitor the quality of service and how to develop a quality improvement project. The workshop included sessions on quality improvement theory and learning from other FLSs.
National Osteoporosis Society (NOS) Service Delivery Team
The NOS Service Delivery Team includes experienced health professionals with specialist knowledge in FLS, osteoporosis, health service commissioning and service improvement. The team provides a holistic offer of support to health services; health professionals; people affected by osteoporosis; and other local stakeholders across the UK. The support includes the FLS implementation toolkit, advice on clinical pathways, local awareness raising and signposting by working directly with local clinical leads, the operational FLS team and commissioners/service planners. The team facilitate FLS sites to engage with their own data alongside the narrative of a clinical pathway to highlight ‘real-world’ blocks or pinch points. At one site in the north-west of England, comparing expected identification rates with the number of cases submitted to the audit highlighted identification as an issue. The procedures and techniques used to case-find were robust but analysing the next step in the pathway identified that the letters offering appointments to patients were too passive; essentially requiring the patient to ‘opt-in’ to the service. Recommendations and examples from other best-practice FLSs were provided to improve the initial FLS appointment letter.

Fracture Liaison Service Database (FLS-DB) annual report. December 2018
© Healthcare Quality Improvement Partnership 2018 13
In addition to supporting the RCP-led FLS-DB workshops, the NOS promotes excellence in FLSs through the annual FLS Champions’ Summit and other national or regional events. In 2018, the focus of the All Wales Osteoporosis Advisory Group (WOAG) skills and knowledge study day was learning how to deliver best practice based on an exemplar site and how this could be replicated on a national level.
Future developments
Spinal fracture sprint audit Identifying spinal fractures systematically has proven challenging for all FLSs as shown in this report. A sprint audit will be developed and implemented in 2020 to examine the identification and management of fragility spinal fractures. We will work closely with clinical colleagues across radiology and other clinical specialties to develop a robust methodology to understand, and ultimately improve, the identification of spinal fractures. Quality improvement collaboratives The FFFAP team is working with the RCP Quality Improvement programme team to run a series of quality improvement collaboratives focusing on FLSs and secondary fracture prevention. The collaborative will consist of three 1-day learning sessions plus supporting action periods and coaching calls. The collaboratives are designed for small multidisciplinary teams and will take participants through the basic ideas and theory of quality improvement, as well as methodologies used to plan and implement a quality improvement project. It will utilise the FLS-DB data that they collect.
Service improvement toolkits In 2019, we will co-develop a library of successful and unsuccessful service improvement plans to address each KPI with the NOS Service Delivery Team, the FLS champions, GIRFT, NHS RightCare and other key stakeholders. This resource will support local FLSs to rapidly develop effective service improvement plans for their service enabling learning from good practice as well as lessons learnt from unsuccessful attempts at improvement (which are just as valuable).

Fracture Liaison Service Database (FLS-DB) annual report. December 2018
14 © Healthcare Quality Improvement Partnership 2018
National performance against KPIs: summary All KPIs measure performance against technology assessments, guidance on osteoporosis and clinical standards for FLSs from NICE, the NOS and the NOGG. Documents mapping the datasets to evidence-based guidance are available on the RCP website.
Table 1: A table outlining the KPIs for the FLS-DB for all patients with an index fragility fracture date in 2017. FLS level data for all KPIs is available on the RCP website.
KPI 2016 2017
KPI 1 – Data completeness FLSs with good level of data completeness*
50% 53%
KPI 2 – Identification (all fragility fractures) Percentage of patient records submitted compared with the local estimated caseload
40% 43%
KPI 3 – Identification (spinal fractures) Percentage of patients with a spine fracture as their index fracture site 4% 6%
KPI 4 – Time to FLS assessment Percentage of patients who were assessed by the FLS within 90 days of their fracture
67% 70%
KPI 5 – Time to DXA Percentage of patients who had a DXA ordered or recommended and were scanned within 90 days of fracture
43% 46%
KPI 6 – Falls assessment Percentage of patients who received a falls assessment or were referred or recommended for a falls assessment
40% 46%
KPI 7 – Bone therapy recommended Percentage of patients who were recommended anti-osteoporosis medication
38% 43%
KPI 8 – Strength and balance training The percentage of non-hip fracture patients who had started strength and balance training within 16 weeks of their fracture†
4% 4%
KPI 9 – Monitoring contact 12–16 weeks post fracture
The percentage of patients who were followed up following their fracture
41%
38%
KPI 10 – Commenced bone therapy by first follow up The percentage of patients who had commenced (or were continuing) anti-osteoporosis medication.
31% 27%
KPI 11 – Adherence to prescribed anti-osteoporosis medication at 12 months post fracture The percentage of patients who had confirmed adherence to a prescribed anti-osteoporosis medication at 12 months post fracture
-- 19%‡
*Defined as fewer than five fields with more than 20% of data missing.
† In 2016 this was calculated for all fractures, in 2017 it was for hip fractures alone.
‡ Patients first seen in 2016 and followed up in 2017.

Fracture Liaison Service Database (FLS-DB) annual report. December 2018
© Healthcare Quality Improvement Partnership 2018 15
Key findings and improvement opportunities
Data completeness and demographics There has been a 16% increase in the number of patient records submitted in 2017 (n=52,968) compared with 2016 (45,396). Of these, 2,356 were re-fractures. The NOS estimate that there are approximately 95 FLSs in England and Wales. This includes all commissioned services designed to identify, assess and treat patients at risk of osteoporosis. It should be noted that many FLSs cover more than one hospital (see fig 2); the number of FLSs changes as services are commissioned and decommissioned and some of these services will have recently received funding and are not yet operational. Sixty-five FLSs have submitted patient data since the audit opened. This includes 59 FLSs which submitted patient level data in 2017, compared with 52 FLSs in 2016. Four FLSs submitted fewer than 50 records and were excluded from the remainder of the report. There were 237 patients with a duplicate fracture date and NHS number and these were also excluded, giving 52,731 cases from 55 FLSs used in this report. This compares with an estimated total fragility fracture caseload of 333,340 cases, based on the 175 hospitals from England, Wales and Northern Ireland submitting 66,668 hip fracture cases to the NHFD in 2017. Of the 171 NHFD hospitals in England and Wales, 102 are not currently covered by an FLS submitting data to the FLS-DB and nine are only covered by an FLS submitting organisational audit data. Of the 55 FLSs, 53% of FLSs had good levels of data completeness (fewer than five fields with more than 20% data missing). Of the 52,731 patients, 19% sustained a hip, 6% spine and 69% other fragility fracture as their index fracture (see Appendix 1). The fracture site was missing for 7% of patients. Just over half (56%) of patients were under 75 years old. The average number of patients submitted per FLS was 959. The average population served was 390,000 with 1.23 WTE nurses and 0.4 administrators per FLS. Six FLSs were community-based services.

Fracture Liaison Service Database (FLS-DB) annual report. December 2018
16 © Healthcare Quality Improvement Partnership 2018
Fig 2: Map of England and Wales showing participation and case-finding of FLS cases
2016 2017
Key – hospitals where patients are:
Not covered by an FLS submitting data to the FLS-DB and so unable to benchmark effectiveness of any potential FLS.
Covered by an FLS that participated in the organisational audit but has too few cases to be included in the patient level audit.
Covered by an FLS submitting less than 50% of their estimated fragility fracture caseload to the FLS-DB.
Covered by an FLS submitting 50–79% of their estimated fragility fracture caseload to the FLS-DB.
Covered by an FLS submitting at least 80% of their estimated fragility fracture to the FLS-DB.

Fracture Liaison Service Database (FLS-DB) annual report. December 2018
© Healthcare Quality Improvement Partnership 2018 17
Summary of the key results There has been an improvement in the number of FLSs achieving good (green) or requires improvement (amber) standards for each KPI:
Fig 3: Change in number of FLS KPI achievement from 2016 to 2017
For each KPI, green denotes 80% or higher achievement and amber 50–79% achievement, except for recommendation of bone therapy where green denotes 50% or higher achievement and amber was not used. The achievement of individual KPIs for each FLS is shown in Appendix 2.
Fracture Liaison Service Database (FLS-DB) annual report. December 2018
18 © Healthcare Quality Improvement Partnership 2018
Results
KPIs 2 and 3 – Identification of patients with any fragility fracture and those
with a spine fracture as their index fracture site
Guidelines
NICE QS 149: Adults who have had a fragility fracture have an assessment of their fracture risk.
NOS 2015: All patients aged 50 years and over who have a new fragility fracture or a newly reported vertebral fracture will be systematically and proactively identified.
NOGG: Coordinator-based FLSs should be used to systematically identify men and women with a fragility fracture.
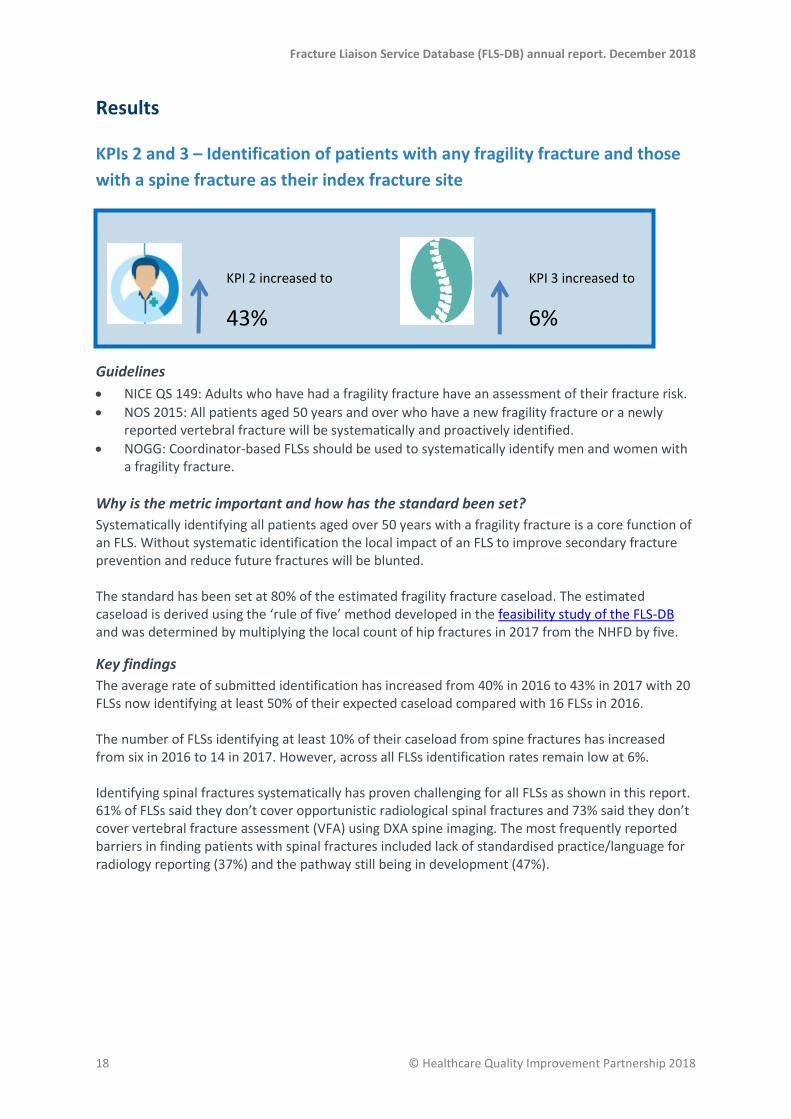
Why is the metric important and how has the standard been set?
Systematically identifying all patients aged over 50 years with a fragility fracture is a core function of an FLS. Without systematic identification the local impact of an FLS to improve secondary fracture prevention and reduce future fractures will be blunted. The standard has been set at 80% of the estimated fragility fracture caseload. The estimated caseload is derived using the ‘rule of five’ method developed in the feasibility study of the FLS-DB and was determined by multiplying the local count of hip fractures in 2017 from the NHFD by five.
Key findings
The average rate of submitted identification has increased from 40% in 2016 to 43% in 2017 with 20 FLSs now identifying at least 50% of their expected caseload compared with 16 FLSs in 2016. The number of FLSs identifying at least 10% of their caseload from spine fractures has increased from six in 2016 to 14 in 2017. However, across all FLSs identification rates remain low at 6%. Identifying spinal fractures systematically has proven challenging for all FLSs as shown in this report. 61% of FLSs said they don’t cover opportunistic radiological spinal fractures and 73% said they don’t cover vertebral fracture assessment (VFA) using DXA spine imaging. The most frequently reported barriers in finding patients with spinal fractures included lack of standardised practice/language for radiology reporting (37%) and the pathway still being in development (47%).
KPI 2 increased to
43%
KPI 3 increased to
6%
Fracture Liaison Service Database (FLS-DB) annual report. December 2018
© Healthcare Quality Improvement Partnership 2018 19
Recommendations for FLSs Improve the identification of patients and uploading of patient data onto the FLS-DB before
April 2019, by implementing a service improvement plan informed by learning and sharing of good practice from high performing FLSs and the NOS (for FLSs submitting less than 50% of their estimated fragility fracture caseload).
Form a network to define best practice pathways for effective and efficient spinal fracture identification and share these with other FLSs before April 2019. This could be a virtual network which meets regularly to share experiences of successful and unsuccessful service improvement plans with the aim of developing a toolkit to support other FLSs (for FLSs submitting more than 10% of their patients as spine fractures).

Fracture Liaison Service Database (FLS-DB) annual report. December 2018
20 © Healthcare Quality Improvement Partnership 2018
Case study: Improving the identification of spinal fracture patients Milton Keynes University Hospital Foundation Trust – Debbie Minney, fragility advanced nurse practitioner
Background
Identifying spinal fractures was a challenge as most of these patients are admitted under the medical team or only attend an outpatient clinic. Due to resourcing, the fragility team had limited availability to attend the wards to identify patients.
Aim
To assess more fragility fracture patients overall.
To ensure more spinal fracture patients are referred directly to the FLS.
Process
I presented the 2016 FLS-DB report at the department audit meeting and discussed our results compared with the national average. I gave a brief overview of the service and encouraged colleagues to refer fragility fracture patients directly to the FLS. The orthopaedic spinal consultant agreed to refer all patients with osteoporotic spinal fractures to the FLS for a bone health assessment. Education sessions on fragility fractures were given to all junior doctors, along with guidelines on how to treat patients with osteoporotic spinal fractures. The fracture clinic nurses have been educated to identify patients who have attended the clinic and refer them to the FLS for assessment. The therapy team at Milton Keynes is in constant contact with the fragility and trauma coordinator and any spinal fractures that are identified by the therapy team are fed back to the fragility team for assessment.
Outcomes
The proportion of spinal fracture patients has increased from 7% to 15%.
The referrals we are receiving from the spinal clinic have helped increase the amount of spinal fractures seen by the FLS. However, we are now also receiving an increased number of referrals from all areas within the hospital.
Patients are being assessed and commencing treatment while still an inpatient so the patient does not have to return to clinic.
Next steps
Due to the increase in patients referred to the FLS, the waiting time for assessment in our outpatient clinics has increased (with some patients waiting 8 weeks). If inpatients are identified earlier in their stay, treatment could be commenced before they are discharged. This would avoid them having to attend an outpatient appointment. We have produced a business case for extra staff to improve on waiting times and allow a better coverage from the fragility service within the hospital and for administration assistance, as this is all being completed by the band 7. In turn this will make space for more clinic work. This will also allow us to expand the service we provide.
Summary
Make contact with the spinal consultant as they will be able to identify patients.
Liaise with the therapists as they will also be rotating and working within the medical wards, enabling them to identify and refer patients to the FLS.
Fracture Liaison Service Database (FLS-DB) annual report. December 2018
© Healthcare Quality Improvement Partnership 2018 21
KPI 7 – Bone therapy recommended
Guidelines
NOS 2015, NOS 2017, NOGG, NICE TA 464, NICE TA 204, NICE QS 149: Patients at increased risk of further fracture will be offered appropriate bone protection treatments.
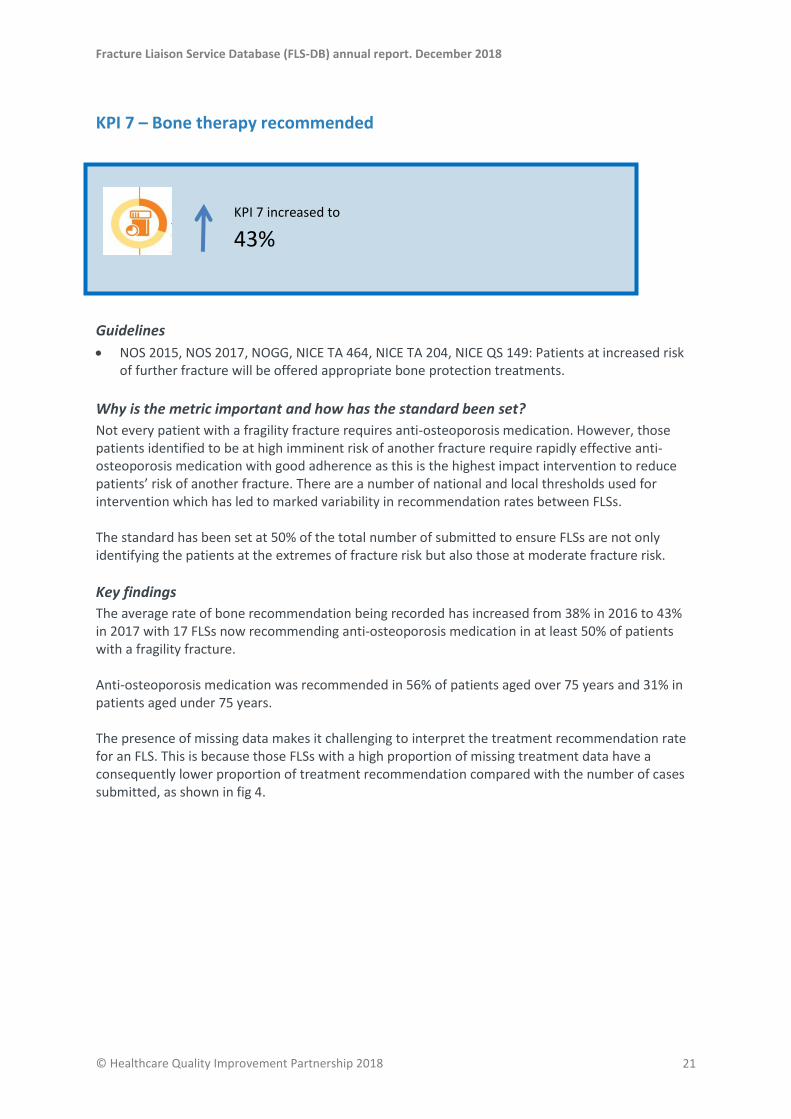
Why is the metric important and how has the standard been set?
Not every patient with a fragility fracture requires anti-osteoporosis medication. However, those patients identified to be at high imminent risk of another fracture require rapidly effective anti-osteoporosis medication with good adherence as this is the highest impact intervention to reduce patients’ risk of another fracture. There are a number of national and local thresholds used for intervention which has led to marked variability in recommendation rates between FLSs. The standard has been set at 50% of the total number of submitted to ensure FLSs are not only identifying the patients at the extremes of fracture risk but also those at moderate fracture risk.
Key findings
The average rate of bone recommendation being recorded has increased from 38% in 2016 to 43% in 2017 with 17 FLSs now recommending anti-osteoporosis medication in at least 50% of patients with a fragility fracture. Anti-osteoporosis medication was recommended in 56% of patients aged over 75 years and 31% in patients aged under 75 years. The presence of missing data makes it challenging to interpret the treatment recommendation rate for an FLS. This is because those FLSs with a high proportion of missing treatment data have a consequently lower proportion of treatment recommendation compared with the number of cases submitted, as shown in fig 4.
KPI 7 increased to
43%

Fracture Liaison Service Database (FLS-DB) annual report. December 2018
22 © Healthcare Quality Improvement Partnership 2018
Fig 4: Percentage of all patients with an active treatment recommendation (KPI 6) and proportion of patients with missing treatment recommendation by FLS (1–55)
The red line denotes 50% of submitted patients recommended or referred for anti-osteoporosis medication.
Recommendations for FLSs
Review data entry methods for the FLS-DB before April 2019 (for FLSs with missing treatment recommendation rates of more than 10%).
Audit treatment recommendation data to ensure services meet NICE and NOGG guidelines for when to recommend anti-osteoporosis medication.
Fracture Liaison Service Database (FLS-DB) annual report. December 2018
© Healthcare Quality Improvement Partnership 2018 23
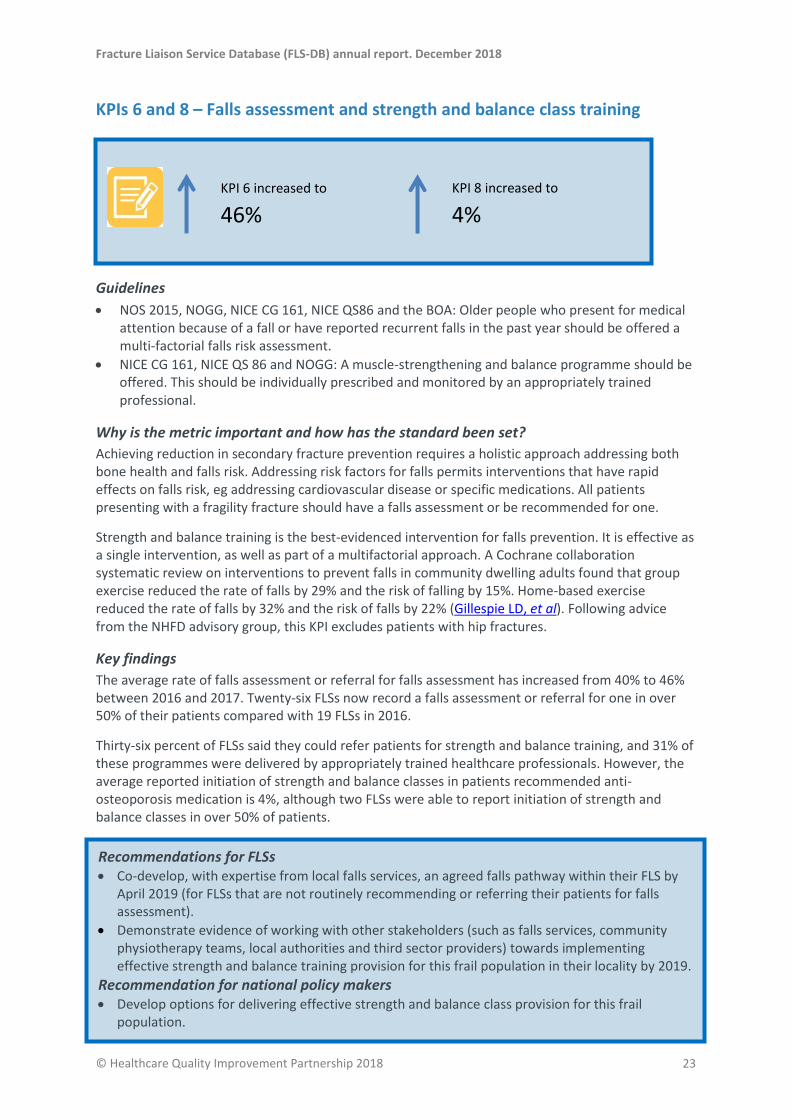
KPIs 6 and 8 – Falls assessment and strength and balance class training
Guidelines
NOS 2015, NOGG, NICE CG 161, NICE QS86 and the BOA: Older people who present for medical attention because of a fall or have reported recurrent falls in the past year should be offered a multi-factorial falls risk assessment.
NICE CG 161, NICE QS 86 and NOGG: A muscle-strengthening and balance programme should be offered. This should be individually prescribed and monitored by an appropriately trained professional.
Why is the metric important and how has the standard been set?
Achieving reduction in secondary fracture prevention requires a holistic approach addressing both bone health and falls risk. Addressing risk factors for falls permits interventions that have rapid effects on falls risk, eg addressing cardiovascular disease or specific medications. All patients presenting with a fragility fracture should have a falls assessment or be recommended for one.
Strength and balance training is the best-evidenced intervention for falls prevention. It is effective as a single intervention, as well as part of a multifactorial approach. A Cochrane collaboration systematic review on interventions to prevent falls in community dwelling adults found that group exercise reduced the rate of falls by 29% and the risk of falling by 15%. Home-based exercise reduced the rate of falls by 32% and the risk of falls by 22% (Gillespie LD, et al). Following advice from the NHFD advisory group, this KPI excludes patients with hip fractures.
Key findings
The average rate of falls assessment or referral for falls assessment has increased from 40% to 46% between 2016 and 2017. Twenty-six FLSs now record a falls assessment or referral for one in over 50% of their patients compared with 19 FLSs in 2016.
Thirty-six percent of FLSs said they could refer patients for strength and balance training, and 31% of these programmes were delivered by appropriately trained healthcare professionals. However, the average reported initiation of strength and balance classes in patients recommended anti-osteoporosis medication is 4%, although two FLSs were able to report initiation of strength and balance classes in over 50% of patients.
Recommendations for FLSs Co-develop, with expertise from local falls services, an agreed falls pathway within their FLS by
April 2019 (for FLSs that are not routinely recommending or referring their patients for falls assessment).
Demonstrate evidence of working with other stakeholders (such as falls services, community physiotherapy teams, local authorities and third sector providers) towards implementing effective strength and balance training provision for this frail population in their locality by 2019.
Recommendation for national policy makers Develop options for delivering effective strength and balance class provision for this frail
population.
KPI 8 increased to
4%
KPI 6 increased to
46%

Fracture Liaison Service Database (FLS-DB) annual report. December 2018
24 © Healthcare Quality Improvement Partnership 2018
Case study: Increasing the number of patients receiving a falls
assessment Musgrove Park Hospitals – Gemma Hembery, fracture liaison specialist practitioner Background
The first FLS-DB annual report showed we were performing above the national average in many areas. However, we felt there were still improvement opportunities. A quarter of patients were not documented as having received or been referred for a falls assessment. After discussing this at an NOS champions meeting we realised that only patients physically seen in clinic or as an inpatient were recorded as having a falls assessment. A large group of patients, many of whom are over 75 and require a falls assessment, were referred to primary care for treatment.
Aim
To ensure all patients were getting an adequate falls assessment and that we were maintaining a record of this. Process
Gemma Hembery, fracture liaison specialist practitioner, and Ron Perry, fracture liaison administrator, determined the best way to document when a falls assessment was carried out by another clinician such as the GP, or a referral to the independent living team and falls clinic. We included a sentence in our letter to GPs requesting a falls assessment for patients who did not require a face-to-face clinic appointment. We also changed our postal questionnaire sent to patients to include a section on falls. This gave us an initial indication of the type of support patients might need and allows us to pass on more information to the GP and engage them to carry out assessments. Regular reviews of the number of assessments or referrals were carried out to enable us to see patient groups we may be missing. Outcomes
The number of patients receiving or being referred for a falls assessment increased from 75% in 2016 to 95% in 2017.
The increase in our KPI performance is proof that our numbers are now truly reflective of all patients who received a falls assessment, whether in primary or secondary care.
Summary
Discuss each database field fully within your team to ensure there is an understanding of what constitutes a positive or negative response.
Look at the processes of other FLSs in your area or those that are high achieving and try to see where you may be able to adapt your service.
Regularly reflect on your processes and identify areas you are not capturing and adjust accordingly.

Fracture Liaison Service Database (FLS-DB) annual report. December 2018
© Healthcare Quality Improvement Partnership 2018 25
KPI 9 – Monitoring
Guidelines
NOS 2015, NOS 2017: Patients who are recommended anti-osteoporosis therapy to reduce risk of fracture will be reviewed within 4 months of initiation to ensure appropriate treatment has been started, and every 12 months to monitor adherence with the treatment plan.
NICE QS 149: Adults prescribed drug treatment to reduce fracture risk are asked about adverse effects and adherence to treatment at each medication review.
Why is the metric important and how has the standard been set?
Given up to 50% of the risk of re-fracture occurs in the first 2 years following an index fracture, it is essential that eligible patients are rapidly started on anti-osteoporosis medication and stay on therapy for at least this length of time. Oral bisphosphonates are the recommended first-line therapy for osteoporosis. These medications have a complex administration regimen for patients to follow, produce no beneficial effect on symptoms and are sometimes associated with troublesome side effects. This leads to rates of persistence of less than 30% at 12 months, and 10% of patients do not even initiate anti-osteoporosis medication. This level of non-compliance is not compatible with an effective FLS. FLSs should actively monitor patients’ recommended therapy to support patient choices, including therapeutic switches to other anti-osteoporosis medications with better persistence rates. Active monitoring of patients should ideally take place within 16 weeks of index fracture to ensure rapid initiation and be repeated at 52 weeks to ensure ongoing persistence. Currently active monitoring of adherence is not standard within the NHS with only 38% of patients who were recommended anti-osteoporosis medication having any monitoring contact. At this early stage of the audit we are reporting whether there is any monitoring of a patient by an FLS and will focus on improving the timing of monitoring in later reports.
Key findings
Monitoring remains challenging for FLSs and the average rate of any monitoring information being recorded decreased from 41% to 38% between 2016 and 2017. Twenty FLSs were able to submit monitoring information in over 50% of patients in 2017 and 2016. Reported proportion of adherence at 12 months was 19% of patients who were recommended or referred for therapy, with 5/55 FLSs able to confirm this in over 50% of their patients. Nearly half (46%) of FLSs reported that they delegated some monitoring to primary care, in which case it becomes almost impossible for hospital-based FLSs to track individual patients and identify whether the patient has continued with their treatment.
KPI 9 has decreased to
38%
Fracture Liaison Service Database (FLS-DB) annual report. December 2018
26 © Healthcare Quality Improvement Partnership 2018
For an FLS to be successful it is essential that they deliver the whole pathway to patients who are at risk of further fractures. Therefore, given the importance of ensuring adherence to anti-osteoporosis medication we recommend FLSs who are already achieving moderate identification rates (50% or more) prioritise improving monitoring over improving identification in 2019.
Recommendations for FLSs
Review method of checking adherence.
Prioritise improving monitoring over further improving identification for 2019 (for FLSs that are achieving at least 50% in the identification KPI).
Case study: identification and assessment of patients Guy’s and St Thomas’ NHS Foundation Trust
Background
A band 7 clinical nurse specialist (1 WTE) was funded to run the FLS. However, this was not sufficient and fragility fracture patients were not being identified on a daily basis with the majority being referred back to their GPs for DXA scans and bone health management. In addition, the FLS was not capturing incidental spinal fractures or patients who would not be followed up in the fracture clinic. Aim
To identify all fragility fracture patients coming through A&E, wards, fracture clinics and radiology. To capture incidental spinal fractures via electronic screening in liaison with radiology. Process
An application was submitted to the clinical commissioning group (CCG) which resulted in an increase to two WTE band 7 clinical nurse specialists and one WTE administrator.
Radiology agreed to send the FLS monthly lists of all patients with the word ‘fracture’ in report.
Radiology, A&E, ageing and health staff and orthopaedic staff were encouraged to refer patients who might require a fragility fracture assessment directly to the FLS.
The FLS started daily ward rounds and having a daily presence in the fracture clinic to identify new fracture patients.
Outcomes
The percentage of eligible patients seen by the FLS has risen from 66% to 144%.
The proportion of patients with spine fracture has risen from 2% to 8%.
The percentage of patients assessed within 90 days of fracture has risen from 19% to 93%.
An increasing number of patients discharged on oral bisphosphonates or arrangement to return for parenteral treatment.
The FLS is able to visit wards to advise on bone health treatment and plan prior to discharge rather than delegating this to primary care.

Fracture Liaison Service Database (FLS-DB) annual report. December 2018
© Healthcare Quality Improvement Partnership 2018 27
References and bibliography The references cited in this report and bibliography are available online on the RCP website.
Appendices
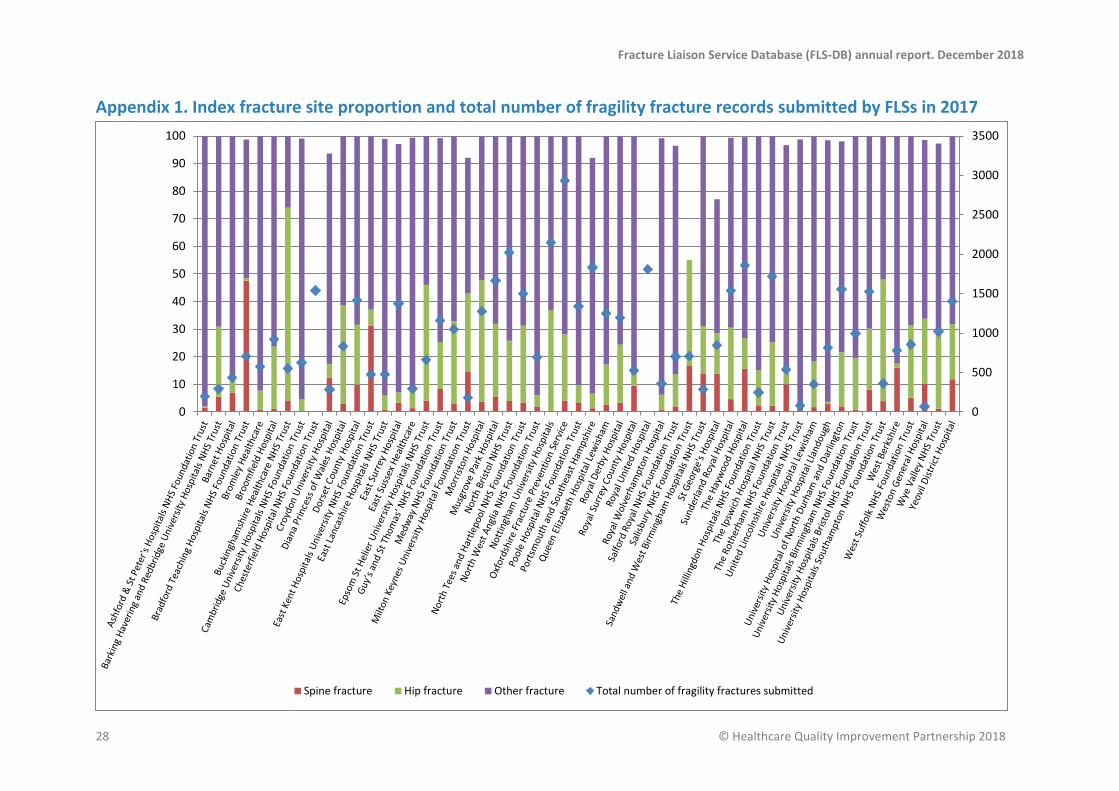
Notes on the appendices Appendix 1. Index fracture site proportion and total number of fragility fracture records submitted by FLSs in 2017 This figure shows the site of the first fracture site (bars) and the total number of cases submitted (blue diamonds) by FLSs. The left vertical axis shows what proportion of patients presented with a hip, spine or other fractures. The right vertical axis shows the total number of cases submitted by each FLS. The figure shows that there was a wide variation in the proportion of patients with hip fracture submitted and a low rate of vertebral fractures were identified.
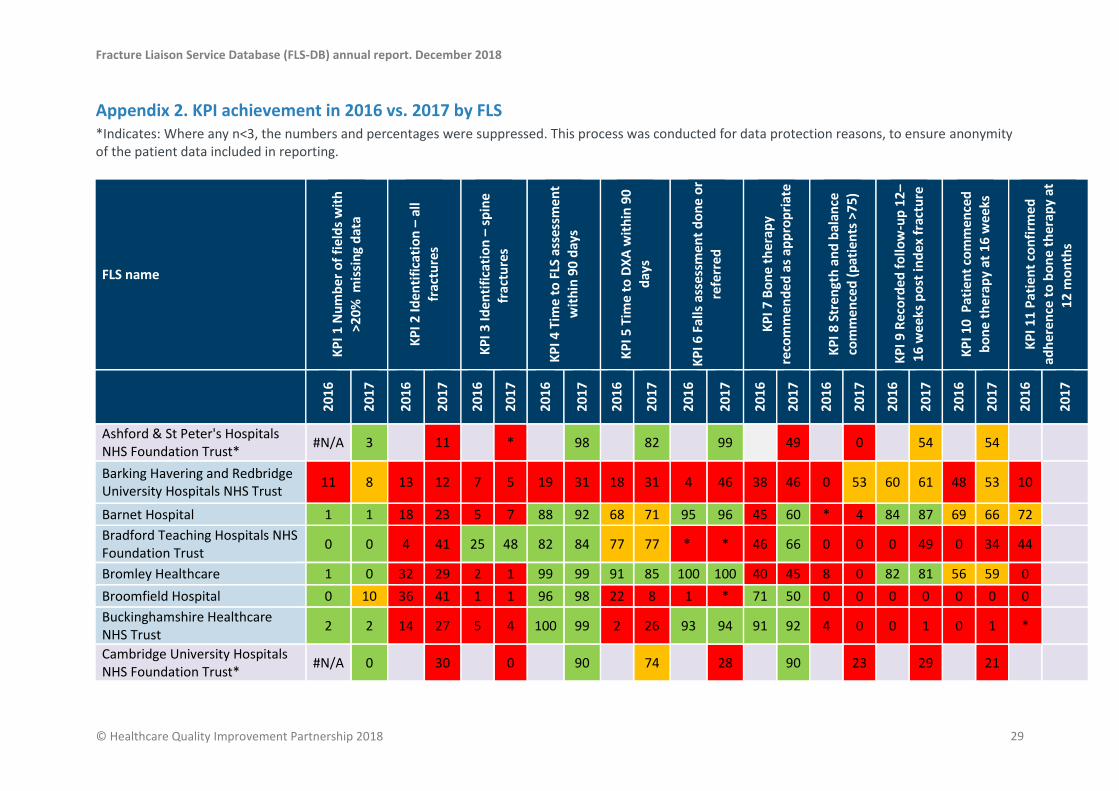
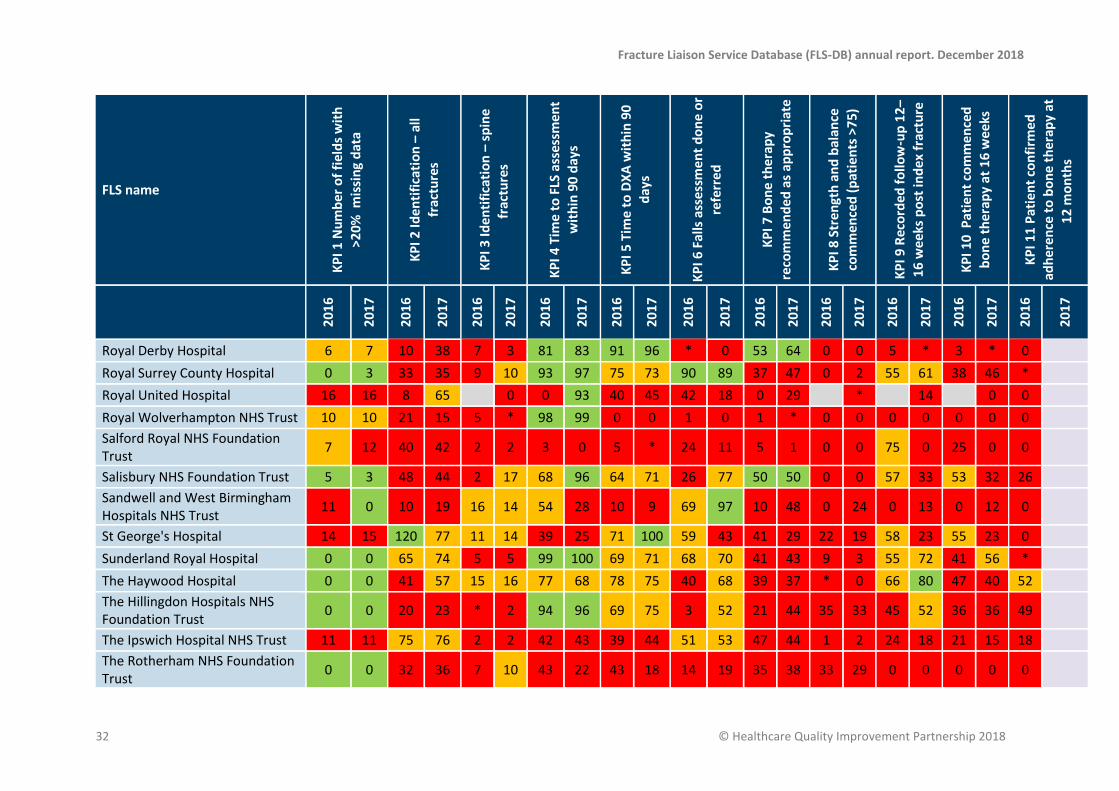
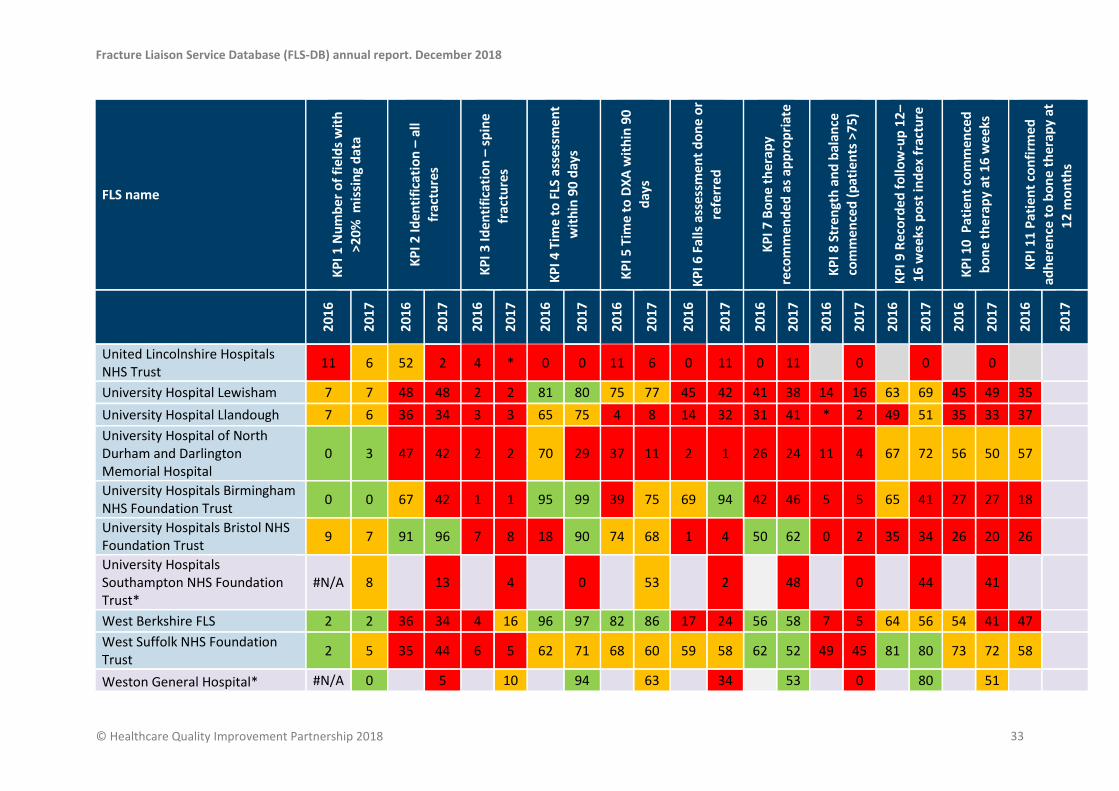
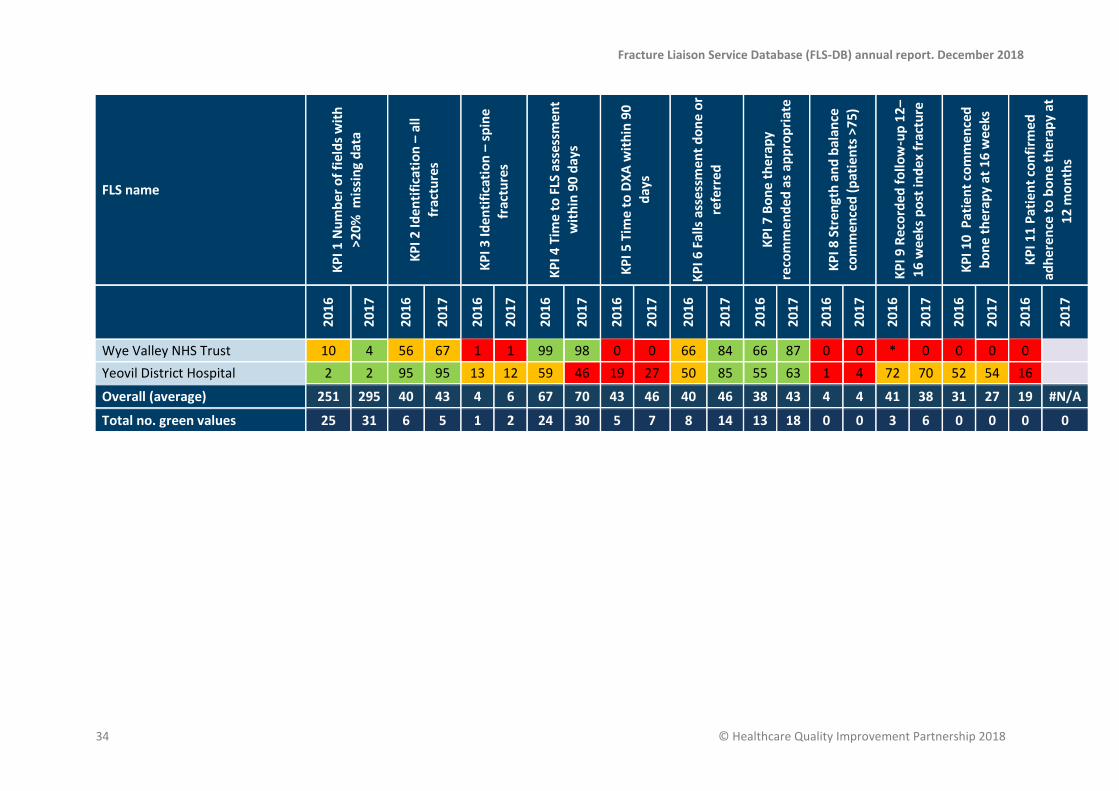
Appendix 2. KPI achievement in 2016 vs. 2017 by FLS Actual percentage achievement shown for each FLS with additional colour coding of green as 80% or more achievement, amber as 50–79% achievement and red as <50% achievement; except for KPI 1 where green shows 0–5 fields, amber shows 6–10 fields and red shows >11 fields; KPI 3 where green shows >20%, amber as 11–19% achievement and red <10% achievement and KPI 7 where green shows >50% and red < 50% achievement. The 2016 national averages are based on the results published in the 2017 annual report. This includes data from FLSs who no longer submit data to the FLS-DB. KPI 7 was not published in the 2017 annual report but was calculated using the 2016 data. KPI 11 relates to patients seen in 2016 and followed up in 2017.
Fracture Liaison Service Database (FLS-DB) annual report. December 2018
28 © Healthcare Quality Improvement Partnership 2018
Appendix 1. Index fracture site proportion and total number of fragility fracture records submitted by FLSs in 2017
0
500
1000
1500
2000
2500
3000
3500
0
10
20
30
40
50
60
70
80
90
100
Spine fracture Hip fracture Other fracture Total number of fragility fractures submitted
Fracture Liaison Service Database (FLS-DB) annual report. December 2018
© Healthcare Quality Improvement Partnership 2018 29
Appendix 2. KPI achievement in 2016 vs. 2017 by FLS *Indicates: Where any n<3, the numbers and percentages were suppressed. This process was conducted for data protection reasons, to ensure anonymity of the patient data included in reporting.
FLS name
KP
I 1 N
um
ber
of
fiel
ds
wit
h
>20
% m
issi
ng
dat
a
KP
I 2 Id
en
tifi
cati
on
– a
ll
frac
ture
s
KP
I 3 Id
en
tifi
cati
on
– s
pin
e fr
actu
res
KP
I 4 T
ime
to
FLS
ass
essm
en
t w
ith
in 9
0 d
ays
KP
I 5 T
ime
to
DX
A w
ith
in 9
0
day
s
KP
I 6 F
alls
ass
ess
me
nt
do
ne
or
refe
rre
d
KP
I 7 B
on
e t
he
rap
y re
com
me
nd
ed
as
app
rop
riat
e
KP
I 8 S
tre
ngt
h a
nd
bal
ance
com
me
nce
d (
pat
ien
ts >
75
)
KP
I 9 R
eco
rde
d f
ollo
w-u
p 1
2–
16
we
eks
po
st in
de
x fr
actu
re
KP
I 10
Pat
ien
t co
mm
en
ced
b
on
e t
he
rap
y at
16
we
eks
KP
I 11
Pat
ien
t co
nfi
rme
d
adh
ere
nce
to
bo
ne
th
era
py
at
12
mo
nth
s
20
16
20
17
20
16
20
17
20
16
20
17
20
16
20
17
20
16
20
17
20
16
20
17
20
16
20
17
20
16
20
17
20
16
20
17
20
16
20
17
20
16
20
17
Ashford & St Peter's Hospitals NHS Foundation Trust*
#N/A 3 11 * 98 82 99 49 0 54 54
Barking Havering and Redbridge University Hospitals NHS Trust
11 8 13 12 7 5 19 31 18 31 4 46 38 46 0 53 60 61 48 53 10
Barnet Hospital 1 1 18 23 5 7 88 92 68 71 95 96 45 60 * 4 84 87 69 66 72
Bradford Teaching Hospitals NHS Foundation Trust
0 0 4 41 25 48 82 84 77 77 * * 46 66 0 0 0 49 0 34 44
Bromley Healthcare 1 0 32 29 2 1 99 99 91 85 100 100 40 45 8 0 82 81 56 59 0
Broomfield Hospital 0 10 36 41 1 1 96 98 22 8 1 * 71 50 0 0 0 0 0 0 0
Buckinghamshire Healthcare NHS Trust
2 2 14 27 5 4 100 99 2 26 93 94 91 92 4 0 0 1 0 1 *
Cambridge University Hospitals NHS Foundation Trust*
#N/A 0 30 0 90 74 28 90 23 29 21

Fracture Liaison Service Database (FLS-DB) annual report. December 2018
30 © Healthcare Quality Improvement Partnership 2018
FLS name
KP
I 1 N
um
ber
of
fiel
ds
wit
h
>20
% m
issi
ng
dat
a
KP
I 2 Id
en
tifi
cati
on
– a
ll
frac
ture
s
KP
I 3 Id
en
tifi
cati
on
– s
pin
e fr
actu
res
KP
I 4 T
ime
to
FLS
ass
essm
en
t w
ith
in 9
0 d
ays
KP
I 5 T
ime
to
DX
A w
ith
in 9
0
day
s
KP
I 6 F
alls
ass
ess
me
nt
do
ne
or
refe
rre
d
KP
I 7 B
on
e t
he
rap
y re
com
me
nd
ed
as
app
rop
riat
e
KP
I 8 S
tre
ngt
h a
nd
bal
ance
com
me
nce
d (
pat
ien
ts >
75
)
KP
I 9 R
eco
rde
d f
ollo
w-u
p 1
2–
16
we
eks
po
st in
de
x fr
actu
re
KP
I 10
Pat
ien
t co
mm
en
ced
b
on
e t
he
rap
y at
16
we
eks
KP
I 11
Pat
ien
t co
nfi
rme
d
adh
ere
nce
to
bo
ne
th
era
py
at
12
mo
nth
s
2
01
6
20
17
20
16
20
17
20
16
20
17
20
16
20
17
20
16
20
17
20
16
20
17
20
16
20
17
20
16
20
17
20
16
20
17
20
16
20
17
20
16
20
17
Chesterfield Hospital NHS Foundation Trust*
#N/A 17 70 0 0 0 0
Croydon University Hospital 6 16 15 20 11 12 99 32 86 97 94 32 46 16 * 0 0 0 0 0 0
Diana Princess of Wales Hospital 5 10 12 58 0 3 88 74 76 64 84 35 51 48 0 0 74 70 72 64 *
Dorset County Hospital 11 11 70 87 3 10 94 98 66 67 21 33 41 52 0 0 14 27 10 18 14
East Kent Hospitals University NHS Foundation Trust*
#N/A 7 10 31 9 29 100 0
East Lancashire Hospitals NHS Trust
2 2 24 21 * 1 90 87 60 65 26 31 29 21 * 0 48 29 45 28 31
East Surrey Hospital 2 11 29 54 3 3 4 3 5 5 95 59 24 14 0 * 0 * 0 * *
East Sussex Healthcare* #N/A 0 9 1 35 50 98 48 17 33 29
Epsom St Helier University Hospitals NHS Trust*
#N/A 1 30 4 86 16 100 55 67 68 52
Guy’s and St Thomas’ NHS Foundation Trust
12 12 66 144 2 8 19 93 27 * 44 69 12 22 * 14 * * * 0 0
Medway NHS Foundation Trust 11 9 56 60 2 3 * 25 1 2 5 37 14 29 0 0 * 17 0 9 *
Milton Keynes University 2 3 21 13 7 15 94 86 37 24 37 54 13 38 * 0 62 62 57 45 35

Fracture Liaison Service Database (FLS-DB) annual report. December 2018
© Healthcare Quality Improvement Partnership 2018 31
FLS name
KP
I 1 N
um
ber
of
fiel
ds
wit
h
>20
% m
issi
ng
dat
a
KP
I 2 Id
en
tifi
cati
on
– a
ll
frac
ture
s
KP
I 3 Id
en
tifi
cati
on
– s
pin
e fr
actu
res
KP
I 4 T
ime
to
FLS
ass
essm
en
t w
ith
in 9
0 d
ays
KP
I 5 T
ime
to
DX
A w
ith
in 9
0
day
s
KP
I 6 F
alls
ass
ess
me
nt
do
ne
or
refe
rre
d
KP
I 7 B
on
e t
he
rap
y re
com
me
nd
ed
as
app
rop
riat
e
KP
I 8 S
tre
ngt
h a
nd
bal
ance
com
me
nce
d (
pat
ien
ts >
75
)
KP
I 9 R
eco
rde
d f
ollo
w-u
p 1
2–
16
we
eks
po
st in
de
x fr
actu
re
KP
I 10
Pat
ien
t co
mm
en
ced
b
on
e t
he
rap
y at
16
we
eks
KP
I 11
Pat
ien
t co
nfi
rme
d
adh
ere
nce
to
bo
ne
th
era
py
at
12
mo
nth
s
2
01
6
20
17
20
16
20
17
20
16
20
17
20
16
20
17
20
16
20
17
20
16
20
17
20
16
20
17
20
16
20
17
20
16
20
17
20
16
20
17
20
16
20
17
Hospital Foundation Trust
Morriston Hospital 2 2 27 45 5 4 100 99 65 63 39 44 70 76 0 0 49 95 31 45 57
Musgrove Park Hospital 0 0 80 77 4 5 79 69 54 53 75 95 55 48 0 0 60 36 46 33 41
North Bristol NHS Trust 7 7 84 77 4 4 69 76 38 1 53 32 38 35 0 1 55 23 29 10 1
North Tees and Hartlepool NHS Foundation Trust
5 5 63 77 3 3 100 100 79 78 66 71 59 54 3 * 0 0 0 0 2
North West Anglia NHS Foundation Trust
2 2 30 29 1 2 91 89 61 66 96 98 38 34 0 0 * 2 * * *
Nottingham University Hospitals 9 4 64 58 0 0 99 99 4 2 31 37 24 47 0 0 0 0 0 0 0
Oxfordshire Fracture Prevention Service
2 2 88 81 3 4 73 74 55 62 46 57 46 63 0 0 56 49 53 46 31
Poole Hospital NHS Foundation Trust
9 0 2 31 6 3 10 62 81 83 49 75 18 34 0 0 * 78 0 30 0
Portsmouth and Southeast Hampshire FLS
13 10 48 49 1 1 92 97 55 0 * 0 9 16 0 0 * 14 0 0 0
Queen Elizabeth Hospital Lewisham
6 13 33 75 2 3 1 1 0 0 * 0 29 12 0 0 * 0 * 0 0
Fracture Liaison Service Database (FLS-DB) annual report. December 2018
32 © Healthcare Quality Improvement Partnership 2018
FLS name
KP
I 1 N
um
ber
of
fiel
ds
wit
h
>20
% m
issi
ng
dat
a
KP
I 2 Id
en
tifi
cati
on
– a
ll
frac
ture
s
KP
I 3 Id
en
tifi
cati
on
– s
pin
e fr
actu
res
KP
I 4 T
ime
to
FLS
ass
essm
en
t w
ith
in 9
0 d
ays
KP
I 5 T
ime
to
DX
A w
ith
in 9
0
day
s
KP
I 6 F
alls
ass
ess
me
nt
do
ne
or
refe
rre
d
KP
I 7 B
on
e t
he
rap
y re
com
me
nd
ed
as
app
rop
riat
e
KP
I 8 S
tre
ngt
h a
nd
bal
ance
com
me
nce
d (
pat
ien
ts >
75
)
KP
I 9 R
eco
rde
d f
ollo
w-u
p 1
2–
16
we
eks
po
st in
de
x fr
actu
re
KP
I 10
Pat
ien
t co
mm
en
ced
b
on
e t
he
rap
y at
16
we
eks
KP
I 11
Pat
ien
t co
nfi
rme
d
adh
ere
nce
to
bo
ne
th
era
py
at
12
mo
nth
s
2
01
6
20
17
20
16
20
17
20
16
20
17
20
16
20
17
20
16
20
17
20
16
20
17
20
16
20
17
20
16
20
17
20
16
20
17
20
16
20
17
20
16
20
17
Royal Derby Hospital 6 7 10 38 7 3 81 83 91 96 * 0 53 64 0 0 5 * 3 * 0
Royal Surrey County Hospital 0 3 33 35 9 10 93 97 75 73 90 89 37 47 0 2 55 61 38 46 *
Royal United Hospital 16 16 8 65 0 0 93 40 45 42 18 0 29 * 14 0 0
Royal Wolverhampton NHS Trust 10 10 21 15 5 * 98 99 0 0 1 0 1 * 0 0 0 0 0 0 0
Salford Royal NHS Foundation Trust
7 12 40 42 2 2 3 0 5 * 24 11 5 1 0 0 75 0 25 0 0
Salisbury NHS Foundation Trust 5 3 48 44 2 17 68 96 64 71 26 77 50 50 0 0 57 33 53 32 26
Sandwell and West Birmingham Hospitals NHS Trust
11 0 10 19 16 14 54 28 10 9 69 97 10 48 0 24 0 13 0 12 0
St George's Hospital 14 15 120 77 11 14 39 25 71 100 59 43 41 29 22 19 58 23 55 23 0
Sunderland Royal Hospital 0 0 65 74 5 5 99 100 69 71 68 70 41 43 9 3 55 72 41 56 *
The Haywood Hospital 0 0 41 57 15 16 77 68 78 75 40 68 39 37 * 0 66 80 47 40 52
The Hillingdon Hospitals NHS Foundation Trust
0 0 20 23 * 2 94 96 69 75 3 52 21 44 35 33 45 52 36 36 49
The Ipswich Hospital NHS Trust 11 11 75 76 2 2 42 43 39 44 51 53 47 44 1 2 24 18 21 15 18
The Rotherham NHS Foundation Trust
0 0 32 36 7 10 43 22 43 18 14 19 35 38 33 29 0 0 0 0 0
Fracture Liaison Service Database (FLS-DB) annual report. December 2018
© Healthcare Quality Improvement Partnership 2018 33
FLS name
KP
I 1 N
um
ber
of
fiel
ds
wit
h
>20
% m
issi
ng
dat
a
KP
I 2 Id
en
tifi
cati
on
– a
ll
frac
ture
s
KP
I 3 Id
en
tifi
cati
on
– s
pin
e fr
actu
res
KP
I 4 T
ime
to
FLS
ass
essm
en
t w
ith
in 9
0 d
ays
KP
I 5 T
ime
to
DX
A w
ith
in 9
0
day
s
KP
I 6 F
alls
ass
ess
me
nt
do
ne
or
refe
rre
d
KP
I 7 B
on
e t
he
rap
y re
com
me
nd
ed
as
app
rop
riat
e
KP
I 8 S
tre
ngt
h a
nd
bal
ance
com
me
nce
d (
pat
ien
ts >
75
)
KP
I 9 R
eco
rde
d f
ollo
w-u
p 1
2–
16
we
eks
po
st in
de
x fr
actu
re
KP
I 10
Pat
ien
t co
mm
en
ced
b
on
e t
he
rap
y at
16
we
eks
KP
I 11
Pat
ien
t co
nfi
rme
d
adh
ere
nce
to
bo
ne
th
era
py
at
12
mo
nth
s
2
01
6
20
17
20
16
20
17
20
16
20
17
20
16
20
17
20
16
20
17
20
16
20
17
20
16
20
17
20
16
20
17
20
16
20
17
20
16
20
17
20
16
20
17
United Lincolnshire Hospitals NHS Trust
11 6 52 2 4 * 0 0 11 6 0 11 0 11 0 0 0
University Hospital Lewisham 7 7 48 48 2 2 81 80 75 77 45 42 41 38 14 16 63 69 45 49 35
University Hospital Llandough 7 6 36 34 3 3 65 75 4 8 14 32 31 41 * 2 49 51 35 33 37
University Hospital of North Durham and Darlington Memorial Hospital
0 3 47 42 2 2 70 29 37 11 2 1 26 24 11 4 67 72 56 50 57
University Hospitals Birmingham NHS Foundation Trust
0 0 67 42 1 1 95 99 39 75 69 94 42 46 5 5 65 41 27 27 18
University Hospitals Bristol NHS Foundation Trust
9 7 91 96 7 8 18 90 74 68 1 4 50 62 0 2 35 34 26 20 26
University Hospitals Southampton NHS Foundation Trust*
#N/A 8 13 4 0 53 2 48 0 44 41
West Berkshire FLS 2 2 36 34 4 16 96 97 82 86 17 24 56 58 7 5 64 56 54 41 47
West Suffolk NHS Foundation Trust
2 5 35 44 6 5 62 71 68 60 59 58 62 52 49 45 81 80 73 72 58
Weston General Hospital* #N/A 0 5 10 94 63 34 53 0 80 51
Fracture Liaison Service Database (FLS-DB) annual report. December 2018
34 © Healthcare Quality Improvement Partnership 2018
FLS name
KP
I 1 N
um
ber
of
fiel
ds
wit
h
>20
% m
issi
ng
dat
a
KP
I 2 Id
en
tifi
cati
on
– a
ll
frac
ture
s
KP
I 3 Id
en
tifi
cati
on
– s
pin
e fr
actu
res
KP
I 4 T
ime
to
FLS
ass
essm
en
t w
ith
in 9
0 d
ays
KP
I 5 T
ime
to
DX
A w
ith
in 9
0
day
s
KP
I 6 F
alls
ass
ess
me
nt
do
ne
or
refe
rre
d
KP
I 7 B
on
e t
he
rap
y re
com
me
nd
ed
as
app
rop
riat
e
KP
I 8 S
tre
ngt
h a
nd
bal
ance
com
me
nce
d (
pat
ien
ts >
75
)
KP
I 9 R
eco
rde
d f
ollo
w-u
p 1
2–
16
we
eks
po
st in
de
x fr
actu
re
KP
I 10
Pat
ien
t co
mm
en
ced
b
on
e t
he
rap
y at
16
we
eks
KP
I 11
Pat
ien
t co
nfi
rme
d
adh
ere
nce
to
bo
ne
th
era
py
at
12
mo
nth
s
2
01
6
20
17
20
16
20
17
20
16
20
17
20
16
20
17
20
16
20
17
20
16
20
17
20
16
20
17
20
16
20
17
20
16
20
17
20
16
20
17
20
16
20
17
Wye Valley NHS Trust 10 4 56 67 1 1 99 98 0 0 66 84 66 87 0 0 * 0 0 0 0
Yeovil District Hospital 2 2 95 95 13 12 59 46 19 27 50 85 55 63 1 4 72 70 52 54 16
Overall (average) 251 295 40 43 4 6 67 70 43 46 40 46 38 43 4 4 41 38 31 27 19 #N/A
Total no. green values 25 31 6 5 1 2 24 30 5 7 8 14 13 18 0 0 3 6 0 0 0 0

This report provides the second national benchmark for the performance of FLSs at the patient level and demonstrates the step change in engagement and quality improvement in England and Wales.
Falls and Fragility Fracture Audit Programme (FFFAP)
A suite of linked national clinical audits, driving improvements in care; managed by the Royal College of Physicians
> Falls Pathway Workstream> Fracture Liaison Service Database (FLS-DB)> National Hip Fracture Database (NHFD)