fractionation, rearrangement, consolidation, reconstruction
TRANSCRIPT

Fractionation, rearrangement,
consolidation, reconstruction
David Sankoff and Chunfang ZhengUniversity of Ottawa
Abstract
The reconstruction of ancestral gene orders based on models ofchromosomal rearrangement mechanisms is complicated when someof the input genomes have undergone whole genome duplications fol-lowed by fractionation, the massive loss of some or most of the dupli-cate genes. We describe a reconstruction protocol that uses maximumweight matching in two phases to overcome the fragmented nature ofresults based on gene adjacency only. We review consolidation methodsfor recovering synteny patterns from fractionated genomes, and showhow to integrate these into the reconstruction protocol. The procedureis applied to reconstruct the common ancestral gene order of grape andpoplar. Simulation of the evolution of comparable genomes reveals thenarrow ranges within which the rearrangement and fractionation pa-rameters must be set in order to emulate statistical attributes of theextant genomes.
1 Introduction
All methods of reconstructing the details of ancestral gene order from anumber of extant genomes are based on common gene adjacencies in thesegenomes, e.g., [1, 2, 3, 4], though they all build on these fundamental datain different ways. As evolution progresses rearrangement events, notablyinversion and reciprocal translocation, successively disrupt gene adjacenciesin individual genomes. In addition, more local events such as gene trans-position from one site to another, gene deletion and gene duplication alsodisrupt some adjacencies and establish others. To the extent that manycommon adjacencies remain unperturbed by these processes in two or moreof the extant genomes, they may contain enough evolutionary signal to allowreconstruction of significant portions of the ancestral order. As evolutioncontinues, rearrangement can eventually degrade this signal so that only
1

relatively short fragments – “ contigs” – of the ancestral order can be in-ferred. Reconstruction methods need to transcend their dependence on geneadjacencies if longer range gene orders are required.
A complication arises if one or more of the extant genomes derive fromwhole genome duplication (WGD) events that occurred since their commonancestor. The duplication itself does not add any new adjacencies or removeany; the pre-existing adjacencies simply continue, but with multiplicity two.What complicates things after WGD is duplicate gene loss on a massivescale, deleting one or the other, but not both, of most duplicate gene pairs,a process called fractionation [5]. The loss of an individual gene y fromcontext . . . xyz . . . will generally destroy two adjacencies xy and yz andcreate a new one xz. This is true whether the loss of the gene is a physicaldeletion of part of the chromosome or by pseudogenization. Even if xy andyz still exist in the homeologous region of the genome, the adjacency xz isan innovation.
WGD and fractionation are particularly prevalent in flowering plants[6], where the slow (tens or hundreds of millions of years) cycle of the twoprocesses also involves the constant excision of excess non-coding DNA, acharacteristic of genome dynamics that distinguishes these organisms fromother evolutionary domains, such as the mammals.
It is misleading to compare fractionated genomes with non-WGD rel-atives in terms of rearrangements only, because these yield systematicallyexaggerated results: the algorithms are forced to account for the missingand the new adjacencies as if they were breakpoints of (non-existent) inver-sions and translocations. And although there have long been methods forincorporating gene loss into genome rearrangement algorithms [7], these arenot designed for the specific scenario of WGD followed by fractionation.
In this paper, we first detail our scaffolding approach [4] to overcomingthe “short contigs” limitations of adjacency-based reconstruction (Section2). After an explanation of the notion of excess adjacencies in Section 3,we briefly review WGD and fractionation (Section 4). In Section 5 we thenpresent an improved consolidation interval strategy [8, 9] for accounting forfractionation in a descendant of a WGD event. We can then reconstruct anancestral gene order for the pre-WGD genome from two or more of its directdescendants, where the genes in these descendant genomes are replaced byconsolidated intervals. Finally, the genes inside these intervals are sorted.
We illustrate in Section 6 using the two plant genomes, from poplar (aWGD descendant) and grapevine (no recent WGD history), to reconstructtheir common “rosid” ancestor, with and without taking into account frac-tionation. We find that the consolidation step removes virtually all the
2
artifactual rearrangements inferred when fractionation is ignored.From this reconstruction, we can calculate the total amount of rear-
rangement from the ancestor to the two extant genomes, how much thiswould be inflated by ignoring fractionation history, the distribution of sizesof consolidation intervals, and the fractionation bias – to what extent aregenes deleted in an asymmetric manner from the two copies of the genomeemerging from WGD.
In Section 7, we set up a simulation of the gene order evolution of poplarand grapevine from the ancestral rosid, with the same numbers of genesand chromosomes, and the same number of single-copy genes (= number ofgene losses) in the simulated poplar genome. We experimented with param-eters reflecting the numbers of rearrangement operations, what proportionof these are short inversions, how many genes are deleted at a time, andhow probable a deletion is to affect one or the other of the original twocopies of the poplar genome. We determined the unique set of evolutionaryparameter values producing the observed values in our analysis of the realplant genomes.
2 Reconstruction
Our reconstruction method requires preprocessing annotated genomic databy a syntenic block detection program such as SynMap in the CoGe plat-form [10, 11] to identify likely orthologous genes in all pairs of the genomesunder study, as well as paralogs in self-comparison of each descendant ofrecent WGD. We then process the combined set of all these orthologies andparalogies with the OMG! procedure [12] to produce homology sets contain-ing at most N paralogous versions of each gene in each 2N -ploid, includingat most one gene in each diploid. We also impose some more or less strin-gent condition such as at least two genes from different genomes in eachset. These homology sets represent candidate genes for the reconstructedancestral genome. The use of stringent criteria in SynMap and OMG! ensurethat each set can be mirrored by only one gene in the eventual reconstruc-tion. Though this lends confidence to the reconstruction of the particulargene and its position in the gene order, it does exclude the possibility ofassigning additional genes, even in a tentative way.
Once we have the set of relevant genes and all the homology relations wereconstruct the ancestral order using Maximum Weight Matching (MWM)[13] at two levels. First we identify all the gene adjacencies (consideringonly the genes within the data set as constructed) in all the genomes and
3

subgenomes, each homology set determining two vertices of a graph G1,corresponding to the 5’ and 3’ ends of the genes involved. We weight eachadjacency – an edge in G1 – according to how many times homologs of thetwo genes involved are adjacent. with that particular 5’-3’ orientation, inthe data, possibly taking into account phylogenetic or data quality consider-ations, depending on the particular biological problem being analyzed. TheMWM then chooses an optimal subset of adjacencies. This gives a set of an-cestral “contigs”. A small number of these may be circular; we linearize eachof these by discarding their lowest weight adjacency – this has a minusculeeffect on the total weight of the matching.
For the second application of MWM, we use the contigs as vertices in agraph G2. Each contig has a mean position (as measured in gene order posi-tion) on a chromosome in one or more of the input genomes or subgenomes.These positions order the contigs on chromosomes. The few ambiguous con-tigs, i.e., containing large proportions of genes originating in two or morechromosomes in the same genome or subgenome are discarded. In addition,to ensure a level of syntenic robustness, if a contig does not have a minimumnumber of genes in at least one genome, we discard it. Thresholds are set sothat losing these small contigs plus the ambiguous ones satisfies a trade-offbetween accuracy and gene inclusiveness.
Two successive contigs on a chromosome are considered adjacent, andare joined by an edge in G2 for the purposes of the second MWM. The ori-entation of a contig on a chromosome is determined by whether the genes itcontains are in largely increasing or decreasing gene order on the subgenomein question. The weights may be the same as in the first MWM, or may bedifferent. The output from this algorithm is a set of “scaffolds”, namely aseries of contigs alternating with gaps, each corresponding to a chromosomeor a fragment of a chromosome in the ancestral genome.
Linearizing circular scaffolds turns out to be a quantitatively more im-portant problem than with contigs, Nevertheless, we have found that shift-ing the adjacency criterion in mid-analysis from gene adjacency to contigproximity is an effective way of transcending the short contig limitation ofancestral reconstruction [4].
Though the principle of MWM has been used for ancestral genome re-construction in a variety of theoretical contexts [14, 15, 16], it is also wellsuited to practical problem of scaling up from the gene adjacency-basedproblem of constructing contigs to the contig-based problem of constructingscaffolds. And as we shall see, since we are using statistics on gene adjacen-cies in evaluating reconstructions, an MWM approach feeds naturally intothis step.
4
3 Excess adjacencies as a measure of rearrange-ment.
Independent rearrangements (inversions and reciprocal translocations) innewly diverging sister species with n genes tends to increase the total num-ber of different adjacencies in the two genomes linearly at an initial rate of2r, where r is the total number of rearrangements in the two genomes (r/2in each). At the same time, the number of adjacencies in common decreasesat the same rate. If one of the genomes undergoes WGD soon after speci-ation or as part of speciation, the total number of different adjacencies inthe two genomes still increases at a rate of 2r. (The number of commonadjacencies only decreases at a rate of r since rearrangement changes in theWGD descendant only affects one of the two identical adjacencies, leavingthe other intact, so that only rearrangements in the other genome decreasesthe number of common adjacencies.) In either case – whether or not one ofthe genomes is a WGD descendant – the total number of different adjacen-cies in the two genomes, in excess of n, is an accurate measure of the degreeof evolutionary divergence [8].
The advantage of this way of measuring evolutionary divergence overedit distances based on a repertoire of rearrangement operations, and overbreakpoint distances, is that it applies equally well to comparing genomeswith one or more WGD in their recent history as to those with no suchhistory, and that it requires no special extension, constraint or modificationwherever it is applied.
4 Whole genome duplication and fractionation
During fractionation, gene adjacency disruption follows from the randomchoice of which of the two copies is deleted, i.e., which copy of a chromo-some retains the remaining single copy of the gene. This was first madeexplicit by Wolfe and Shields [17] in their original demonstration of “recip-rocal gene loss” following the ancient WGD of Saccharomyces cerevisiae:“... this is the result of random deletion of individual duplicated genes fromone or other chromosome subsequent to the initial duplication of the wholeregion.” The pattern was further detailed later by the comparison of theS. cerevisiae gene order with that of related diploid yeasts [18, 19], whereit was called“interleaving”, while Freeling [5] coined the term “fractiona-tion” in the context of plant genomics. Gordon et al [20] and more recently,Ouangraoua et al. [21], have termed it “double synteny”.
5

The phylogenomic extent of fractionation and the formal treatment of thedeletion process have been the subject of numerous papers [22, 23, 24, 25, 26].
1 2 3 4 5 6 7 8 9!
1 2 3 4 5 6 7 8 9!1 2 3 4 5 6 7 8 9!
1 3 5 7!2 3 4 6 9 8! 7 6 5 4 3 2 1 8 9!
fragment of!ancestor genome!
whole genome duplication!
fractionation and rearrangement!rearrangement!
WGD descendant! descendant unaffected by WGD!
Figure 1: Fractionation leading to different adjacencies in WGD descendantand unaffected genome. The adjacencies between genes 1 and 3, 3 and 5, 5and 7 as well as 4 and 6 in the WGD descendant are caused by fractionation.The adjacency between 1 and 8 in the unaffected genome is caused by areversal rearrangement, and the adjacency between genes 6 and 9 in theWGD descendant is caused by deletion of 7 and a rearrangement. Only twoof the adjacencies are caused by rearrangement, but ignoring fractionationwould lead to the inference of at least three more rearrangements to accountfor the different sets of adjacencies in the two genomes.
When a run of adjacent duplicate pairs lose a subset of their redundant genesfrom one chromosome and another, disjoint, subset from the other copy, asin Fig. 1, inference of the rearrangement distances between the WGD de-scendant and an unduplicated sister genome necessarily suggests that thereare rearrangement breakpoints where adjacency no longer exists betweenthe two subsets of single-copy survivors. This exaggerates the inferred num-ber of reciprocal translocations and artificially inflates the overall amountof chromosomal rearrangement inferred between the two sister genomes.
We can correct this through the identification and isolation of “fraction-ation intervals”, regions in both the WGD descendant and its unduplicatedsister genome that have become partly or entirely single-copy in the for-mer and may or may not have been rearranged internally, but have (so far)been unaffected in both genomes by rearrangements exchanging genes fromwithin the interval and genes external to the interval. The statistical prop-erties of the intervals bear on current topics of interest in plant evolutionarygenomics, whether duplicated genes are silenced or deleted one by one or
6

through the deletion of longer stretches of DNA [22, 23, 24] and whether afractionation regions tends to lose genes largely from one of the homeologouschromosomal segments or equally from the two [27].
ancestor)genome)
genome)unaffected)by)WGD)
r/2))rearrangements)
WGD)event)
r/2))rearrangements)
d))genes)deleted)
WGD)descendant)
Figure 2: Evolutionary scheme for simulating the production of excess adja-cencies in a WGD descendant and an unaffected sister genome, by rearrange-ment and fractionation in the former, and rearrangement only in the latter.Ancestor contained 24,000 genes, divided among 20 chromosomes, Simula-tions carried out with number of random rearrangements (10% reciprocaltranslocations, 90% inversions) r = 0, 600, 1800, 3000, 4200 and random dele-tions d = 0, 3000, · · · , 21, 000.
5 Consolidation
Ideas about combining the information from the two fractionated regions inreconstructing ancestral genomes may be found in [5] for plants, in [20] foryeast and, more formally, in [21] for ancient vertebrates.
We have been developing a series of consolidation algorithms to identifyand handle all instances of fractionation in a WGD descendant. The first ofthese [8] focuses on detecting and accounting for pairs of regions of single-copy genes in the WGD descendant that contain no genes in common (sincethe genes concerned are single-copy) but whose combined (or consolidated[5]) gene content is exactly the same as some contiguous region in a relatedgenome unaffected by the WGD. A recent improvement in collaborationwith Katharina Jahn and Jakub Kovac has linear run time, allows duplicategenes to be shared by the two intervals in the WGD descendant, and alsoextends the analysis to whole genome triplication and higher polyploidies
7
[9]. Current work by Jahn solves the more difficult problem of compar-ing two fractionated sister genomes while dispensing with any necessity ofreferencing an unduplicated genome.
600# 600#600#
600#600#
600#600# 600#
1800#1800#
1800#
1800#
1800#
1800#
1800# 1800#
3000#3000#
3000#
3000#
3000#
3000#
3000# 3000#4200#
4200#
4200#
4200#
4200#
4200#
4200# 4200#
600#
600#
600#
600#
600#
600#
600#
600#
1800#
1800#
1800#
1800#
1800#
1800#
1800# 1800#
3000#
3000#
3000#
3000#
3000#
3000#
3000# 3000#
4200#
4200#
4200#
4200#
4200#
4200#
4200# 4200#
600# 600#600#
600#600#
600#600# 600#
1800#1800#
1800#
1800#
1800#
1800#
1800#
1800#
3000#3000#
3000#
3000#
3000#
3000#
3000#
3000#
4200#4200#
4200#
4200#
4200#
4200#
4200#
4200#
600#
600#
600#
600#
600#
600#
600#
600#
1800#
1800#
1800#
1800#
1800#
1800#
1800#
1800#
3000#
3000#
3000#
3000#
3000#
3000#
3000#
3000#
4200#
4200#
4200#
4200#
4200#
4200#
4200#
4200#
0#
2000#
4000#
6000#
8000#
10000#
12000#
14000#
16000#
)3000# 0# 3000# 6000# 9000# 12000# 15000# 18000# 21000# 24000#
addi/o
nal#num
ber#o
f#differen
t#adjacen
cies#
duplicate#genes#deleted#
before#consolida/on##
######################################################################number#of###############################################################rearrangements#
####
a@er#consolida/on#
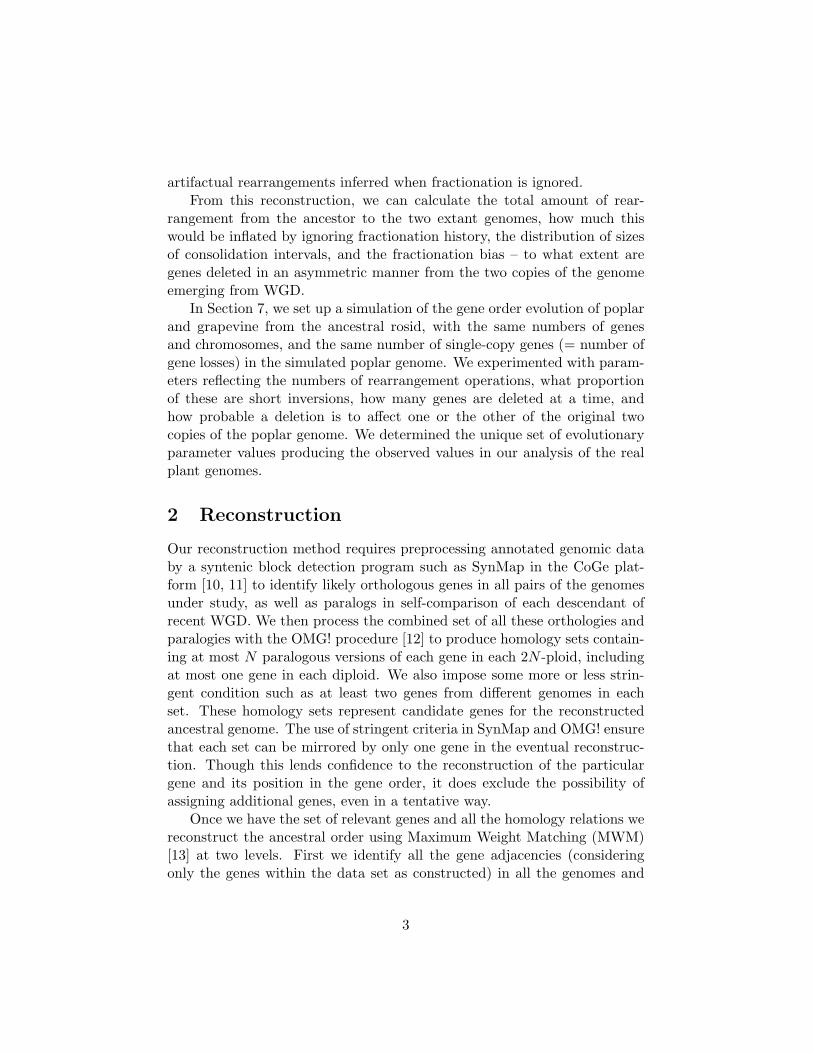
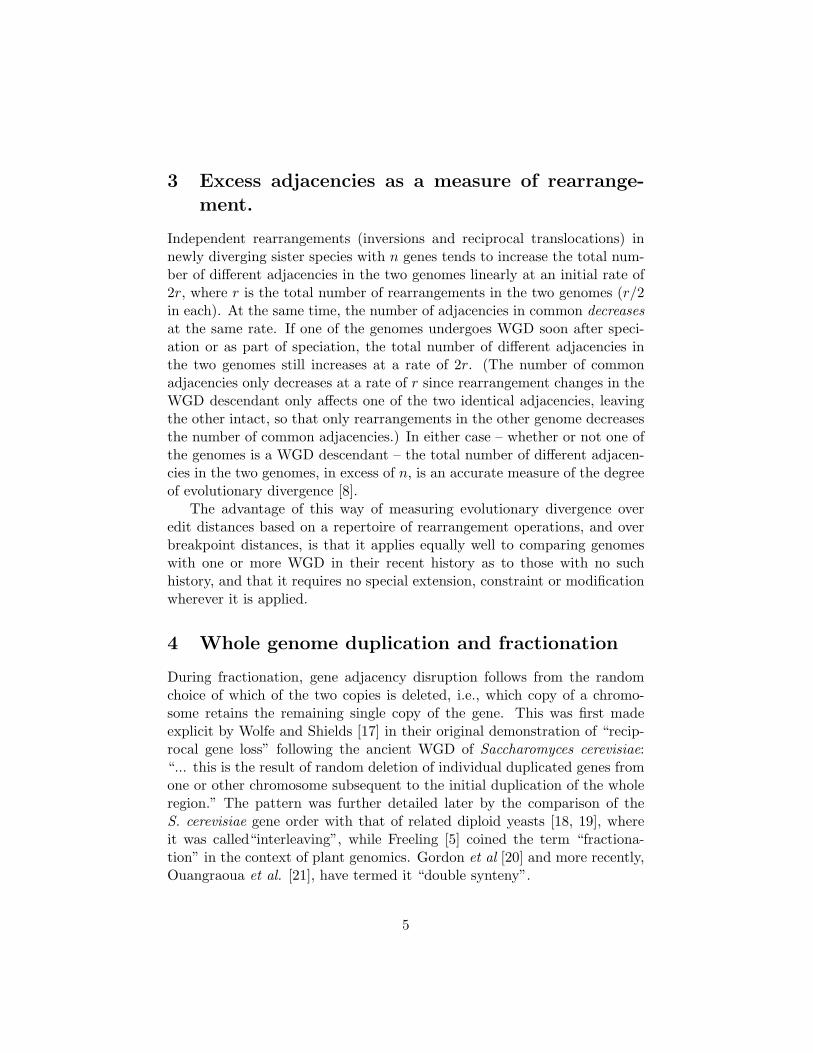
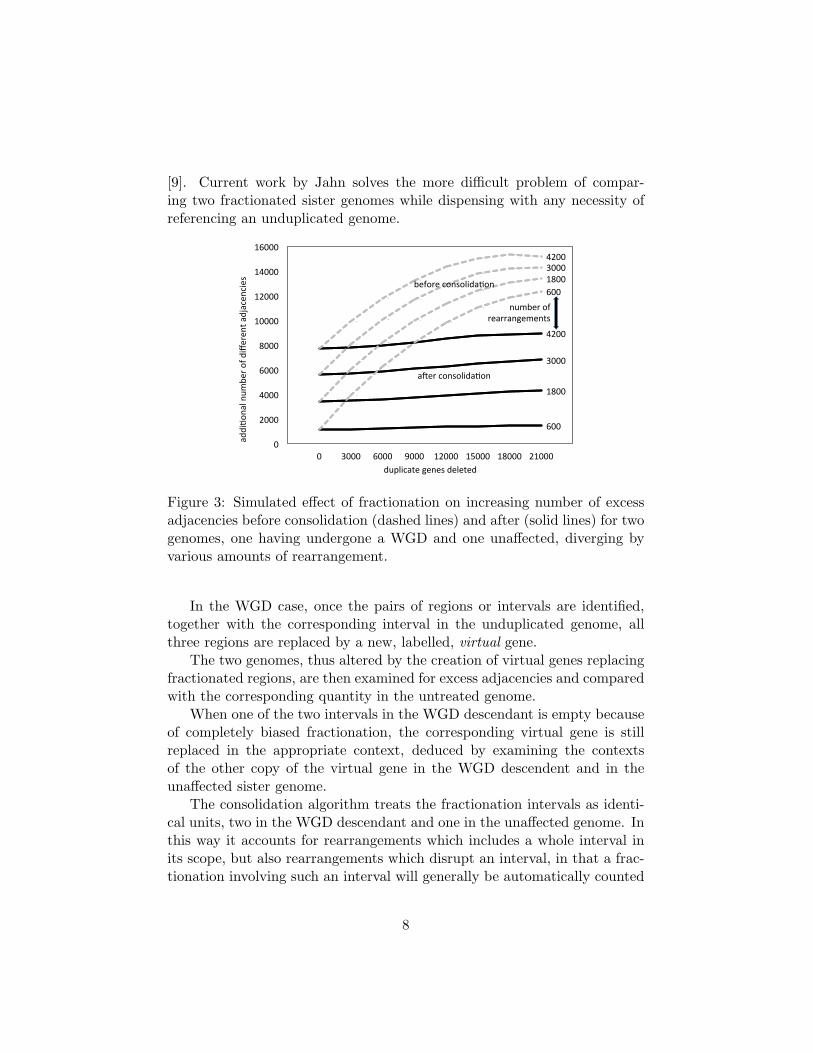
Figure 3: Simulated effect of fractionation on increasing number of excessadjacencies before consolidation (dashed lines) and after (solid lines) for twogenomes, one having undergone a WGD and one unaffected, diverging byvarious amounts of rearrangement.
In the WGD case, once the pairs of regions or intervals are identified,together with the corresponding interval in the unduplicated genome, allthree regions are replaced by a new, labelled, virtual gene.
The two genomes, thus altered by the creation of virtual genes replacingfractionated regions, are then examined for excess adjacencies and comparedwith the corresponding quantity in the untreated genome.
When one of the two intervals in the WGD descendant is empty becauseof completely biased fractionation, the corresponding virtual gene is stillreplaced in the appropriate context, deduced by examining the contextsof the other copy of the virtual gene in the WGD descendent and in theunaffected sister genome.
The consolidation algorithm treats the fractionation intervals as identi-cal units, two in the WGD descendant and one in the unaffected genome. Inthis way it accounts for rearrangements which includes a whole interval inits scope, but also rearrangements which disrupt an interval, in that a frac-tionation involving such an interval will generally be automatically counted
8
as two intervals, resulting in two virtual units instead of one. What theconsolidation algorithm does not account for, however, are rearrangementsoccurring completely within one of the fractionation intervals.
To correct for this, within each fractionation region, we first considerall the adjacencies in the three component intervals. We find an order forall the genes in the interval in the reconstructed ancestor genome, suchthat the following condition is satisfied. The induced sub-order determinedby the subset of the genes from each of the three intervals in the extantgenomes, two in the WGD descendant and one in the unaffected genome,has a minimum number of excess adjacencies when compared with the extantorder, summed over all three intervals. We add the number of these interval-internal adjacencies to the set of adjacencies produced by the consolidationalgorithm.
Figure 2 shows a scheme for simulating fractionation process followinga WGD event. Figure 3, adapted from [8], shows how the consolidationalgorithm wipes out almost all the bias caused by fractionation.
6 Grape and poplar
We applied our method to the genome of poplar (Populus trichocarpa) [28],which descends from a WGD event some 70 million years ago, and grape(Vitis vinifera) [29] , which has undergone no WGD since the two genomesdiverged some 130 million years ago.
As can be seen in Table 1, we discovered that a good proportion, over25%, of the apparent rearrangement in the poplar lineage, is actually at-tributable to fractionation. This is remarkable since only about 20 % of thepoplar genome is made up of single-copy regions.
Another advantage of consolidation is that it resolves a major part ofthe “short contigs” problem of the MWM approach. The first stage ofthe MWM in the reconstruction before consolidation produced 2598 contigswith 12,494 genes. But once we applied the consolidation algorithm only967 contigs were produced by the MWM, lengthening the average contigsize by a factor of 2.6.
The benefits were less striking but still non-negligible in the second stageMWM, itself designed to overcome the problem of short contigs. Here, in-stead of 43 scaffolds in the reconstruction before consolidation, seven addi-tional “joins” appeared, for a reduction to 36 scaffolds in the consolidateddata.
9

genes in comparison grape poplar ancestorsingle copies 12,494 4,282 8,631in syntenic pairs 0 2 × 8212 = 16, 424 0total 12,494 20,706 8,631adjacency statistics before fractionation analysisadjacencies 12,475 20,676 8,588distinct (a) 12,475 16,165 8,588 (b)distinct overall (c) 19,446excess (c-a) 6,971 (55.9%) 3,281 (20.3%)with ancestor (d) 9,390 11,094 totalexcess (d-b) 802 (9.3%) 2,506 (29.2%) 3,308 (38.5%)virtual genes after fractionation analysis and consolidationfractionation intervals 2,462 1,888single copies 10,674 0 81431
in syntenic pairs 0 2× 10, 6742 = 21, 348 0total 10,674 21,348 8143adjacency statistics after consolidationadjacencies 10,655 21,318 8,107distinct (a) 10,655 13,309 8,107 (b)distinct overall (c) 15,278excess (c-a) 4,623 (43.4%) 1,969 (14.8%)with ancestor (d) 9,079 9,844 totalexcess (d-b) 972 (12.0%) 1,737 (21.4%) 2,709 (33.4%)
1 counting genes within virtual genes: 9502.2 includes duplicate genes (not in a fractionation interval) and two copies ofvirtual genes even if only one gene-containing interval was found in poplar.
Table 1: Statistics on the reconstruction of the common ancestor of grapeand poplar, before and after taking into account consolidation of the frac-tionation intervals. Of note is the decrease in the percentage of excess ad-jacencies (in boldface), representing artifactual rearrangements when frac-tionation is not taken into account.
10

7 Simulations
In our complex model of genome divergence through rearrangement, WGDand fractionation can only be validated by seeing how many aspects of thesimulated output genomes match those of the real genome, with a mini-mum of model parameters. The number of genes in the two genomes, andthe number of single-copy genes are fixed quantities, determined by the realgenomes. Rearrangement can be carried out by a mixture of (1− θ)ρ shortinversions, where the number of genes in the scope of the inversion is geomet-rically distributed with mean µ, plus θρ unbounded rearrangements whoseendpoints are chosen randomly on chromosomes. In each deletion eventthe number of contiguous genes lost is geometrically distributed with meanλ. Finally, we introduce a parameter π for fractionation bias, the prob-ability that a deletion takes place in a specified “subgenome”, one of thetwo original copies of the duplicated ancestral genome created by the WGDevent. There are thus five parameters that must be set for each simulation,ρ, θ, µ, λ, π plus the given structure of the ancestral genome, determined inour case, by the number of homologs in the poplar and grape genomes, andthe number of single-copy genes in poplar. To find the appropriate values of
parameters ρ θ µ λ πbest values 1570 0.05 2.47 1.32 0.70
Table 2: Best parameter values.
real genomes 50 simulationsbefore after before afterconsolidation consolidation
total adjacencies (R) 19,538 15,363 19,563 15,298fractionation intervals (N) 2,462 2,458
Table 3: Simulation statistics compared to real genomes. In each case thestandard deviation over 50 samples was less than 1% of the mean of thevariable.
the parameters to simulate the data, we can observe the total number of ad-jacencies between the output genomes, both before consolidation (R1) andafter consolidation (R2). We can measure the average size L of the frac-tionation intervals (or, equivalently, the number of intervals N , since the
11

product of the two quantities is fixed). And we can also indirectly observethe fractionation bias P , which is the deviation from an even split of thedeleted genes of from the two copes of the fractionation interval in poplar orits simulation. More specifically we can measure P (1), P (2), · · · in pairs ofpoplar fractionation intervals totaling 1, 2, · · · genes respectively. We termthis “indirect” since we do not have access in the real poplar genome to theidentity of genes in terms of their origin in one of the other “subgenomes”produced by the WGD event. We simply measure how many more genesthere are in the larger fractionation interval compared to its counterpart, avalue that is larger, on the average than the “true” bias.
1"
10"
100"
1000"
10000"
1$2" 3$4" 5$6" 7$8" 9$10" 11$12" 13$14" 15$16" 17$18" 19$20" 21$22" 23$24"
numbe
r"of"intervals"
size"of"interval"
poplar/grape"
simula?on"
Figure 4: Size of poplar/grape fractionation regions compared to simulationswith parameters set so that reconstruction statistics match.
We carried out a cyclical search, one parameter at a time, to find settings(Table 2) that gave the same average R1, R2 and N over 50 simulations asthe values calculated from grape and poplar (Table 3). We adjusted π sothat the plot of the average simulated P (i) resembled that from the realgenomes.
Examining the consolidated regions detected by our algorithm, thereare a number of regions much longer than those in the simulations (Figure4), suggesting a non-independence of deletion events affecting neighboring
12

0"
0.5"
1"
1.5"
2"
2.5"
3"
3.5"
4"
4.5"
1" 2" 3" 4" 5" 6" 7" 8" 9" 10"
frac1o
na1o
n"bias"
genes"in"interval"
p=0.55"
p=0.7"
p=0.85"
poplar"
Figure 5: Discrepancy in pairs of poplar intervals in the number of genes,compared with simulations with fractionation bias p = 0.55, 0.70, 0.85. Dele-tion event size geometrically distributed with mean 1.3. Jagged nature ofgraphs due not to statistical fluctuation but to measurement of discrepancyfrom an “even” split, which is necessarily calculated slightly differently foreven and odd totals of genes in the fractionation intervals.
genes, and clear tendency for genes to be deleted in one of the two homeologs,as would be predicted by the recent theory of subgenome dominance [27].
In Figure 5, a high value (p = 0.85) for the fractionation bias fits the datafrom poplar well only for long single-copy intervals, which are relatively rare(see Figure 4), but a lower value (p = 0.70) fits the more numerous shortintervals better. This is strong evidence that the selection of the variousdeletion sites does not proceed entirely independently, but rather that thereare some regions of the genome that are particularly prone to becomingsingle-copy.
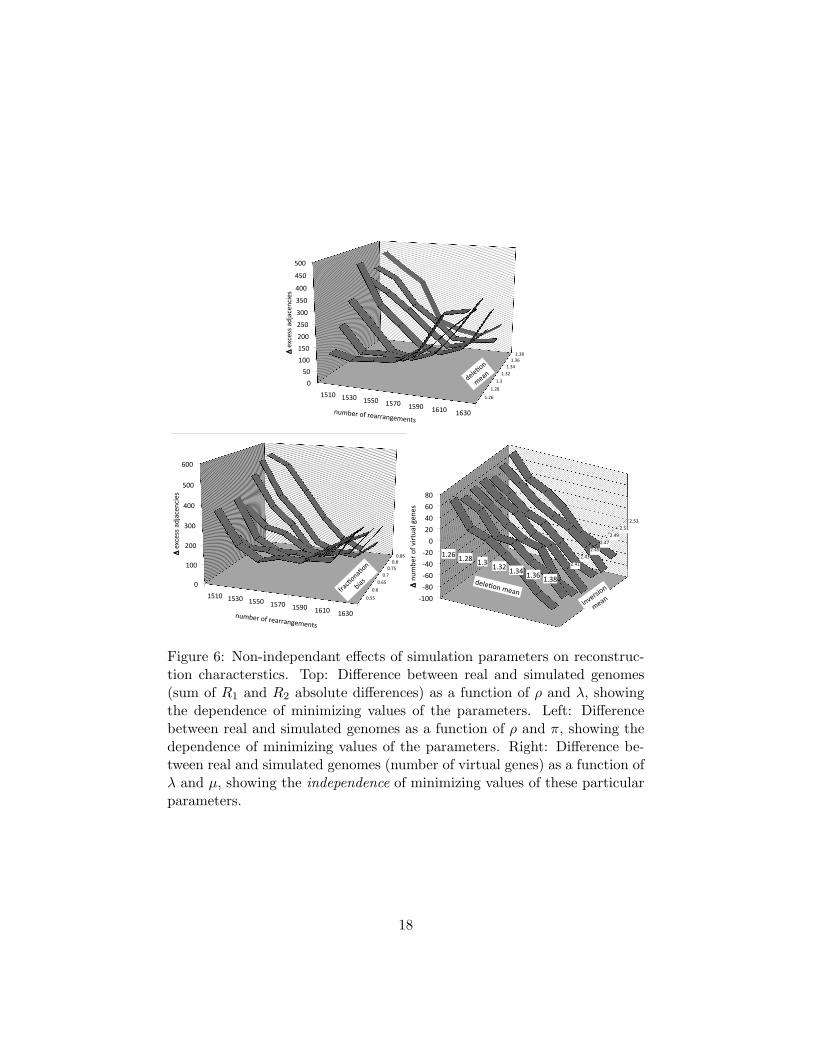
There are more parameters (five) to set in the simulations than quantitiesto observe (four) (though P is a vector, we can only observe its trend withany accuracy, not the individual P (i)), so there is inherently some non-uniqueness associated with the best choice of parameters, as suggested inFigure 6. Nevertheless, the parameters can only take on values in a very
13
restricted region. For example, outside a narrow range ρ produces too fewor too many adjacencies, no matter what the settings are for the otherparameters. And given ρ, the number of intervals N is sensitive to bothparameters µ and λ.
8 Conclusions
The most important result from this work is that consolidation has theeffect of greatly increasing the length of ancestral contigs output from thefirst MWM stage. The scaffolding approach already compensates for theshort contigs problem, but combining the two strategies yields even longerscaffolds.
We have shown that we can closely simulate the gene order evolution of aWGD descendant and an unaffected sister genome, lending some confidenceto our reconstruction of their common ancestor. We do detect, however, asignificant number of long single-copy intervals, with highly biased fraction-ation, in the poplar genome, lying well outside the scope of our simulations.Whether there are biological connections among the genes in these inter-vals, and whether there are genes with no detected homologies in grape thatare also present as single copies in these intervals, are questions for furtherstudy.
Further work will also involve improvements in parameter estimationas well as the identification of other measurable properties of evolutionaryscenarios, restoring the balance between the number of parameters and thenumber quantities observed, in order to dispel problems of non-uniqueness.
This work has been undertaken as part of a project to formally analyzeaspects of WGD fractionation, especially in the context of angiosperm evo-lution. Other directions include allowing duplicates in pairs of fractionationintervals, treating ploidies of higher degree than WGD, dispensing with thenecessity of an unaffected sister genome, as well as a probabilistic model ofthe distribution of fractionation interval sizes.
Acknowledgements
We thank Katharina Jahn for many valuable comments and suggestionsduring the work reported here, and Vic Albert and Eric Lyons for guid-ance to current trends in angiosperm genomics. Research supported in partby grants from the Natural Sciences and Engineering Research Council of
14
Canada (NSERC). DS holds the Canada Research Chair in MathematicalGenomics.
References
[1] Chauve C, Tannier E: A methodological framework for the reconstruc-tion of contiguous regions of ancestral genomes and its application tomammalian genomes. PLoS Computational Biology 4: 11, 2008.
[2] Alekseyev MA, Pevzner PA: Breakpoint graphs and ancestral genomereconstructions. Genome Research 19: 943–957, 2009.
[3] Gagnon Y, Blanchette M, El-Mabrouk M: A flexible ancestral genomereconstruction method based on gapped adjacencies. BMC Bioinfor-matics 13: S19, S4, 2012.
[4] Zheng C, Chen E, Albert VA, Lyons E, Sankoff D: Ancient eudicothexaploidy meets ancestral eurosid gene order. BMC Genomics 14, inpress, 2013.
[5] Langham RJ, Walsh J, Dunn M, Ko C, Goff SA, Freeling M: Genomicduplication, fractionation and the origin of regulatory novelty. Genetics166: 935–945, 2004.
[6] Soltis DE, Albert VA, Leebens-Mack J, Bell CD, Paterson AH, ZhengC, Sankoff D, dePamphilis CW, Wall PK, Soltis PS: Polyploidy andangiosperm diversification. American Journal of Botany 96: 336–348,2009.
[7] El-Mabrouk N: Genome rearrangement by reversals and inser-tions/deletions of contiguous segments. In Giancarlo R, Sankoff D(eds.): Combinatorial Pattern Matching (CPM 2000), Proceedings ofthe 11th Annual Symposium. Lecture Notes in Computer Science 1848:222–234, 2000.
[8] Sankoff D, Zheng C: Fractionation, rearrangement and subgenome dom-inance. Bioinformatics 28: 402–408, 2012.
[9] Jahn K, Zheng C, Kovac J, Sankoff D: A consolidation algorithm forgenomes fractionated after higher order polyploidization. BMC Bioin-formatics 13: S19, S8, 2012.
15
[10] Lyons E, Freeling M: How to usefully compare homologous plant genesand chromosomes as DNA sequences. The Plant Journal 53: 661–673,2008.http://genomevolution.org/CoGe/
[11] Lyons E, Pedersen B, Kane J, Alam M, Ming R, Tang H, Wang X,Bowers J, Paterson A, Lisch D, Freeling M: Finding and comparingsyntenic regions among Arabidopsis and the outgroups papaya, poplarand grape: CoGe with rosids. Plant Physiology 148: 1772–1781, 2008.
[12] Zheng C, Swenson K, Lyons E, Sankoff D: OMG! Orthologs in multi-ple genomes C competing graph-theoretical formulations. In PrzytyckaTM, Sagot M-F (eds.) Algorithms in Bioinformatics, Proceedings ofthe 11th International Workshop. Lecture Notes in Computer Science6833: 364–375, 2011.
[13] Galil Z: Efficient algorithms for finding maximum matching in graphs.ACM Computing Surveys 18:23–38, 1986.
[14] Tannier E, Zheng C, Sankoff D: Multichromosomal median and halv-ing problems under different genomic distances. BMC Bioinformatics10:120, 2009.
[15] Warren R, Sankoff D: Genome aliquoting revisited. Journal of Compu-tational Biology 18:1065–1075, 2011.
[16] Manuch J, Patterson M, Wittler R, Chauve C, Tannier E: Linearizationof ancestral multichromosomal genomes. BMC Bioinformatics 13: S19,S11, 2012.
[17] Wolfe KH, Shields DC: Molecular evidence for an ancient duplicationof the entire yeast genome. Nature 387: 708–713, 1997.
[18] Dietrich FS, Voegeli S, Brachat S, Lerch A, Gates K, Steiner S, MohrC, Pohlmann R, Luedi P, Choi S, Wing RA, Flavier A, Gaffney TD,Philippsen P: The Ashbya gossypii genome as a tool for mapping theancient Saccharomyces cerevisiae genome. Science 304: 304–307, 2004.
[19] Kellis M, Birren BW, Lander ES: Proof and evolutionary analysis of an-cient genome duplication in the yeast Saccharomyces cerevisiae. Nature428: 617–624, 2004.
16

[20] Gordon JL, Byrne KP, Wolfe KH: Additions, losses, and rearrange-ments on the evolutionary route from a reconstructed ancestor to themodern Saccharomyces cerevisiae genome. PLoS Genetics 5: e1000485,2009.
[21] Ouangraoua A, Tannier E, Chauve C: Reconstructing the architectureof the ancestral amniote genome. Bioinformatics 27: 2664–2671, 2011.
[22] Byrnes JK, Morris GP, Li W-H: Reorganization of adjacent gene re-lationships in yeast genomes by whole-genome duplication and genedeletion. Molecular Biology and Evolution 23: 1136–1143, 2006.
[23] van Hoek MJ, Hogeweg P: The role of mutational dynamics in genomeshrinkage. Molecular Biology and Evolution 24: 2485–2494.
[24] Sankoff D, Zheng C, Zhu Q: The collapse of gene complement followingwhole genome duplication. BMC Genomics 11: 313, 2010.
[25] Wang B, Zheng C, Sankoff D: Fractionation statistics. BMC Bioinfor-matics 12: S9, S5, 2011.
[26] Sankoff D, Zheng C, Wang B: A model for biased fractionation afterwhole genome duplication. BMC Genomics 13:S1, S8, 2012.
[27] Schnable J, Springer N, Freeling M: Differentiation of the maizesubgenomes by genome dominance and both ancient and ongoing geneloss. Proceedings of the National Academy of Sciences USA 108:4069–4074, 2011.
[28] Tuskan GA, Difazio S, Jansson S, Bohlmann J, Grigoriev I, HellstenU, Putnam N, Ralph S, Rombauts S, Salamov A et al.: The genomeof Black Cottonwood, Populus trichocarpa (Torr. & Gray). Science313:1596–1604, 2006.
[29] Jaillon O, Aury JM, Noel B, Policriti A, Clepet C, Casagrande A,Choisne N, Aubourg S, Vitulo N, Jubin C et al.: The grapevinegenome sequence suggests ancestral hexaploidization in major an-giosperm phyla. Nature 449: 463–467, 2007.
17
1.26%
1.28%
1.3%1.32%1.34%1.36%1.38%
0%50%
100%150%200%
250%
300%
350%
400%
450%
500%
1510% 1530% 1550% 1570% 1590% 1610% 1630%
Δ!excess!a
djacen
cies%
number%of%rearrangements%
0.55$
0.6$0.65$
0.7$0.75$0.8$0.85$
0$
100$
200$
300$
400$
500$
600$
1510$ 1530$ 1550$ 1570$ 1590$ 1610$ 1630$
Δ!excess!a
djacen
cies$
number$of$rearrangements$
2.41%2.43%
2.45%2.47%
2.49%2.51%
2.53%
*100%*80%*60%*40%*20%0%
20%40%60%80%
1.26% 1.28% 1.3% 1.32% 1.34% 1.36% 1.38%
Δ num
ber%o
f%virtual%gen
es%
Figure 6: Non-independant effects of simulation parameters on reconstruc-tion characterstics. Top: Difference between real and simulated genomes(sum of R1 and R2 absolute differences) as a function of ρ and λ, showingthe dependence of minimizing values of the parameters. Left: Differencebetween real and simulated genomes as a function of ρ and π, showing thedependence of minimizing values of the parameters. Right: Difference be-tween real and simulated genomes (number of virtual genes) as a function ofλ and µ, showing the independence of minimizing values of these particularparameters.
18