fourth quarter 2016 investor presentation - enable...
TRANSCRIPT

Enable Midstream Partners, LP
Fourth Quarter 2016 Investor Presentation

Non-GAAP Financial MeasuresThe Partnership has included the non-GAAP financial measures gross margin, Adjusted EBITDA, Adjusted interest expense,
distributable cash flow and distribution coverage ratio in this presentation based on information in its condensed consolidated
financial statements.
Gross margin, Adjusted EBITDA, Adjusted interest expense, distributable cash flow and distribution coverage ratio are
supplemental financial measures that management and external users of the Partnership’s financial statements, such as industry
analysts, investors, lenders and rating agencies may use, to assess:
• The Partnership’s operating performance as compared to those of other publicly traded partnerships in the midstream energy
industry, without regard to capital structure or historical cost basis;
• The ability of the Partnership’s assets to generate sufficient cash flow to make distributions to its partners;
• The Partnership’s ability to incur and service debt and fund capital expenditures; and
• The viability of acquisitions and other capital expenditure projects and the returns on investment of various investment
opportunities.
This presentation includes a reconciliation of gross margin to total revenues, Adjusted EBITDA and distributable cash flow to net
income attributable to limited partners, Adjusted EBITDA to net cash provided by operating activities and Adjusted interest expense
to interest expense, the most directly comparable GAAP financial measures, as applicable, for each of the periods indicated.
Distribution coverage ratio is a financial performance measure used by management to reflect the relationship between the
Partnership's financial operating performance and cash distributions. The Partnership believes that the presentation of gross
margin, Adjusted EBITDA, Adjusted interest expense, distributable cash flow and distribution coverage ratio provides information
useful to investors in assessing its financial condition and results of operations. Gross margin, Adjusted EBITDA, Adjusted interest
expense, distributable cash flow and distribution coverage ratio should not be considered as alternatives to net income, operating
income, revenue, cash flow from operating activities, interest expense or any other measure of financial performance or liquidity
presented in accordance with GAAP. Gross margin, Adjusted EBITDA, Adjusted interest expense, distributable cash flow and
distribution coverage ratio have important limitations as analytical tools because they exclude some but not all items that affect the
most directly comparable GAAP measures. Additionally, because gross margin, Adjusted EBITDA, Adjusted interest expense,
distributable cash flow and distribution coverage ratio may be defined differently by other companies in the Partnership’s industry,
its definitions of gross margin, Adjusted EBITDA, Adjusted interest expense, distributable cash flow and distribution coverage ratio
may not be comparable to similarly titled measures of other companies, thereby diminishing their utility.
2

Forward-looking Statements
This presentation and the oral statements made in connection herewith may contain “forward-looking statements” within
the meaning of the securities laws. All statements, other than statements of historical fact, regarding Enable Midstream
Partners’ (“Enable”) strategy, future operations, financial position, estimated revenues, projected costs, prospects, plans
and objectives of management are forward-looking statements. These statements often include the words “could,”
“believe,” “anticipate,” “intend,” “estimate,” “expect,” “project,” “forecast” and similar expressions and are intended to
identify forward-looking statements, although not all forward-looking statements contain such identifying words. These
forward-looking statements are based on Enable’s current expectations and assumptions about future events and are
based on currently available information as to the outcome and timing of future events. Enable assumes no obligation to
and does not intend to update any forward-looking statements included herein. When considering forward-looking
statements, which include statements regarding future commodity prices, future capital expenditures and our financial
and operational outlook for 2017, among others, you should keep in mind the risk factors and other cautionary
statements described under the heading “Risk Factors” and elsewhere in our SEC filings. Enable cautions you that these
forward-looking statements are subject to all of the risks and uncertainties, most of which are difficult to predict and many
of which are beyond its control, incident to the ownership, operation and development of natural gas and crude oil
infrastructure assets. These risks include, but are not limited to, contract renewal risk, commodity price risk,
environmental risks, operating risks, regulatory changes and the other risks described under “Risk Factors” and
elsewhere in our SEC filings. Should one or more of these risks or uncertainties occur, or should underlying assumptions
prove incorrect, Enable’s actual results and plans could differ materially from those expressed in any forward-looking
statements.
3

1. Enable Midstream Overview
2. Gathering and Processing Segment Overview
3. Transportation and Storage Segment Overview
4. 2017 Outlook
5. Appendix
4
Contents

1. Enable Midstream Overview
5
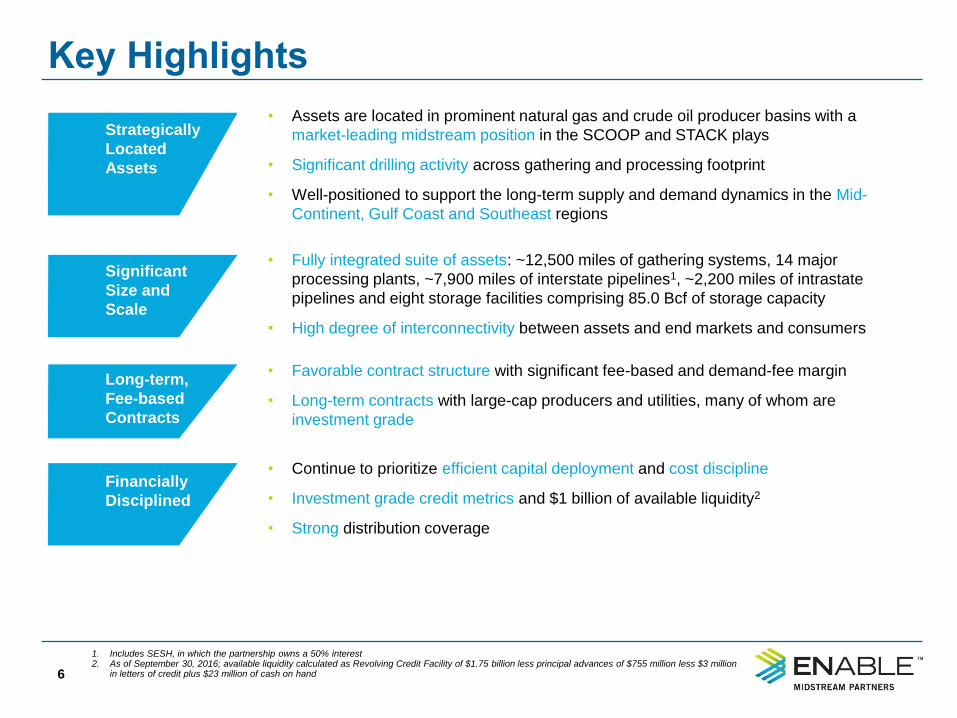
Key Highlights
6
• Assets are located in prominent natural gas and crude oil producer basins with a
market-leading midstream position in the SCOOP and STACK plays
• Significant drilling activity across gathering and processing footprint
• Well-positioned to support the long-term supply and demand dynamics in the Mid-
Continent, Gulf Coast and Southeast regions
• Fully integrated suite of assets: ~12,500 miles of gathering systems, 14 major
processing plants, ~7,900 miles of interstate pipelines1, ~2,200 miles of intrastate
pipelines and eight storage facilities comprising 85.0 Bcf of storage capacity
• High degree of interconnectivity between assets and end markets and consumers
• Favorable contract structure with significant fee-based and demand-fee margin
• Long-term contracts with large-cap producers and utilities, many of whom are
investment grade
• Continue to prioritize efficient capital deployment and cost discipline
• Investment grade credit metrics and $1 billion of available liquidity2
• Strong distribution coverage
Strategically
Located
Assets
Significant
Size and
Scale
Long-term,
Fee-based
Contracts
Financially
Disciplined
1. Includes SESH, in which the partnership owns a 50% interest2. As of September 30, 2016; available liquidity calculated as Revolving Credit Facility of $1.75 billion less principal advances of $755 million less $3 million
in letters of credit plus $23 million of cash on hand

60%26%
14% Firm/MVC Fee-based
Other Fee-based
Commodity-based, includingHedges
57%
43% G&P
T&S
Interconnected, Diverse and Strategically Located
7
• Enable provides operating reach and scale with complementary capabilities
• Assets are well-positioned to support the long-term supply and demand dynamics in the Mid-
Continent, Gulf Coast and Southeast regions
Enable’s Transportation and Storage (T&S) and Gathering and Processing (G&P) Assets1
1. Map as of November 3, 20162. For nine months ending September 30, 2016; percentages represent gross margin contribution excluding eliminations3. For nine months ending September 30, 2016
YTD Gross Margin Profile3
YTD Segment Contribution2

Recent Commercial Successes
8
In October 2016, signed a new 10-year,
fee-based natural gas gathering and
processing agreement with one of the
most active producers in the STACK
• Replaces an existing percent-of-proceeds
(POP) processing arrangement
• Adds an additional 61,400 gross acres of
dedication to Enable in the STACK
• Increases fee-based margin
• Reduces commodity exposure
• Increases the volume-weighted average
term on gathering contracts
• Supports continued capital deployment at
returns consistent with Enable’s
objectives
In the third quarter of 2016, Enable’s
Mississippi River Transmission, LLC (MRT)
subsidiary extended natural gas
transportation service agreements with its
largest customer, St. Louis-based Laclede
Gas Company
• Extends existing demand levels of ~300,000
dekatherms per day (Dth/d) from 2017 to
2020
• Continues 87-year relationship with Laclede
• Increases average contract life on MRT
• Contributes to Enable’s significant firm, fee-
based business
Gathering and Processing Interstate Pipelines

Large and Diverse Customer Base
9
Top Customers1
Enable’s revenues are strengthened by a diverse, high-quality customer base, many of whom are
investment-grade or affiliates of investment-grade companies
(Investment Grade)
(Investment Grade) (Investment Grade) (Investment Grade)(Investment Grade)
► Many of our customers rely on us for multiple midstream services across both G&P and T&S
► Loyal customer base through exemplary customer service and reliable project execution
(Investment Grade)
(Investment Grade) (Investment Grade) (Investment Grade)
(Investment Grade)
1. Standard and Poor’s, Moody’s and Fitch credit ratings from Bloomberg as of November 4, 2016 – customers with split credit ratings are included as
investment-grade entities

$450
$250
$500 $600 $550 $758
2016 2017 2018 2019 2020 2024 2044
Term Loan Facility
EOIT Sr. Unsecured Notes
ENBL Sr. Unsecured Notes
Principle Advances on RCF
10
Results for Nine Months Ended September 30
Debt Maturity Schedule Total Debt / LTM Adjusted EBITDA5
• Enable’s 2017 gross margin profile is
expected to be approximately 92% fee-based
or hedged
• As of September 30, 2016, Enable achieved
a year-to-date distribution coverage ratio1 of
1.26x and the lowest total debt-to-Adjusted
EBITDA ratio in over a year
• Enable has a strong credit profile supported
by $1 billion of available liquidity2 and no
near-term debt maturities
1. A non-GAAP measure calculated as DCF divided by distributions related to common and subordinated unitholders2. As of September 30, 2016; available liquidity calculated as Revolving Credit Facility of $1.75 billion less principal advances of $755 million less $3 million in letters of credit
plus $23 million of cash on hand3. As of September 30, 2016; principal advances of $755 million and $3 mllion in letters of credit
4. Adjusted EBITDA and DCF are non-GAAP financial measures and are reconciled to the nearest GAAP financial measures in the appendix
5. Calculated as Total Debt/LTM Adj. EBITDA from each quarter; Enable’s LTM Adj. EBITDA was $801 million in Q4-15, $809 million in Q1-16, $805 million in Q2-16 and $827
million in Q3-16
$ in millions
Highlights
Favorable Credit Profile and Strong Distribution Coverage
In millions, except ratio data 2016 2015
Net Income (loss) attributable
to limited partners$244 ($817)
Net cash provided by operating
activities$498 $491
Adjusted EBITDA4 $655 $629
Distributable cash flow (DCF)4 $507 $438
Distribution coverage ratio1 1.26x 1.10x
Expansion Capital $238 $621
4.10x
3.81x 3.87x 3.78x
Q4-15 Q1-16 Q2-16 Q3-16
*
* Term loan includes two, one year extension options
3
No near-
term debt
maturities
through
2017

Appendix
11
2. Gathering and Processing
Segment Overview

• Significant size and scale in prominent basins
underpinned with favorable contract structures
• 14 major processing plants with ~2.5 Bcf/d of
processing capacity located in the Anadarko, Arkoma
and Ark-La-Tex basins1
• Acreage dedications of 6.7 million gross acres with a
volume-weighted average remaining term of ~7 years2
• G&P segment gross margin is 79% fee-based1
• Contracts with minimum volume commitment features
in lean natural gas developments of 2.1 Bcf/d with
committed volume-weighted average remaining terms
of ~6 years2
• New 10-year, fee-based gathering and processing
contract in the STACK play that replaces a contract
with a POP processing arrangement
• 33 rigs are currently contractually dedicated to Enable3
15
8 8
1 1
STACK SCOOP Ark-La-Tex Arkoma Williston
Peers67%
Enable33%
Gathering and Processing Segment
12
Gathering and Processing Highlights Market-Leading SCOOP and STACK Position
1. As of September 30, 2016
2. As of December 31,2016
3. Per Drillinginfo, represents rigs that are drilling wells that are contractually dedicated to Enable – as of October 26, 2016
4. Bentek processing capacity in associated SCOOP and STACK counties as of September 30, 2016
5. Rigs contractually dedicated to Enable as a percentage of total active rigs in the respective plays
6. Per Drillinginfo, there were 19 total rigs in the counties designated under SCOOP and 46 total rigs in counties designated under STACK as of October 26, 2016
7. Per Baker Hughes, there were 17 gas rigs operating in Haynesville as of October 21, 2016
SCOOP6 STACK6 Haynesville7
Market Share of Active Rigs5
Market-Leading
Active Rig Count3
#1 in Processing
Capacity4
Peers 71%
Enable 29%
Peers58%
Enable 42%
Note: SCOOP designated as Caddo, Carter, Garvin, Grady, McClain and Stephens counties of Oklahoma;
STACK designated as Blaine, Canadian, Custer, Dewey, Kingfisher, Major and Woodward counties of
Oklahoma

Anadarko Basin
13
• Enable serves over 200 producers in the
Anadarko basin and has secured 4.6 million
gross acres of dedication under long-term, fee-
based contracts1
• The super-header system interconnects 9 of
Enable’s 11 natural gas processing plants and
has over 1.685 Bcf/d of processing capacity2
• The super-header system is uniquely positioned
to serve the prominent SCOOP and STACK
plays and allows Enable to:
• Optimize the economics of its natural gas processing
• Respond quickly to customer needs
• Efficiently phase in new production
• 7,900 miles
• 690,600 Horsepower
• 1.64 TBtu/d gathering volumes
• 11 processing plants
• 1.845 Bcf/d processing capacity
• 64.53 MBbl/d NGLs produced
• 4.6 mm gross acres of dedication
1. As of December 31, 20152. As of September 30, 20163. Map as of November 3, 2016; volumes as of nine months ended September 30, 2016; processing capacity and miles of pipe as of as of September 30, 2016;
horsepower and gross acres of dedication as of December 31, 2015
System Map3System Highlights
Bradley Processing Complex
14
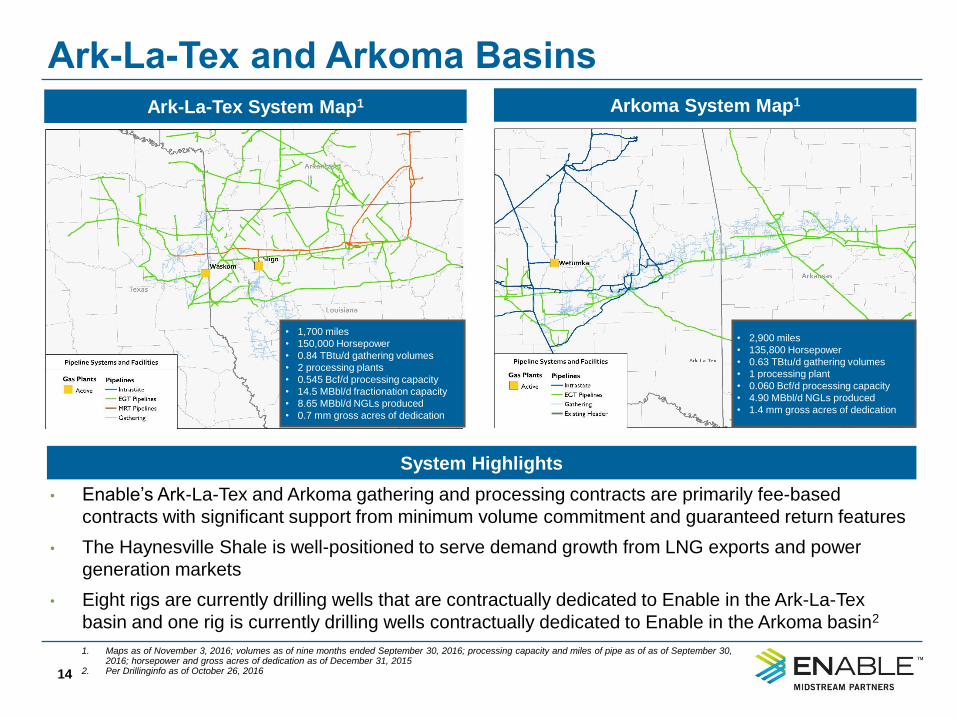
• Enable’s Ark-La-Tex and Arkoma gathering and processing contracts are primarily fee-based
contracts with significant support from minimum volume commitment and guaranteed return features
• The Haynesville Shale is well-positioned to serve demand growth from LNG exports and power
generation markets
• Eight rigs are currently drilling wells that are contractually dedicated to Enable in the Ark-La-Tex
basin and one rig is currently drilling wells contractually dedicated to Enable in the Arkoma basin2
Ark-La-Tex System Map1
System Highlights
Arkoma System Map1
1. Maps as of November 3, 2016; volumes as of nine months ended September 30, 2016; processing capacity and miles of pipe as of as of September 30, 2016; horsepower and gross acres of dedication as of December 31, 2015
2. Per Drillinginfo as of October 26, 2016
Ark-La-Tex and Arkoma Basins
• 2,900 miles
• 135,800 Horsepower
• 0.63 TBtu/d gathering volumes
• 1 processing plant
• 0.060 Bcf/d processing capacity
• 4.90 MBbl/d NGLs produced
• 1.4 mm gross acres of dedication
• 1,700 miles
• 150,000 Horsepower
• 0.84 TBtu/d gathering volumes
• 2 processing plants
• 0.545 Bcf/d processing capacity
• 14.5 MBbl/d fractionation capacity
• 8.65 MBbl/d NGLs produced
• 0.7 mm gross acres of dedication

Crude Gathering Systems in the Williston Basin
15
• Enable’s first crude gathering system, the
Bear Den system, was fully operational in
the first quarter of 2015 and Enable
continues to connect new wells onto the
system
• The Nesson system commenced operations
in the second quarter of 2015 and additional
infrastructure is expected to be placed into
service as activity warrants
• Fee-based contract structures, including
some support from contracts with minimum
volume commitment features
• XTO Energy, Enable’s top customer in the
Bakken, is one of the most active producers
in North Dakota1
System Map2System Highlights
1. Per North Dakota’s Department of Mineral Resources website as of November 3, 20162. Map as of November 3, 2016; gross acres data as of December 31, 2015
• Total of 0.2 million
gross acres dedicated

Appendix3. Transportation and Storage
Segment Overview
16

G&P57%
T&S43%
Fee-based 96%
IG Customers
65%
• Significant firm, fee-based margin with high-
quality customers across 9 states
• Enable Oklahoma Intrastate Transmission
(EOIT), Mississippi River Transmission (MRT)
and Southeast Supply Header (SESH) all
have significant interconnectivity with Enable
Gas Transmission (EGT)
• Well-situated to facilitate natural gas demand
growth in the Mid-Continent, Gulf Coast and
Southeast regions
• Enable’s interstate and intrastate pipeline systems
continue to meet the residue gas transportation
needs of the growing SCOOP and STACK plays
• Shippers have the ability to access almost
every major consuming market east of the
Mississippi River through Perryville Hub and
associated trading points
Transportation and Storage Segment
17
1. Map as of November 3, 2016
2. As of September 30, 2016
3. Customers as of September 30, 2016; Standard and Poor’s, Moody’s and Fitch credit ratings from Bloomberg as of October 24, 2016 – customers with split
credit ratings are included as investment-grade entities
Transportation and Storage Highlights Transportation and Storage System1
Revenues from
Investment-grade
(IG) Customers3
T&S YTD
Gross Margin2
EGT
EOIT
Perryville Hub
YTD Total Margin
Contribution2

Enable Gas Transmission (EGT)
18
• 5,900-mile interstate pipeline serving the
Anadarko, Ark-La-Tex and Arkoma basins1
• EGT’s primary customers include LDCs, gas
producers and gas-fired power generators
• ~28% of EGT’s gross margin is attributable to
services provided to subsidiaries of CenterPoint
Energy2
• ~85% of EGT’s capacity is under contract with an
average remaining contract life of 3.4 years2
• ~54% of total T&S segment gross margins derived
from demand charges under EGT’s firm contracts2
• EGT is well-positioned to serve increasing
Oklahoma production
• Announced Line AD expansion, with related new
shipper commitments in excess of 175,000 Dth/d,
expected to be in-service in Q2-17
• Completed the Bradley Lateral in the fourth quarter
of 2015 which added over 200,000 Dth/d of long-
term, firm transportation contracts
• Total system utilization continues to increase
including deliveries to power generators and off-
system interconnects
Pipeline Map3Pipeline Highlights
1. As of September 30, 20162. As of December 31, 20153. Map as of November 3, 2016; pipeline miles as of September 30, 2016, and capacity data as of December 31, 2015
• 5,900 miles
• 6.5 Bcf/d capacity
• 29.5 Bcf storage capacity

Mississippi River Transmission (MRT)
19
• 1,700-mile interstate pipeline that
offers shippers competitive rates
and is interconnected to diverse
supply points1
• MRT’s primary customers are local
distribution companies and industrial
markets in the St. Louis market area
• ~89% of capacity is under contract1
• ~14% of total T&S segment gross
margins derived from demand charges
under MRT’s firm contracts1
• Extended contracts expiring in 2017
with Laclede Gas Company through
2020 in the third quarter of 2016
Pipeline Map2Pipeline Highlights
• 1,700 miles
• 1.9 Bcf/d capacity
• 31.5 Bcf storage capacity
1. As of December 31, 20152. Map as of November 3, 2016; pipeline miles and capacity data as of December 31, 2015
Select Interconnects Supply Basin/Region
EGT Anadarko, Fayetteville and Haynesville
Perryville Hub Barnett, Haynesville and Gulf Coast
NGPL & Trunkline Marcellus/Utica, Mid-Con and Gulf Coast
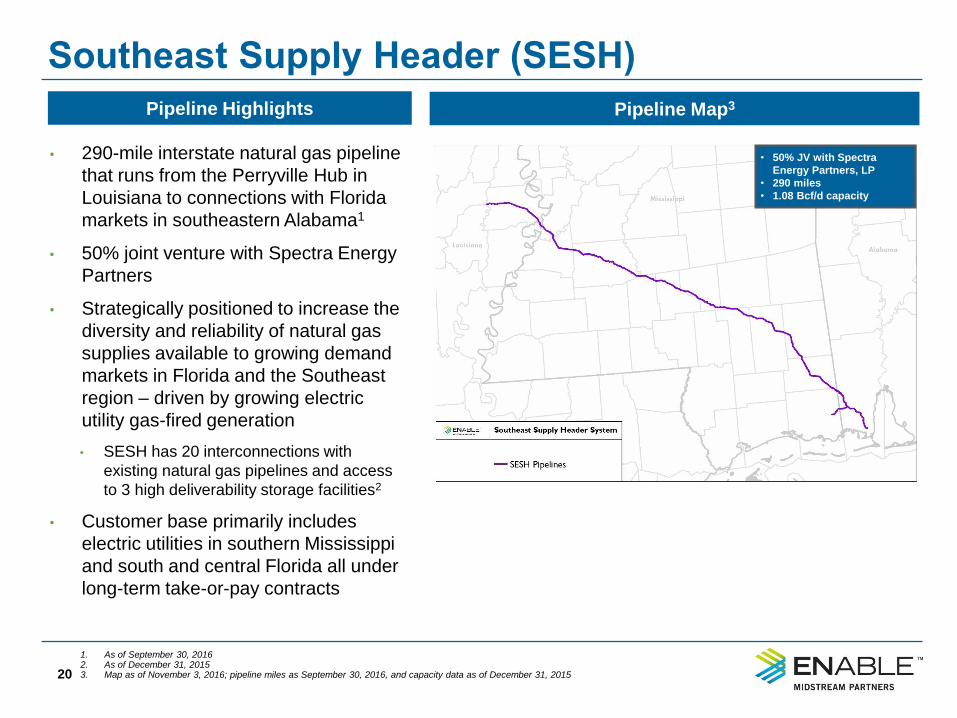
Southeast Supply Header (SESH)
20
• 290-mile interstate natural gas pipeline
that runs from the Perryville Hub in
Louisiana to connections with Florida
markets in southeastern Alabama1
• 50% joint venture with Spectra Energy
Partners
• Strategically positioned to increase the
diversity and reliability of natural gas
supplies available to growing demand
markets in Florida and the Southeast
region – driven by growing electric
utility gas-fired generation
• SESH has 20 interconnections with
existing natural gas pipelines and access
to 3 high deliverability storage facilities2
• Customer base primarily includes
electric utilities in southern Mississippi
and south and central Florida all under
long-term take-or-pay contracts
Pipeline Map3Pipeline Highlights
1. As of September 30, 20162. As of December 31, 20153. Map as of November 3, 2016; pipeline miles as September 30, 2016, and capacity data as of December 31, 2015
• 50% JV with Spectra
Energy Partners, LP
• 290 miles
• 1.08 Bcf/d capacity

21
• Interconnects natural gas supply from
the Anadarko and Arkoma basins to
Enable’s EGT system and 12 third-party
natural gas pipelines with 67
interconnect points1
• Connected to 36 end-user customers,
including 14 natural gas-fired electric
generation facilities in Oklahoma1
• Major customers include Oklahoma Gas &
Electric, an affiliate of OGE Energy Corp.,
and Public Service Company of Oklahoma
(PSO), an affiliate of American Electric
Power Co.
• Functions as a delivery system for
Enable’s super-header processing
system and is well-positioned to serve
transportation needs for producers in the
SCOOP, STACK, Mississippi Lime and
Greater Granite Wash plays
EOIT Pipeline Map2Pipeline Highlights
1. As of December 31, 20152. Map as of November 3, 2016; pipeline miles as of September 30, 2016; throughput and capacity data as of December 31, 2015
Enable Oklahoma Intrastate Transmission (EOIT)
• 2,200 miles
• 2.1 Bcf/d peak throughput
• 24.0 Bcf storage capacity

Appendix4. 2017 Outlook
22

Significant Producer Acreage and Activity
23
STACK and SCOOP Acreage and Activity1 Haynesville Activity1
• Drilling activity in the STACK, SCOOP and Haynesville is expected to
drive significant volume growth for 2017
1. Assets as of November 3, 2016 and rig data per Drillinginfo as of October 26, 2016
Others

24
2017 Operational
Outlook
Natural Gas Gathered Volumes (TBtu/d) 3.3 – 3.8
Anadarko 1.7 – 2.0
Arkoma 0.5 – 0.7
Ark-La-Tex 0.9 – 1.3
Natural Gas Processed Volumes (TBtu/d) 1.9 – 2.3
Anadarko 1.6 – 1.9
Arkoma 0.1 – 0.2
Ark-La-Tex 0.1 – 0.3
Crude Oil – Gathered Volumes (MBbl/d) 23.0 – 28.0
Interstate Firm Contracted Capacity (Bcf/d) 6.1 – 6.5
2017 Operational Outlook 2017 Financial Outlook
2017 Operational, Financial and Capital Outlook
$ in millions
2017 Financial
Outlook
Net Income Attributable to Common and
Subordinated Unit Holders$315 – $385
Interest Expense $114 – $122
Adjusted EBITDA3 $825 – $885
Preferred Equity Distributions4 $36
Adjusted Interest Expense3 $120 – $130
Maintenance Capital $95 – $125
Distributable Cash Flow3 $555 – $605
Distribution Coverage Ratio5 1.0x or greater
54%31%
7%
8% Firm/MVCFee-based
Other Fee-based
Commodity-based Hedged
Commodity-basedUnhedged
2017 Margin Profile62017 Capital Outlook
$ in millions
2017 Capital
Outlook
Gathering Related Expansion Capital $320 – $420
Processing Plants1 $90 – $100
Transportation and Storage Organic
Growth2 $45 – $55
Total Capital $455 – $575
~92% fee-
based or
hedged
1. Represents capital associated with the Wildhorse Plant, if elected to resume construction; the Wildhorse Plant is a 200 MMcf/d cryogenic processing facility located in Garvin County,
Oklahoma
2. Primarily represents a new end-user transportation project
3. Adjusted EBITDA, adjusted interest expense and distributable cash flow are non-GAAP financial measures and are reconciled to the nearest GAAP financial measures in the appendix
4. Includes the fourth quarter 2017 distribution that will be paid in the first quarter 2018
5. A non-GAAP measure calculated as DCF divided by distributions related to common and subordinated unitholders
6. Gross margin profile represents forecasted Q1-17 through Q4-17; percentages in pie charts based on Gross Margin contribution
As of November 2, 2016

2017 Price Assumptions and Sensitivities
25
2017 Prices Assumptions
Natural Gas – Henry Hub ($/MMBtu) $3.05 – $3.45
NGLs – Mont Belvieu, Texas ($/gal)1 $0.46 – $0.56
NGLs – Conway, Kansas ($/gal)1 $0.44 – $0.54
Crude Oil – WTI ($Bbl) $48.00 – $58.00
1. NGL composite based on assumed composition of 45%, 30%, 10%, 5% and 10% for ethane, propane, normal butane, isobutane and natural gasoline,
respectively
2. The price sensitivities assume 2017 price changes occur on January 1, 20173. The impact of price sensitivities is the same for net income attributable to limited partners and net income attributable to common and subordinated units
Impact to 2017 Net Income (including impact of hedges)3
% Change in Prices
$ in millions +10% -10%
Natural Gas and Ethane $5 ($5)
NGLs (excluding ethane) and Condensate $6 ($6)
Impact to 2017 Adjusted EBITDA (including impact of hedges)
% Change in Prices
$ in millions +10% -10%
Natural Gas and Ethane $5 ($5)
NGLs (excluding ethane) and Condensate $6 ($6)
2017 Price Sensitivities2
As of November 2, 2016

Appendix
26
5. Appendix
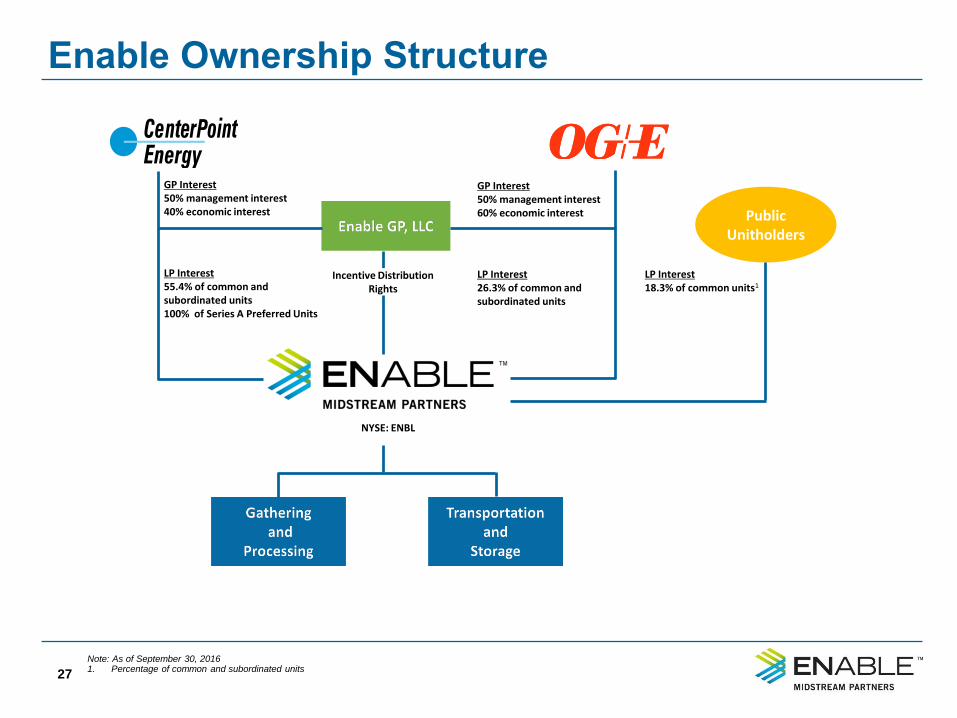
Public Unitholders
Enable Ownership Structure
27
GP Interest50% management interest40% economic interest
LP Interest55.4% of common and subordinated units100% of Series A Preferred Units
Incentive DistributionRights
Note: As of September 30, 20161. Percentage of common and subordinated units
GP Interest50% management interest60% economic interest
LP Interest26.3% of common and subordinated units
LP Interest18.3% of common units1
NYSE: ENBL

Operating Statistics by Basin
28
Anadarko Arkoma Ark-La-Tex
Q3-16 Q3-15 Q3-16 Q3-15 Q3-16 Q3-15
Natural Gas Gathered Volumes (TBtu/d) 1.66 1.70 0.61 0.65 0.89 0.82
Natural Gas Processed Volumes (TBtu/d) 1.50 1.49 0.10 0.09 0.18 0.29
Gross NGL Production (MBbl/d)1 65.24 70.02 4.69 4.73 7.60 9.05
Anadarko Arkoma Ark-La-Tex
Q2-16 Q2-15 Q2-16 Q2-15 Q2-16 Q2-15
Natural Gas Gathered Volumes (TBtu/d) 1.62 1.63 0.65 0.67 0.83 0.89
Natural Gas Processed Volumes (TBtu/d) 1.44 1.41 0.10 0.11 0.22 0.32
Gross NGL Production (MBbl/d)1 69.64 58.63 5.03 4.96 8.42 10.60
Third Quarter 2016 & 2015
Second Quarter 2016 & 2015
1. Excludes condensate

Hedging Summary
29
1. Table includes hedges and commodity exposures associated with equity volumes resulting from Enable's Gathering, Processing and Transportation businesses; percentage hedged includes hedges executed through November 3, 2016
2. Enable hedges net condensate/natural gasoline exposure with crude3. Percentage hedged for 2016 reflects November-December hedges only
Commodity1 2016 3 2017
Natural Gas
Exposure Hedged (%) 98% 66%
Average Hedge Price ($/MMBtu) $2.73 $2.64
Crude2
Exposure Hedged (%) 82% 45%
Average Hedge Price ($/Bbl) $54.93 $48.44
Propane
Exposure Hedged (%) 90% 51%
Average Hedge Price ($/gal) $0.49 $0.46

Non-GAAP Reconciliations
30
Three Months Ended
September 30, Nine Months Ended
September 30,
2016 2015 2016 2015
(In millions)
Reconciliation of Gross Margin to Total Revenues:
Consolidated
Product sales $ 326 $ 357 $ 837 $ 1,043
Service revenue 294 289 821 809
Total Revenues 620 646 1,658 1,852
Cost of natural gas and natural gas liquids (excluding
depreciation and amortization) 268
287
717
856
Gross margin $ 352 $ 359 $ 941 $ 996
Reportable Segments
Gathering and Processing
Product sales $ 295 $ 299 $ 759 $ 875
Service revenue 160 157 416 404
Total Revenues 455 456 1,175 1,279
Cost of natural gas and natural gas liquids (excluding
depreciation and amortization) 246
235
642
698
Gross margin $ 209 $ 221 $ 533 $ 581
Transportation and Storage
Product sales $ 150 $ 166 $ 348 $ 467
Service revenue 135 133 408 408
Total Revenues 285 299 756 875
Cost of natural gas and natural gas liquids (excluding
depreciation and amortization) 141
161
346
459
Gross margin $ 144 $ 138 $ 410 $ 416

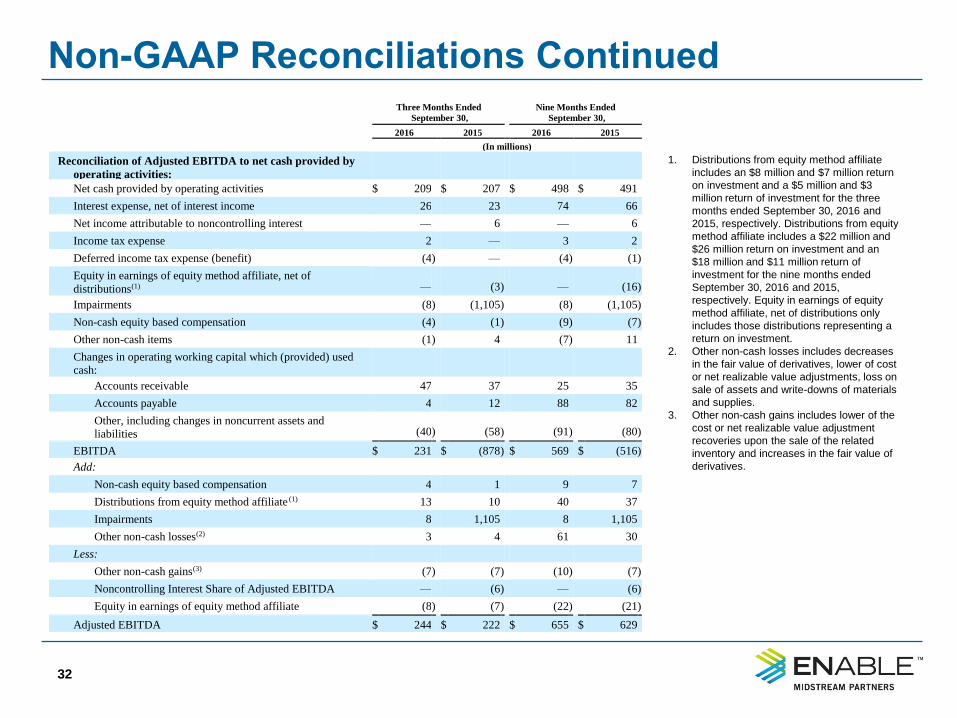
Non-GAAP Reconciliations Continued
31
1. Distributions from equity method affiliate includes
an $8 million and $7 million return on investment
and a $5 million and $3 million return of investment
for the three months ended September 30, 2016
and 2015, respectively. Distributions from equity
method affiliate includes a $22 million and $26
million return on investment and an $18 million and
$11 million return of investment for the nine
months ended September 30, 2016 and 2015,
respectively. Equity in earnings of equity method
affiliate, net of distributions only includes those
distributions representing a return on investment.
2. Other non-cash losses includes decreases in the
fair value of derivatives, lower of cost or net
realizable value adjustments, loss on sale of
assets and write-downs of materials and supplies.
3. Other non-cash gains includes lower of the cost or
net realizable value adjustment recoveries upon
the sale of the related inventory and increases in
the fair value of derivatives.
4. This amount represents the quarterly cash
distributions on the Series A Preferred Units
declared for the three and nine months ended
September 30, 2016. In accordance with the
Partnership Agreement, the Series A Preferred
Unit distributions are deemed to have been paid
out of available cash with respect to the quarter
immediately preceding the quarter in which the
distribution is made.
5. See slide 25 for a reconciliation of Adjusted
interest expense to Interest expense.
6. Represents cash distributions declared for
common and subordinated units outstanding as of
each respective period. Amounts for 2016 reflect
estimated cash distributions for common and
subordinated units outstanding for the quarter
ended September 30, 2016.
Three Months Ended
September 30, Nine Months Ended
September 30,
2016 2015 2016 2015
(In millions, except Distribution coverage ratio)
Reconciliation of Adjusted EBITDA and DCF to net income
(loss) attributable to limited partners and calculation of
Distribution coverage ratio:
Net income (loss) attributable to limited partners $ 119 $ (985 ) $ 244 $ (817 )
Add:
Depreciation and amortization expense 84 84 248 233
Interest expense, net of interest income 26 23 74 66
Income tax expense 2 — 3 2
EBITDA $ 231 $ (878 ) $ 569 $ (516 )
Add:
Distributions from equity method affiliate (1) 13 10 40 37
Non-cash equity based compensation 4 1 9 7
Other non-cash losses(2) 3 4 61 30
Impairments 8 1,105 8 1,105
Less:
Other non-cash gains(3) (7 ) (7 ) (10 ) (7 )
Noncontrolling Interest Share of Adjusted EBITDA — (6 ) — (6 )
Equity in earnings of equity method affiliate (8 ) (7 ) (22 ) (21 )
Adjusted EBITDA $ 244 $ 222 $ 655 $ 629
Less:
Series A Preferred Unit distributions(4) (9 ) — (22 ) —
Adjusted interest expense(5) (27 ) (27 ) (76 ) (77 )
Maintenance capital expenditures (21 ) (41 ) (51 ) (113 )
Current income taxes 2 — 1 (1 )
DCF $ 189 $ 154 $ 507 $ 438
Distributions related to common and subordinated unitholders (6) $ 134 $ 134 $ 402 $ 400
Distribution coverage ratio 1.41 1.15 1.26 1.10
Non-GAAP Reconciliations Continued
32
1. Distributions from equity method affiliate
includes an $8 million and $7 million return
on investment and a $5 million and $3
million return of investment for the three
months ended September 30, 2016 and
2015, respectively. Distributions from equity
method affiliate includes a $22 million and
$26 million return on investment and an
$18 million and $11 million return of
investment for the nine months ended
September 30, 2016 and 2015,
respectively. Equity in earnings of equity
method affiliate, net of distributions only
includes those distributions representing a
return on investment.
2. Other non-cash losses includes decreases
in the fair value of derivatives, lower of cost
or net realizable value adjustments, loss on
sale of assets and write-downs of materials
and supplies.
3. Other non-cash gains includes lower of the
cost or net realizable value adjustment
recoveries upon the sale of the related
inventory and increases in the fair value of
derivatives.
Three Months Ended
September 30, Nine Months Ended
September 30,
2016 2015 2016 2015
(In millions)
Reconciliation of Adjusted EBITDA to net cash provided by
operating activities:
Net cash provided by operating activities $ 209 $ 207 $ 498 $ 491
Interest expense, net of interest income 26 23 74 66
Net income attributable to noncontrolling interest — 6 — 6
Income tax expense 2 — 3 2
Deferred income tax expense (benefit) (4 ) — (4 ) (1 )
Equity in earnings of equity method affiliate, net of
distributions(1) —
(3 ) —
(16 )
Impairments (8 ) (1,105 ) (8 ) (1,105 )
Non-cash equity based compensation (4 ) (1 ) (9 ) (7 )
Other non-cash items (1 ) 4 (7 ) 11
Changes in operating working capital which (provided) used
cash:
Accounts receivable 47 37 25 35
Accounts payable 4 12 88 82
Other, including changes in noncurrent assets and
liabilities (40 ) (58 ) (91 ) (80 )
EBITDA $ 231 $ (878 ) $ 569 $ (516 )
Add:
Non-cash equity based compensation 4 1 9 7
Distributions from equity method affiliate (1) 13 10 40 37
Impairments 8 1,105 8 1,105
Other non-cash losses(2) 3 4 61 30
Less:
Other non-cash gains(3) (7 ) (7 ) (10 ) (7 )
Noncontrolling Interest Share of Adjusted EBITDA — (6 ) — (6 )
Equity in earnings of equity method affiliate (8 ) (7 ) (22 ) (21 )
Adjusted EBITDA $ 244 $ 222 $ 655 $ 629

Non-GAAP Reconciliations Continued
33
Three Months Ended
September 30, Nine Months Ended
September 30,
2016 2015 2016 2015
(In millions)
Reconciliation of Adjusted interest expense to Interest expense:
Interest Expense $ 26 $ 23 $ 74 $ 66
Add:
Amortization of premium on long-term debt 1 2 4 4
Capitalized interest on expansion capital — 3 1 9
Less:
Amortization of debt costs — (1 ) (3 ) (2 )
Adjusted interest expense $ 27 $ 27 $ 76 $ 77

Forward Looking Non-GAAP Reconciliation
34
1. Other non-cash losses includes changes in the fair value of derivatives, lower of cost or net realizable value adjustments, loss on sale of assets and write-
downs of materials and supplies.
2. Other non-cash gains include lower of the cost or net realizable value adjustment recoveries upon the sale of the related inventory.
3. Outlook includes the fourth quarter 2017 distribution that will be paid in first quarter 2018
2017 Outlook
(In millions)
Reconciliation of Adjusted EBITDA and distributable cash flow to net income attributable to
limited partners:
Net income attributable to common and subordinated units $315 - $385
Add:
Series A Preferred Unit distributions 36
Net income attributable to limited partners $351 - $421
Add:
Depreciation and amortization expense 335 - 345
Interest expense, net of interest income 114 - 122
Income tax expense 0 - 5
EBITDA $800 - $893
Add:
Distributions from equity method affiliates 32 - 36
Non-cash equity based compensation 12 - 16
Other non-cash losses(1) —
Less:
Other non-cash gains(2) (12 - 18)
Equity in earnings of equity method affiliates (22 - 28)
Adjusted EBITDA $825 - $885
Less:
Series A Preferred Unit distributions(3) 36
Adjusted interest expense 120 - 130
Maintenance capital expenditures 95 - 125
Current income taxes —
Distributable cash flow $555 - $605

Forward Looking Non-GAAP Reconciliation Continued
35
Enable is unable to present a quantitative reconciliation of forward looking Adjusted EBITDA to Net Cash Provided by
Operating Activities because certain information needed to make a reasonable forward-looking estimate of changes in
working capital which may (provide) use cash during the calendar year 2017 cannot be reliably predicted and the
estimate is often dependent on future events which may be uncertain or outside of Enable's control. This includes
changes to Accounts Receivable, Accounts Payable and Other changes in non-current assets and liabilities.
2017 Outlook
(In millions)
Reconciliation of Adjusted interest expense to Interest expense:
Interest Expense $114 - $122
Add:
Amortization of premium on long-term debt 5
Capitalized interest on expansion capital 0 - 6
Less:
Amortization of debt costs (0 - 4)
Adjusted interest expense $120 - $130