fourier transform infrared spectroscopy and … · fourier transform infrared spectroscopy and...
TRANSCRIPT
Acta Geodyn. Geomater., Vol. 13, No. 2 (182), 149–158, 2016
DOI: 10.13168/AGG.2015.0052
journal homepage: https://www.irsm.cas.cz/acta
ORIGINAL PAPER
FOURIER TRANSFORM INFRARED SPECTROSCOPY AND THERMAL ANALYSES OF KAOLINITIC CLAYS FROM SOUTH AFRICA AND CAMEROON
Makia DIKO 1) *, Georges EKOSSE 2) and Jason OGOLA 3)
1) Geology Division, University of Limpopo, Sovenga, P/B X1106 Limpopo Province, 0727 South Africa 2) Directorate of Research and Innovation, University of Venda,
P/B X5050 Limpopo Province, 0950 South Africa 3) Department of Mining and Environmental Geology, University of Venda,
P/B X5050 Limpopo Province, 0950 South Africa
*Corresponding author‘s e-mail: [email protected]
ABSTRACT
In this study, Fourier transform infrared (FTIR) spectroscopy, differential scanning calorimetry(DSC) and thermogravimetry (TGA) are used as complementary techniques to investigatestructural order and phase transformation associated with thermal decomposition of selectedkaolins from South Africa and Cameroon. The samples exhibit poorly resolved, weak intensityOH stretching and bending vibrations of structural water, characteristic kaolinitedehydroxylation temperatures (500 – 560 oC), low to high mass loss (6.5 to 19.4 %) andasymmetrical DSC curves. The results infer poor to partially ordered structures associated withsignificant quartz and iron oxide contamination. Compared against other commercial kaolins, thestudied samples show moderate to good potentials for use in structural ceramics and refractories.
ARTICLE INFO
Article history: Received 31 August 2015 Accepted 11 November 2015 Available online 12 December 2015
Keywords: Kaolin Thermal stability Calcination Structural order Industrial application
and Duthuni kaolins in Limpopo Province, north ofSouth Africa) are currently being exploited for bricks,while those from Cameroon (i.e. Moko and Edikikaolins situated in the Southwest Region) are yet to beexploited for any industrial purpose. These respectivedeposits have been geologically, physico-chemicallyand mineralogically characterised in other studies(Diko and Ekosse, 2012; Diko, 2012; Diko andEkosse, 2014). Genetically, Zebediela, Moko andEdiki deposits were classified as secondary kaolins,while Duthuni as primary (Diko, 2012). Kaolinite wasidentified as the predominant kaolin mineral in allfour deposits, associated with quartz as majorconstituent, while mica (illite/muscovite) + k-feldspar(as microcline) ± goethite ± hematite ± anatase ± ru-tile ± ilmenite occurred in minor to trace quantities(Diko and Ekosse, 2012; Diko, 2012; Diko andEkosse, 2014). The aforementioned mineralogical datawas obtained through X-Ray diffraction analysis(XRD). Powder XRD for bulk samples were carriedout using a Philips PW 1710 XRD unit operated at40 Kv and 30 mA with a Cu-Ka radiation. Thesamples were mounted on sample holders with littlepressure, using a blade to minimize preferredorientation of the kaolinite particles and scannedscanned for from 3°2θ to 60° 2θ at a counting time ofone second. A graphite monochromator with a PW1877 Automated Power Diffraction, X'PERT DataCollector soft-ware package was employed qualitativeidentification of the minerals Diko and Ekosse (2012).Diko (2012) further observed that end products fromthe studied South African deposits are oftencharacterized by defects such as warping, cracking,
1. INTRODUCTION
Kaolin [Al2Si2O5(OH)4] is a common phyl-losilicate mineral, widely employed as raw material inceramics, paper filling and coating, refractory,fiberglass, cement, rubber and plastics, paint, catalyst,pharmaceutics and agriculture (Ekosse, 2010; Diko etal., 2011). The minerals of the kaolin group compriseskaolinite, dickite, nacrite, and halloysite with kaolinitebeing the most common (Murray, 2007). Structurallythey consist of the so-called 1:1 layers of combinedsilicate sheets (Si2O5) bonded to aluminiumoxide/hydroxide [Al2 (OH)4] layers, which arecontinuous in the a- and b-axis directions and arestacked one above the other in the c-axis direction.Generally, the differences in kaolin minerals arerelated to the number of unit layers and manner inwhich they are stacked above each other (Murray,2007; Vaculíková et al., 2011).
South Africa and Cameroon are two countriesfrom Southern and West Africa respectively withsignificantly rich kaolin potential (Ekosse, 2010). Asdeveloping economies, the contribution of kaolinresources towards economic growth and sustainabilityof both nations is of paramount importance, howeververy few deposits have been sufficiently characterizedfor industrial purpose (Horn and Strydom, 1998;Njoya et al., 2006; Kamsue et al., 2007; Nkoumbou etal., 2009; Diko and Ekosse, 2012; Diko, 2012; Dikoand Ekosse, 2014). Current exploitation of mostkaolin deposits or occurrences in South Africa andCameroon are limited to the manufacture of structuralceramic products such as bricks and roofing tiles. Theselected kaolin deposits in this study (i.e. Zebediela
Cite this article as: Diko M, Ekosse G, Ogola J: Fourier transform infrared spectroscopy and thermal analyses of kaolinitic clays from SouthAfrica and Cameroon. Acta Geodyn. Geomater., 13, No. 2 (182), 149–158, 2016. DOI: 10.13168/AGG.2015.0052
M. Diko et al.
150
Heterogeneity between layers was defined bydifferences in colour, texture and mineralogy (Diko,2012). However, in some instances the maindifference was texturally driven, as in Ediki kaolinwhere two facies type; sand-rich and sand-poor kaolinhave been identified (Diko and Ekosse, 2012). Withineach distinct kaolin-bearing layer across all fourdeposits studied, four sub-samples were collected atvariable intervals and mixed into a single homogenoussample.
2.2. EXPERIMENTAL
The IR spectra for bulk kaolin were acquiredusing a Perkin Elmer System 2000 FTIRspectrophotometer at a resolution of 4 cm-1. About 5 gof dried powdered samples were homogenized inspectrophotometric grade KBr in an agate mortar andpressed to 3 mm pellets with a hand press (Ekosse andMulaba, 2008). In order not to distort the crystallinityof kaolinite in the samples, the mixing was set to3 min allowing for minimal grinding as suggested byTan (1996). Peaks were reported based on percentagetransmittance to given wavelengths. Thermal analysiswas conducted with a TA instrument SDT Q600TGA-DSC analyser. Calcined Al2O3 served as theinsert standard, while measurements were performedwith 20 mg of samples, heated in air at 10 °C/min,from 25 °C to 1100 °C as discussed in Njoya et al.(2006).
3. RESULTS AND DISCUSSION
3.1. FTIR SPECTROSCOPY The structural order of kaolinites can be detected
by differences in position and relative intensity of OHstretching and bending bands in IR spectrum(Madejová, 2003). The OH bands in kaolin typicallydisplay four sharp stretching bands between 3600 and3700 cm-1 namely; 3697, 3670, 3652/50 and 3620 cm-1
(Ekosse and Mulaba, 2008; Ekosse, 2008; Saikia andParthasarathy, 2010; Kiros et al., 2013; Djomgoue andNjopwouo, 2013). The strong band at 3697 cm-1 arisesfrom surface hydroxyls and produces an in-phasevibration perpendicular to the 1:1 layers (Ece et al.,2003). The two bands at 3670 cm-1 and 3652 cm-1
arise from stretching vibrations that are sub-parallel tothe 1:1 layers whereas the low frequency 3620 cm-1 isassigned to the fourth OH inner group. On the basis ofresolution and relative intensities of the bands in theOH stretching and bending regions, Vaculíková et al.(2011) proposed the following classification schemesfor kaolinite structural order:
• Ordered; if the OH stretching and bending bandsare clearly resolved.
• Partially ordered; if the individual OH bands at3670 cm-1, 3650 cm-1 and 938 cm-1 had lowintensities but could be identified.
• Poorly ordered; if only one band near 3660 cm-1
or inflexions near 3670 cm-1, 3650 cm-1 and938 cm-1 were observed in the spectra.
exploding and peeling during firing which tends toimpact on finished product quality. Therefore, in orderto optimally exploit these kaolin resources, there isneed for in-depth appraisal of the raw materialproperties.
Although other factors may account for defectsin ceramic ware (e.g. inappropriate thermal treatmentor percentage mixture of different proportions of theraw material prior to firing) the aforementioneddefects in calcined kaolins may be attributed in part tothe mineralogical assemblage, structural order andthermal stability of the raw material. Anunderstanding of the degree of crystallinity, thermalbehaviour and reaction dynamics during calcinationare vital in characterizing kaolin for optimalexploitation (Madejová, 2003; Ekosse and Mulaba,2008; Vaculíková et al., 2011). In this study, Fouriertransform infrared (FTIR) spectroscopy, differentialscanning calorimetry (DSC) and thermogravimetry(TGA) are used as complementary techniques toinvestigate structural order and phase transformationassociated with thermal decomposition of the selectedkaolins from South Africa and Cameroon in order toappraise their industrial suitability. In order toascertain kaolinite structural order based on FTIRspectroscopy, Vaculikova et al (2011) recommendedtwo approaches: (1) an empirical approach based onthe resolution and relative intensities of OH stretchingand bending vibrations of structural water in kaolinite,and (2) a numerical approach based on crystallinityindices (CI) calculated from the intensities of selectedvibrational modes of structural OH bands. However inthis study, only preliminary findings based on theempirical approach are reported. A more detailedstudy on kaolinite structural order involvingcomparison of the numerical approach with kaoliniteCI (i.e. Hinkcley and Stoch Indices) calculated fromXRD diffractograms is still on-going. In addition,thermal behaviour of the studied kaolins are comparedagainst other kaolins with similar mineralogicalassemblage and exploited for structural ceramics andrefractories (e.g. Makoro and Kgwakwe kaolins,Botswana; Mayououm kaolin, Cameroon; andMavaiela kaolins, Angola). It is anticipated thatfindings from this study will contribute towardsimprovement in end-product quality for the SouthAfrican kaolinitic clays and give impetus fordevelopment of a ceramic plant in Southwest Region,Cameroon.
2. MATERIAL AND METHODS
2.1. SAMPLES A total of four representative bulk kaolin
samples from South Africa (denoted ZEB 1 and ZEB2 from Zebediela and DUT 1 and DUT 2 fromDuthuni) and four from Cameroon (denoted MK 1 andMK 2 from Moko, and ED 1 and ED 2 from Ediki)were obtained for FTIR, DSC and TGA analyses.Representativity was ensured by collecting thesamples from two main heterogeneous kaolin bearinglayers within the respective excavation pits.

FOURIER TRANSFORM INFRARED SPECTROSCOPY AND THERMAL ANALYSES OF … .
151
Table 1 Assignments and infrared band positions of selected kaolin samples from South Africa, Cameroon andtheoretical kaolinite.
Wavenumber (cm-1) Theoretical kaolinite
ZEB 1 ZEB 2 DUT 1 DUT 2 ED 1 ED 2 MK 1 MK 2 Assignment
3670 – 56 3688 3650
3687 3650
3692 3651
3690 3652
3686 –
– –
3693 –
3700 –
Al---O-H stretching of inner-surface hydroxyls
3645
3619
3619
3619
3624
3619
3619
3621
3624
Al---O-H stretching of inner hydroxyls
–
– –
– –
3404 –
3368 –
3410 1397
3410 1404
3398 –
3411 1417
H-O-H stretching (absorbed water)
–
–
1648
1653
1649
1640
1641
1642
1636
H-O-H bending; possibly smectite interference
1117 – 05 1113 1113 1111 1112 1113 – – – Si – O stretching 1035 – 30
1039
1023
1025
1024
–
–
–
–
Si – O stretching; muscovite interference
1019 – 05 993 996 999 996 981 978 1000 979 Si – O quartz 918 – 09 907 908 908 908 907 908 909 907 OH deformation 800 – 784
828 795 749
– 789 750
– 793
– 789 748
– 796 751
828 797
– 797 749
– 797 778
OH deformation linked to Al3-,Mg2-
700 – 686 687 683
686
679
684
690
682
691 Si – O quartz
542 – 35 521 523 524 522 518 519 523 515 * Fe-O, Fe2O3; Si-O-Al stretching
475 – 68 454 455 459 455 455 455 459 450 Si –O– Si bending 430 423
403 –
– 403 –
419 403 398
414 – –
410 403 –
– 402 399
415 407 –
422 406 –
Si – O deformation
Values for theoretical kaolinite (Vaculíková et al., 2011); * Fe-O, Fe2O3 not present in theoretical kaolinite; (–), very weak intensity or not detected.
structural order; ED 2 < ED 1< MK 2 < MK 1 < ZEB2 < ZEB 1, with ED 2 having the least and ZEB 1 themost.
3.2. THERMAL ANALYSIS
The DSC curves show endothermic andexothermic reactions during calcination, such asdesorption of surface water (H2O), dehydroxylation(structural OH-groups) and the transformation tomullite and cristobalite, with resultant temperatureeffects of dehydroxylation and polymorphictransformation strongly dependent on kaolinitestructural order (Ece et al., 2003; Ekosse, 2008).
Kaolin group minerals are characterised by twomajor endothermic peaks and one exothermic peak.The exothermic peak corresponds to the destruction ofthe 1:1 kaolinite structure and is typically observedbetween 943 °C and 968 °C (Ece et al., 2003; Ekosse,2008). The dehydroxylation temperature of mostkaolinites ranges from 498 °C to 605 °C, whereas thedehydroxylation of dickite and nacrite occurs at680 °C. According to Ece et al. (2003) and Saviano etal. (2005) well-ordered kaolinites have broadendothermic peaks at approximately 590 °C however,Njoya et al. (2006) reported endothermic peaks forwell-ordered kaolinites from Mayouom at 520 –
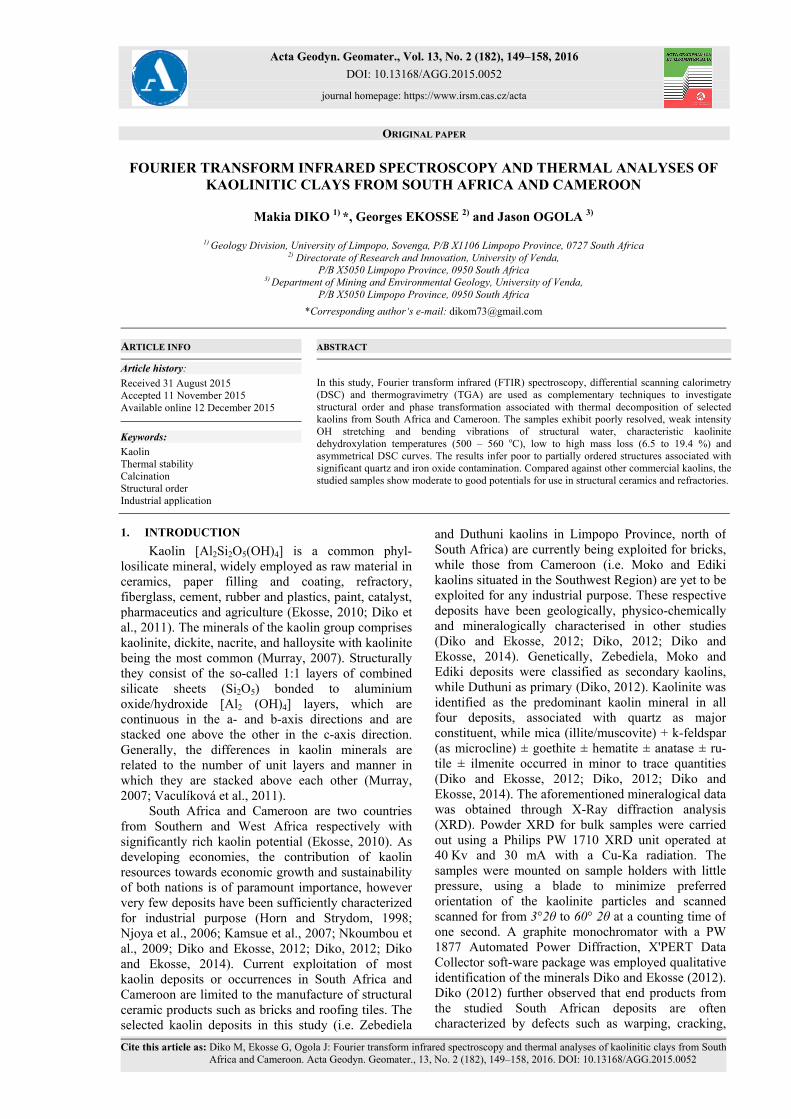
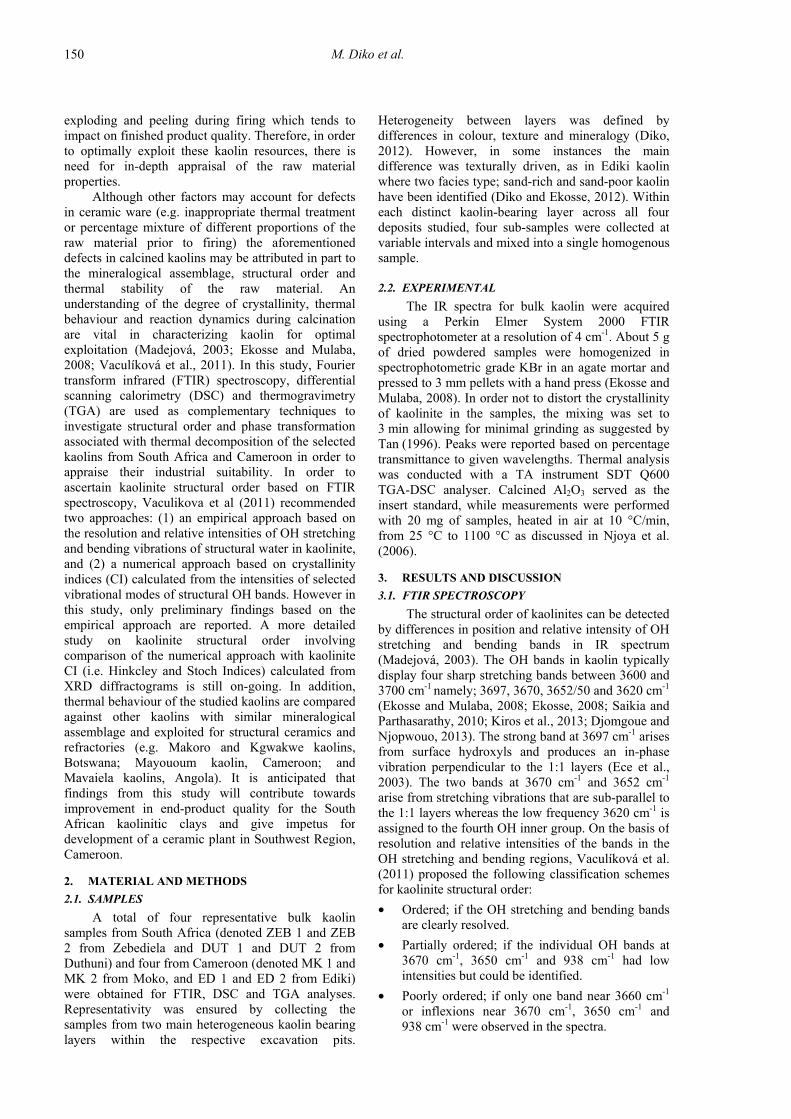
The positions and assignments of thetransmittance bands of representative samples fromSouth Africa and Cameroon compared against that oftheoretical kaolinite is summarized in Table 1.Three characteristic peaks at 3688/3687 cm-1,3651/3652°C°C cm°C -1 and 3690/3692 cm-1 wereobserved in ZEB 1, ZEB 2, DUT 1 and DUT 2 (Fig. 1(a – d), a weak doublet between 3620 cm-1 and3700 cm-1 was present in MK 1 and MK 2 (Fig. 2a and b) whereas only a single clearly resolved 3619cm-1 peak with very weak inflexion at 3686 cm-1
characterized ED 1 and ED 4 (Fig. 2c and d). Lowfrequency peaks at 3620 cm-1 and 3619 cm-1 wereprominent in all the samples. Single broad bands at3650/3651 cm-1, were observed in samples ED 1 and2, indicative of poor structural order (Saikia andParthasarathy, 2010; Kiros et al., 2013; Djomgoue andNjopwouo, 2013). Muscovite + quartz interferencewas identified in all the samples whereas iron oxideswere prominent in ZEB 2, DUT 1, DUT 2, MK 1 andMK 2 but absent in ED 1 and ED 2. According toSaikia and Parthasarathy (2010) broad H-O-H bandsat 3450 cm-1 and weak peaks at 1633 cm-1 in DUT 6,DUT 13, MK 1, MK 2, ED 1 and ED4 may contributesignificantly towards mass loss during calcination.The IR spectrum infers the following increasing
M. Diko et al.
152
Wavenumber (cm-1)
Fig. 1 FTIR spectra of bulk kaolin samples from South Africa: (a) ZEB 1, (b) ZEB 2,(c) DUT 1, (d) DUT 2.
Wavenumber (cm-1)Fig. 2 FTIR spectra of bulk kaolin samples from Cameroon: (a) MK 1, (b) MK 2, (c) ED 1,
(d) ED 2.
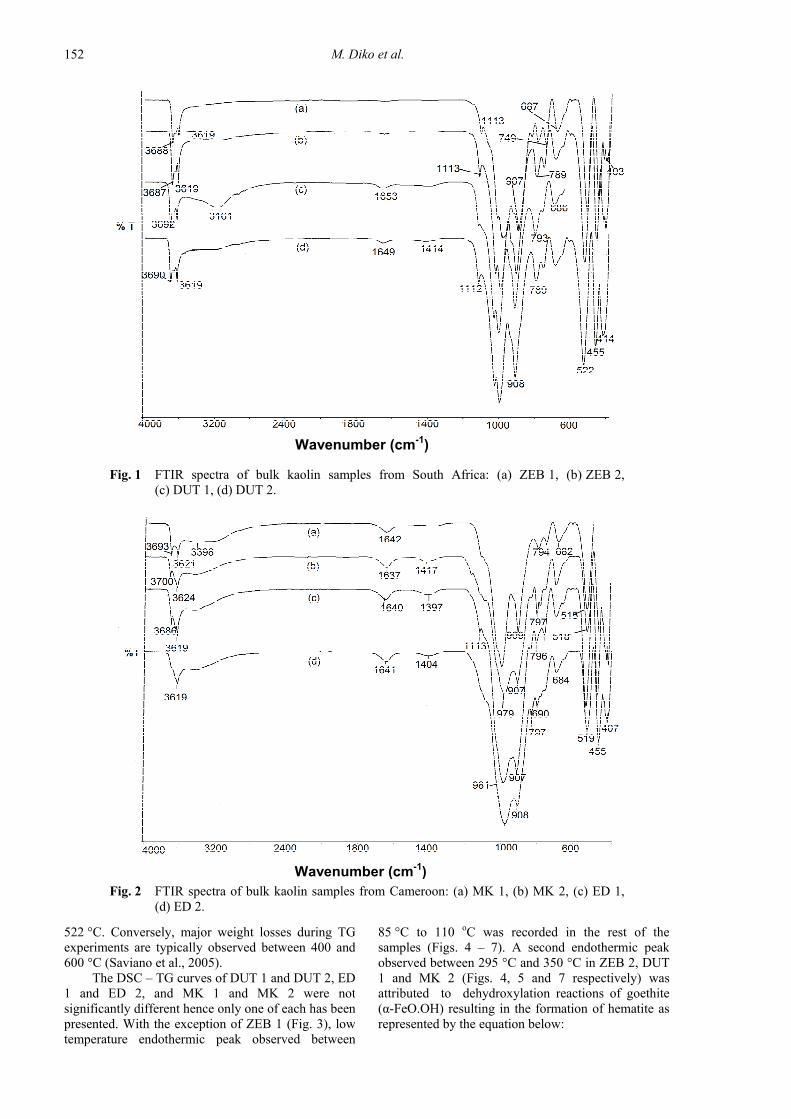
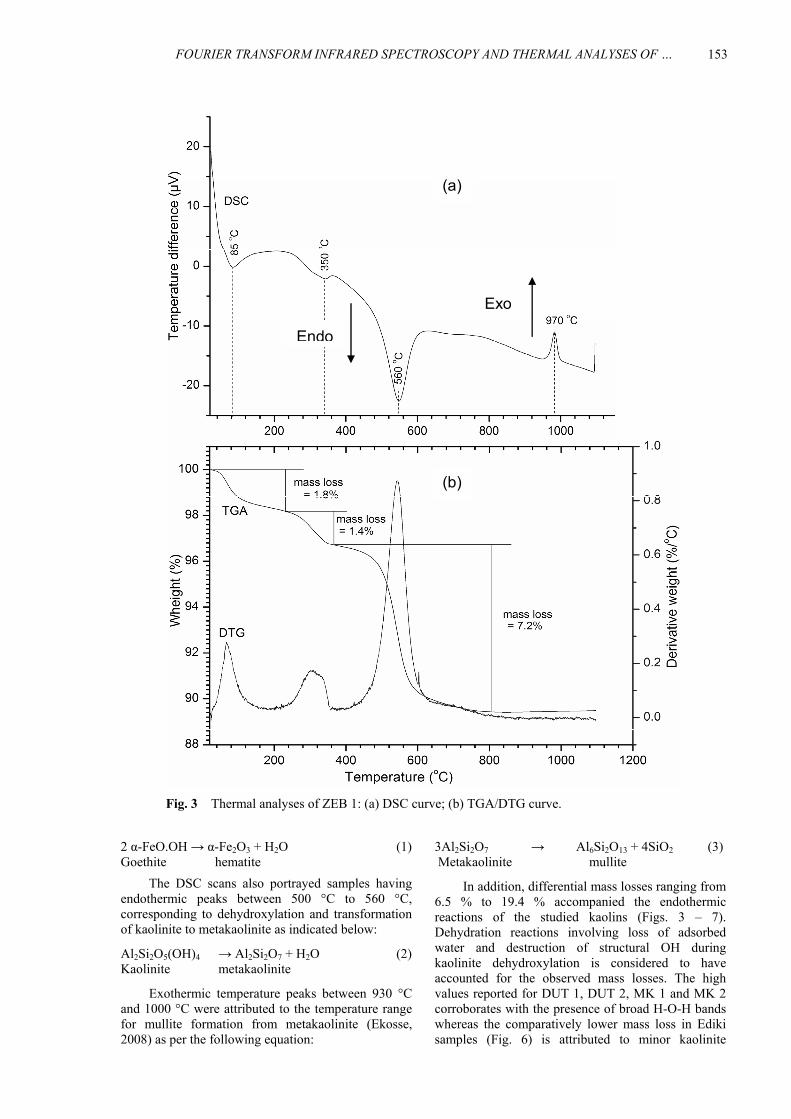
85 °C to 110 oC was recorded in the rest of thesamples (Figs. 4 – 7). A second endothermic peakobserved between 295 °C and 350 °C in ZEB 2, DUT1 and MK 2 (Figs. 4, 5 and 7 respectively) wasattributed to dehydroxylation reactions of goethite(α-FeO.OH) resulting in the formation of hematite asrepresented by the equation below:
522 °C. Conversely, major weight losses during TGexperiments are typically observed between 400 and600 °C (Saviano et al., 2005).
The DSC – TG curves of DUT 1 and DUT 2, ED1 and ED 2, and MK 1 and MK 2 were notsignificantly different hence only one of each has beenpresented. With the exception of ZEB 1 (Fig. 3), lowtemperature endothermic peak observed between
FOURIER TRANSFORM INFRARED SPECTROSCOPY AND THERMAL ANALYSES OF … .
153
(a)
(b)
Exo
Endo
Fig. 3 Thermal analyses of ZEB 1: (a) DSC curve; (b) TGA/DTG curve.
3Al2Si2O7 → Al6Si2O13 + 4SiO2 (3) Metakaolinite mullite
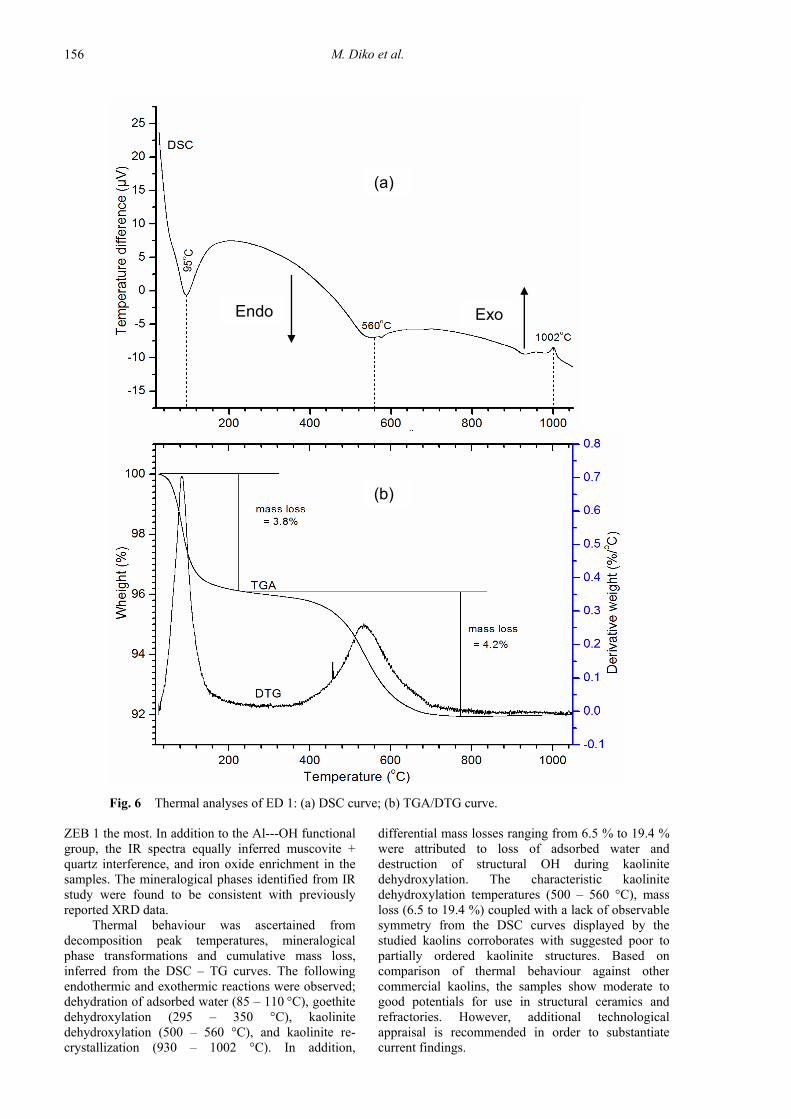
In addition, differential mass losses ranging from6.5 % to 19.4 % accompanied the endothermicreactions of the studied kaolins (Figs. 3 – 7).Dehydration reactions involving loss of adsorbedwater and destruction of structural OH duringkaolinite dehydroxylation is considered to haveaccounted for the observed mass losses. The highvalues reported for DUT 1, DUT 2, MK 1 and MK 2corroborates with the presence of broad H-O-H bandswhereas the comparatively lower mass loss in Edikisamples (Fig. 6) is attributed to minor kaolinite
2 α-FeO.OH → α-Fe2O3 + H2O (1)Goethite hematite
The DSC scans also portrayed samples havingendothermic peaks between 500 °C to 560 °C,corresponding to dehydroxylation and transformationof kaolinite to metakaolinite as indicated below:
Al2Si2O5(OH)4 → Al2Si2O7 + H2O (2)Kaolinite metakaolinite
Exothermic temperature peaks between 930 °Cand 1000 °C were attributed to the temperature rangefor mullite formation from metakaolinite (Ekosse,2008) as per the following equation:

M. Diko et al.
154
(a)
(b)
Exo
Endo
Fig. 4 Thermal analyses of ZEB 2: (a) DSC curve; (b) TGA/DTG curve.
were similar to those reported for Makoro andKgwakwe kaolins (Botswana) widely employed in themanufacture of ceramics (Ekosse, 2000; 2001). Incontrast, exothermic peak temperatures of the studiedkaolins were lower than those for Makoro andKgwakgwe. Compared to Mayouom kaolins, utilisedfor white firing ceramics and refractories (Njoya et al.,2006; Nkoumbou et al., 2009), exothermictemperatures for MK 1 and 2 were much lowerwhereas the rest of the samples recordedcomparatively higher values (Table 2). With theexception of MK 1 and MK 2, exothermictemperatures of the studied samples were close to thatof Mavaiela kaolins, used for bricks, tile and paper(Saviano et al., 2005; Ekosse, 2010). Apart from MK
content and weak H-O-H bands. The lack ofsymmetry displayed by the DSC curves, kaolinitedehydroxylation temperatures (500 - 650 °C) togetherwith goethite dehydroxylation reactions observed inthe studied kaolins, suggests moderate degrees ofcrystallinity (Saviano et al., 2005). According toEkosse (2008), oxides and other associated clayminerals (e.g mica and smectite) may equally haveinfluenced the reaction dynamics.
In order to further assess the industrial suitabilitypotentials, thermal stability and reaction dynamics ofthe studied kaolins were compared against those ofselected kaolins exploited for a range of industrialapplications (Table 2). The endothermic peaktemperatures and main reactions of the studied kaolins

FOURIER TRANSFORM INFRARED SPECTROSCOPY AND THERMAL ANALYSES OF … .
155
(a)
(b)
EndoExo
Fig. 5 Thermal analyses of DUT 1: (a) DSC curve; (b) TGA/DTG curve.
structural water. In terms of kaolinite finger prints,three characteristic peaks at 3688/3687 cm-1,3651/3652 cm-1 and 3690/3692 cm-1 were observed inthe South African clays. A weak doublet between3620 cm-1 and 3700 cm-1 was present in MK 1 andMK 2 whereas only a single clearly resolved peak at3619 cm-1, single broad band at 3650/3651 cm-1 withvery weak inflexion at 3686 cm-1 characterized ED 1and ED 2. Low frequency peaks at 3620 cm-1 and3619 cm-1 were prominent in all the samples. Based onchanges in relative intensities of OH stretching andbending vibrations the following kaolinite structuralorder was inferred; ED 2 < ED 1< MK 2 < MK 1 <ZEB 2 < ZEB 1, with ED 2 having the least order and
1 and MK 2 with higher mass loss (14.4 – 19.4 wt.%), values for the other samples were consistent withthose reported for Mayouom, Mavaiela, Makoro andKgwakgwe kaolins (Table 2).
4. CONCLUSION
Selected kaolins from South Africa (ZEB 1, ZEB2, DUT 1 and DUT 2) and Cameroon (MK 1, MK 2,ED 1 and ED 2) have been characterised by FTIR andsimultaneous DSC – TG analyses in order to elucidateon their structural order and thermal stability.Kaolinite order was determined based on empiricalanalysis of the resolution and relative intensityof the OH stretching and bending vibrations of
M. Diko et al.
156
(a)
(b)
Endo Exo
Fig. 6 Thermal analyses of ED 1: (a) DSC curve; (b) TGA/DTG curve.
differential mass losses ranging from 6.5 % to 19.4 %were attributed to loss of adsorbed water anddestruction of structural OH during kaolinitedehydroxylation. The characteristic kaolinitedehydroxylation temperatures (500 – 560 °C), massloss (6.5 to 19.4 %) coupled with a lack of observablesymmetry from the DSC curves displayed by thestudied kaolins corroborates with suggested poor topartially ordered kaolinite structures. Based oncomparison of thermal behaviour against othercommercial kaolins, the samples show moderate togood potentials for use in structural ceramics andrefractories. However, additional technologicalappraisal is recommended in order to substantiatecurrent findings.
ZEB 1 the most. In addition to the Al---OH functionalgroup, the IR spectra equally inferred muscovite +quartz interference, and iron oxide enrichment in thesamples. The mineralogical phases identified from IRstudy were found to be consistent with previouslyreported XRD data.
Thermal behaviour was ascertained fromdecomposition peak temperatures, mineralogicalphase transformations and cumulative mass loss,inferred from the DSC – TG curves. The followingendothermic and exothermic reactions were observed;dehydration of adsorbed water (85 – 110 °C), goethitedehydroxylation (295 – 350 °C), kaolinitedehydroxylation (500 – 560 °C), and kaolinite re-crystallization (930 – 1002 °C). In addition,

FOURIER TRANSFORM INFRARED SPECTROSCOPY AND THERMAL ANALYSES OF … .
157
(a)
(b)
Endo Exo
Fig. 7 Thermal analyses of MK 2: (a) DSC curve; (b) TGA/DTG curve.
Diko, M.L. and Ekosse, G.E.: 2014, Soil ingestion andassociated health implications: a physicochemical andmineralogical appraisal of geophagic soils from Moko,Cameroon. Studies on Ethno-medicine, 8, No. 1, 83–88.
Diko, M.L., Ekosse, G.E., Ayonghe. S.N. and Ntasin, E.:2011, Physical characterization of clayey materialsfrom Tertiary volcanic cones in Limbe (Cameroon) forceramic applications. Applied Clay Science, No. 51,380–384. DOI:10.1016/j.clay.2010.11.034
Diko, M.L.: 2012, Genesis and ceramic applications ofselected kaolin occurrences from Limpopo Province,
ACKNOWLEDGEMENTS
Funding from UNESCO/IUGS/IGCP 545 Projecton Clays and Clay Minerals in Africa isacknowledged.
REFERENCES
Diko, M.L. and Ekosse, G.E.: 2012, Physico-chemical andmineralogical considerations of Ediki sandstone-hosted kaolin occurrence, South West Cameroon.International Journal of Physical Science, 7, No. 3,501–507. DOI: 10.5897/IJPS11.1506

M. Diko et al.
158
Table 2 DSC-DTG endothermic and exothermic peak temperatures and main reactions of representative samplesfrom South Africa and Cameroon compared against Mayouom, Mavaiela, Makoro and Kgwakgwekaolins.
ZE
B 1
ZE
B 2
DU
T 1
DU
T 2
ED
1
ED
2
MK
1
MK
2
May
ouom
Mav
aiel
a
Mak
oro
Kgw
akgw
e Main
reaction
Endothermic peaks (oC) – 85 90 85 95 95 105 110 – 100-105 – 120 Dehydration of
adsorbed water – 350 300 295 – – 305 – – – 350 – Goethite
dehyroxylation 530 560 530 535 560 560 500 505 520 -522 550-540 605 610 Kaolinite
dehydroxylation 6.5
10.4 16.2 10.5 8 9.2 19.4 14.4 12-13 – 12-16 6-13 Mass loss
(Wt. %) Exothermic peaks (oC)
1000 970 955 945 1002 930 960 980 980-975 1000 1000 1020 Recrystallization of kaolinite
Values for Mayououm, Mavaiela, Makoro and Kgwakgwe obtained from Njoya et al. (2006), Saviano et al (2005); and Ekosse, 2000; 2001 respectively.
Kiros, A., Gholap, A. and Gigante, G.E.: 2013, Fouriertransform infrared spectroscopic characterization ofclay minerals from rocks of Lalibela churches,Ethiopia. International Journal of Physical Sciences, 8,No 3, 109–119. DOI: 10.5897/IJPS12.714
Madejová, J.: 2003, FTIR techniques in clay mineralstudies. Vibrational Spectroscopy, 31, 1–10. DOI:10.1016/S0924-2031(02)00065-6
Murray, H.H.: 2007, Applied clay mineralogy. occurrences,processing and application of kaolins, bentonites,palygorskite-Sepiolite and common clays.Developments in Clay Science, No. 2, 179 pp.
Njoya, A., Nkoumbou, C., Grosbois, C., Njopwouo, D.,Njoya, D., Courtin-Nomade, A., Yvon, J. and Martin,F.: 2006, Genesis of Mayouom kaolin deposit(western Cameroon). Applied Clay Science, 32, 125–140. DOI: 10.1016/j.clay.2005.11.005.
Nkoumbou, C., Njoya, A., Njoya, D., Grosbois, C.,Njopwouo, D., Yvon, J. and Martin, F.: 2009, Kaolinfrom Mayouom (Western Cameroon): Industrialsuitability evaluation. Applied Clay Science, 43, 118–124. DOI:10.1016/j.clay.2008.07.019
Saikia, B. and Parthasarathy, G.: 2010, Fourier TransformInfrared Spectroscopic Characterization of kaolinitefrom Assam and Meghalaya, Northeastern India.Journal of Modern Physics, 1, 206–210. DOI: 10.4236/jmp.2010.14031
Saviano, G., Maurizio, V., Umberto, P. and Emidio, T.L.:2005, Kaolin deposits from the northern sector ofCunene Anorthosite Complex (Southern Angola).Clays and Clay Minerals, 53, No. 6, 674–685. DOI: 10.1346/CCMN.2005.0530613
Tan, K.H.: 1996, Soil sampling preparation and analysis.Marcel Dekker Inc. New York,
Vaculíková, L., Plevová, E., Vallová, S. and Koutník, I.:2011, Characterization and differentiation ofkaolinites from selected Czech deposits using infraredspectroscopy and differential thermal analysis. ActaGeodyn. Geomater., 8, No. 161, 59–67.
South Africa and South West Region, Cameroon. PhDthesis, University of Limpopo, South Africa, 239 pp.
Djomgoue, P. and Njopwouo, D.: 2013, FT-IR Spectroscopyapplied for surface clays characterization. Journal ofSurface Engineered Materials and AdvancedTechnology, 3, 275–282. DOI: http://dx.doi.org/10.4236/jsemat.2013.34037
Ece, O.I., Nakagawa, Z. and Schroed, P.: 2003, Alteration ofvolcanic rocks and genesis of kaolin deposits in theSile region, Northern Istanbul, Turkey. ClayMineralogy. Clays and Clay Minerals, 51, No. 6, 675–688. DOI: 10.1346/CCMN.2003.0510610
Ekosse, G.E. and Mulaba, A.: 2008, Mineralthermochemistry of bentonite and kaolinite related totheir possible application in the ceramic industry.Journal of Applied Sciences 8, No. 22, 4145–4151.DOI: 10.3923/jas.2008.4145.4151
Ekosse, G.E.: 2000, The Makoro kaolin deposit,southeastern Botswana: its genesis and possibleindustrial applications. Applied Clay Science, 16,301–320. DOI: 10.1016/S0169-1317(99)00059-9
Ekosse, G.E.: 2001, Provenance of the Kgwakgwe kaolindeposit in southeastern Botswana and its possibleutilization. Applied Clay Science, 20, 137–152.DOI:10.1016/S0169-1317(01)00064-3
Ekosse, G.E.: 2008, Thermoanalytical characterization,stable isotope and paleoenvironmental considerationsof kaolinite from two genetic sources. FreseniusEnvironmental Bulletin, 17, No. 1, 29–42.
Ekosse, G.E.: 2010, Kaolin deposits and occurrences inAfrica: Geology, mineralogy and utilization. AppliedClay Science, 50, No. 2, 212–236. DOI:10.1016/j.clay.2010.08.003
Horn, G.F. and Strydom, J.H.: 1998, Clay. In: Wilson M.G.and Anhaeusser C.R., (Eds.): The Mineral Resourcesof South Africa. Council for Geoscience, 16, 106–135.
Kamsue, E., Leonelli, C., Boccaccini, D. N., Veronesi, P.,Miselli, P., Giancarlo, P. and Chinje Melo, U.: 2007,Characterisation of porcelain compositions using twochina clays from Cameroon. Ceramics International,33, 851–857. DOI: 10.5897/IJPS12.714