fotokatalystisk hydrogenproduksjon gjennom fotoreforming - diva
TRANSCRIPT
Fotokatalystisk hydrogenproduksjon gjennom fotoreforming av hydrokarboner
Eirik Djuve
Industriell kjemi og bioteknologi
Hovedveileder: Magnus Rønning, IKPMedveileder: Charitha Udani, IKP
Institutt for kjemisk prosessteknologi
Innlevert: juni 2013
Norges teknisk-naturvitenskapelige universitet

PrefaceThis study was carried out as a master thesis for the Department of Chemical Engineer-ing at the Norwegian University of Science and Technology (NTNU) during the spring of2013. My supervisor was Professor Magnus Rønning and co-advisor was PhD candidateCharitha Udani.
I chose this project because i wanted to learn something new and exciting and becauseI like the idea of contributing (even so little) to the development of environmental-friendlyenergy solutions. The goal of the project was to understand and optimize the productionof hydrogen from a mixture of water and methanol, using UV-light as energy input andcopper loaded titanium oxide as a photocatalyst for the process. A practical routinefor obtaining reproducible results had to be refined and optimization of the process wasperformed mainly by tuning the catalyst loading in the reactor and the copper contentin the photocatalyst.
I would like to thank my supervisors for giving me help, inspiration, and trainingin addition to contributing to a great working environment which made this project apositive experience for me. I would also like to thank Karin Wiggen for teaching mehow to use the BET instrument, Harry Brun for teaching me about the correct use of thegas equipment and Arne Fossum for providing the much needed chemicals and equipment.
I declare that this is an independent work according to the exam regula-tions of the Norwegian University of Science and Technology (NTNU).
Eirik Djuve

ii

SammendragHensikten med dette prosjektet var å undersøke Cu−TiO2 som fotokatalysator for fotore-forming av metanol. Dette er en prosess der hydrogen blir produsert fra metanol ivannløsning ved hjelp av UV-lys og en fotokatalysator. Denne prosessen renser ogsåvannet, men for at prosessen skal få noen realistisk nytte må den optimeres og de dyreedelmetallene som for øyeblikket gir best resultater som ko-katalysatorer, må byttes ut.Kobber/kobberoksid er valgt som ko-katalysator i dette prosjektet fordi det er relativtbillig og tilgjengelig. Denne prosessen kan gjøres miløvennlig og CO2 nøytral ved å brukesola som lyskilde og biomasse som hydrokarbonkilde.
En rekke fotoreforming eksperimenter ble utført for å kartlegge kobber-innholdet sineffekt på aktiveten til fotokatalysatoren og for å finne det optimale kobber innholdet.Videre ble det eksperimentert med å bruke forksjellige mengder katalysator i reaktorenfor å finne ut hvilken effekt katalysatormengde har på hydrogen produksjonen. Deaktiv-ering ble også undersøkt ved å se på den fallende hydrogenproduksjon og ved å førsøkeå reaktivere katalysatoren. Til slutt ble det utført BET analyse på de forksjellige kata-lysatorene for å finne ut hvilken effekt kobber innholdet og produksjonsmeteoden har påoverflate arealet til katalysator pulveret.
Fem forskjellige katalysatorer ble fremstilt ved Incipient Wetness Impregnation (IWI)metoden med forskjellige kobber-innhold mellom 0 og 10 masseprosent. Det var over-raskende liten forskjell på de forskjellige fotokatalysatorenes evne til å produsere hydro-gen, med unntakk av den kobberfrie katalysatoren som ikke produserte noen detekterbarmengde i det hele tatt. Ved små mengder katalysator ble hydrogen produksjonen funnettil å være tilnærmet lineært avhengig av katalysormengden i reaktoren, mens ved størremengder flatet kurven ut. Den optimale katalysatormengden for dette systemet ble op-pdaget til å være på rundt 500 mg, som tilsvarer 1 g/l. Ved denne katalysatormengdenble maksimale hydrogenproduksjonen mål til å være 3,05 mmol h−1 gcat.−1 ved bruk av10 m.% CuO på TiO2 og energieffektiviteten ble beregnet til å være på 0.41 %.
Ved å fornye væskefasen til systemet ble mye av den tapte hydrogenproduksjon gjen-opprettet, noe som tyder på at akkumelering av biprodukter er den dominerende årsakentil deaktivering. Det ble også oppdaget at fotoreformings reaksjonen fører til en vissredusering av CuO til metallisk Cu. Videre ble det ved BET målinger også oppdaget atselve IWI metoden etterfulgt av kalsinering ikke hadde noen innvirkning på det spesi-fikke overflatearealet til fotokatalysatoren, mens økende innhold av CuO reduserte detspesifikke overflatearealet.
iii

iv

AbstractThe purpose of this study was to investigate and optimize photoreforming of meth-anol as a environmental-friendly way to produce hydrogen as a by-product fromcleaning water. In order to scale up this process in a realistic manner and makeit globally available, the expensive noble metals currently used in the TiO2 basedphotocatalyst has to be replaced by cheaper alternatives like CuO which was chosenin this project.
In this study, the impact of the copper content in the catalyst was investigatedalong with the catalyst loading in the photoreactor. Deactivation and reactivationwas briefly studied and BET surface area measurements were performed to correl-ate the effect of copper content on the surface area of the catalyst.
Five different catalysts were prepared by using the incipient wetness (IWI)method, having a copper content of 0 wt.% 1 wt.% , 5 wt.% , 7.5 wt.% and 10 wt.%respectively. The activity of these photocatalysts were tested in a photoreformingprocess where a mixture of 250 ml water and 250 ml methanol was converted toH2 gas and CO2 using UVC-light at 254 nm. The photocatalyst without copperdid not produce any detectable amounts of H2 gas, but the peak hydrogen pro-duction rate among the other catalysts was very even. The catalyst containing 10wt.% copper did achieve the highest hydrogen generation rate, but the differenceto the other catalysts were marginal so nothing can be concluded due to randommeasurement errors.
Several photoreforming experiments were conducted with different catalystloadings in order to investigate the relationship between hydrogen generation andcatalyst loading. At very low catalyst loadings, the relationship between cata-lyst loading and hydrogen generation seemed almost linear and at higher loadingsthe curve flattened out. It was discovered that the catalyst saturation point forthis system was at about 500 mg, meaning that adding more photocatalyst afterthis point would not further increase the hydrogen generation rate. At this cata-lyst loading, the 10 wt.% CuO on TiO produced a maximum of 3.05 mmol H2h−1 gcat.−1 with a calculated quantum yield of 0.41 %
Deactivation was also briefly studied by registering the decay in hydrogen gen-eration over time and by attempting to reactivate the catalyst. Reactivation byhydrogen reduction did not have any notable effect, but refreshment of the liquidphase was highly effective in recovering the lost hydrogen generation rate. Thissuggests that accumulation of by-products is the most significant source of deac-tivation. It was also discovered that deactivation of the catalyst by reduction ofCuO to metallic Cu takes place, but the actual extent and impact of this effectwas not quantified.
The IWI method produced a catalyst where the particles tend to agglomer-ate to a varying degree. Because of this, getting reproducible results during thephotoreforming experiments proved to be a real challenge. The solution to thisproblem was to make the particle size as uniform as possible by repeated steps ofcrushing and sieving. BET experiments showed that the specific surface area ofthe TiO2 particles was unaffected by the IWI method and the calcination treat-ment. The specific surface area was also found to decrease when TiO2 was loadedwith CuO, meaning that a higher copper loading caused a lower specific surfacearea.
v

vi

ContentsPreface i
Norsk sammendrag iii
Abstract v
Contents 1
List of symbols and abbreviations 3
1 Introduction 4
2 Theory and background information 62.1 What is a photocatalyst? . . . . . . . . . . . . . . . . . . . . . . . . . . . 62.2 The history of photocatalysis . . . . . . . . . . . . . . . . . . . . . . . . 72.3 How photocatalysts work . . . . . . . . . . . . . . . . . . . . . . . . . . . 82.4 Photoreforming . . . . . . . . . . . . . . . . . . . . . . . . . . . . . . . . 92.5 Commercial applications of TiO2 photocatalysis today . . . . . . . . . . 152.6 General properties of TiO2 and modifications . . . . . . . . . . . . . . . . 17
2.6.1 Strategies for improving titania’s photoactivity . . . . . . . . . . . 192.6.2 TiO2 loaded with copper and other co-catalysts . . . . . . . . . . 22
2.7 Alternatives to titania . . . . . . . . . . . . . . . . . . . . . . . . . . . . 262.8 Fabrication methods of TiO2 based photocatalysts . . . . . . . . . . . . . 28
2.8.1 Incipient wetness impregnation (IWI) . . . . . . . . . . . . . . . . 282.8.2 Calcination . . . . . . . . . . . . . . . . . . . . . . . . . . . . . . 282.8.3 Deposition precipitation method . . . . . . . . . . . . . . . . . . . 292.8.4 Photo deposition method . . . . . . . . . . . . . . . . . . . . . . . 292.8.5 Sol-gel method . . . . . . . . . . . . . . . . . . . . . . . . . . . . 29
2.9 Deactivation in photoreforming and water splitting . . . . . . . . . . . . 312.10 Surface area measurement by BET analysis . . . . . . . . . . . . . . . . . 32
3 Experimental 333.1 Preperation of the catalyst . . . . . . . . . . . . . . . . . . . . . . . . . . 333.2 Activity measurements . . . . . . . . . . . . . . . . . . . . . . . . . . . . 353.3 The challenge of obtaining reproducible results . . . . . . . . . . . . . . . 363.4 Reactivation attempts . . . . . . . . . . . . . . . . . . . . . . . . . . . . 393.5 BET measurements . . . . . . . . . . . . . . . . . . . . . . . . . . . . . . 39
4 Results and discussion 404.1 Activity measurments . . . . . . . . . . . . . . . . . . . . . . . . . . . . . 40
4.1.1 The effect of catalyst loading on hydrogen generation . . . . . . . 404.1.2 The effect of copper content on the photocatalytic activity of Cu−TiO2 43
4.2 Catalyst deactivation and reactivation attempts . . . . . . . . . . . . . . 454.3 Additional observations . . . . . . . . . . . . . . . . . . . . . . . . . . . . 484.4 Choosing the appropriate values to report . . . . . . . . . . . . . . . . . 514.5 BET results . . . . . . . . . . . . . . . . . . . . . . . . . . . . . . . . . . 53
1
5 Conclusions 54
6 Future work 55
References 56
Appendix I
Appendix A: Calculation examples and assumptions . . . . . . . . . . . . . . . I
Calculations regarding catalyst preparation . . . . . . . . . . . . . . . . . I
Calculating the quantum yield . . . . . . . . . . . . . . . . . . . . . . . . I
Quantifying the reproducibility by calculating relative errors . . . . . . . II
Thermodynamics: Finding the temperature needed to spontaneously formsignificant amounts of Cu2O . . . . . . . . . . . . . . . . . . . . . III
Appendix B: List of chemicals . . . . . . . . . . . . . . . . . . . . . . . . . . . IV
Appendix C: BET data . . . . . . . . . . . . . . . . . . . . . . . . . . . . . . . V
Appendix D: HSE and risk assessment . . . . . . . . . . . . . . . . . . . . . . VIII
Explanations . . . . . . . . . . . . . . . . . . . . . . . . . . . . . . . . . VIII
Hazardous activity identification process . . . . . . . . . . . . . . . . . . IX
Risk assessment . . . . . . . . . . . . . . . . . . . . . . . . . . . . . . . . XII
Chemical data sheets . . . . . . . . . . . . . . . . . . . . . . . . . . . . . XIV
2
List of symbols and abbreviations
Symbol/abbreviation Meaning UnitTW Terawatt, 1 TW=1× 10¹² watts W, TW
UV-rays Ultra violet rays (10 nm < λ < 400 nm) -λ Wavelength of electromagnetic waves m, nm
IUPAC International Union of Pure and Applied Chemistry -BET A characterisation method, see page 32 -VB Valence band -CB Conduction band -Θ Radiant flux of light W, lm (lumen)
VOC Volatile organic compound -eV Electron volts, 1 eV=1.9× 10⁻¹⁹ V eV, V
Turbidity The cloudiness or haziness of a fluid NTUM molar concentration mol/l
SCE Saturated calomel electrode(a reference electrode) -HOMO Highest occupied molecular orbital -LUMO lowest unoccupied molecular orbital -
P Pressure mmHg, bar(aq) Dissolved in water -(s) solid state -(g) gaseous state -IWI Incipient wetness impregnation -
∆H◦298 Standard enthalpy of reaction kJ/mol
DP Deposition precipitation -PD Photo deposition -STP Standard temperature and pressure -V Volume ml, l, cm3 at STPVm Adsorbed gas volume by monolayer coverage cm3 at STPT Temperature ◦C, K
∆Hads Heat of adsorption kJ/molχ
∆Hads−layer 1∆Hads−layer 2
-P0 saturation pressure bar, mmHg
m, wt. Mass, weight mg, gGC Gas chromatograph -
3
1 IntroductionToday we live in a world where the demand for energy continues to grow while our reser-voirs of fossil fuel are slowly being depleted. This calls for alternative energy sources,where renewable energy is highly preferred. Solar energy has the biggest theoretical po-tential of 600 TW [1], which is 40 times as big as the total world consumption of 15TW [2]. This means that if only a few percent of this energy could be successfully har-vested, it would supply the entire human population with enough energy. The traditionalscientific way of transforming radiation from the sun into highly applicable electrical en-ergy, is by the use of solar cells. When solar cells are used, the electric energy producedis usually used directly, being saved in batteries or used to split water into oxygen andhydrogen by electrolysis. The latter is an example of how hydrogen can be used as anenergy carrier, where the energy from the hydrogen can be regained in a fuel cell or bycombustion. What separates an energy carrier from an energy source is that an energycarrier needs energy input and is only used to store energy for a limited amount of time.
Today, most of the hydrogen produced in the world come from steam reforming of hy-drocarbons from natural gas which is a non-renewable source [3]. This is a complicatedand energy demanding process which leads to emissions of CO2 and other greenhousegasses. Hydrogen may also be made from renewable biomass through pyrolysis, but thisprocess is energy demanding which hampers the total energy efficiency [4]. Both of theseprocesses produce CO as one of the by-products, which is a problem if the hydrogen isto be used in a fuel cell. The catalyst used in fuel cells is easily poisoned by CO, so ifthis gas mixture is to be used in a fuel cell the CO has to be removed first. This is whythe clean hydrogen produced by electrolysis of water is preferred in fuel cells [5]
Water electrolysis powered by solar cells is not the only route to produce hydrogenfrom solar energy. Hydrogen gas can also be produced directly from water through pho-tocatalytic water splitting, omitting the electrolysis step. In this process the water ismixed with a catalyst powder, usually titanium dioxide with a co-catalyst. When thismixture is irradiated with UV-rays, the titanium oxide becomes active and some watersplits into hydrogen and oxygen. These UV-rays should ideally come from the sun, inorder to make the process sustainable. Because the catalyst needs to be irradiated withphotons to become active, it is called a photocatalyst.
The rate of hydrogen production may be increased by adding a sacrificial agent tothe mixture. A sacrificial agent is usually an oxygenated organic compound like sugars,alcohols and organic acids. When such compounds are added to the reaction mixture,the process is called photoreforming and the sacrificial agents are converted to CO2 alongwith H2 gas. These compounds may come from renewable sources like plants and generalvegetation, or they may come from wastewater. For example, the sewage from the foodindustry is rich in water-solouble carbohydrates [6]. This means that photoreforming maybe utilized as a process to cleanse water using sunlight, while even producing hydrogenas a wanted by-product.
4

Because areas having a poor water supply often have plenty of sunlight, this techno-logy has great potential to be a good solution when it has matured. The process is alsoin principle CO2 neutral as long as the organic compounds comes from renewable sourceslike biomass and not from fossil ones. Because of ever continuing population growth,experts think that pure drinking water and energy will be the most scarce resources inthe future [7]. Photocatalysis might offer a solution to this problem, as it combines theearth’s most abundant energy source (the sun) with the most abundant resource (water)and convert it into applicable energy and pure drinking water.
Unfortunately the development of the photocatalysis field has not yet come to a pointwhere this technology is widely applicable. Today’s photocatalysts are constrained bythe fact that most of them can only utilize a small part of the solar spectrum and theoverall efficiency is quite low. If hydrogen technology is to be adopted by the society, newinfrastructure is needed along with new technologies for sustainable hydrogen storage anddistribution [8].
This project focuses on copper loaded TiO2 which is one of the most cost effectivephoto catalyst developed so far. Some of the goals are to find the optimum copper loading,to find the optimum catalyst mass to use for experiments and to develop a routine toensure that the obtained activity measurements are repeatable. Deactivation will also bestudied and the different catalysts will be analysed with a BET instrument to correlatethe specific surface area to the copper content in the photocatalysts.
5

2 Theory and background information
2.1 What is a photocatalyst?IUPAC defines photocatalyst as "catalyst able to produce, upon absorption of light,chemical transformations of the reaction partners. The excited state of the photocata-lyst repeatedly interacts with the reaction partners forming reaction intermediates andregenerates itself after each cycle of such interactions." [9]. The definition of a catalystis a substance that increases the rate of a chemical reaction without being consumed.Simply put, a photocatalyst is a catalyst that becomes active under/during the irradi-ation of photons which may come naturally from the sun or from man-made light bulbsor lamps. The adsorbed photons excites electrons from the valence band (VB) to theconduction band (CB) in the photocatalytic material, producing an oxidative hole and areducing electron. Because photocatalysts may utilize photons as an energy imput, theyare able do drive uphill reactions that are otherwise not thermodynamically favourable atthe current conditions. This marks a clear distinction from normal catalysts, which cannever drive uphill reactions or change the equilibrium composition of a chemical mixture.The conceptual difference between a catalyst and a photocatalyst is illustrated in figure1 below.
Figure 1: The difference in concepts between catalysis and photocatalysis. Note that theterm "active site" is not used on the photocatalysts because it is inappropriate [10].
The rate of catalytic reaction on a photocatalyst is predominantly governed by thenumber of active sites that are irradiated with light and the light intensity. The dark sideof a photocatalyst does not contribute to the reaction rate so usage of the term "activesite" is therefore inappropriate [10].
6
2.2 The history of photocatalysisAlthough the field of photocatalysis is relatively new and unknown to most people, itactually has roots reaching more than 80 years back in time. The Swiss were some of thefirst to report photocalytic activity, starting as early as in 1921. A swiss named Renzreported that titania would change colors when in contact with organic compounds whilebeing exposed to sunlight. The color changed from white to grey, blue or even blackwhen irradiated, and this was believed to happen due to partially oxidation of the oxide.Similar phenomena were also discovered with oxides of cerium, niob and tantalum . In1924, Baur and Perret at the Swiss Federal Institute of Technology reported that pho-tocatalytic deposition of metallic silver occurred when ZnO was in contact with a silversalt during exposure of sunlight. Even at this early date, the authors suspected that bothreduction and oxidation were occurring at the same time. In 1932 Renz reported thatthe same would happen to gold on TiO2 and Nb2O5, and already in 1927 scientists madeH2O2 from methanol on a ZnO photocatalyst [11].
In the late 1930s the chalk formation on paints was studied extensively and it was con-firmed that the cause of this phenomena is related to titania’s photocatalytic activity. Inthe late 1950s, russian scientists discovered an important difference between photocata-lytic properties of ZnO and TiO2. It was found that TiO2 was able to fully oxidise H2O toO2 but ZnO could not oxidise it further than to H2O2. This is probably one of the factorsthat caused TiO2 to exceed ZnO in popularity in the 1960s. The Japanese scientists Katoand Mashio discovered in 1964 that the anatase allotrope of TiO2 is more active thanrutile during photocatalytic oxidation of organic molecules.
An important breakthrough happened in 1972 when photocatalytic water splittingwas reported for the first time by Fujishima and Honda. They used a titanium elec-trode to split water into hydrogen and oxygen through photoelectrochemistry, and thismethod of water splitting was named "The Honda-Fujishima effect". This discovery putphotocatalysis in the spotlight and helped accelerate the study of the field [10] [12].Today technology based on photocatalysis is being used to purify water and air throughoxidation of organic compounds, in self cleaning surfaces, in anti fogging mirrors andsterilization of tiles among others.
7
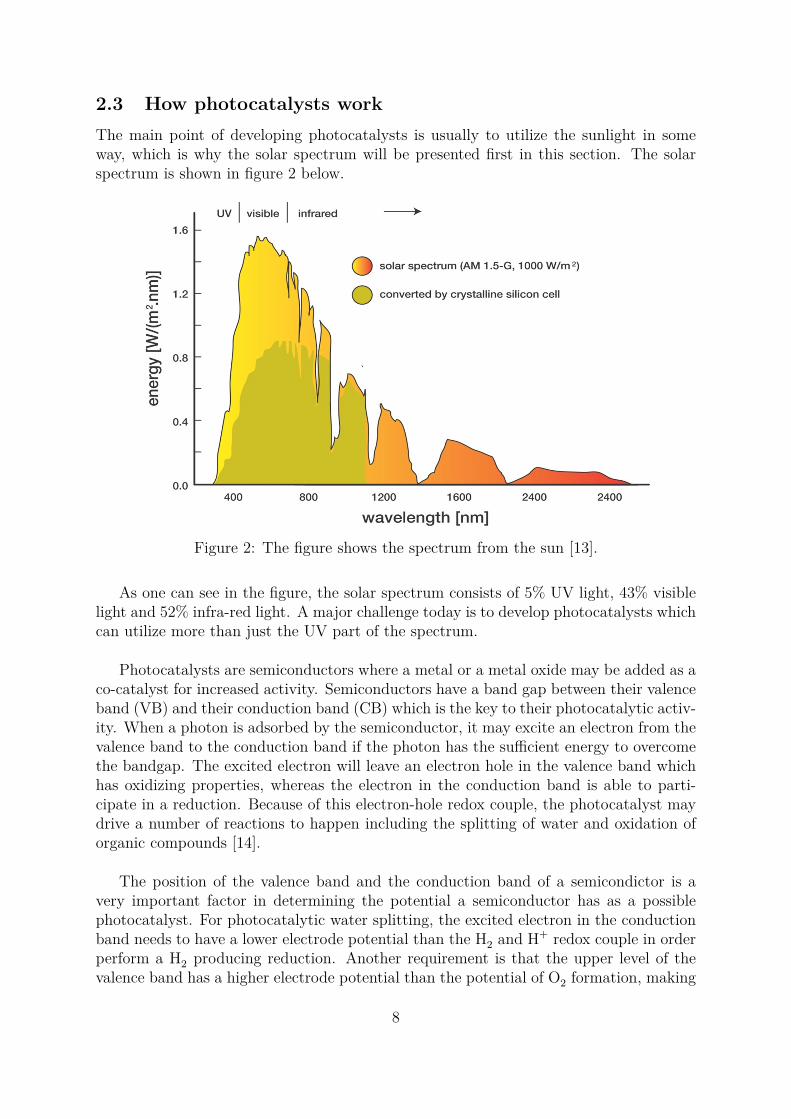
2.3 How photocatalysts workThe main point of developing photocatalysts is usually to utilize the sunlight in someway, which is why the solar spectrum will be presented first in this section. The solarspectrum is shown in figure 2 below.
Figure 2: The figure shows the spectrum from the sun [13].
As one can see in the figure, the solar spectrum consists of 5% UV light, 43% visiblelight and 52% infra-red light. A major challenge today is to develop photocatalysts whichcan utilize more than just the UV part of the spectrum.
Photocatalysts are semiconductors where a metal or a metal oxide may be added as aco-catalyst for increased activity. Semiconductors have a band gap between their valenceband (VB) and their conduction band (CB) which is the key to their photocatalytic activ-ity. When a photon is adsorbed by the semiconductor, it may excite an electron from thevalence band to the conduction band if the photon has the sufficient energy to overcomethe bandgap. The excited electron will leave an electron hole in the valence band whichhas oxidizing properties, whereas the electron in the conduction band is able to parti-cipate in a reduction. Because of this electron-hole redox couple, the photocatalyst maydrive a number of reactions to happen including the splitting of water and oxidation oforganic compounds [14].
The position of the valence band and the conduction band of a semicondictor is avery important factor in determining the potential a semiconductor has as a possiblephotocatalyst. For photocatalytic water splitting, the excited electron in the conductionband needs to have a lower electrode potential than the H2 and H+ redox couple in orderperform a H2 producing reduction. Another requirement is that the upper level of thevalence band has a higher electrode potential than the potential of O2 formation, making
8
the oxidation of the oxygen atom in H2O possible [6]. If the bandgap of the semiconductoris small, it will be less energy demanding for photons to cause an excitation. Becausethe energy of the photons decrease with increasing wavelength, a photocatalyst having alow bandgap may also utilize light at a higher wavelength such as visible light. There ishowever a critical drawback to having a small bandgap, which is the fact that electronsand holes will recombine at an increased rate. When such a recombination occurs, nochemical reaction will take place and the photon energy is only converted to heat. Thisleads to decreased activity, even though a larger part of the sunlight may be used. Be-cause of this, there is a trade-off between increasing the bandgap to stop recombinationand narrowing it to harvest more sunlight which has to be balanced for optimization ofthe photocatalysts. The band positions of some semiconductors are shown in figure 17on page 27.
2.4 PhotoreformingThe main focus of this project is photocatalytic water splitting assisted by methanol. Inthis process it is in fact mostly the methanol which is converted to H2 gas and CO2 whilemost of the water remain intact. This reaction is called "Photoreforming" and will inprinciple be CO2 neutral if the methanol is made from biomass and sunlight is utilized asthe source of light. There are several proposed mechanisms for photoreforming reactionswhich depends on the catalyst used, but here is what most of them have in common:
• A photon is first adsorbed by the semiconductor, causing an electron to be excitedfrom the valence band to the conduction band
• The hole left behind in the valence band reacts with water and forms a hydroxyradical (OH•) and a H+ ion
• If oxygenated hydrocarbons containing one or several OH groups are present, theywill act as a sacrificial agent and react with the hole in water’s place forming a H+
ion and a reactive R-O• radical
• The oxygenated hydrocarbons and their respective radicals will undergo a series ofoxidation reactions with either an electron hole or with another radical, graduallytransforming it to CO2 by either removal of hydrogen atoms or by introduction ofoxygen
• The excited electron is transferred to a co-catalyst if present, before it reduces H+
to H2. It can also reduce O2 to an unstable O2•radical
• The end products are always CO2, H2 and sometimes CO in addition to partlyoxidized hydrocarbons as by products
Hydrocarbons such as sugars and alcohols, are often called "sacrificial agents" becausethey are easier to reduce than water which makes them react with the holes in it’s place.
9
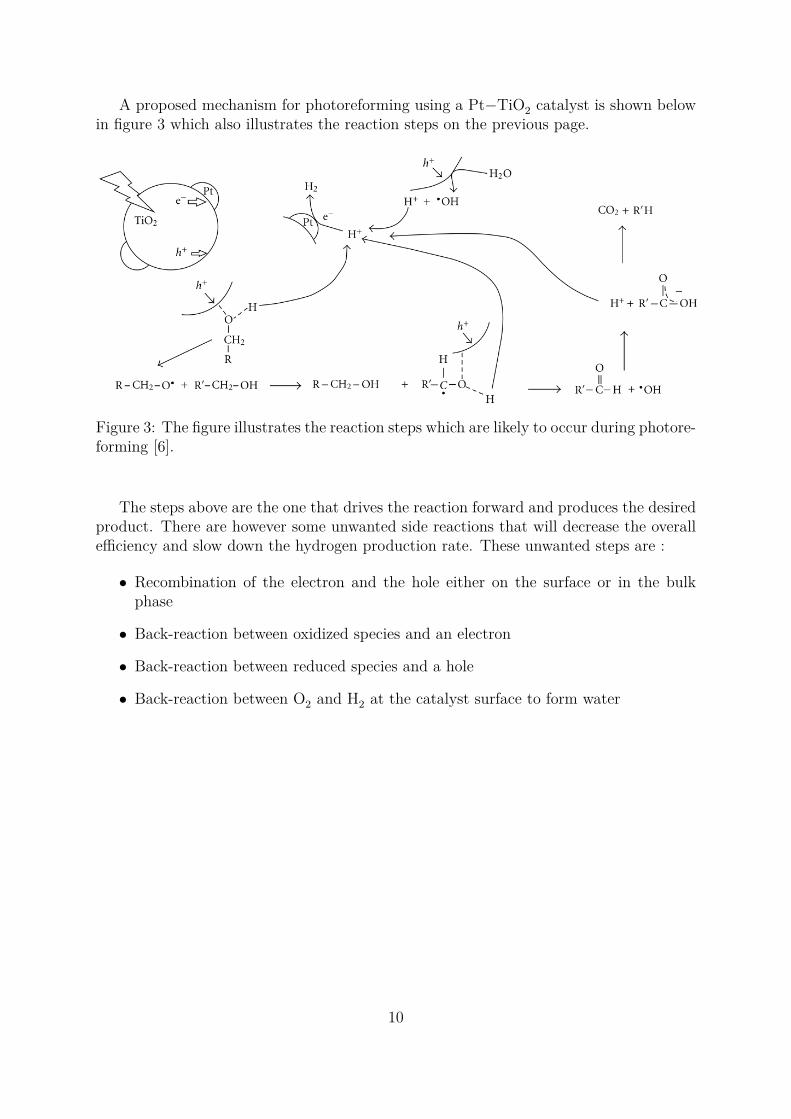
A proposed mechanism for photoreforming using a Pt−TiO2 catalyst is shown belowin figure 3 which also illustrates the reaction steps on the previous page.
Figure 3: The figure illustrates the reaction steps which are likely to occur during photore-forming [6].
The steps above are the one that drives the reaction forward and produces the desiredproduct. There are however some unwanted side reactions that will decrease the overallefficiency and slow down the hydrogen production rate. These unwanted steps are :
• Recombination of the electron and the hole either on the surface or in the bulkphase
• Back-reaction between oxidized species and an electron
• Back-reaction between reduced species and a hole
• Back-reaction between O2 and H2 at the catalyst surface to form water
10
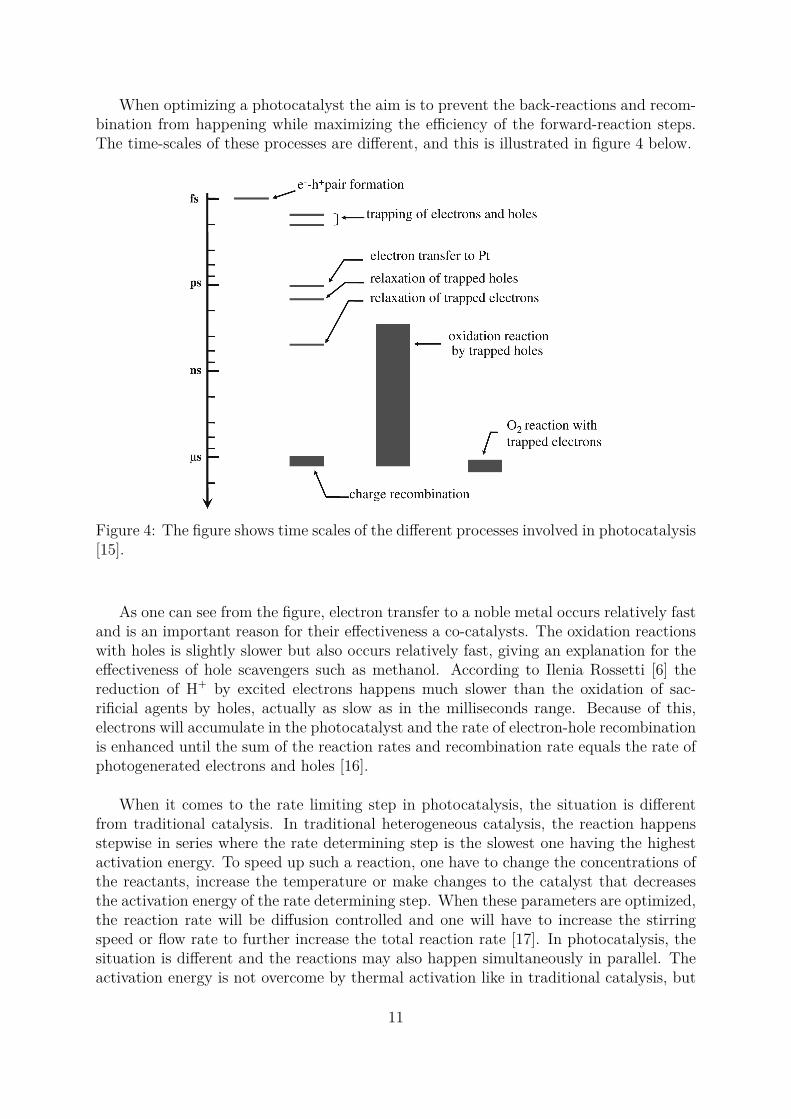
When optimizing a photocatalyst the aim is to prevent the back-reactions and recom-bination from happening while maximizing the efficiency of the forward-reaction steps.The time-scales of these processes are different, and this is illustrated in figure 4 below.
Figure 4: The figure shows time scales of the different processes involved in photocatalysis[15].
As one can see from the figure, electron transfer to a noble metal occurs relatively fastand is an important reason for their effectiveness a co-catalysts. The oxidation reactionswith holes is slightly slower but also occurs relatively fast, giving an explanation for theeffectiveness of hole scavengers such as methanol. According to Ilenia Rossetti [6] thereduction of H+ by excited electrons happens much slower than the oxidation of sac-rificial agents by holes, actually as slow as in the milliseconds range. Because of this,electrons will accumulate in the photocatalyst and the rate of electron-hole recombinationis enhanced until the sum of the reaction rates and recombination rate equals the rate ofphotogenerated electrons and holes [16].
When it comes to the rate limiting step in photocatalysis, the situation is differentfrom traditional catalysis. In traditional heterogeneous catalysis, the reaction happensstepwise in series where the rate determining step is the slowest one having the highestactivation energy. To speed up such a reaction, one have to change the concentrations ofthe reactants, increase the temperature or make changes to the catalyst that decreasesthe activation energy of the rate determining step. When these parameters are optimized,the reaction rate will be diffusion controlled and one will have to increase the stirringspeed or flow rate to further increase the total reaction rate [17]. In photocatalysis, thesituation is different and the reactions may also happen simultaneously in parallel. Theactivation energy is not overcome by thermal activation like in traditional catalysis, but
11

by photonic activation [18]. As a consequence, the photocatalytic reaction rate is muchless sensitive to changes in temperature compared to thermally activated reactions. Inphotoreforming, it may be misleading to define one rate determining step because therewill usually be several factors that simultaneously affects the total reaction rate. A goodway to describe the situation is to define three regimes with respect to photon flux, anddescribe them thoroughly. The three regimes are illustrated in figure 5 below.
Figure 5: The figure shows how the total reaction rate increases with the light intensity.
J.-M Herrmann [18] describes the first and second regime , while B. Ohtani [10] de-scribes the extreme cases of the first and the third regime. In the first regime, the reactionis light-intensity controlled where the lack of electrons and holes controls the reaction.The reaction rate is proportional to the radiant flux in this regime. The diffusion of sub-strate to the surface of the photocatalyst particle and the adsorption on to the particlesis fast compared to the photogeneration holes and electrons. This is the case for highcatalyst loadings where the photons are shared by a great number of catalyst particles,or when a low amount of UV lamps are used which results in low light intensities. Inthis regime, the reaction rate is proportional to the radiant flux and it can be increasedsimply by adding more UV-lamps to the set-up.
In the second regime, increasing the photon flux does still increase the reaction ratebut the rate of electron excitation (decided by the radiant flux) is now higher than theconsumption of electrons by reduction of adsorbed H+ ions. This causes electrons to ac-cumulate in the the bulk TiO2 phase and H+ to accumulate on the surface, until the sumof the recombination rate and the reduction rate of H+ which consumes electrons equalsthe generation of electrons by photonic excitation. Because the rate of recombinationincreases with the radiant flux, some photon energy is wasted and the reaction rate’sdependence on the light flux starts to fall off. Herrmann argues that the reaction rateat this point is proportional to the square root of the radiant flux (
√Θ), but this might
not be the case for photoreforming. In his example, the substrate to be reduced and thesubstrate to be oxidised are independent of each other, but in the case of photoreforming
12
the substrate to be reduced (H+) is mainly generated from the sacrificial agent when itis oxidised by holes. In this regime, increasing the concentration of the sacrificial agentwill also have a positive effect on the activity.
The third regime occurs when the radiant flux is very high or when the catalystloading is really low, causing every particle of the photocatalyst to receive an excess ofincoming photons. At this point, the total reaction rate is diffusion controlled and thesurface reaction happens very rapidly. In this regime, the reaction rate is proportionalto the concentration of the sacrificial agent and first-order kinetics is observed [10]. Anincrease in the radiant flux may in the best case only increase the temperature in thereactor, contributing poorly to boost the reaction rate.
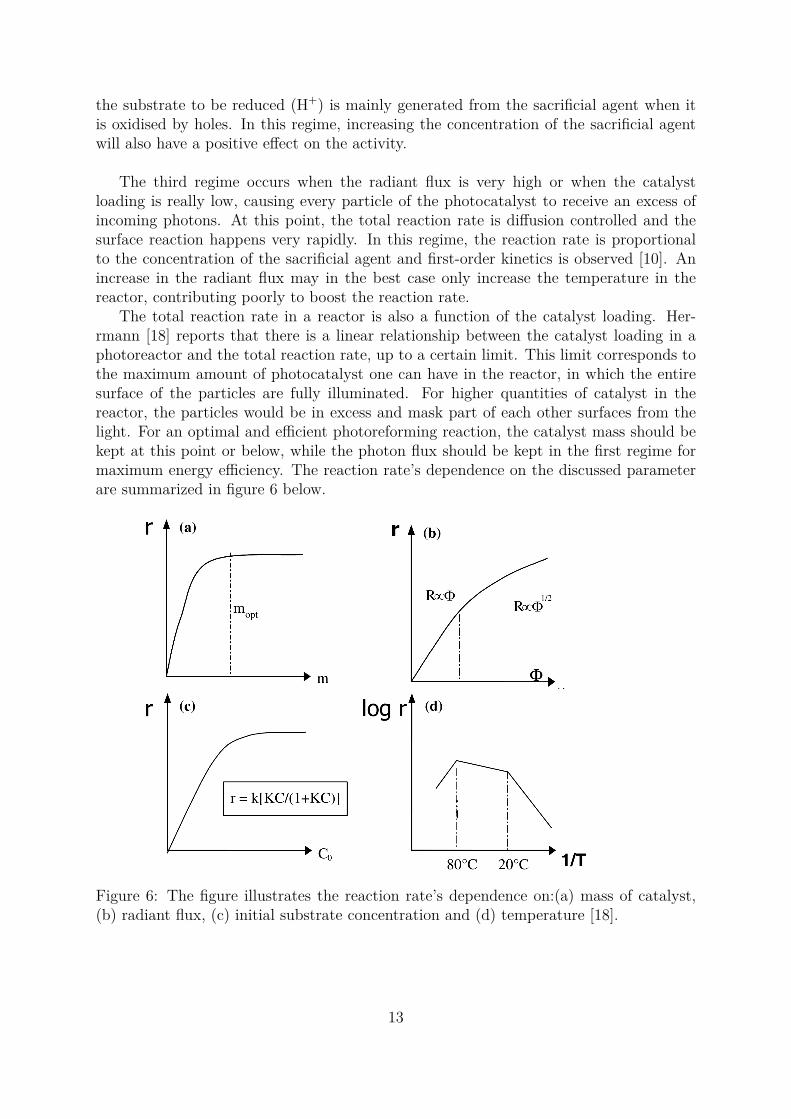
The total reaction rate in a reactor is also a function of the catalyst loading. Her-rmann [18] reports that there is a linear relationship between the catalyst loading in aphotoreactor and the total reaction rate, up to a certain limit. This limit corresponds tothe maximum amount of photocatalyst one can have in the reactor, in which the entiresurface of the particles are fully illuminated. For higher quantities of catalyst in thereactor, the particles would be in excess and mask part of each other surfaces from thelight. For an optimal and efficient photoreforming reaction, the catalyst mass should bekept at this point or below, while the photon flux should be kept in the first regime formaximum energy efficiency. The reaction rate’s dependence on the discussed parameterare summarized in figure 6 below.
Figure 6: The figure illustrates the reaction rate’s dependence on:(a) mass of catalyst,(b) radiant flux, (c) initial substrate concentration and (d) temperature [18].
13

One final parameter that affects the reaction rate is the nature of the sacrificial agent.Bahruji et al. conducted experiments with several different substrates on a Pd−TiO2catalyst in order to compare their activity in a photoreforming reaction and to attemptto find and a pattern or explanation as to why some substrates are active and some arenot. They found that the photocatalytic reforming process requires a substrate havingan oxy-function with at least one α-hydrogen atom in order produce detectable amountsof hydrogen [19]. The activity of the different substrates are plotted together in figure 7below:
Figure 7: The figure shows a comparison of the activity of different sacrificial agents aphotoreforming reaction over a Pd−TiO2 photocatalyst. [19]
It is important to note that this preference of substrates is unique to the Pd−TiO2photocatalyst, which means that a Cu−TiO2 photocatalyst could yield different resultsduring a similar experiment.
14

2.5 Commercial applications of TiO2 photocatalysis todayTitania’s usage is not limited to only photocatalysts, the material possesses several uniqueproperties which makes it useful in a wide range of applications. Figure 8 below shows asummary of the most important applications of TiO2 [14].
Figure 8: The figure shows a summary of the different applications for the photocatalyticmaterial TiO2.
Titanium oxide possesses a really rare property: It changes its hydrophilic nature whenirradiated with UV photons. The contact angle of water on TiO2 decreases gradually overtime if the material is exposed to UV light, reaching almost 0 ◦. This causes water onthe surface to form a thin film instead of drops, which keeps the surface transparent andresistant to fogging. This is taken advantage of by coating mirrors and glass with TiO2to preserve the transparency under wet conditions during daytime
15
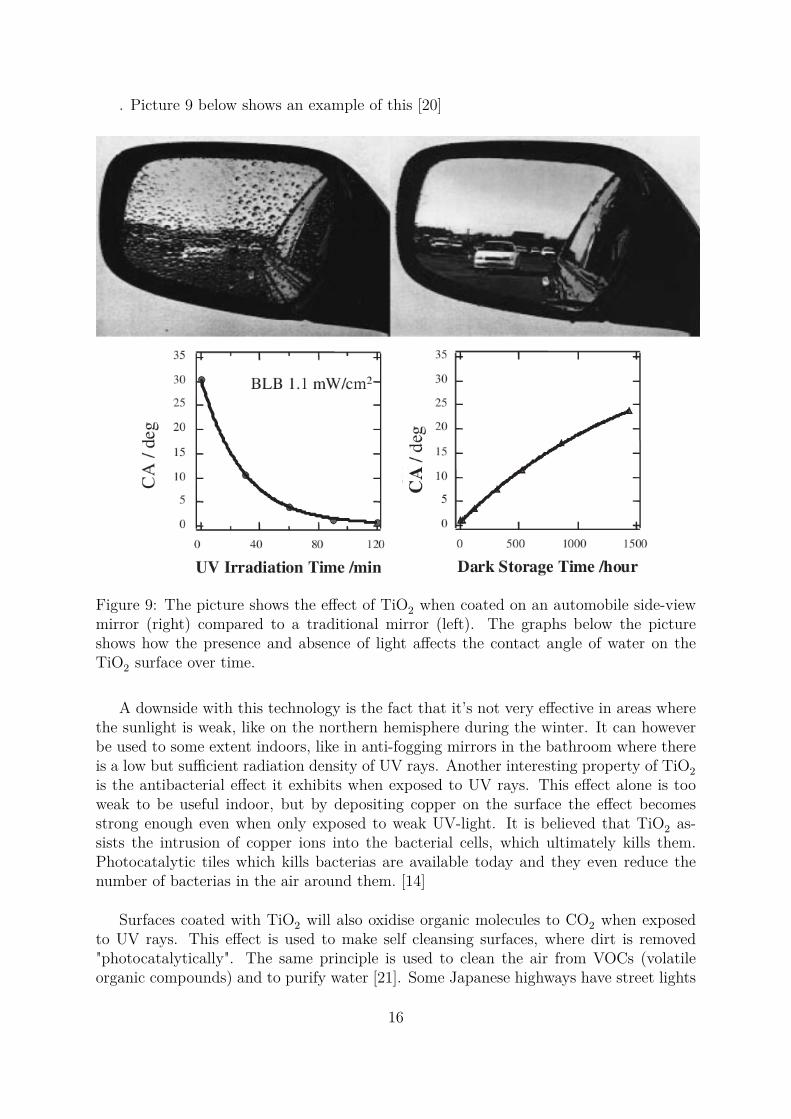
. Picture 9 below shows an example of this [20]
Figure 9: The picture shows the effect of TiO2 when coated on an automobile side-viewmirror (right) compared to a traditional mirror (left). The graphs below the pictureshows how the presence and absence of light affects the contact angle of water on theTiO2 surface over time.
A downside with this technology is the fact that it’s not very effective in areas wherethe sunlight is weak, like on the northern hemisphere during the winter. It can howeverbe used to some extent indoors, like in anti-fogging mirrors in the bathroom where thereis a low but sufficient radiation density of UV rays. Another interesting property of TiO2is the antibacterial effect it exhibits when exposed to UV rays. This effect alone is tooweak to be useful indoor, but by depositing copper on the surface the effect becomesstrong enough even when only exposed to weak UV-light. It is believed that TiO2 as-sists the intrusion of copper ions into the bacterial cells, which ultimately kills them.Photocatalytic tiles which kills bacterias are available today and they even reduce thenumber of bacterias in the air around them. [14]
Surfaces coated with TiO2 will also oxidise organic molecules to CO2 when exposedto UV rays. This effect is used to make self cleansing surfaces, where dirt is removed"photocatalytically". The same principle is used to clean the air from VOCs (volatileorganic compounds) and to purify water [21]. Some Japanese highways have street lights
16
covered with TiO2 containing glass, which keeps them clean from exhaust particles anddust. Titanium oxide has also been coated on a 500 m long road stretch near Osaka inJapan, where it oxidises NOx gasses to NO–
3 ions that are washed away by the rain andthus making the air cleaner [13]. Photocatalytic water splitting and photoreforming arepossible to perform in a lab, but the efficiency is still too low to be of any commercialinterest [21].
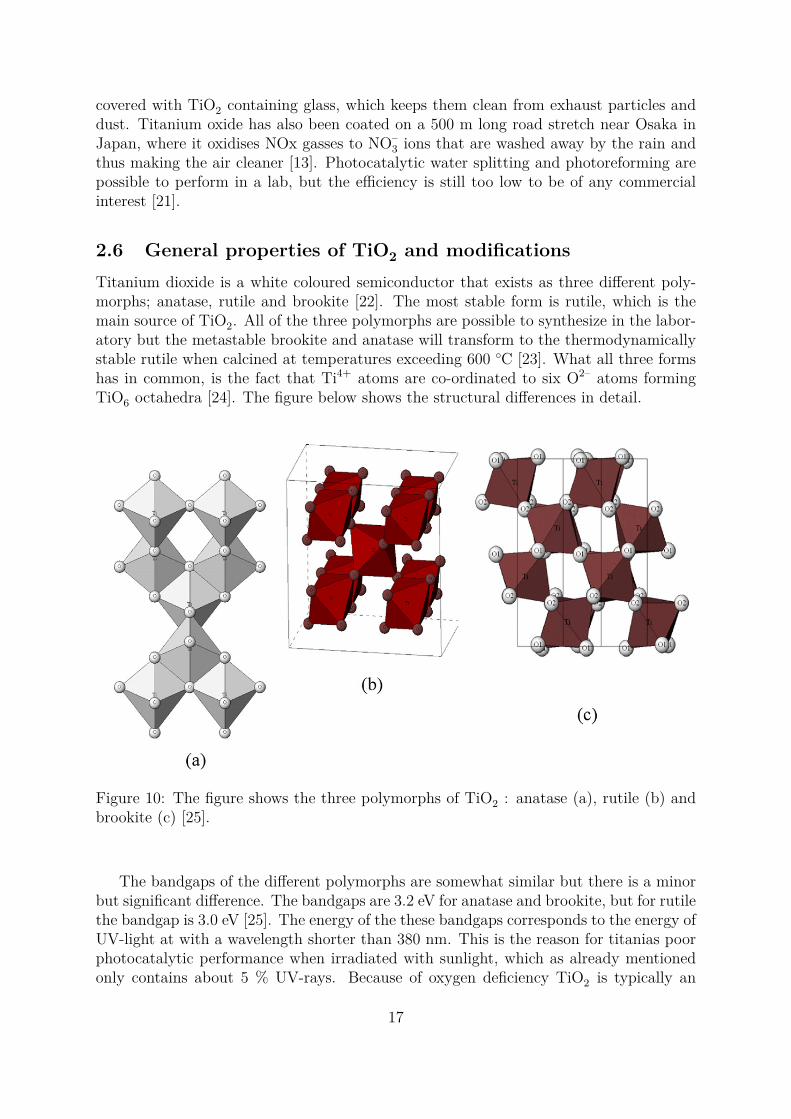
2.6 General properties of TiO2 and modificationsTitanium dioxide is a white coloured semiconductor that exists as three different poly-morphs; anatase, rutile and brookite [22]. The most stable form is rutile, which is themain source of TiO2. All of the three polymorphs are possible to synthesize in the labor-atory but the metastable brookite and anatase will transform to the thermodynamicallystable rutile when calcined at temperatures exceeding 600 ◦C [23]. What all three formshas in common, is the fact that Ti4+ atoms are co-ordinated to six O2– atoms formingTiO6 octahedra [24]. The figure below shows the structural differences in detail.
Figure 10: The figure shows the three polymorphs of TiO2 : anatase (a), rutile (b) andbrookite (c) [25].
The bandgaps of the different polymorphs are somewhat similar but there is a minorbut significant difference. The bandgaps are 3.2 eV for anatase and brookite, but for rutilethe bandgap is 3.0 eV [25]. The energy of the these bandgaps corresponds to the energy ofUV-light at with a wavelength shorter than 380 nm. This is the reason for titanias poorphotocatalytic performance when irradiated with sunlight, which as already mentionedonly contains about 5 % UV-rays. Because of oxygen deficiency TiO2 is typically an
17
n-type semiconductor [26]. Today TiO2 is by far the most investigated photocatalyst,and this is due to low cost, high photo-activity and resistance to photocorrosion , lowtoxicity and good chemical and thermal stability ( [25], [27], [28] , [29]). The toxicityis practically absent, which is why it’s even used in food additives, toothpaste and asan UV-blocker in sunscreens [30] [31]. In this project a type of commercial TiO2 called"Degussa P25" was used. P25 contains around 80% anatase and 20% rutile [25] witha moderately high surface area of about 50 m
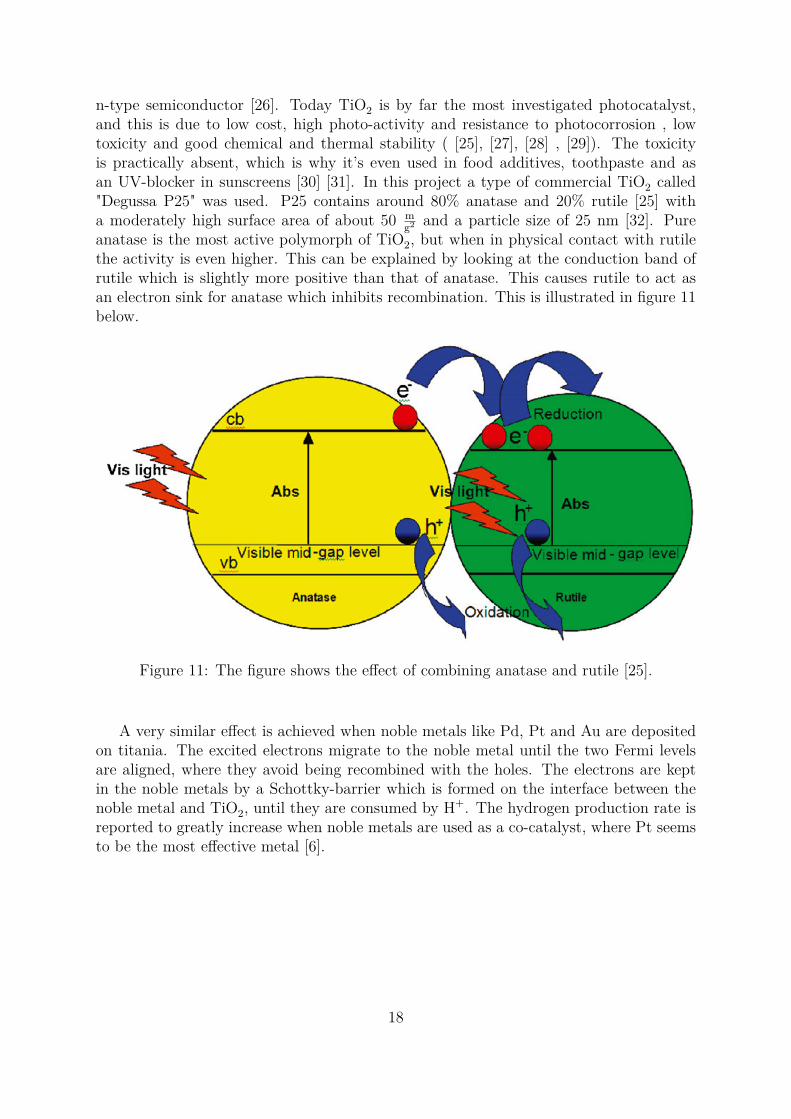
g2 and a particle size of 25 nm [32]. Pureanatase is the most active polymorph of TiO2, but when in physical contact with rutilethe activity is even higher. This can be explained by looking at the conduction band ofrutile which is slightly more positive than that of anatase. This causes rutile to act asan electron sink for anatase which inhibits recombination. This is illustrated in figure 11below.
Figure 11: The figure shows the effect of combining anatase and rutile [25].
A very similar effect is achieved when noble metals like Pd, Pt and Au are depositedon titania. The excited electrons migrate to the noble metal until the two Fermi levelsare aligned, where they avoid being recombined with the holes. The electrons are keptin the noble metals by a Schottky-barrier which is formed on the interface between thenoble metal and TiO2, until they are consumed by H+. The hydrogen production rate isreported to greatly increase when noble metals are used as a co-catalyst, where Pt seemsto be the most effective metal [6].
18
2.6.1 Strategies for improving titania’s photoactivity
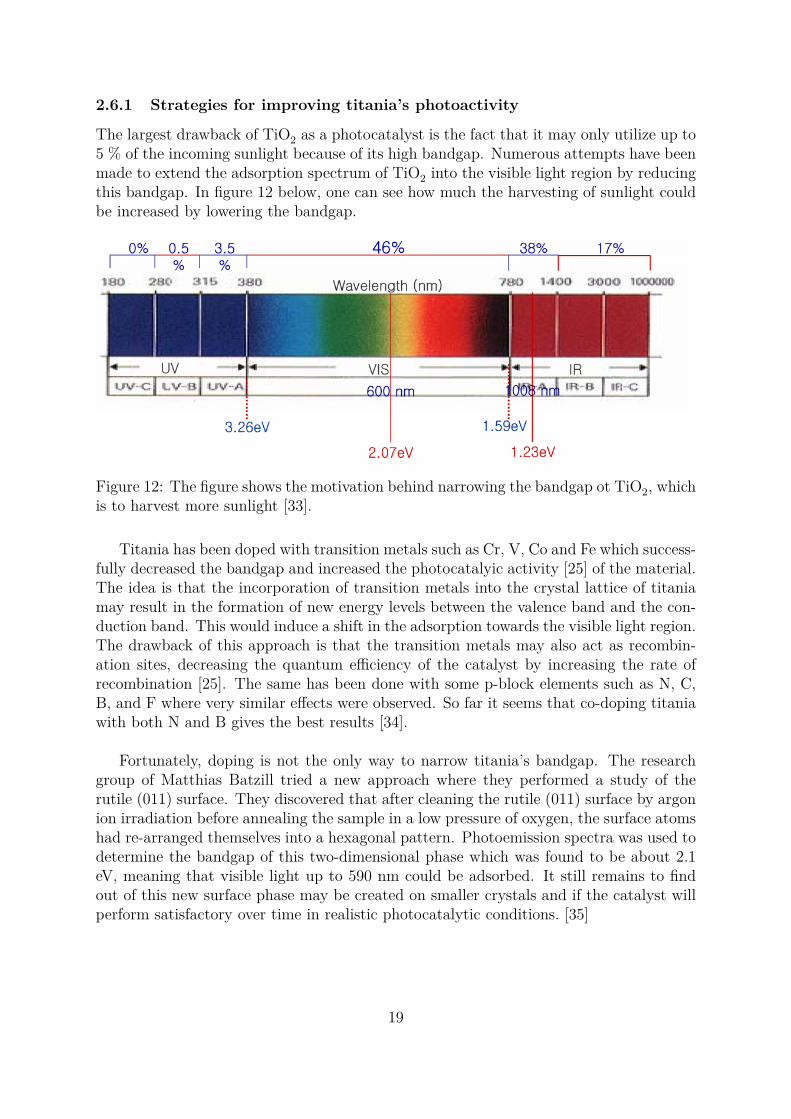
The largest drawback of TiO2 as a photocatalyst is the fact that it may only utilize up to5 % of the incoming sunlight because of its high bandgap. Numerous attempts have beenmade to extend the adsorption spectrum of TiO2 into the visible light region by reducingthis bandgap. In figure 12 below, one can see how much the harvesting of sunlight couldbe increased by lowering the bandgap.
Figure 12: The figure shows the motivation behind narrowing the bandgap ot TiO2, whichis to harvest more sunlight [33].
Titania has been doped with transition metals such as Cr, V, Co and Fe which success-fully decreased the bandgap and increased the photocatalyic activity [25] of the material.The idea is that the incorporation of transition metals into the crystal lattice of titaniamay result in the formation of new energy levels between the valence band and the con-duction band. This would induce a shift in the adsorption towards the visible light region.The drawback of this approach is that the transition metals may also act as recombin-ation sites, decreasing the quantum efficiency of the catalyst by increasing the rate ofrecombination [25]. The same has been done with some p-block elements such as N, C,B, and F where very similar effects were observed. So far it seems that co-doping titaniawith both N and B gives the best results [34].
Fortunately, doping is not the only way to narrow titania’s bandgap. The researchgroup of Matthias Batzill tried a new approach where they performed a study of therutile (011) surface. They discovered that after cleaning the rutile (011) surface by argonion irradiation before annealing the sample in a low pressure of oxygen, the surface atomshad re-arranged themselves into a hexagonal pattern. Photoemission spectra was used todetermine the bandgap of this two-dimensional phase which was found to be about 2.1eV, meaning that visible light up to 590 nm could be adsorbed. It still remains to findout of this new surface phase may be created on smaller crystals and if the catalyst willperform satisfactory over time in realistic photocatalytic conditions. [35]
19

A research group lead by Samuel Mao also took a different approach to narrowingthe bandgap of TiO2. They managed to reduce TiO2 in a hydrogen atmosphere whichmade the material turn black, a good sign when the goal is to make the TiO2 adsorbas much light as possible. This treatment narrowed the bandgap down to incredible 1eV which corresponds to light up to 1200 nm. This material was loaded with 0.6 wt.%Pt and the catalyst was tested under irradiation from a sunlight-simulating lamp whereit yielded a promising 10 mmol H2 h−1 gcat.−1 . This was a persistant production rateand the catalyst was tested for several days without much sign of deactivation. It wascalculated that 24% of the incoming sunlight was harvested to produce H2 gas, which isa very high efficiency for TiO2 [35] [36]. As a comparison, the experiments in this projectyielded a quantum efficiency of only 0.41 % with UV radiation on copper loaded P25titania.
Nano-structuring of TiO2 is another subject that has received much attention duringthe recent years. The motivation behind performing nano-structuring of TiO2 can beto increase the overall surface area of the catalyst, to shorten the diffusion paths of thereactants and to avoid recombination of the electron and the hole in the bulk phase. Allof these effects should contribute to increasing the activity of the photocatalytic TiO2material. The rate of recombination in the bulk phase is reduced by decreasing the sizeof particles so the surface to volume ratio is favorable, and by making sure the particleshave a high degree of crystallinity which minimizes the number of bulk defects acting asrecombination centers [25]. In addition to usage photocatalysis, titania-based nanoma-terials also show promising potential applications in gas sensing devices and solar cells.The nano-structures are systematically classified into different groups depending on theirgeometric shape.The zero-dimensional group consists of spheres which can be either filled with bulk ma-terial or be more or less hollow. These particles usually posess a high specific surfacearea, they have a high pore volume and high pore size. These attributes result in highphotocatalytic activity because of the high amount of accessible surface and good con-ditions for mass transfer. Enhanced light-harvesting is also a factor which helps on thephotocatalytic activity and occurs because light is allowed to access not only the externalsurface area but also the internal surface area of the hollowed sphere [14].
The one-dimensional group consists of fibers and tubes that have most of the sameadvantages as the zero-dimensional group, except for the enhanced light harvesting. Ti-tania fibers are already used in other applications like gas sensing and batteries [14]. Thetwo-dimensional group consists of TiO2 nanosheets which is a very thin, flake-shapedmaterial with a high aspect ratio. This material has low turbidity, high smoothness andexcellent adhesion to substrates which make it well suited for self-cleaning coatings. Likenormal titania, this nano-coating will also become superhydrophilic when exposed to UV-light. This is the reason for its usage on car mirrors and non-fogging goggles as shown infigure 9 on page 16.
The last group is the three dimensional group, in which we find the interconnectedTiO2 architecture. This structure has potential applications in steady-state photo react-ors as a TiO2 sponge may be produced and used instead of TiO2 powder. While the total
20

surface area may suffer, usage of the TiO2 sponge has the advantage of not requiring aseparation step as there is no catalyst powder that has to be separated from the outgoingliquid. This gives it a practical advantage over traditional powder based TiO2 becausefiltering of outgoing flow can be omitted [35].Figure 13 below shows a summary of thedifferent nanostructures along with their key properties.
Figure 13: The figure shows some different nano structures of titania [25].
21

2.6.2 TiO2 loaded with copper and other co-catalysts
In photoreforming, the activity of pure TiO2 is usually negligible in the absence a co-catalyst. The previous subsection discussed ways to improve the titania part of thephotocatalyst, while this subsection focuses on the co-catalyst part. Noble metals suchas platinum, palladium, rhodium, gold and ruthenium will greatly enhance the pho-tocatalytic activity of TiO2 even with loadings as low as only 1 wt.% [6]. In the recentyears, great emphasis has been put on replacing these expensive noble metals with morecommon metals without sacrificing too much of the photocatalytic activity. This woulddramatically reduce the cost of the photocatalyst making the process more economicallyviable. Judging from recent scientific papers, it seems like copper is a very good altern-ative to noble metals as a co-catalyst. The photoactivity is decent and the stability isgood. The copper is usually present as CuO and Cu2O which are the most active, andsome of it may even be present as metallic copper which also has a lower but significantactivity [3]. Even though copper usually exists in oxide form, it will be referred to as"copper" or "Cu" for simplicity.
Xu and Zhang [3] has reported an achieved hydrogen generation rate of 9-20 mmol h−1 gcat.−1
depending on the fabrication method. Sreethawong and Yoshikawa [37] reported that incomparison to Pt, Au, and Pd metals, Cu showed only slightly weaker enhancement ofTiO2 activity for hydrogen generation. The reported optimal copper loading is rangingfrom 1.2 wt% to 8.12 wt% in the articles that have been studied. Below is a summary-table of several studies where the optimal copper loading for TiO2 is listed, along with thecorresponding hydrogen evolution rate and fabrication method. The fabrication methodswill be explained in detail later in this section, starting on page 28.
Table 1: The table shows a summary of results from different experiments.
Optimal copper Fabrication method Additional details H2 evolution Referenceloading [wt.%] [mmol
h gcat]
6.97 DP 10 vol% methanol 20 Xu et al. [3]6.55 Sol-gel 10 vol% methanol 15.5 Xu et al. [3]1.2 Sol-gel 42 vol% methanol 3.0 Wu et al. [38]1.5 Single step sol-gel 0.36 Yoshikawa et al. [37]8.12 Impregnation 50 vol% methanol 13.5 Choi et al. [39]1.3 Impregnation 0.1 M glycerol 2.06 Yu et al. [40]7.38 impregnation 10 vol% methanol 18.5 Xu et al. [41]7.0 Impregnation 5 vol% methanol 0.82 Bandara et al. [42]
It is important to note that this is only a rough comparison intended to give the readera feeling of what has been done in the field of Cu−TiO2 photocatalysis. The experimentalconditions were not the same, as different substrates and substrate concentrations havebeen used along with different photoreactors and light intensities. The catalyst loadingduring the experiment is also a major factor in deciding specific activity, as the Resultsand Discussion section later will elucidate (section 4.1.1). In addition to this, it is notalways clear whether the reported copper content is based on copper being in metallic orin oxide form.
22
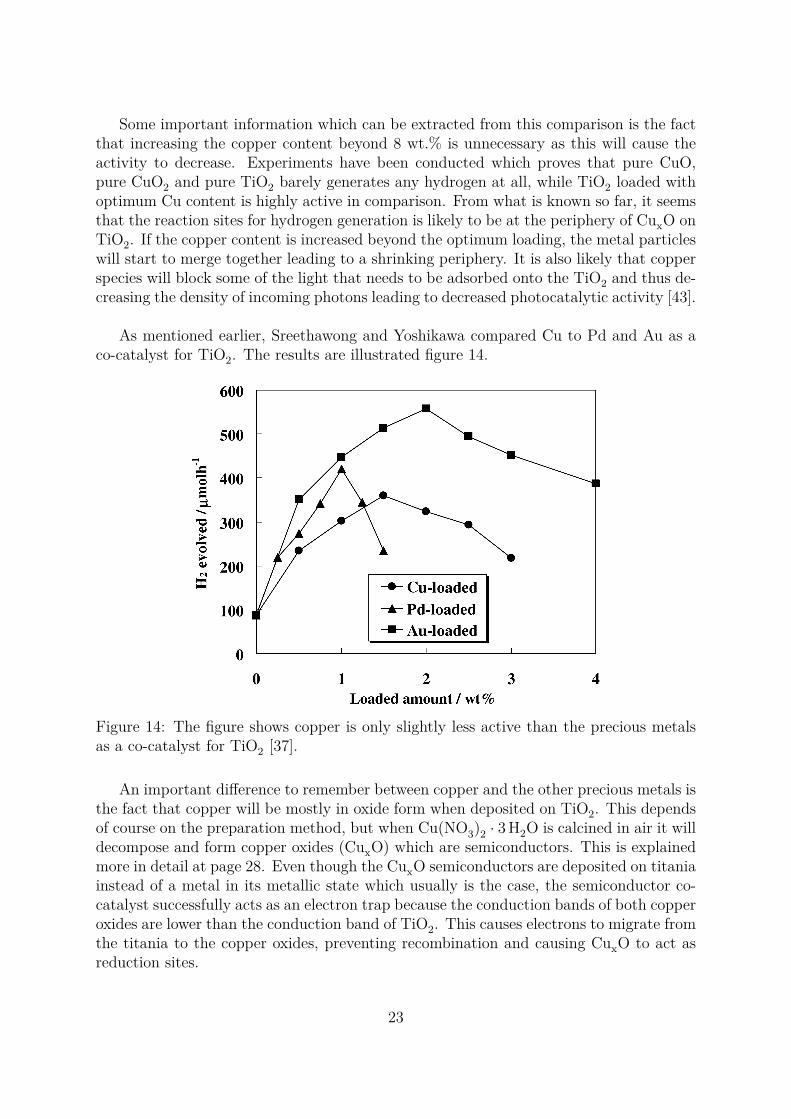
Some important information which can be extracted from this comparison is the factthat increasing the copper content beyond 8 wt.% is unnecessary as this will cause theactivity to decrease. Experiments have been conducted which proves that pure CuO,pure CuO2 and pure TiO2 barely generates any hydrogen at all, while TiO2 loaded withoptimum Cu content is highly active in comparison. From what is known so far, it seemsthat the reaction sites for hydrogen generation is likely to be at the periphery of CuxO onTiO2. If the copper content is increased beyond the optimum loading, the metal particleswill start to merge together leading to a shrinking periphery. It is also likely that copperspecies will block some of the light that needs to be adsorbed onto the TiO2 and thus de-creasing the density of incoming photons leading to decreased photocatalytic activity [43].
As mentioned earlier, Sreethawong and Yoshikawa compared Cu to Pd and Au as aco-catalyst for TiO2. The results are illustrated figure 14.
Figure 14: The figure shows copper is only slightly less active than the precious metalsas a co-catalyst for TiO2 [37].
An important difference to remember between copper and the other precious metals isthe fact that copper will be mostly in oxide form when deposited on TiO2. This dependsof course on the preparation method, but when Cu(NO3)2 · 3H2O is calcined in air it willdecompose and form copper oxides (CuxO) which are semiconductors. This is explainedmore in detail at page 28. Even though the CuxO semiconductors are deposited on titaniainstead of a metal in its metallic state which usually is the case, the semiconductor co-catalyst successfully acts as an electron trap because the conduction bands of both copperoxides are lower than the conduction band of TiO2. This causes electrons to migrate fromthe titania to the copper oxides, preventing recombination and causing CuxO to act asreduction sites.
23

This electron transfer is illustrated in figure 15 below.
Figure 15: The figure shows how CuO act as an electron trap for TiO2 [42].
Xu and Zhang [3] performed a systematic study to find out which fabrication methodyielded the most active Cu−TiO2 photocatalyst with respect to hydrogen evolution rate.They tested out four methods: In situ sol–gel (SG), incipient wetness impregnation (IWI),deposition precipitation (DP) and in-situ photo-deposition (PD). They discovered thatthe method of fabrication affected the chemical state of Cu, the distribution of Cu withinthe catalyst, BET surface area and even the crystal structure of the TiO2. The DPmethodlead to the highest initial hydrogen evolution rate, while the SG method achieved thehighest hydrogen evolution rate over time because of its excellent stability. This stabilityis likely to come from the resistance to Cu leaching because of its crystal configuration.The method yielding the least active photocatalyst was the PD method. The authorsconclude that the chemical state of copper is closely related to the activity of the cata-lysts, where the Cu2O is slightly more active than CuO while both of these oxides aresuperior to metallic copper. The reason for this is the fact that the redox potential ofCu+/Cu (0.52 V) is higher than Cu2+/Cu (0.34 V) which makes the electrons preferen-tially migrate to Cu2O [3].
24
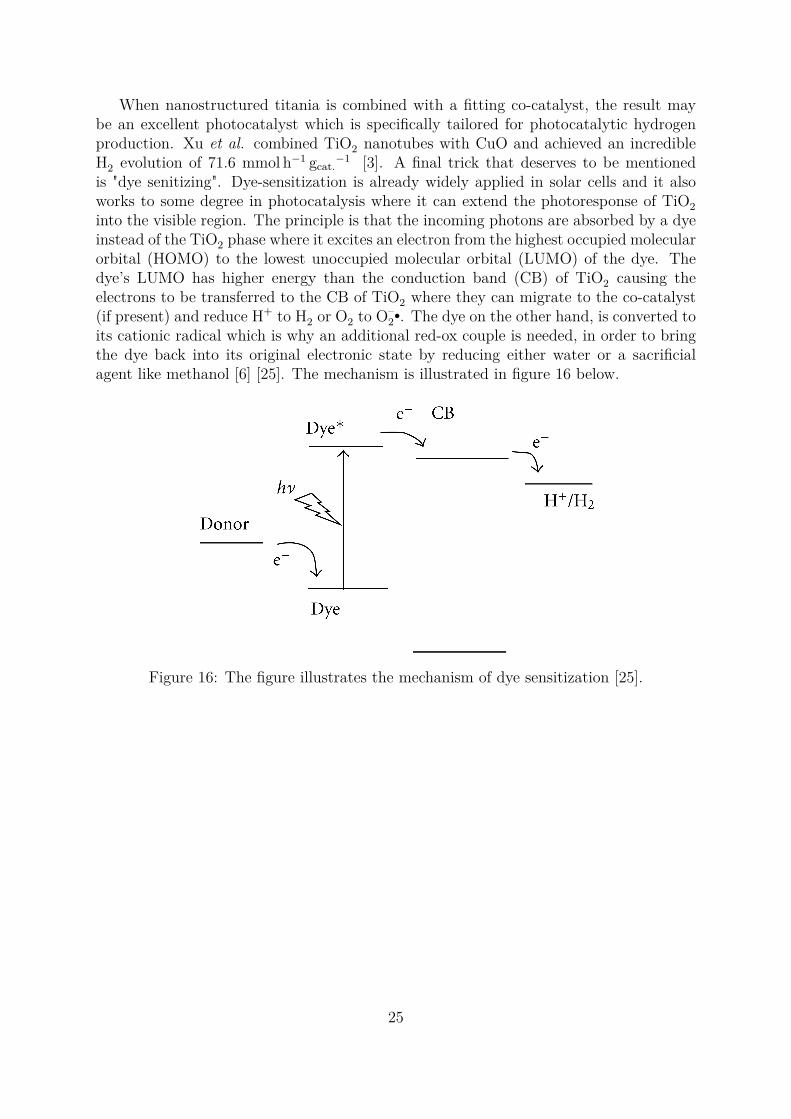
When nanostructured titania is combined with a fitting co-catalyst, the result maybe an excellent photocatalyst which is specifically tailored for photocatalytic hydrogenproduction. Xu et al. combined TiO2 nanotubes with CuO and achieved an incredibleH2 evolution of 71.6 mmol h−1 gcat.−1 [3]. A final trick that deserves to be mentionedis "dye senitizing". Dye-sensitization is already widely applied in solar cells and it alsoworks to some degree in photocatalysis where it can extend the photoresponse of TiO2into the visible region. The principle is that the incoming photons are absorbed by a dyeinstead of the TiO2 phase where it excites an electron from the highest occupied molecularorbital (HOMO) to the lowest unoccupied molecular orbital (LUMO) of the dye. Thedye’s LUMO has higher energy than the conduction band (CB) of TiO2 causing theelectrons to be transferred to the CB of TiO2 where they can migrate to the co-catalyst(if present) and reduce H+ to H2 or O2 to O–
2•. The dye on the other hand, is converted toits cationic radical which is why an additional red-ox couple is needed, in order to bringthe dye back into its original electronic state by reducing either water or a sacrificialagent like methanol [6] [25]. The mechanism is illustrated in figure 16 below.
Figure 16: The figure illustrates the mechanism of dye sensitization [25].
25
2.7 Alternatives to titaniaTitanium oxide is not the only viable semiconductor for photoreforming and water split-ting. In 2008, almost 25 % of the published articles related to photocatalysis describedstudies on substitute materials to TiO2. Among these were mixed oxides of transitionmetals like V, Nb and Ta, usually containing some main group elements such as Bi, Sb,In or Ga. These materials along with sulfides and nitrides of different metals have beenstudied extensively in hope to obtain materials with decent photoactivity in the visiblerange. [44]. When it comes to photoreforming with methanol, some niobates with thegeneral formula ABn−1NbnO3n+1 where A=K, Rb, and Cs while B= Ca, Na, Sr, or Pband n= 3-4 have shown a remarkable photoactivity for H2 production. As an example,HCa2Nb3O10 with Pt as a co-catalyst produces as much as 19 mmol H h−1 gcat.−1 [44].
Because the liquid phase during a photoreforming reaction is less oxidising than dur-ing photocatalytic water splitting, sulfide semiconductors can withstand the process andthus be used in photoreforming without suffering too much from photo-corrosion. Thisis the main reason for materials like ZnS and CdS to receive renewed attention, and thelatter is reported to perform remarkable on its own and even better when combined withmaterials like Ag2S, ZnS or CdO as long Pt or Ru co-catalyst is present. In the year2009, nanostructured CdS (in the form of nanosheets or hollow nanorods) held the recordfor photoactivity at 440 nm visible light with a quantum efficiency of 60 %.
A very important parameter for the photocatalytic materials are the band positions.As already mentioned in section 2.3, the redox potential of the conduction band needs tobe more negative (higher in energy) than the acceptor molecule (H+) so that a reductionmay take place. When it comes to the position of the valence band, the requirement isless strict if the photocatalyst is to be used in photoreforming rather than water splitting.In the water splitting, the position of the valence band need to be more positive than theredox potential of oxidised molecule which is H2O at 1.23 V. In photoreforming on theother hand, the oxidation of methanol requires a potential of only 0.7 V which in theoryopens up the possibility for more semiconductors to be used.
26
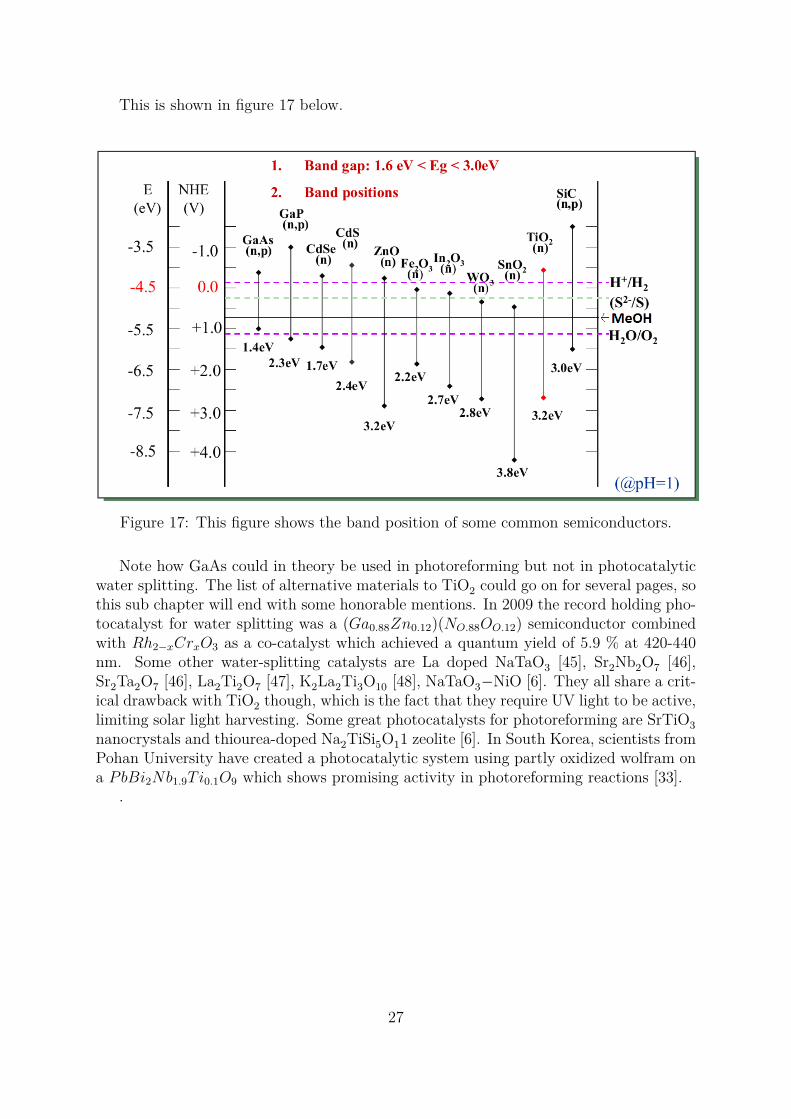
This is shown in figure 17 below.
Figure 17: This figure shows the band position of some common semiconductors.
Note how GaAs could in theory be used in photoreforming but not in photocatalyticwater splitting. The list of alternative materials to TiO2 could go on for several pages, sothis sub chapter will end with some honorable mentions. In 2009 the record holding pho-tocatalyst for water splitting was a (Ga0.88Zn0.12)(NO.88OO.12) semiconductor combinedwith Rh2−xCrxO3 as a co-catalyst which achieved a quantum yield of 5.9 % at 420-440nm. Some other water-splitting catalysts are La doped NaTaO3 [45], Sr2Nb2O7 [46],Sr2Ta2O7 [46], La2Ti2O7 [47], K2La2Ti3O10 [48], NaTaO3−NiO [6]. They all share a crit-ical drawback with TiO2 though, which is the fact that they require UV light to be active,limiting solar light harvesting. Some great photocatalysts for photoreforming are SrTiO3nanocrystals and thiourea-doped Na2TiSi5O11 zeolite [6]. In South Korea, scientists fromPohan University have created a photocatalytic system using partly oxidized wolfram ona PbBi2Nb1.9Ti0.1O9 which shows promising activity in photoreforming reactions [33].
.
27
2.8 Fabrication methods of TiO2 based photocatalystsAs already mentioned, the performance of photocatalysts is related to the method offabrication. Particle size, chemical state of Cu, distribution of Cu, BET surface area andcrystal structure are parameters that depend on the fabrication method. In this section,the most common methods will be briefly explained.
2.8.1 Incipient wetness impregnation (IWI)
This method is also called dry impregnation or capillary impregnation. The active metalprecursor is dissolved in an aqueous or organic solution before the catalyst support isadded. The volume of the solution should be equal to the pore volume of the catalystsupport, and the solution is drawn into the pores by capillary action. In this particularproject the metal precursor is Cu(NO3)2 · 3H2O and TiO2 is referred to as the supporteven though it participates in the photoreaction. The maximum metal loading which ispossible to achieve by this method, is limited by the solubility of the metal precursorin the solution [49]. After the impregnation is done, the sample is dried to get rid ofhumidity and volatile compounds. After drying, the sample is calcined where the metalprecursor is converted to the pure metal or to a metal-oxide. An interesting trait aboutthis method is that the CuO will be deposited to a high degree inside the TiO2 poresrather than on the surface [50].
2.8.2 Calcination
Calcination is defined as "The process of heating a substance to a high temperature butbelow the melting or fusing point, causing loss of moisture, reduction or oxidation, anddissociation into simpler substances" [51]. Calcination is thermal treatment of the catalystwhich is often performed under atmospheric conditions. This treatment will usuallydecompose metal precursors into it’s oxide form, but it may also reduce noble metals totheir metallic form if performed in hydrogen flow at sufficiently high temperatures. Inthis project calcination was performed on TiO2 impregnated with Cu(NO3)2 · 3H2O for4 hours at 200 ◦C, which caused reaction 1 to happen:
Cu(NO3)2 · 3 H2O(s)→ CuO(s) + 2NO2(g) + 12O2 + 3H2O(g) ∆H◦
298 = +400 kJ/mol (1)
For higher temperatures, some Cu2O can also be formed. The ratio of CuO to Cu2Odepends on the calcination temperature and time, but for the reduction of CuO (Cu2+)to Cu2O (Cu+) to be spontaneous the temperature has to exceed 950 K which is rarelythe case (see Appendix A for calculation) . This suggests that for all practic purposes,the copper species deposited on titania after calcination is only CuO. The reason it issometimes referred as CuxO, is because partial reduction of the copper species takes placeduring the photoreforming reaction [3]. When the calcination process is completed, theactive metal or metal-oxide is deposited on the support and the catalyst is usually readyfor use.
28

2.8.3 Deposition precipitation method
In this method the metal is precipitated on the support by conversion from a solubleprecursor. This conversion can be achieved by changing the pH of the solution, bychanging the concentration of a complexing agent or through redox reactions changingthe valence state of the metal. This method is usually demanding compared to otheralternatives, but it is still one of the most frequently used methods. This is because themethod has the strength of producing materials of high purity and the process can easilybe tailored to produce a product of desired quality [52]. This method can also be appliedto produce a Cu−TiO2 catalyst. This is done by mixing Cu(NO3) and P25 in an ice bathwater batch and adding NaBH4 as a reducing agent. After 2 hours of vigorous stirring thecopper ions are reduced to Cu2O and precipitated on the P25 support. According to Xuet al. this is the method that yields the most active copper based TiO2 catalysts becauseCu2O is the most active copper compound compared to CuO and metallic Cu [3]. Thismethod also tend to deposit a relative large percentage of the particles on the surface ofthe support, rather than in the pores [50].
2.8.4 Photo deposition method
This method is by far the easiest and fastest way to produce TiO2 based catalysts, butthe success of the method depends strongly on the metal of choice. The metal pre-cursoris dissolved in a mixture of methanol and water together with P25 TiO2 or a similartitania source. The mixture is sonicated and UV radiation is applied for a few hours.Methanol acts as a reducing agent, reducing metal ions from the precursor to it’s metallicform which is deposited on the titania. In other words, the metal is deposited on thesupport while the photoreforming experiment is running. This method works well withgold but is less successful with copper, because metallic copper is deposited instead ofthe more active copper oxides [3].
2.8.5 Sol-gel method
The sol-gel process can be described as ”Formation of an oxide network through polycon-densation reactions of a molecular precursor in a liquid.” [53]. A sol is a stable suspensionof colloidal particles or polymers in a solvent, meaning that the particles are so small (1nm-1 µm) that they are pretty much unaffected by gravitational forces. A gel consists ofa three-dimensional continuous network, which is surrounded by a liquid phase. In a col-loidal gel, this network is built from colloidal particles that have agglomerated, formingcontinuous branched chains consisting of very small particles that stick together due tovan der Waals and electrostatic forces.
29
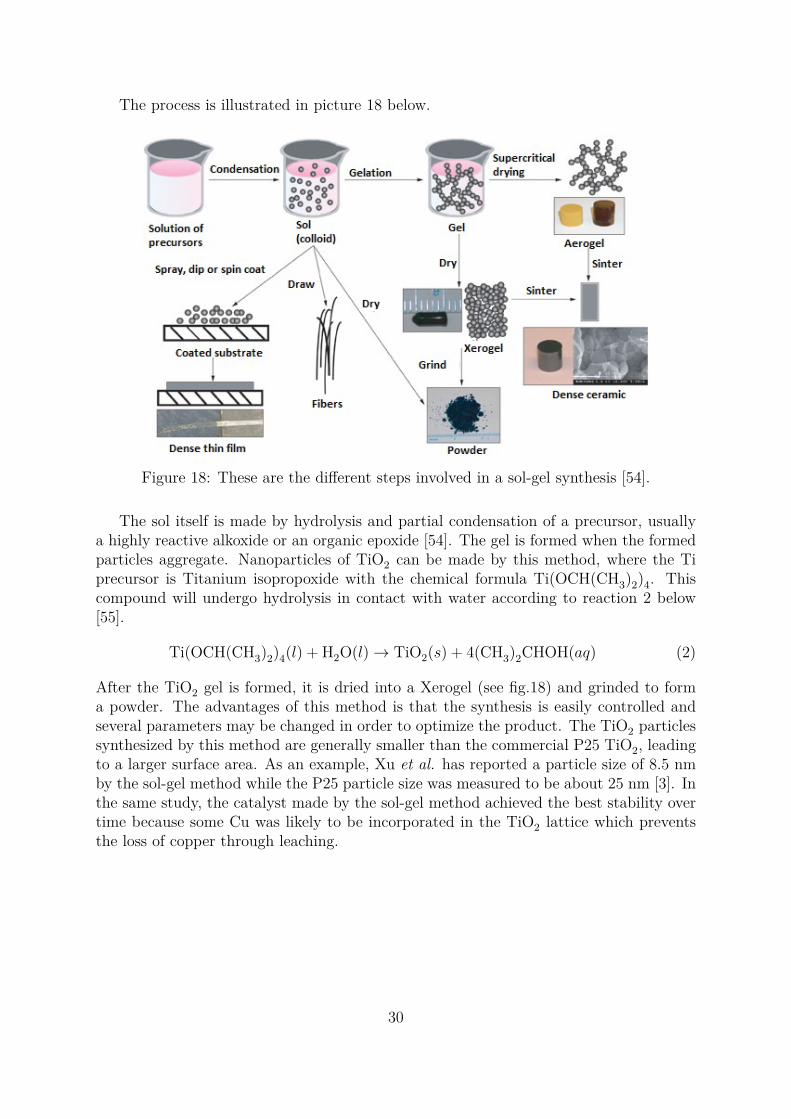
The process is illustrated in picture 18 below.
Figure 18: These are the different steps involved in a sol-gel synthesis [54].
The sol itself is made by hydrolysis and partial condensation of a precursor, usuallya highly reactive alkoxide or an organic epoxide [54]. The gel is formed when the formedparticles aggregate. Nanoparticles of TiO2 can be made by this method, where the Tiprecursor is Titanium isopropoxide with the chemical formula Ti(OCH(CH3)2)4. Thiscompound will undergo hydrolysis in contact with water according to reaction 2 below[55].
Ti(OCH(CH3)2)4(l) + H2O(l)→ TiO2(s) + 4(CH3)2CHOH(aq) (2)
After the TiO2 gel is formed, it is dried into a Xerogel (see fig.18) and grinded to forma powder. The advantages of this method is that the synthesis is easily controlled andseveral parameters may be changed in order to optimize the product. The TiO2 particlessynthesized by this method are generally smaller than the commercial P25 TiO2, leadingto a larger surface area. As an example, Xu et al. has reported a particle size of 8.5 nmby the sol-gel method while the P25 particle size was measured to be about 25 nm [3]. Inthe same study, the catalyst made by the sol-gel method achieved the best stability overtime because some Cu was likely to be incorporated in the TiO2 lattice which preventsthe loss of copper through leaching.
30
2.9 Deactivation in photoreforming and water splittingEven though photocatalytic water splitting and photoreforming are mostly performedin aqeous phase at ambient temperatures, the problem of deactivation is not entirelyescaped. Semiconductors with sulfur anions like ZnS and CdS will oxodize over timeand become inactive, especially if no sacrificial agents are present. Photocatalysts basedon oxides like TiO2 escape this problem but are vulnerable to others. An expirementwas conducted by Xu et al. [3] where the concentration of copper ions were continuouslymeasured during a photoreforming reaction using a Cu−TiO2 photocatalyst. They foundthat the concentration of copper ions increases with time, which means that some cop-per is leaching into the solution from the catalyst. Copper is in principle stable at allpH values in pure de-ionized and de-oxygenated water, but during the photoreformingreaction in methanol a small part of it will still be dissolved over time. As allready men-tioned, the active sites of the Cu−TiO2 are likely to be the interface of TiO2 and thesolid copper species, which means that the activity of the catalyst decreases if copper isremoved from the solid phase. This holds true for catalysts where the copper content isat optimum or below, but it would be interesting to see how this deactivation mechanismaffects catalysts having copper loading above the optimal. One could argue that copperleaching from these catalysts would further increase the activity, but this has yet to beconfirmed. Xu et al. also found that Cu−TiO2 catalysts fabricated by the sol-gel methodwere particularly resistant to copper leaching compared to other methods [3].
The most important source of deactivation during photoreforming is probably the ac-cumulation of by-products. In a study by Xu et al. [41] The methanol-water solution wasrefreshed and this caused the photocatalyst to regain a substantial part of its activity. Astime goes by, the methanol is slowly depleted from the solution when it is converted intoH2 gas. This converted methanol was refilled but it showed no effect on the hydrogengeneration rate. Because replacement of the old solution showed much greater effect inregaining the photoactivity, it is likely that the main cause of deactivation is the accumu-lation of byproducts which inhibits the photoreforming reaction. According to Xu et al.,it is likely that one of these by-products is formic acid as the pH is observed to decreasewith time aswell [3].
Some other studies reports oxygen vacancies in the TiO2 to be a major cause of deac-tivation, but this has yet to be confirmed in the case of photoreforming [56]. In litteraturethere is a report by Wu et al. [38] linking decreased H2 evolution to equilibrium, but thisis pretty much disproved by the fact that refilling consumed methanol to the solutiondid nothing to increase the activity. The hydrogen gas generated is very limited and itescapes which keeps the system from ever reaching equilibrium. A study performed byXu et al. revealed that reduction of CuO to metallic Cu could limit the electron transferfrom TiO2 and in this way deactivate the photocatalyst. In this study, the causes fordeactivation was compared and their impact was ranked in following way: Accumulationof by-products (61.7 %), reduction of CuO (13.3 %), and copper leaching (6.7 %). Thereare still some unidentified factors, which hold 18.3 % of the total deactivation accordingto the author.
31
2.10 Surface area measurement by BET analysisBET is short for Braun-Emmet and Tellersom, who are the developers of the method.The method is based on physisorption of an inert gas on the surface of the catalyst, untila monolayer has been formed. Nitrogen is the most common sorbate and the moleculeoccupies a surface are of 0.162 nm2 at 77 K which is the boiling point of the gas. Bymeasuring and calculating the amount of nitrogen it takes to form a monolayer at 77 K,the total surface area of the catalyst can be found. Equation 3 is developed from theLangmuir equation, and it is used to find the coverage of the adsorbed gas which is 1 inthe case of a perfect monolayer.
P
V (P0 − P ) = P
P0
(χ− 1)Vmχ
+ 1Vmχ
(3)
In this equation V is the total volume of adsorbed gas at STP (Standard Temperatureand Pressure) at pressure P. Vm is the volume of a monolayer of the adsorbed gas at STP,χ is the ratio between the heat of adsorption for the first layer and the next one and P0is the saturation pressure of the gas.
By plotting the left side of this equation against P/P0 the result will be straight linewhere Vm can be determined by the crossing of the y-axis. From this value, it is possibleto calculate the total area of the adsorbed gas which equals the total area of the catalyst.During the experiment, the temperature is held constant at 77 K by nitrogen coolingwhile the partial pressure of N2 is varied. The BET equation is built on the followingassumptions [57]:
• The rate of adsorption and desorption in every layer is equal
• The heat of adsorption in the first layer is independant of the heat of adsorption inthe next layers
• The heat of adsorption in the 2nd layer and up are equal and the same as the heatof liquification of the gas
• Monolayer and immobile adsorption
• Homogeneous surface, meaning that heat of adsorption is the same throughoutentire catalyst and is independant of the coverage
• Dynamic equilibrium between the gas face and the adsorbed species
These assumptions does of not always hold true, but the BET method is very usefull andthe accuracy is usually good enough.
32
3 Experimental
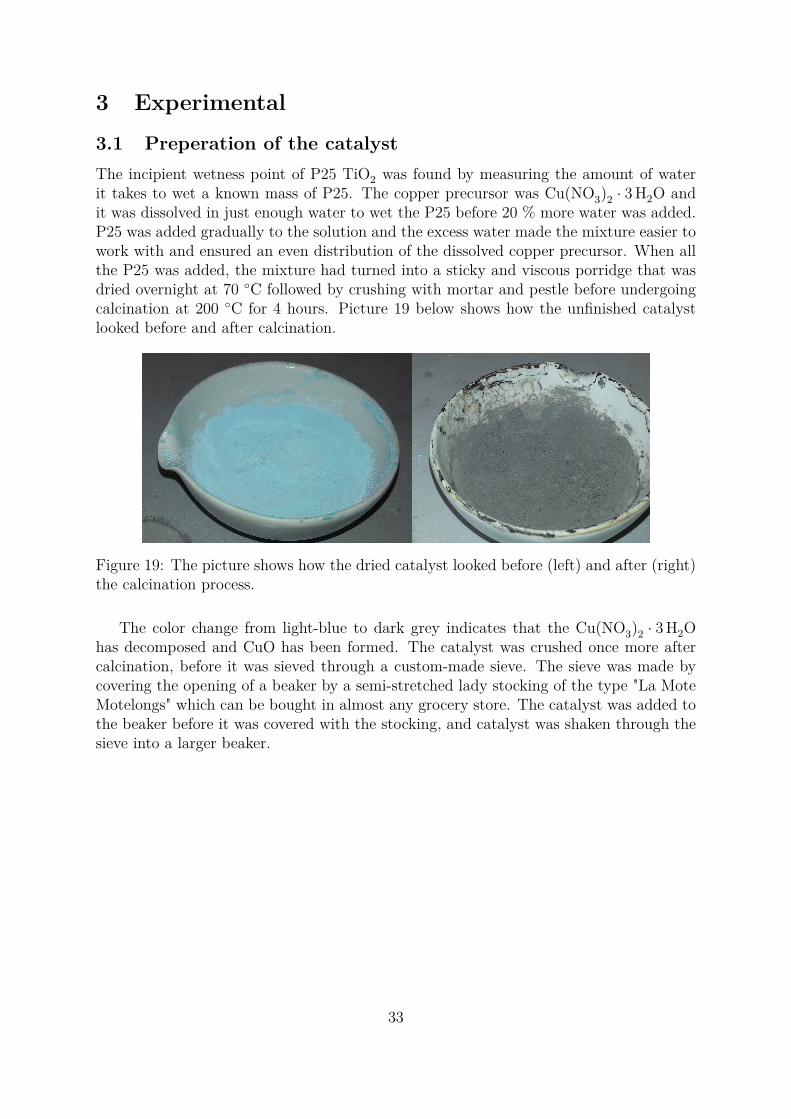
3.1 Preperation of the catalystThe incipient wetness point of P25 TiO2 was found by measuring the amount of waterit takes to wet a known mass of P25. The copper precursor was Cu(NO3)2 · 3H2O andit was dissolved in just enough water to wet the P25 before 20 % more water was added.P25 was added gradually to the solution and the excess water made the mixture easier towork with and ensured an even distribution of the dissolved copper precursor. When allthe P25 was added, the mixture had turned into a sticky and viscous porridge that wasdried overnight at 70 ◦C followed by crushing with mortar and pestle before undergoingcalcination at 200 ◦C for 4 hours. Picture 19 below shows how the unfinished catalystlooked before and after calcination.
Figure 19: The picture shows how the dried catalyst looked before (left) and after (right)the calcination process.
The color change from light-blue to dark grey indicates that the Cu(NO3)2 · 3H2Ohas decomposed and CuO has been formed. The catalyst was crushed once more aftercalcination, before it was sieved through a custom-made sieve. The sieve was made bycovering the opening of a beaker by a semi-stretched lady stocking of the type "La MoteMotelongs" which can be bought in almost any grocery store. The catalyst was added tothe beaker before it was covered with the stocking, and catalyst was shaken through thesieve into a larger beaker.
33
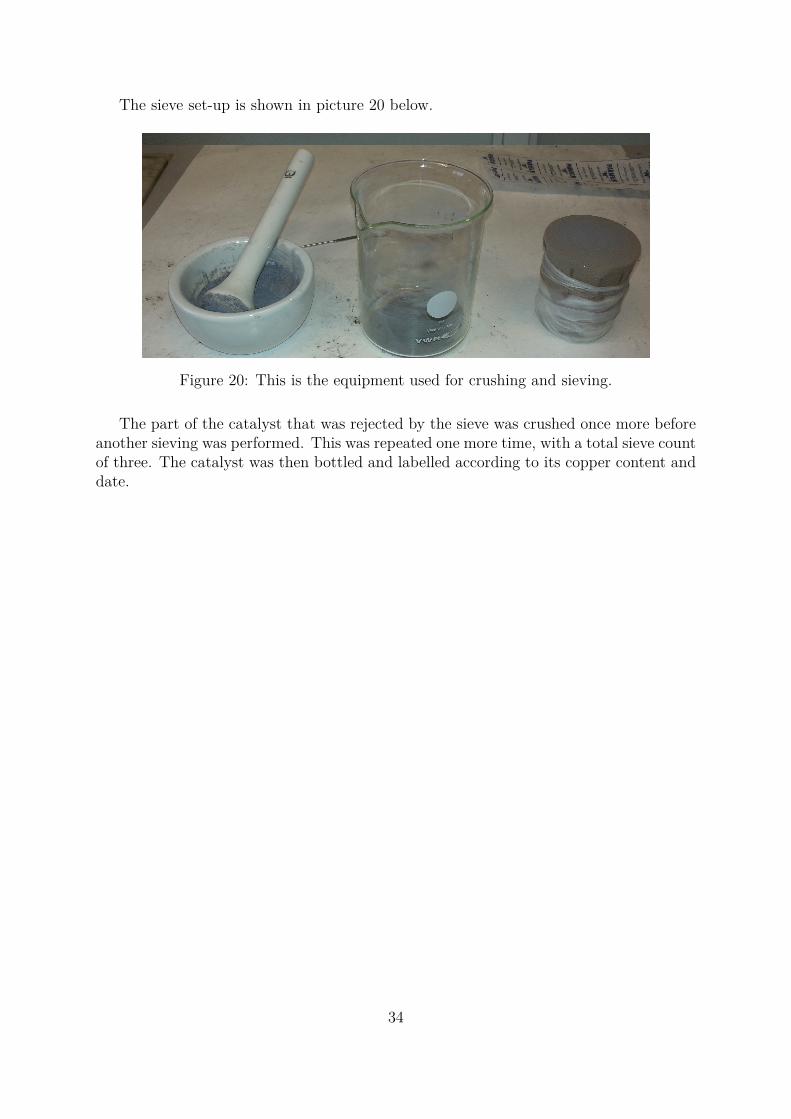
The sieve set-up is shown in picture 20 below.
Figure 20: This is the equipment used for crushing and sieving.
The part of the catalyst that was rejected by the sieve was crushed once more beforeanother sieving was performed. This was repeated one more time, with a total sieve countof three. The catalyst was then bottled and labelled according to its copper content anddate.
34
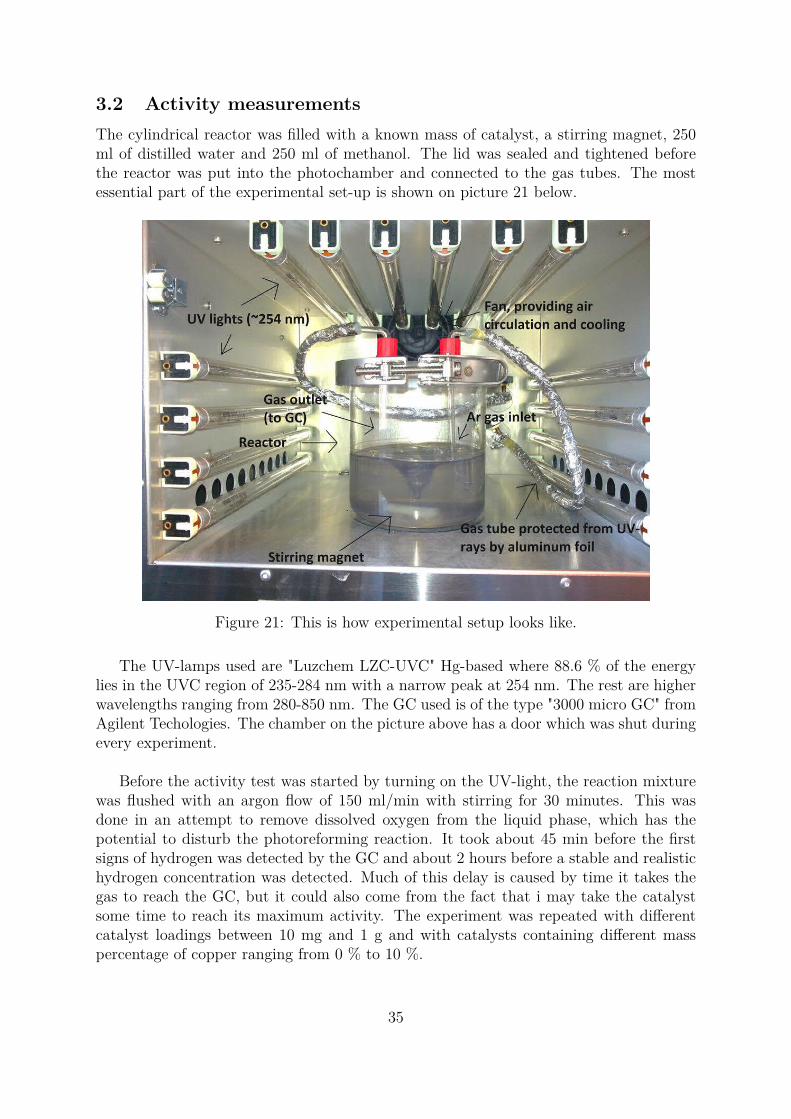
3.2 Activity measurementsThe cylindrical reactor was filled with a known mass of catalyst, a stirring magnet, 250ml of distilled water and 250 ml of methanol. The lid was sealed and tightened beforethe reactor was put into the photochamber and connected to the gas tubes. The mostessential part of the experimental set-up is shown on picture 21 below.
Figure 21: This is how experimental setup looks like.
The UV-lamps used are "Luzchem LZC-UVC" Hg-based where 88.6 % of the energylies in the UVC region of 235-284 nm with a narrow peak at 254 nm. The rest are higherwavelengths ranging from 280-850 nm. The GC used is of the type "3000 micro GC" fromAgilent Techologies. The chamber on the picture above has a door which was shut duringevery experiment.
Before the activity test was started by turning on the UV-light, the reaction mixturewas flushed with an argon flow of 150 ml/min with stirring for 30 minutes. This wasdone in an attempt to remove dissolved oxygen from the liquid phase, which has thepotential to disturb the photoreforming reaction. It took about 45 min before the firstsigns of hydrogen was detected by the GC and about 2 hours before a stable and realistichydrogen concentration was detected. Much of this delay is caused by time it takes thegas to reach the GC, but it could also come from the fact that i may take the catalystsome time to reach its maximum activity. The experiment was repeated with differentcatalyst loadings between 10 mg and 1 g and with catalysts containing different masspercentage of copper ranging from 0 % to 10 %.
35

3.3 The challenge of obtaining reproducible resultsThe early goals of this project was to obtain information relating hydrogen evolution rateto catalyst loading and copper content. In an attempt to relate hydrogen evolution tocatalyst loading, several activity tests were performed with different catalyst loadings.The problem with this approach was the fact that results made little sense and had noreproducibility. Before any results could be accepted, a way to obtain reproducible resultsfrom the experiments had to be found.
It was suspected that the poor reproducibility was mostly caused by the randomdistribution in grain size of the catalyst. After copper was impregnated on the P25 TiO2support and calcination was performed, some of the catalyst particles aggregated togetherto form larger clusters. If the tubes containing the photocatalyst was shaken, the largerclusters would gather at the top while the smaller particles would sink to the bottom.This is the same phenomena as in breakfast cereal where the largest grains are foundon the top while the bottom of the cereal box often contains small sand-like particleswhich are usually not preferable. In the case of photocatalysis however, the smallestparticles will have the largest specific surface area which gives them a good reason tobe the preferable ones. Every time an experiment was conducted, the reactor containedsome big grains which resembles sand and they sank rapidly to the bottom. Becausethe grains were big and gathered at the bottom of the reactor, they did not contributemuch to the hydrogen evolution. Every activity experiment contained a different numberof these low-activity sand-like grains, depending on how much the catalyst tube wereshaken and exactly where in tube the catalyst were taken from.
36
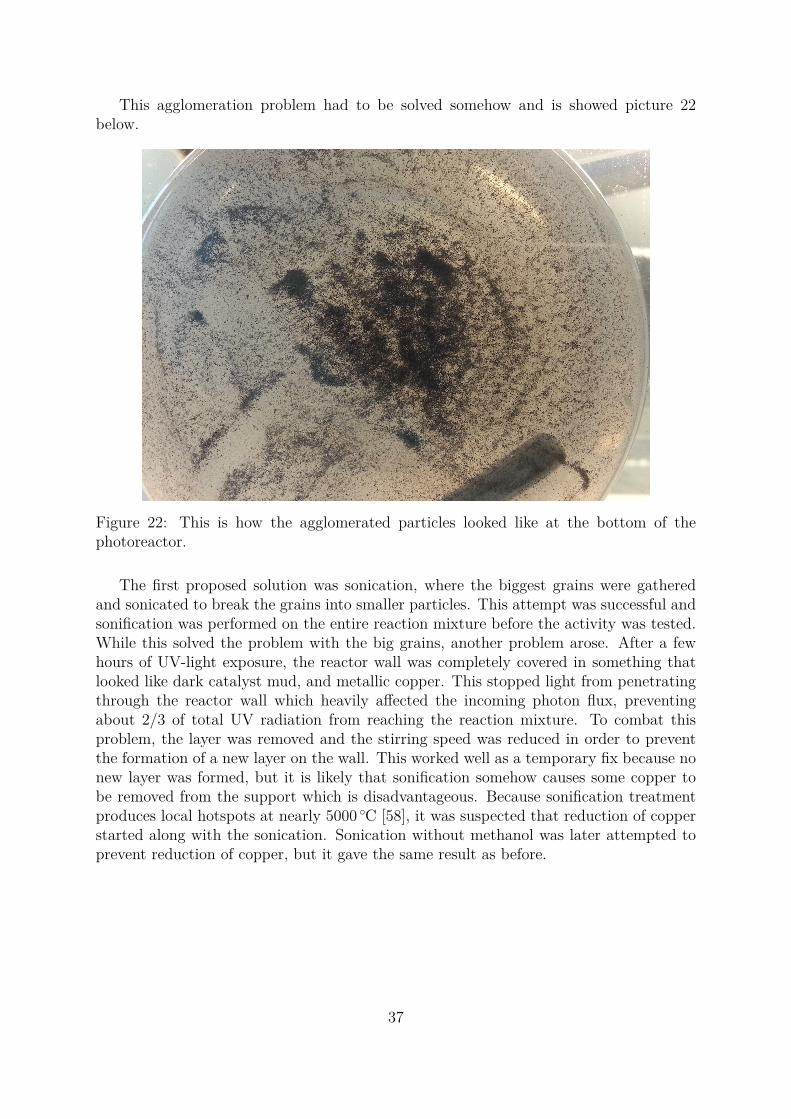
This agglomeration problem had to be solved somehow and is showed picture 22below.
Figure 22: This is how the agglomerated particles looked like at the bottom of thephotoreactor.
The first proposed solution was sonication, where the biggest grains were gatheredand sonicated to break the grains into smaller particles. This attempt was successful andsonification was performed on the entire reaction mixture before the activity was tested.While this solved the problem with the big grains, another problem arose. After a fewhours of UV-light exposure, the reactor wall was completely covered in something thatlooked like dark catalyst mud, and metallic copper. This stopped light from penetratingthrough the reactor wall which heavily affected the incoming photon flux, preventingabout 2/3 of total UV radiation from reaching the reaction mixture. To combat thisproblem, the layer was removed and the stirring speed was reduced in order to preventthe formation of a new layer on the wall. This worked well as a temporary fix because nonew layer was formed, but it is likely that sonification somehow causes some copper tobe removed from the support which is disadvantageous. Because sonification treatmentproduces local hotspots at nearly 5000 ◦C [58], it was suspected that reduction of copperstarted along with the sonication. Sonication without methanol was later attempted toprevent reduction of copper, but it gave the same result as before.
37
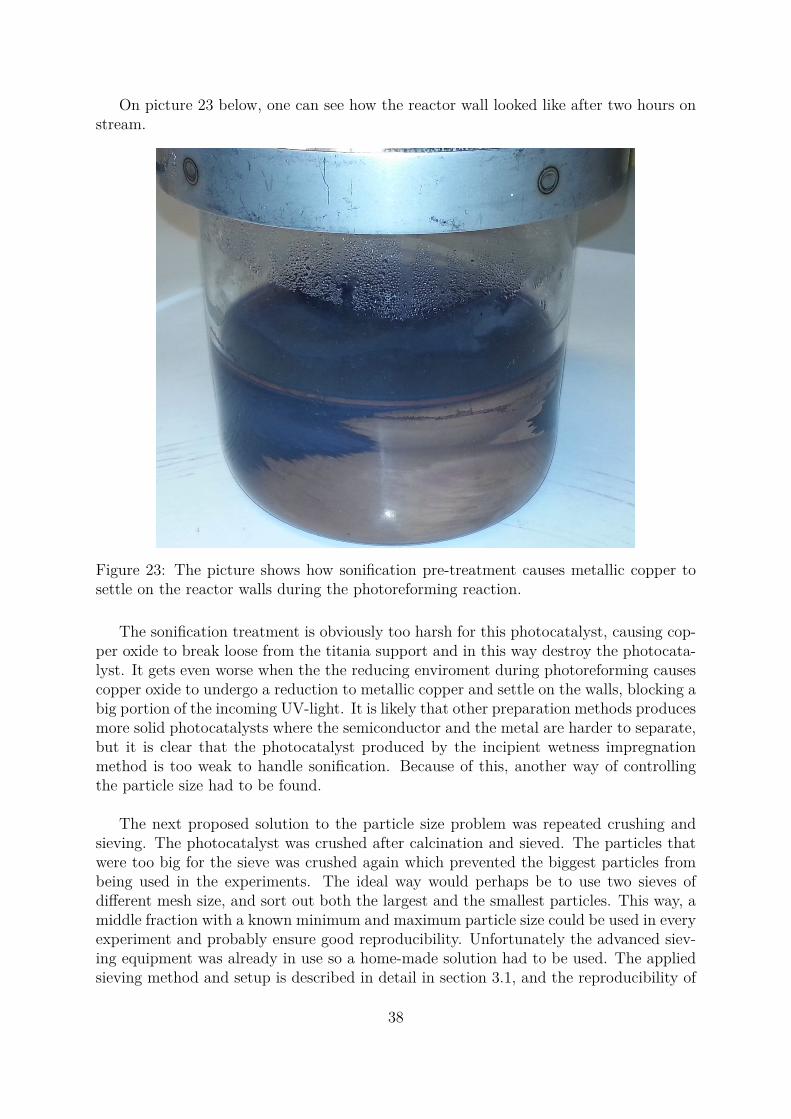
On picture 23 below, one can see how the reactor wall looked like after two hours onstream.
Figure 23: The picture shows how sonification pre-treatment causes metallic copper tosettle on the reactor walls during the photoreforming reaction.
The sonification treatment is obviously too harsh for this photocatalyst, causing cop-per oxide to break loose from the titania support and in this way destroy the photocata-lyst. It gets even worse when the the reducing enviroment during photoreforming causescopper oxide to undergo a reduction to metallic copper and settle on the walls, blocking abig portion of the incoming UV-light. It is likely that other preparation methods producesmore solid photocatalysts where the semiconductor and the metal are harder to separate,but it is clear that the photocatalyst produced by the incipient wetness impregnationmethod is too weak to handle sonification. Because of this, another way of controllingthe particle size had to be found.
The next proposed solution to the particle size problem was repeated crushing andsieving. The photocatalyst was crushed after calcination and sieved. The particles thatwere too big for the sieve was crushed again which prevented the biggest particles frombeing used in the experiments. The ideal way would perhaps be to use two sieves ofdifferent mesh size, and sort out both the largest and the smallest particles. This way, amiddle fraction with a known minimum and maximum particle size could be used in everyexperiment and probably ensure good reproducibility. Unfortunately the advanced siev-ing equipment was already in use so a home-made solution had to be used. The appliedsieving method and setup is described in detail in section 3.1, and the reproducibility of
38

the experiments increased dramatically with estimated relative errors ranging from 3.4% to 7.3 % depending on catalyst loading.
3.4 Reactivation attemptsBecause of decaying hydrogen evolution over time, several attempts were made in order totry and regain the catalyst activity. The first method that was attempted was hydrogenreduction. A catalyst loading of 1 g was selected and the photoreforming reaction wasperformed for around 20 hours. The UV-lamps were then turned off and hydrogen gaswas bubbled through the reaction mixture at a rate of 5 ml/min together with 45 ml/minof argon gas for 30 min. The experiment was then re-started and the changes in hydrogenproduction rate was noted. The second method of reactivation was to refresh the reactionmixture by replacing the liquid phase and collect the catalyst in a filter so it could be usedagain. Vacuum filtering was used with a filter paper having a retention range of 4-12 µgand the solution was repeatedly filtered through until it became blank. The reactor wascleaned, and 250 ml each of distilled water and methanol was added again. The catalystcaught in the filter was scraped off and the filter was washed thoroughly in the solutionto make sure that as much photocatalyst as possible was recovered. The UV light wasthen switched on again and the experiment continued. This was repeated one more timebefore 250 ml extra methanol was added in the end. The results are showed in the nextchapter.
3.5 BET measurementsBET analysis was performed in order to investigate the surface area of the differentcatalysts. The samples were degassed overnight in a Micromeritics VacPrep 061 at 110 ◦Cand the mass before and after degassing was noted. During the first experiment, 200 ◦Cwas used as degassing temperature but this was too hot for the uncalcined sample whichin fact got calcined during the degassing. The BET experiment itself was carried usingN2 adsorption on a Micromeritics Tristar 3000 Surface Area and Porosity analyzer.
39

4 Results and discussion
4.1 Activity measurments4.1.1 The effect of catalyst loading on hydrogen generation
The catalyst loading was changed from 10 mg up to 1 g and the peak hydrogen generationrate was noted. The results are shown in figure 24 below.
0
0,1
0,2
0,3
0,4
0,5
0,6
0,7
0 0,1 0,2 0,3 0,4 0,5 0,6 0,7 0,8 0,9 1
Pe
ak h
ydro
gen
evo
luti
on
[m
l/m
in]
Catalyst loading [g]
Maximum hydrogen evolution with different catalyst loadings
Figure 24: The graph shows how hydrogen generation rate depends on catalyst loading.
To the authors surprise, this graph does not seem to have any linear regions as op-posed to what Herrmann [18] claims. This means that doubling the amount of catalystwould never double the hydrogen generation. The system seems to be saturated when thecatalyst loading has reached about 0.5 g, meaning that adding extra catalyst beyond thispoint will not improve the hydrogen generation rate any further. If adding more catalystafter saturation does not improve the hydrogen generation rate, it probably means thatall the UV-light is being adsorbed by the photocatalyst and there is nothing left for theextra catalyst added. It would be interesting to see if this catalyst saturation wouldhappen at lower catalyst loadings if some of the 14 UV lamps were removed, but thiswould have to be done in the future because of time limitations.
The highest measured hydrogen generation rate was obtained when using 500 mg ofthe 10 wt.% Cu−TiO2 photocatalyst, which produced 0.622 ml/min. This measurementwas used to calculate that the quantum yield of the photocatalyst was at 0.41 %. This isnot very impressive compared to other Cu−TiO2 based photocatalysts, as an example Yuet al. has reported a quantum yield of 13.4 % [40]. The calculation is shown in AppendixA on page I.
40
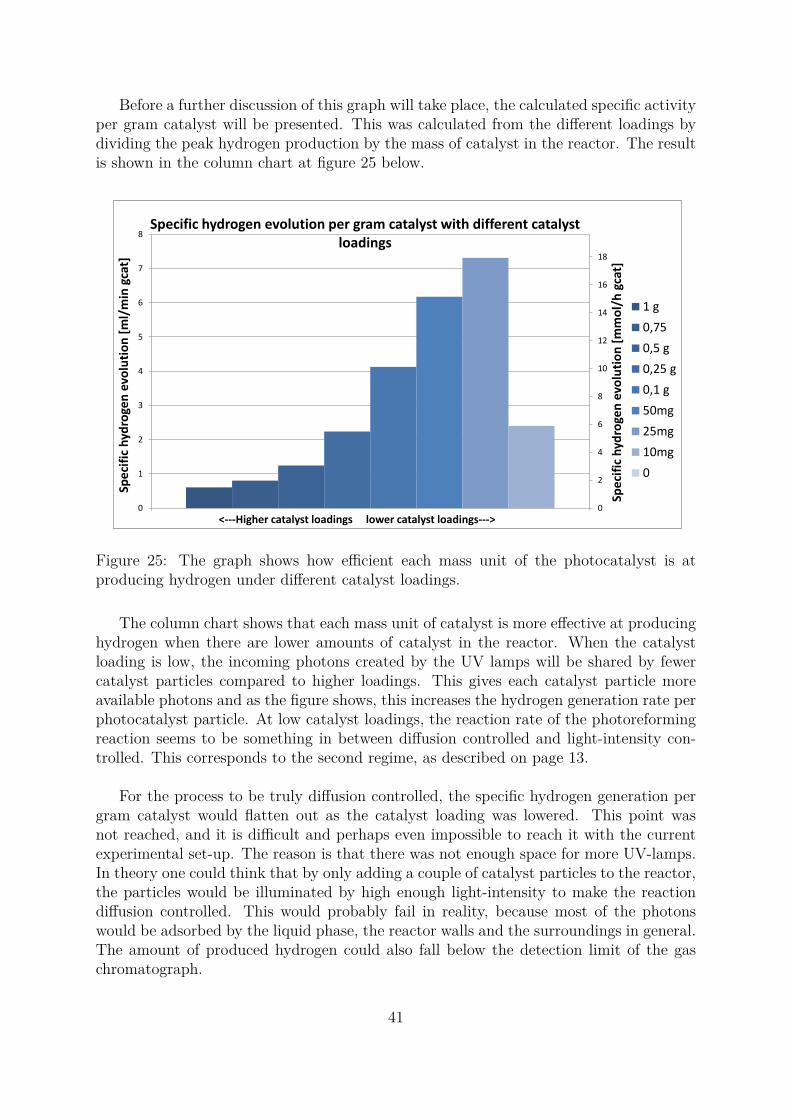
Before a further discussion of this graph will take place, the calculated specific activityper gram catalyst will be presented. This was calculated from the different loadings bydividing the peak hydrogen production by the mass of catalyst in the reactor. The resultis shown in the column chart at figure 25 below.
0
2
4
6
8
10
12
14
16
18
0
1
2
3
4
5
6
7
8
Spe
cifi
c h
ydro
gen
evo
luti
on
[m
mo
l/h
gca
t]
Spe
cifi
c h
ydro
gen
evo
luti
on
[m
l/m
in g
cat]
<---Higher catalyst loadings lower catalyst loadings--->
Specific hydrogen evolution per gram catalyst with different catalyst loadings
1 g
0,75
0,5 g
0,25 g
0,1 g
50mg
25mg
10mg
0
Figure 25: The graph shows how efficient each mass unit of the photocatalyst is atproducing hydrogen under different catalyst loadings.
The column chart shows that each mass unit of catalyst is more effective at producinghydrogen when there are lower amounts of catalyst in the reactor. When the catalystloading is low, the incoming photons created by the UV lamps will be shared by fewercatalyst particles compared to higher loadings. This gives each catalyst particle moreavailable photons and as the figure shows, this increases the hydrogen generation rate perphotocatalyst particle. At low catalyst loadings, the reaction rate of the photoreformingreaction seems to be something in between diffusion controlled and light-intensity con-trolled. This corresponds to the second regime, as described on page 13.
For the process to be truly diffusion controlled, the specific hydrogen generation pergram catalyst would flatten out as the catalyst loading was lowered. This point wasnot reached, and it is difficult and perhaps even impossible to reach it with the currentexperimental set-up. The reason is that there was not enough space for more UV-lamps.In theory one could think that by only adding a couple of catalyst particles to the reactor,the particles would be illuminated by high enough light-intensity to make the reactiondiffusion controlled. This would probably fail in reality, because most of the photonswould be adsorbed by the liquid phase, the reactor walls and the surroundings in general.The amount of produced hydrogen could also fall below the detection limit of the gaschromatograph.
41

When the catalyst loading increases, fewer and fewer photons are available per pho-tocatalyst particle. This means the rate of electron and hole generation per particle wouldgradually decrease and ultimately fall below the rates of diffusion, adsorption and surfacereaction 24. This means that for high catalyst loadings the system will be in the thirdregime where the reaction rate is light-intensity controlled and therefore proportional tothe radiant flux of photons. As a result, the height of the plateau on the right in figure24 should be proportional to the number of installed UV-lamps but there was not enoughtime to test this hypothesis.
On the column chart in figure 25, the very lowest catalyst loading of 10 mg breaksthe general trend and this is not easy to explain. The measurement was repeated threetimes with a relative error of 7.3 %, meaning that it was not just some a random failurethat caused the strange measurement. One possible explanation could be that the gaschromatograph struggles at finding or calculating the correct amount of hydrogen whenthe gas is highly diluted which happens at very low catalyst loadings. Other unknowneffects could also be the cause.
42

4.1.2 The effect of copper content on the photocatalytic activity of Cu−TiO2
In several studies, the optimum copper content of the Cu−TiO2 photocatalyst is reportedto be everywhere from 1.2 wt.% to 8.12 wt.%. Seven different catalyst were synthesizedusing the wetness impregnation method, having a copper content ranging from 0 wt.%to 10 wt.%. Two different 0 wt% Cu catalyst were tested, one of them was pure anduntreated P25 while the other one recieved the same treatment as the copper catalystsexcept the addition of the copper precursor to the impregnation water. None of thesetwo catalysts produced any detectable amount of H2 during the photoreforming reaction,meaning that a co-catalyst such as copper is crucial for the photoactivity of the TiO2catalyst. In order to determine the optimum copper content the catalyst was loaded with250 mg of catalyst and the detailed procedure is already explained in section 3.2 on page35. In figure 26 below, the peak hydrogen evolution of the different catalyst is plottedagainst wt.% Cu.
0
0,1
0,2
0,3
0,4
0,5
0,6
0,7
0,00 2,00 4,00 6,00 8,00 10,00
Pe
ak h
ydro
gen
evo
luti
on
[m
l/m
in]
Copper content [wt.%]
Catalyst activity as function of copper content in TiO2
Figure 26: The graph shows how the copper content of the Cu−TiO2 photocatalyst affectsthe photocatalytic activity.
The figure shows that as long as there are some copper species present, the exactamount seems to be of little importance to the activity of the photocatalyst . The bestresult was achieved with 10 wt.% Cu, but with such small margins nothing can really beconcluded yet.
The shape of the figure above differs significantly from what is obtained by Wu et al.and from figure 14 on page 23 obtained by Sreethawong and Yoshikawa [37], where theactivity of the Cu−TiO2 photocatalyst drops significantly after only 1.2 wt.% and 1.5wt.% Cu respectively. It is likely that the difference in results are caused by a differentpreparation method of the catalyst. The catalyst used in this project was prepared using
43

the incipient wetness impregnation method (IWI), while Sreethawong and Yoshikawaused a single-step sol-gel method. From table 1 on page 22 it seems like there is a slighttrend where the reported optimal Cu loading generally is lower for sol-gel method thanfor IWI method. In 2011 Ida Bjørnstad reported in her Master’s Thesis that the CuOtend to be deposited in the pores of the titania particles when the IWI method was used,while a higher percentage of the CuO was deposited on the particle surface when othermethods like the deposition precipitation (DP) method was used [50]. This coincides verywell with the fact that Cu−TiO2 photocatalysts seems to have higher "copper tolerance"when they are prepared using the IWI method. When a high percentage of the copperoxide is deposited inside the pores of the titania particles, they are deposited in the"shadow zone" where they do not block incoming photons from hitting the titania phasewhile they are still able participate in the reaction. On the other hand, CuO depositedon the surface of the titania will block some of the incoming photons from reaching thetitania phase and in this way limit the photoactivity of the catalyst. In short, the IWImethod can handle higher copper contents because most of the copper doesn’t blockphotons from reaching the TiO2 phase. Because of time limitations however, no catalystswere made by the DP method meaning that this theory was not verified.
44

4.2 Catalyst deactivation and reactivation attemptsOne of the activity experiments were run for an extended amount of time, in order tosee much the catalyst would deactivate. The graph on figure 27 below shows how theactivity of the photocatalyst decays with time after the peak activity is reached.
0
10
20
30
40
50
60
70
80
90
100
0 10 20 30 40
% o
f p
eak
act
ivit
y
Time on stream [h]
Deactivation of 1 g 10 % Cu-TiO2 catalysts
Figure 27: The figure shows how the hydrogen production decays over time as the pho-tocatalyst deactivates.
As the graph shows, the photocatalytic system suffered from deactivation and thehydrogen generation rate dropped from 100 % to 50 % in about 19 hours. After about40 hours, only 30 % of the peak activity was left.
As mentioned on page 39, hydrogen reduction was attempted in order to recover someof the photocatalytic activity. This had no effect at all, indicating that oxidation of thecatalyst is not a problem. This should not really come as any suprise, as the methanolensures that the liquid phase provides a reducing enviroment.
45

The other method that was attempted was much more succesfull. The liquid phasewas renewed two times and an extra 250 ml of methanol was added the third time inorder to observe how the photocatalytic activity responded. The photocatalyst was nevercleaned during the experiment and the results are shown in figure 28 below.
0
0,1
0,2
0,3
0,4
0,5
0,6
0,7
0 20 40 60 80 100
Hyd
roge
n e
volu
tio
n [
ml/
min
]
Time [h]
The effect of re-activation by refreshment of the reaction mixture
Initial activity
Activity after 1st refill
Activity after 2nd refill
Activity after 2 refillsand additional 250 mlmethanol added
Figure 28: The figure shows how the hydrogen evolution responds to refreshment ofsolution and the addition of more methanol.
The figure shows varying results from refreshing the liquid phase. The first time itincreases the activity beyond the previous maxima while the second time shows a muchweaker effect. The fact that the activity is increased beyond the first maxima is noteasy to explain, but it might suggests that there are both deactivation mechanisms andactivitation mechanisms occurring at the same time. It could be that accumulation ofby-products has a deactivating effect while there are some other effects that activates thecatalyst. Every time after a photoreforming experiment was performed, the catalyst andreactor smelled a bit like fish, which is probably caused by one or several by-products.The fact that refreshment of the solution worked so well even though the catalyst wasnot cleansed, suggests that the major source of deactivation actually is the accumulationof by-products which are not strongly adsorbed on the photocatalyst. This coincideswell with what Xu et al. has reported in literature where accumulation of by-productswas found to be the largest source of deactivation [3]. On picture 23 on page 38, thereduction of copper oxides to metallic copper is confirmed and this is also a contributorto deactivation even though it is hard to say exactly to which extent this occurs.
One of the activating effects could be caused when excited electrons accumulate inthe TiO2 phase causing the particles to receive a local negative charge in the bulk phase.In order to preserve the overall electroneutrality of the particles, H+ ions is likely to stickto the particle surface giving the particle a positive surface charge. This positive surfacecharge could cause repulsive forces between the particles and in this way separate those
46

who have agglomerated. Agglomeration has been present in every experiment and isobservable with the naked eye as shown on figure 22 on page 37. If these agglomerationswere to break into smaller particles, the overall active surface area should increase whichwould boost the hydrogen evolution. Another activating effect could be the removal ofdissolved oxygen from the liquid phase caused by the continuous argon flow and perhapsalso depletion by reaction. Dissolved oxygen may react with the excited electrons in placeof H+ and thus inhibit hydrogen generation.
The dominant source of error for this particular experiment is likely to be the factthat some catalyst is lost in the filtering process. This amount is probably not the sameevery time, and it is the smallest and most active particles that are the hardest one torecover because they stick very well to the filter. This reduced the catalyst loading everytime filtration was performed. It is possible that more catalyst was lost during the 2ndfiltering process than during the first, but it is hard to tell. It could also be that theactivating effect was completed and stopped before the 2nd refreshment of the solution.When it comes to the addition of extra methanol, Xu et al. argues that the hydrogenevolution increases with methanol concentration according to the Freundlich adsorptionisotherm so the obtained result is not surprising [41].
On a second note, the photoreforming was run at a very high catalyst loading whichmeans that a slight decrease in the loading should have negligible effect on the hydrogenevolution rate. This is illustrated well on figure 24 on page 40 where the catalyst loadingscorrespond to the plateau-area of the graph even after some catalyst is lost. This makesit hard to say if loosing some of the smallest catalyst particles really has any effect onthe hydrogen production rate.
47

4.3 Additional observationsOn figure 25, the last measurement breaks the overall trend. By assuming that this wascaused by an error and changing the value to something more expected, figure 29 belowwas created.
0,9 1
0
1
2
3
4
5
6
7
8
9
Spe
cifi
c h
ydro
gen
evo
luti
on
[m
l/m
in g
cat]
<---Higher catalyst loadings lower catalyst loadings--->
Specific hydrogen evolution per gram catalyst with different catalyst loadings
Figure 29: The graph shows how efficient each mass unit of the photocatalyst is atproducing hydrogen under different catalyst loadings.
The column to the right in the chart above changed from the original value of 2,4 to8 which is a fabricated value, but the chart looks nicer and more systematic this way.
48

If the same value is used to replace the old value on figure 24, the graph would likelook like figure 30 below.
0
0,1
0,2
0,3
0,4
0,5
0,6
0,7
0 0,1 0,2 0,3 0,4 0,5 0,6 0,7 0,8 0,9 1
Pe
ak h
ydro
gen
evo
luti
on
[m
l/m
in]
Catalyst loading [g]
Maximum hydrogen evolution with different catalyst loadings
Figure 30: The graph shows how hydrogen generation rate depends on catalyst loading.
An interesting observation is that the three first points on the graph appear to be ona straight linear line. To better see if this really is the case, figure 31 has zoomed in onthe four first points of the the graph:
Figure 31: Magnification of four first points of graph 30.
Indeed the three first points seem to be approximately on a linear line, which agreeswell with what Herrmann has reported [18].
49
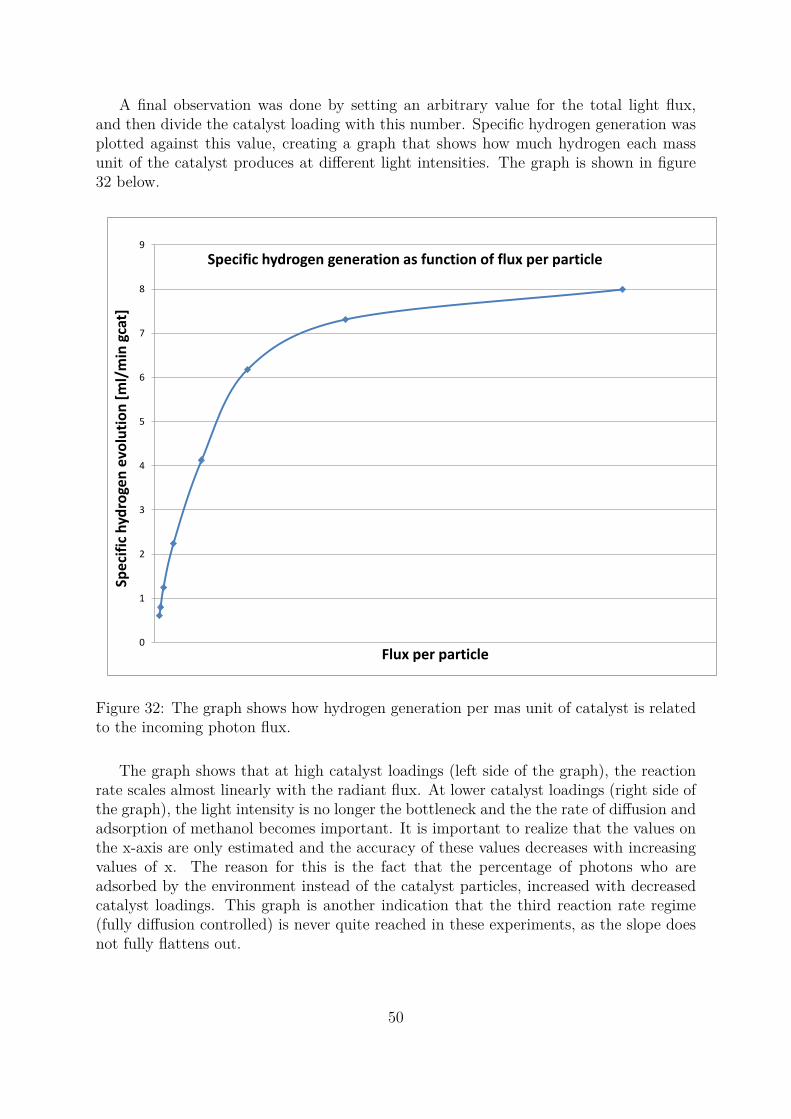
A final observation was done by setting an arbitrary value for the total light flux,and then divide the catalyst loading with this number. Specific hydrogen generation wasplotted against this value, creating a graph that shows how much hydrogen each massunit of the catalyst produces at different light intensities. The graph is shown in figure32 below.
0
1
2
3
4
5
6
7
8
9
Spe
cifi
c h
ydro
gen
evo
luti
on
[m
l/m
in g
cat]
Flux per particle
Specific hydrogen generation as function of flux per particle
Figure 32: The graph shows how hydrogen generation per mas unit of catalyst is relatedto the incoming photon flux.
The graph shows that at high catalyst loadings (left side of the graph), the reactionrate scales almost linearly with the radiant flux. At lower catalyst loadings (right side ofthe graph), the light intensity is no longer the bottleneck and the the rate of diffusion andadsorption of methanol becomes important. It is important to realize that the values onthe x-axis are only estimated and the accuracy of these values decreases with increasingvalues of x. The reason for this is the fact that the percentage of photons who areadsorbed by the environment instead of the catalyst particles, increased with decreasedcatalyst loadings. This graph is another indication that the third reaction rate regime(fully diffusion controlled) is never quite reached in these experiments, as the slope doesnot fully flattens out.
50
4.4 Choosing the appropriate values to report
As seen on figure 25, the specific hydrogen production rate of the 10 wt.% Cu−TiO2photocatalyst is ranging from 1.49 to 17.93 mmol h−1 gcat.−1 depending on the catalystloading. It could of course be tempting to report the highest value, if the goal was to ob-tain research funding and getting a reputation. As it stands today, reporting the highestvalue actually seems to be accepted even though the corresponding catalyst loading isas low as 25 mg per 0.5 L which is very unrealistic for a commercialized process. Ac-cording to Herrmann [18] the field of heterogeneous photocatalysis has only reached thepre-industrial level. Most of the scientific articles in the field are written by physiciansand chemists, not by chemical engineers or entrepreneurs who craves commercialisation.As a result, there are no standardised guidelines for how the experiments should be con-ducted and how to report the results. In the abstract-, results- and conclusions part ofthe scientific articles where a specific hydrogen generation rate is reported, this valueis always reported alone without information about the corresponding catalyst loading.The information regarding catalyst loading is usually only found by searching throughthe experimental part of such an article. In other words, the two closely related numbersof catalyst loading and specific hydrogen generation are not reported together. One couldactually argue that this makes the reported value of specific hydrogen generation rate lessinformative and trustworthy than what it seems like at first glance.
The author would like to propose a simplified solution to this problem, that neitherrequires too much time nor the acquisition of new lab-equipment. The perfect solution tomaking standardised measurements and reports, would of course be to use standardisedequipment and a standardised catalyst loading. This is very unrealistic, as different labsoperates with different reactors and radiant fluxes. A simplified solution to the problemcould– be to just report the initial quantum yield with respect to hydrogen , the quantumyield after 24 hours or a set number of hours/days and the corresonding wavelength ofthe light source. This is probably the best way to compare photocatalysts, as the resultsshould in theory be independent of the equipment used. Luckily the quantum yield andthe corresponding wavelength are to some extent used in literature today, usually as ameans to determine the quality of novel photocatalysts like for example K4Nb6O17 asreported by Domen et al.
If one still insists on reporting a hydrogen generation rate, this could be done in afair way by first finding the catalyst saturation point of the system. This is done by con-ducting experiments on different catalyst loadings and producing a graph like figure 24on page 40. The reported specific hydrogen generation rate should be the value obtainedat catalyst saturation of the system. This is reasonable because a future commercializedphotoreforming process would have to be operated as cost-efficient as possible, which isobtained when the catalyst loading is at the saturation point. At this optimum cata-lyst loading, the hydrogen production per plant is maximized with a minimal waste ofcatalyst. The catalyst saturation point is also likely to adjust itself from one radiantflux to another, making sure that experimental set-ups do not gain any advantage ordisadvantage by using a different number of UV-lamps. A final detail that should alsobe reported along with the hydrogen evolution rate, is the wavelength of the light source
51

that has been used, or atleast information about how large percentage of the photonswhich are able to overcome the bandgap of the semiconductor. A high hydrogen pro-duction at higher wavelength is more impressive than at low wavelengths. By using thisstandardised method, the reader would get a better impression of the real quality of thephotocatalyst.
In this project, the catalyst saturation point was at 500 mg and the correspondingspecific hydrogen generation rate was measured to be 3.05 mmol h−1 gcat.−1 . If this wasa scientific article, the reported value would then be "3.05 mmol h−1 gcat.−1 at catalystsaturation (500 mg cat.) with a quantum yield of 0.41 % using UVC light at 254 nm".By implementing this convention, sorting out the better photocatalyst from the worsecould be done faster, easier and maybe even the commercialisation of photoreformingwould speed up.
52
4.5 BET resultsThe results from the BET measurements are shown in table 2 below.
Table 2: The table shows the measured BET surface area for the different Cu−TiO2catalysts.
Sample P25 0 wt.% Cu 1 wt.% Cu 5 wt.% Cu 10 wt.% CuBET surface area [m2 g−1] 53.6 53.3 53.5 49.8 44.7
The results show that the BET surface area is decreasing slightly when the amountof copper is increased. This observation agrees with Sreethawong and Yoshikawa’s [37]observations and was therefore expected. The difference between the P25 sample andthe "0 wt.% Cu" is that the latter sample has received the same treatment as the otherCu−TiO2 catalysts with the exception of adding the copper precursor to the distilledwater. Because the results are so similar, it looks like wetting, drying and calcination at200 ◦C for 4 h does not affect the surface are of the TiO2 phase. This may come as asurprise because the two samples looks quite different, the pure P25 sample is very lightand "fluffy" whereas the calcined sample is much more dense.
53
5 ConclusionsCu−TiO2 catalysts prepared by the IWI method consists of particles that tend to agglom-erate strongly, so proper crushing and sieving of the photocatalyst powder is necessaryfor getting reproducible results during photoreforming experiments.
The specific hydrogen generation rate was observed to increase with decreasing cata-lyst loading, due to higher photon flux per mass unit of photocatalyst. The reactionkinetics seemed to be mainly controlled by the light intensity, but for low catalyst load-ings it seems like the kinetics started to approach the diffusion controlled domain.
The pure TiO2 photocatalyst did not produce any detectable amount of H2, but thehydrogen generation rates of the catalysts containing 1 wt.% Cu, 5 wt.% Cu, 7.5 wt.%Cu and 10 wt.% Cu were surprisingly similar. The weak copper dependency illustratedby figure 26 does not agree well with literature [38] [37], but this difference is likely to becaused by the difference in catalyst preparation methods.
The system used in this project was saturated with photocatalyst at a catalyst load-ing of 500 mg. At this point, the specific hydrogen generation was measured to be 3.05mmol h−1 gcat.−1 and the quantum yield was calculated to be at 0.41 %.
The photocatalytic system suffered from deactivation and the hydrogen generationrate dropped from 100 % to 50 % in about 19 hours. Among the reactivation attempts,refreshment of the liquid phase was highly successful in regaining the lost activity. This in-dicates that the main source of deactivation comes from the accumulation of by-products,even though the reduction of CuxO to metallic Cu is confirmed on picture 23.
The BET surface area of the catalyst was unaffected by the IWI method and thecalcination itself, but an increasing copper content caused a decreasing BET surface area.
54
6 Future workIf a continuation of this project or a similar project will be carried out in the future, sev-eral improvements could and should be made. The first improvement that comes to mindis the replacement of the custom-made sieve having a large but variable mesh-size by twoproper ones with a known and constant mesh-size. This way, one could use a middlefraction of the photocatalyst where the particles have a known minimum and maximumsize. This should increase the reproducibility of the photoreforming experiments evenfurther by eliminating the randomness in particle size.
The plateau at figure 24 on page 40 started at a catalyst loading of 500 mg, andit would be really interesting to see if this plateau would be moved to a lower catalystloading by removing some of the UV-lights. The optimal copper loading could also befound for catalysts made by other methods than the IWI method, to confirm if this valuereally depends on the preparation method or not.
There is also more to be done about the investigations on deactivation. The extent ofCuO reduction could be investigated along with an analysis of the by-products. Maybethe stability of the process could be improved by adding a reagent that reacts with thebyproducts?
55
References[1] J. Blanco et al. Renewable and sustainable energy reviews 13. 13:1437, 2009.
[2] BP. Consumption by fuel, 1965–2008. Statistical Review of World Energy, 2008.
[3] Shiping Xu, Jiawei Ng, Xiwang Zhang, Hongwei Bai, and Darren Delai Sun. Fabrica-tion and comparison of highly efficient cu incorporated TiO2 photocatalyst for hydro-gen generation from water. International Journal of Hydrogen Energy, 35(11):5254– 5261, 2010. 3rd Argentinean and 2nd Latin American Congress in Hydrogen andSustainable Energy Sources.
[4] A. Domínguez, J.A. Menéndez, and J.J. Pis. Hydrogen rich fuel gas production fromthe pyrolysis of wet sewage sludge at high temperature. Journal of Analytical andApplied Pyrolysis, 77(2):127 – 132, 2006.
[5] Susanta K. Das, Antonio Reis, and K.J. Berry. Experimental evaluation of co pois-oning on the performance of a high temperature proton exchange membrane fuelcell. Journal of Analytical and Applied Pyrolysis, 2009.
[6] Ilenia Rossetti. Hydrogen production by photoreforming of renewable substrates.ISRN Chemical Engineering, 2012.
[7] Paul Alois. Global water crisis overview. http://www.arlingtoninstitute.org/wbp/global-water-crisis/441. Accessed: 10/04/2013.
[8] U.S. DEPARTMENT OF ENERGY. Toward a Hydrogen Economy. http://www.netl.doe.gov/keyissues/hydrogen_economy.html. Accessed: 9/06/2013.
[9] McNaught and Wilkinson. Iupac gold book - photocatalyst. http://goldbook.iupac.org/PT07446.html. Accessed: 30/02/2013.
[10] B. Ohtani. Photocatalysis A to Z—what we know and what we do not know ina scientific sense. Journal of Photochemistry and Photobiology C: PhotochemistryReviews, 11(4):157 – 178, 2010.
[11] Akira Fujishima, Xintong Zhang, and Donald A. Tryk. TiO2 photocatalysis andrelated surface phenomena. Surface Science Reports, 63(12):515 – 582, 2008.
[12] KENICHI HONDA AKIRA FUJISHIMA. Electrochemical photolysis of water at asemiconductor electrode. Nature, (5358):37–38, 1972.
[13] Hilde Venvik, editor. TKP 4515 KEM 2012 Photocatalysis. NTNU, SINTEF, 2012.With input from Magnus Rønning, Astrid Mejdell and Asmira Delic.
[14] Kazuya Nakata and Akira Fujishima. TiO2 photocatalysis: Design and applications. Journal of Photochemistry and Photobiology C: Photochemistry Reviews, 13(3):169– 189, 2012.
[15] Akira Fujishima, Xintong Zhang, and Donald A. Tryk. TiO2 photocatalysis andrelated surface phenomena. Surface Science Reports, 63(12):515 – 582, 2008.
56

[16] Chong-Mou Wang, Adam Heller, and Heinz Gerischer. Palladium catalysis of O2reduction by electrons accumulated on TiO2 particles during photoassisted oxidationof organic compounds. Journal of American Chemical Society, 13(114):5230–5234,1992.
[17] H. S. Fogler. Elements of Chemical Reaction Engineering. Prentice Hall, New Jersey,3 edition, 1999.
[18] J.-M. Herrmann. Heterogeneous photocatalysis: state of the art and present applica-tions in honor of pr. r.l. burwell jr. (1912–2003), former head of ipatieff laboratories,northwestern university, evanston (ill). Topics in Catalysis, 34(1-4):49–65, 2005.
[19] Hasliza Bahruji, Michael Bowker, Philip R. Davies, and Fabien Pedrono. New in-sights into the mechanism of photocatalytic reforming on Pd−TiO2. Applied Cata-lysis B: Environmental, 107(1–2):205 – 209, 2011.
[20] Kazuhito Hashimoto, Hiroshi Irie, and Akira Fujishima. TiO2 photocatalysis: Ahistorical overview and future prospects. Japanese Journal of Applied Physics,44(12):8269–8285, 2005.
[21] Kazuhito Hashimoto, Hiroshi Irie, and Akira Fujishima. TiO2 photocatalysis: Ahistorical overview and future prospects. Japanese Journal of Applied Physics,44(12):8269–8285, 2005.
[22] N. T. Nolan, M. K. Seery, and S. C. Pillai. Spectroscopic investigation of the anatase-to-rutile transformation of sol-gel-synthesized TiO2 photocatalysts. Journal of Phys-ical Chemistry C, 113(36):16151–16157, 2009. Cited By (since 1996): 22.
[23] Y. Hu, H. . Tsai, and C. . Huang. Effect of brookite phase on the anatase-rutile trans-ition in titania nanoparticles. Journal of the European Ceramic Society, 23(5):691–696, 2003. Cited By (since 1996): 86.
[24] Complexes and First-Row Transition Elements. MacMillan Education, 1974.
[25] Miguel Pelaez, Nicholas T. Nolan, Suresh C. Pillai, Michael K. Seery, Polycar-pos Falaras, Athanassios G. Kontos, Patrick S.M. Dunlop, Jeremy W.J. Hamilton,J.Anthony Byrne, Kevin O’Shea, Mohammad H. Entezari, and Dionysios D. Di-onysiou. A review on the visible light active titanium dioxide photocatalysts forenvironmental applications. Applied Catalysis B: Environmental, 125(0):331 – 349,2012.
[26] A. Wisitsoraat, A. Tuantranont, E. Comini, G. Sberveglieri, and W. Wlodarski.Characterization of n-type and p-type semiconductor gas sensors based on niox dopedTiO2 thin films. Thin Solid Films, 517(8):2775 – 2780, 2009.
[27] Michael R. Hoffmann, Scot T. Martin, Wonyong. Choi, and Detlef W. Bahnemann.Environmental applications of semiconductor photocatalysis. Chemical Reviews,95(1):69–96, 1995.
57

[28] Yawen Wang, Yu Huang, Wingkei Ho, Lizhi Zhang, Zhigang Zou, and ShunchengLee. Biomolecule-controlled hydrothermal synthesis of C–N–S-tridoped TiO2 nano-crystalline photocatalysts for NO removal under simulated solar light irradiation .Journal of Hazardous Materials , 169(1–3):77 – 87, 2009.
[29] C. Su, C.-M. Tseng, L.-F. Chen, B.-H. You, B.-C. Hsu, and S.-S. Chen.Sol–hydrothermal preparation and photocatalysis of titanium dioxide. Thin SolidFilms , 498(1–2):259 – 265, 2006. Proceedings of The Third Asian Conference onChemical Vapor Deposition (Third Asian-CVD).
[30] Tom’s of Maine. Ingredients: Titanium dioxide. http://www.tomsofmaine.com/research/ingredients/ingredient-detail/titanium-dioxide. Accessed:24/04/2013.
[31] Winkler and Jochen. Titanium Dioxide. Vincentz Network, 2003.
[32] K Joseph Anthony Raj and B Viswanathan. Effect of surface area, pore volume andparticle size of p25 titania on the phase transformation of anatase to rutile. IndianJournal of Chemistry, 2009.
[33] Jae Sung Lee. Nanocomposite photocatalysts for solar hydrogen production.
[34] Maria Vittoria Dozzi and Elena Selli. Doping TiO2 with p-block elements: Effectson photocatalytic activity. Journal of Photochemistry and Photobiology C: Photo-chemistry Reviews, 14(0):13 – 28, 2013.
[35] Ulrike Diebold. Photocatalysts: Closing the gap. Nature Chemistry, 3(4):271–2,2011. Copyright - Copyright Nature Publishing Group Apr 2011; Last updated -2013-02-23; DOI - 2344476471; 61266581; 145835; NCHM; 21430683.
[36] X. Chen, L. Liu, P. Y. Yu, and S. Mao. Increasing solar absorption for photocatalysiswith black hydrogenated titanium dioxide nanocrystals. S. Science, 331:746–750,2011.
[37] Thammanoon Sreethawong and Susumu Yoshikawa. Comparative investigation onphotocatalytic hydrogen evolution over Cu-, Pd-, and Au-loaded mesoporous TiO2photocatalysts. Catalysis Communications, 6(10):661 – 668, 2005.
[38] Nae-Lih Wu and Min-Shuei Lee. Enhanced TiO2 photocatalysis by Cu in hydro-gen production from aqueous methanol solution. International Journal of HydrogenEnergy, 29(15):1601 – 1605, 2004.
[39] Hyung-Joo Choi and Misook Kang. Hydrogen production from methanol/waterdecomposition in a liquid photosystem using the anatase structure of Cu loaded TiO2.International Journal of Hydrogen Energy, 32(16):3841 – 3848, 2007. Symposium onMaterials in Clean Power Systems.
[40] Jiaguo Yu, Yang Hai, and Mietek Jaroniec. Photocatalytic hydrogen productionover CuO-modified titania. Journal of Colloid and Interface Science, 357(1):223 –228, 2011.
58
[41] Shiping Xu and Darren Delai Sun. Significant improvement of photocatalytic hy-drogen generation rate over TiO2 with deposited CuO. International Journal ofHydrogen Energy, 34(15):6096 – 6104, 2009.
[42] J. Bandara, C.P.K Udawatta, and C. S. K. Rajapakse. Highly stable CuO incorpor-ated TiO2 catalyst for photocatalytic hydrogen production from H2O. Photochemicaland Photobiological Sciences, 2005.
[43] Shiping Xu and Darren Delai Sun. Significant improvement of photocatalytic hydro-gen generation rate over TiO2 with deposited cuo. International Journal of HydrogenEnergy, 34(15):6096 – 6104, 2009.
[44] Marıa D., Hernandez-Alonso, Fernando Fresno, Silvia Suarez, and Juan M. Coron-ado. Development of alternative photocatalysts to TiO2: Challenges and opportun-ities. Energy & Environmental Science, 2009.
[45] Hideki Kato, Kiyotaka Asakura, and Akihiko Kudo. Highly efficient water splittinginto H2 and O2 over lanthanum-doped NaTaO3 photocatalysts with high crystallinityand surface nanostructure. Journal of the American Chemical Society, 125(10):3082–3089, 2003.
[46] Akihiko Kudo, Hideki Kato, and Seira Nakagawa. Water splitting into H2 and O2on new Sr2MO7 (M = Nb and Ta) photocatalysts with layered perovskite struc-tures: Factors affecting photocatalytic activity. The Journal of Physical ChemistryB, 104(3):571–575, 2000.
[47] HyunGyu Kim, DongWon Hwang, SangWon Bae, JongHyeon Jung, and JaeSungLee. Photocatalytic water splitting over La2Ti2O7 synthesized by the polymerizablecomplex method. Catalysis Letters, 91(3-4):193–198, 2003.
[48] S. Ikeda, M. Hara, J.N. Kondo, K. Domen, H. Takahashi, T. Okubo, and M. Kaki-hana. Preparation of K2La2Ti3O10 by polymerized complex method and photocata-lytic decomposition of water. Chemistry of Materials, 10(1):72–77, 1998. cited By(since 1996)101.
[49] Catherine Louis. Production of Supported Catalysts by Impregnation and (Vis-cous) Drying. http://www.crcnetbase.com/doi/pdf/10.1201/9781420006506.ch15. Accessed: 11/06/2013.
[50] Ida Lien Bjørnstad. Photocatalytic fuel production by photoreforming of hydrocar-bons. Master’s thesis, NTNU - Norwegian University of Technology and Science,2011.
[51] The Free Dictionary. calcination. http://www.thefreedictionary.com/calcination. Accessed: 3/06/2013.
[52] Catherine Louis. Deposition-Precipitation Synthesis of Supported Metal Catalysts.http://www.crcnetbase.com/doi/pdf/10.1201/9781420006506.ch14. Accessed:3/06/2013.
59
[53] Catherine Louis. Sol-gel methods. http://www.uio.no/studier/emner/matnat/kjemi/KJM5100/h06/undervisningsmateriale/10KJM5100_2006_sol_gel_d.pdf. Accessed: 3/06/2013.
[54] Joe Satcher. Novel Materials from Solgel Chemistry. https://www.llnl.gov/str/May05/Satcher.html. Accessed: 4/06/2013.
[55] D A H Hanaor, I Chironi, I Karatchevtseva, G Triani, and C C Sorrell. Single andmixed phase TiO2 xmlns="http://pub2web.metastore.ingenta.com/ns/"> powdersprepared by excess hydrolysis of titanium alkoxide. Advances in Applied Ceramics,111(3):149–158, 2012-04-01T00:00:00.
[56] Xiaoyang Pan, Nan Zhang, Xianzhi Fu, and Yi-Jun Xu. Selective oxidation of benzylalcohol over TiO2 nanosheets with exposed 001 facets: Catalyst deactivation andregeneration. Applied Catalysis A: General, 453(0):181 – 187, 2013.
[57] I. Chorkendorff and J.W Niemantsverdriet. Concepts of Modern Catalysis and Kin-etics. Wiley-VCH, 2007. ISBN: 978-3-527-31672-4.
[58] Kenneth S. Suslick. The chemical effects of ultrasound. SCIENTIFIC AMERlCAN,1989.
60
Appendix
Appendix A: Calculation examples and assumptionsSome of the copper loadings had to be converted from molar percentage to mass percent-age. It was assumed for simplicity that Copper existed purely in Cu(O) form. In realitycopper exists in CuO, Cu2O and elemental Cu(O) form but the ratio of Cu species toTiO2 is not changed when copper is oxidised which is why this assumption is acceptable.
Calculating the amount of copper, titania and water needed to produce 10 gof 10 % Cu Cu−TiO2 photocatalyst
The copper precursor was Cu(NO3)2 · 3H2O which has a high water solubility and a molarmass of 241.6 g
mol . The total catalyst amount would be 10 g with a total copper contentof 10 % on a mass basis, which means that the total mass of copper needed would be 10g× 10 %= 1 g. The molar mass of copper is 63.546 g
mol which means that total amountof copper precursor needed to get 1 gram of copper was 1× 241.6 g/mol
63.546 g/mol = 3.801 97 g. Themass of TiO2 needed would the remaining 90 % of the 10 g which equals 9 g. The finalcomponent of the catalyst was the water. An experiment showed that P25 titania wasable to absorb around 0.893 g of water per gram powder. To make the mixture easier towork with, 20 % excess water was used which also made sure that the copper solution wasevenly distributed in the P25 TiO2. The total amount of water was then 9×0.893×1.2 =9.6 ml.
Calculating the quantum yield
The quantum yield in this experiment is defined as the percentage of adsorbed photonsthat actually contributes to to reduction of H+ ions to H2 gas. For this definition to beviable, one has to assume that all the photons emitted by the UV-lamps will reach thecatalyst without being adsorbed by anything else. The glass reactor is transparent, thetubes are covered in aluminium foil and the outer walls are shiny which suggests thatmost of the UV light will actually hit the catalyst without being adsorbed. Now to thecalculations:
The total radiation power is 14 UV-lamps × 8 wattlamp
=112 watts of power consumedto produce UV-rays. Because some light is adsorbed unwanted and the efficiency of thelamps are less than 100 %, the actual power of the UV-rays should be close to 100 watts.The very most of the rays are emitted at 254 nm which corresponds to UVC rays, butsome are also at wavelengths > 390 nm making them useless to our photocatalyst. Thenumber of photons emitted per sec is calculated this way:
photonssecond
= Energy emitted /secondenergy / photon
= 100 J/sh× c
λwhere planck’s law E = h × c
λis used with c
as the speed of light (3× 10⁸ ms ), h as the planck constant (6.636× 10⁻³⁴ J
s ) and λ asthe wavelength of 254 nm. This gives 1.288× 10²⁰ photons/sec which corresponds to7.7281× 1021 photons/min. The hydrogen production rate peaked at 0.65 ml/min whichhad to be converted into moles by using the ideal gas law: PV=nRT at atmosphericpressure and 25 ◦C:
I
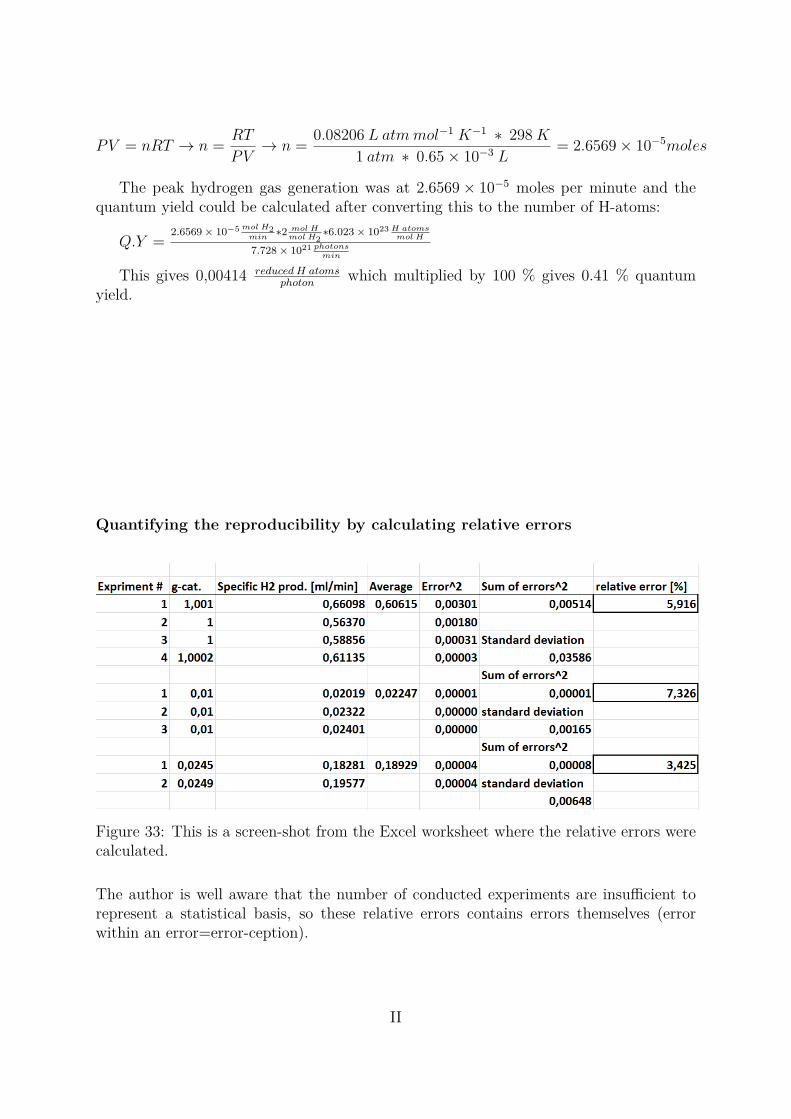
PV = nRT → n = RT
PV→ n = 0.08206 L atmmol−1 K−1 ∗ 298K
1 atm ∗ 0.65× 10−3 L= 2.6569× 10⁻⁵moles
The peak hydrogen gas generation was at 2.6569× 10⁻⁵ moles per minute and thequantum yield could be calculated after converting this to the number of H-atoms:
Q.Y =2.6569 × 10⁻⁵ mol H2
min∗2 mol Hmol H2
∗6.023 × 1023 H atomsmol H
7.728 × 10²¹ photonsmin
This gives 0,00414 reduced H atomsphoton
which multiplied by 100 % gives 0.41 % quantumyield.
Quantifying the reproducibility by calculating relative errors
Figure 33: This is a screen-shot from the Excel worksheet where the relative errors werecalculated.
The author is well aware that the number of conducted experiments are insufficient torepresent a statistical basis, so these relative errors contains errors themselves (errorwithin an error=error-ception).
II
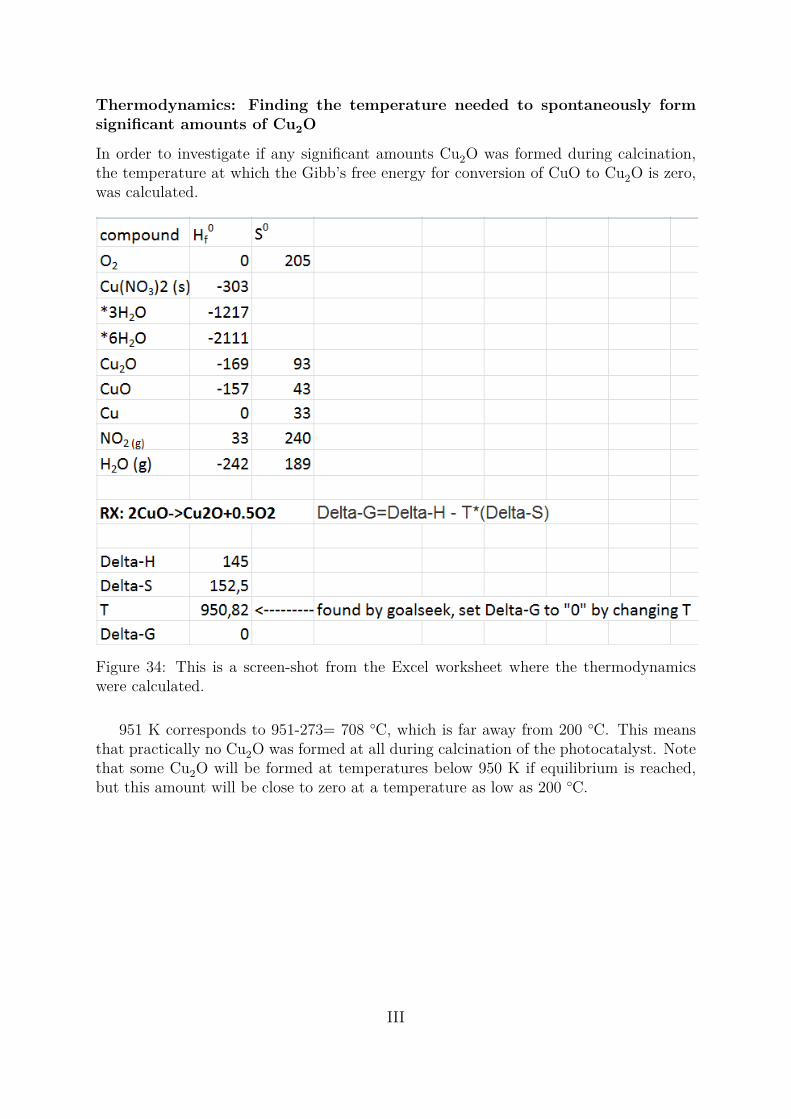
Thermodynamics: Finding the temperature needed to spontaneously formsignificant amounts of Cu2O
In order to investigate if any significant amounts Cu2O was formed during calcination,the temperature at which the Gibb’s free energy for conversion of CuO to Cu2O is zero,was calculated.
Figure 34: This is a screen-shot from the Excel worksheet where the thermodynamicswere calculated.
951 K corresponds to 951-273= 708 ◦C, which is far away from 200 ◦C. This meansthat practically no Cu2O was formed at all during calcination of the photocatalyst. Notethat some Cu2O will be formed at temperatures below 950 K if equilibrium is reached,but this amount will be close to zero at a temperature as low as 200 ◦C.
III

Appendix B: List of chemicals
Table 3: The table shows a summary of the chemicals used in this project.
Chemical Formula Phase Purity SupplierMethanol CH3OH l Analytical VVR Chemicals
Copper(II) nitrate trihydrate Cu(NO3)2 · 3H2O s ≥98 % Sigma AldrichAeroxide TiO2 P25 TiO2 s ≥99.5 % Evonik Degussa
Argon Ar g (5.0) Yara PraxairHydrogen H g (5.0) Yara Praxair
IV
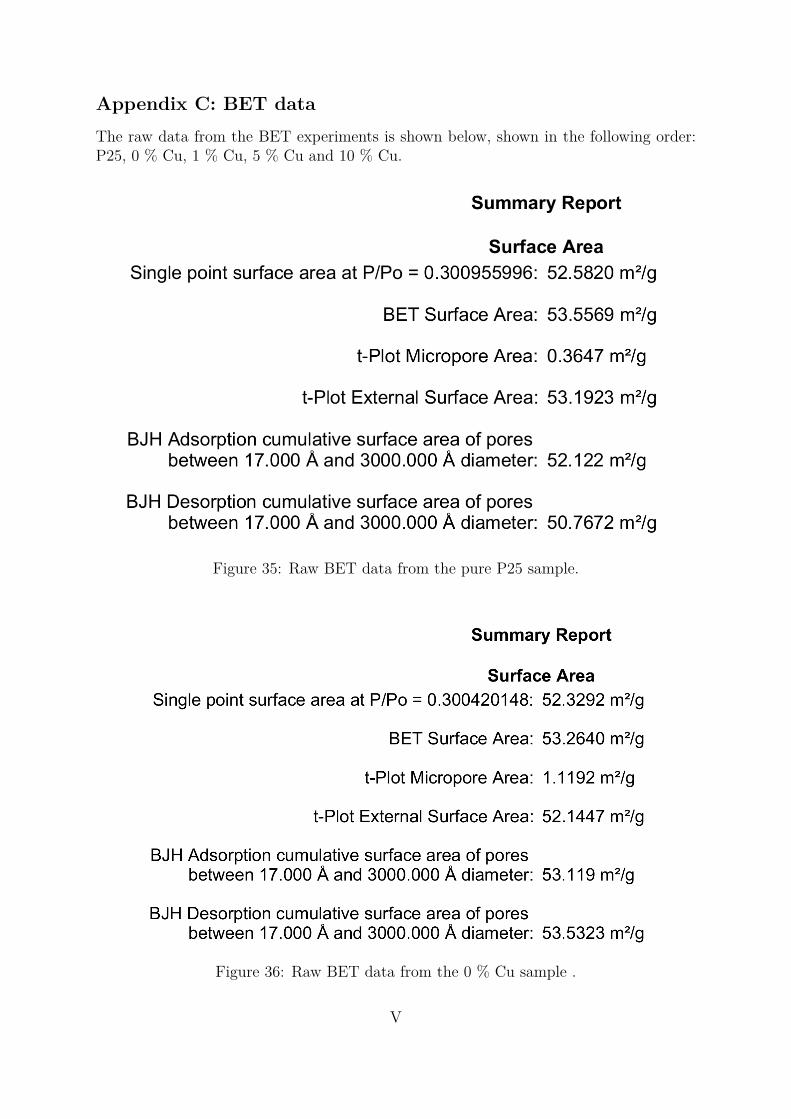
Appendix C: BET dataThe raw data from the BET experiments is shown below, shown in the following order:P25, 0 % Cu, 1 % Cu, 5 % Cu and 10 % Cu.
Figure 35: Raw BET data from the pure P25 sample.
Figure 36: Raw BET data from the 0 % Cu sample .
V
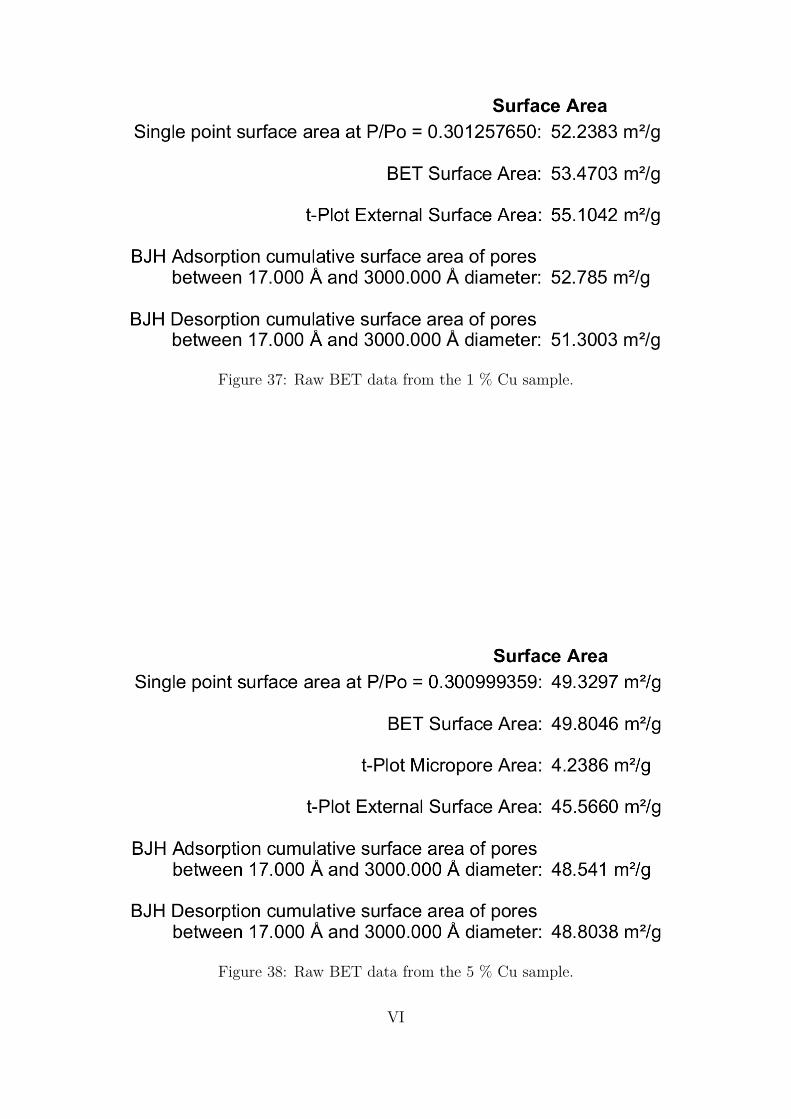
Figure 37: Raw BET data from the 1 % Cu sample.
Figure 38: Raw BET data from the 5 % Cu sample.
VI
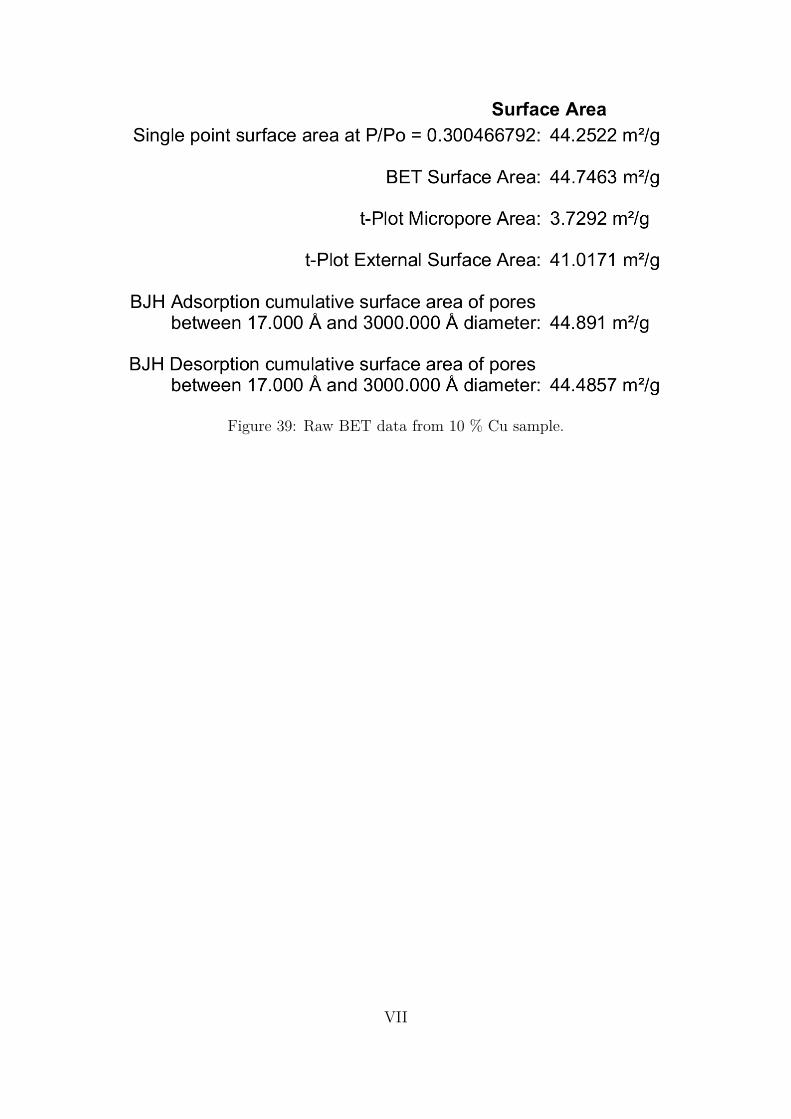
Figure 39: Raw BET data from 10 % Cu sample.
VII

Appendix D: HSE and risk assessmentExplanation of the Risk Matrix
Column1 Column2 Column3 Column4 Column5 Column6
Very critical E1 E2 E3 E4 E5
Critical D1 D2 D3 D4 D5
Dangerous C1 C2 C3 C4 C5
Relative safe B1 B2 B3 B4 B5
Safe A1 A2 A3 A4 A5
Minimal Low Medium High Very high
LIKELIHOOD
COLOR
Red Extreme risk – immediate action required
Yellow Attention needed to develop risk reduction strategies.
Green Minimal injury requiring no/minimal intervention or treatment.
ALARP
Risk will be treated to ensure they are "As Low As Reasonably Practical"(ALARP) or in the "Broadly Acceptable" areas.
CO
NS
EQ
UE
NC
E
RISK ASSESSMENT MATRIX
Describing function
What’s A Risk Matrix
A risk matrix is simple graphical tool. It provides a process for combining the chance for an occurance of an
event (likelihood) and the concequence if the event occured. Use the tool for everyday judgements and decisions.
Know when to accept the risk. Know when to reject the risk.
Generally Intolerable
Just for information! Do not write in this form.
VIII
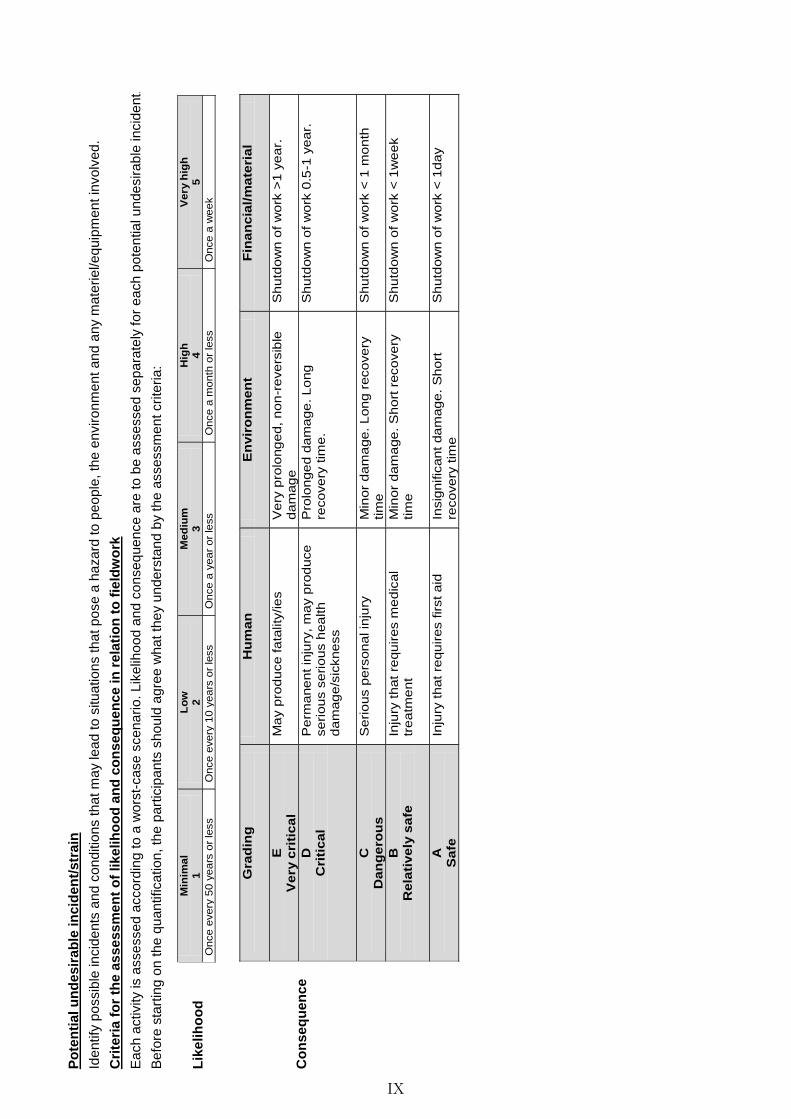
Po
ten
tia
l u
nd
es
ira
ble
in
cid
en
t/s
tra
in
Ide
ntify
po
ssib
le in
cid
en
ts a
nd
co
nd
itio
ns th
at m
ay le
ad
to
situ
atio
ns th
at p
ose
a h
aza
rd to
pe
op
le, th
e e
nvir
on
me
nt a
nd
an
y m
ate
rie
l/e
qu
ipm
en
t in
vo
lve
d.
Cri
teri
a f
or
the
as
se
ss
me
nt
of
lik
elih
oo
d a
nd
co
ns
eq
ue
nc
e in
re
lati
on
to
fie
ldw
ork
Ea
ch
activity is a
sse
sse
d a
cco
rdin
g to
a w
ors
t-ca
se
sce
na
rio
. L
ike
liho
od
an
d c
on
se
qu
en
ce
are
to
be
asse
sse
d s
ep
ara
tely
fo
r e
ach
po
ten
tia
l u
nd
esir
ab
le in
cid
en
t.
Be
fore
sta
rtin
g o
n th
e q
ua
ntifica
tio
n, th
e p
art
icip
an
ts s
ho
uld
ag
ree
wh
at th
ey u
nd
ers
tan
d b
y th
e a
sse
ssm
en
t cri
teri
a:
Lik
elih
oo
d
Co
ns
eq
ue
nc
e
Min
imal
1
Lo
w
2
Med
ium
3
H
igh
4
V
ery
hig
h
5
Once e
very
50 y
ea
rs o
r le
ss
Once e
very
10 y
ea
rs o
r le
ss
Once a
yea
r or
less
Once a
month
or
less
Once a
wee
k
Gra
din
g
H
um
an
E
nvir
on
me
nt
Fin
an
cia
l/m
ate
ria
l
E
Ve
ry c
riti
ca
l M
ay p
rod
uce f
ata
lity
/ie
s
Ve
ry p
rolo
ng
ed
, n
on
-re
ve
rsib
le
da
mag
e
Sh
utd
ow
n o
f w
ork
>1 y
ea
r.
D
Cri
tic
al
Pe
rma
ne
nt in
jury
, m
ay p
rod
uce
se
riou
s s
erio
us h
ea
lth
da
mag
e/s
ickne
ss
Pro
lon
ge
d d
am
ag
e. L
ong
re
co
ve
ry t
ime
. S
hu
tdo
wn
of
wo
rk 0
.5-1
ye
ar.
C
Dan
ge
rou
s
Se
rio
us p
ers
on
al in
jury
M
ino
r d
am
age
. L
on
g r
eco
ve
ry
tim
e
Sh
utd
ow
n o
f w
ork
< 1
mo
nth
B
Rela
tive
ly s
afe
In
jury
th
at
requ
ires m
ed
ical
tre
atm
en
t
Min
or
da
ma
ge
. S
ho
rt r
eco
ve
ry
tim
e
Sh
utd
ow
n o
f w
ork
< 1
we
ek
A
Sa
fe
Inju
ry t
hat
requ
ires f
irst a
id
Insig
nific
an
t da
mag
e.
Sh
ort
re
co
ve
ry t
ime
Sh
utd
ow
n o
f w
ork
< 1
da
y
IX

X
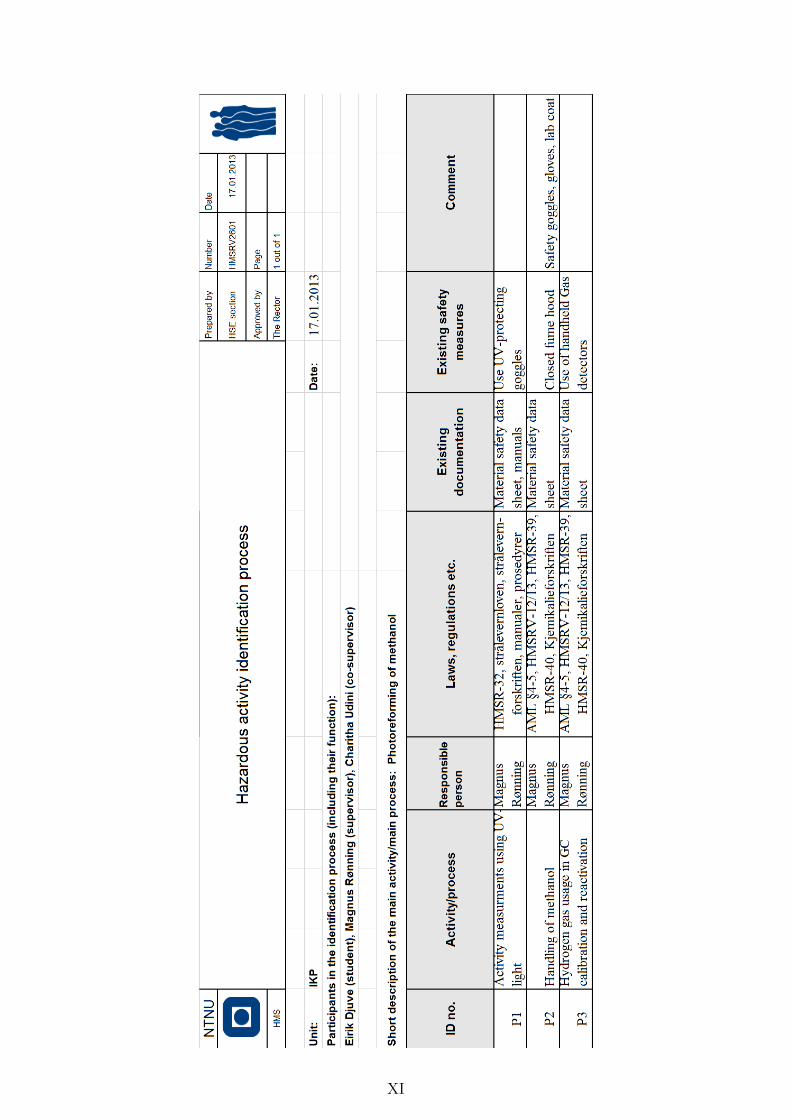
XI
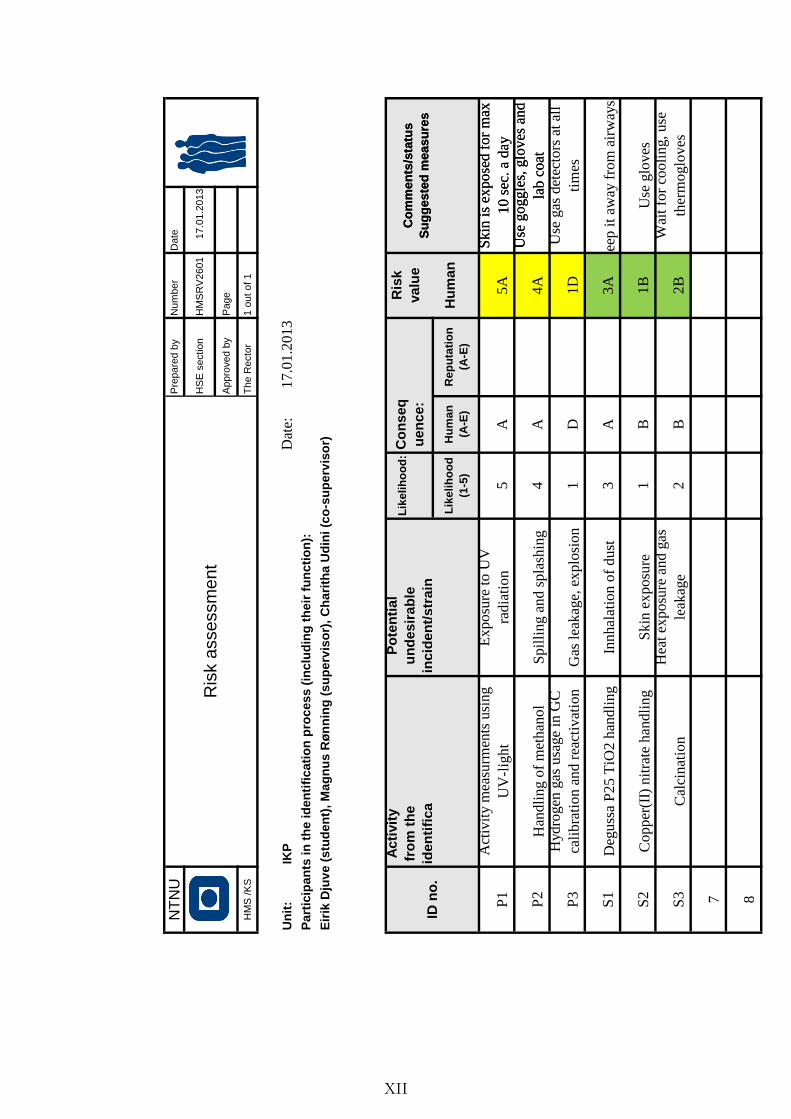
side
1 a
v 2
13.0
6.2
013
NT
NU
Pre
pare
d b
yN
um
ber
Date
HS
E s
ection
HM
SR
V2601
17.0
1.2
013
Appro
ved b
yP
age
HM
S /
KS
The R
ecto
r1 o
ut
of
1
Un
it:
IKP
Dat
e:17.0
1.2
013
Pa
rtic
ipa
nts
in
th
e id
en
tifi
cati
on
pro
ce
ss (
inc
lud
ing
th
eir
fu
nc
tio
n):
Eir
ik D
juv
e (
stu
de
nt)
, M
ag
nu
s R
øn
nin
g (
su
pe
rvis
or)
, C
ha
rith
a U
din
i (c
o-s
up
erv
iso
r)
Ac
tivit
y
fro
m t
he
iden
tifi
ca
Po
ten
tia
l
un
des
ira
ble
incid
en
t/s
tra
in
Lik
eli
ho
od
:C
on
seq
uen
ce:
Lik
eli
ho
od
(1-5
)
Hu
ma
n
(A-E
)
Rep
uta
tio
n
(A-E
)
P1
5A
5A
P2
4A
4A
P3
1D
1D
S1
3A
3A
Use
mas
k o
r kee
p i
t aw
ay f
rom
air
way
s
S2
1B
1B
S3
2B
2B
7 8
Cal
cinat
ion
Ex
posu
re t
o U
V
radia
tion
Spil
ling a
nd s
pla
shin
g
Gas
lea
kag
e, e
xplo
sion
Innhal
atio
n o
f dust
Skin
ex
posu
reH
eat
exposu
re a
nd g
as
leak
age
Ris
k a
ssessm
ent
Act
ivit
y m
easu
rmen
ts u
sing
UV
-lig
ht
Han
dli
ng o
f m
ethan
ol
Hydro
gen
gas
usa
ge
in G
C
cali
bra
tion a
nd r
eact
ivat
ion
Deg
uss
a P
25 T
iO2 h
andli
ng
Copper
(II)
nit
rate
han
dli
ng
Use
glo
ves
Wai
t fo
r co
oli
ng, use
ther
moglo
ves
Co
mm
en
ts/s
tatu
s
Su
gg
este
d m
eas
ure
s
Skin
is
expose
d f
or
max
10 s
ec. a
day
Use
goggle
s, g
loves
and
lab c
oat
Co
mm
en
ts/s
tatu
s
Su
gg
este
d m
eas
ure
s
Skin
is
expose
d f
or
max
10 s
ec. a
day
Use
goggle
s, g
loves
and
lab c
oat
Use
gas
det
ecto
rs a
t al
l
tim
es
Ris
k
va
lue
Hu
ma
n
ID n
o.
XII
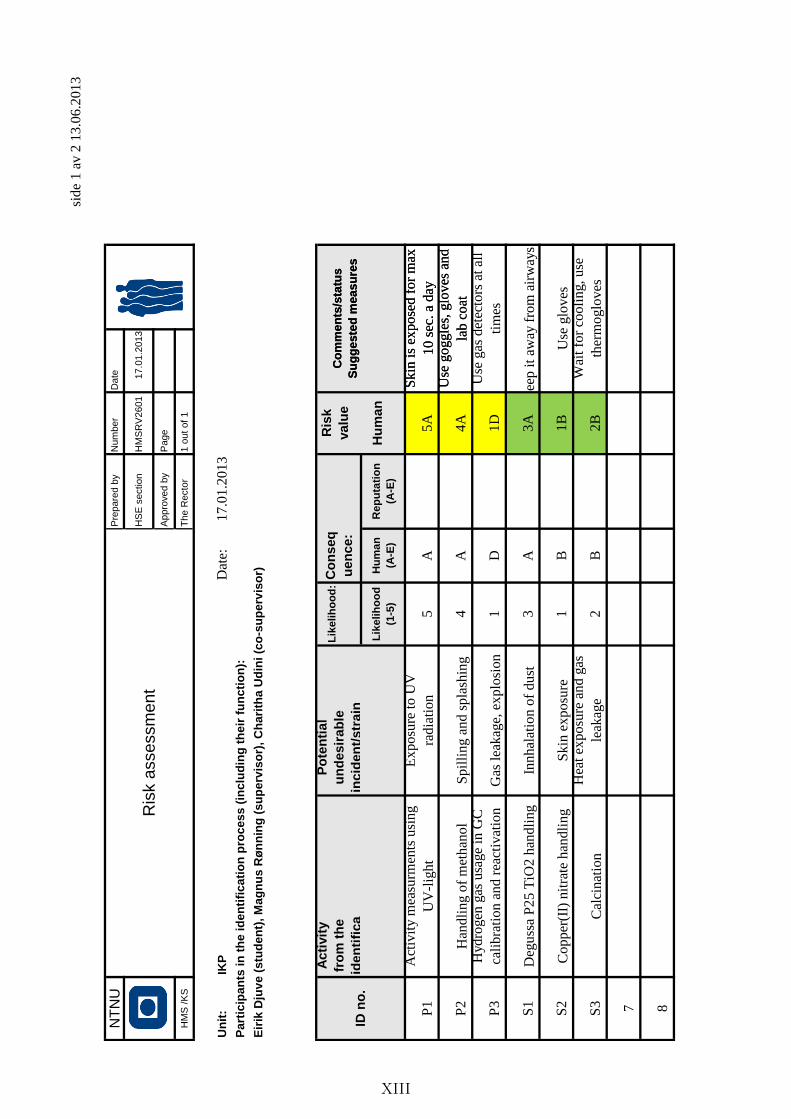
sid
e 1
av
2 1
3.0
6.2
01
3
NT
NU
Pre
pare
d b
yN
um
ber
Date
HS
E s
ectio
nH
MS
RV
2601
17.0
1.2
013
Appro
ved b
yP
age
HM
S /
KS
Th
e R
ecto
r1 o
ut
of
1
Un
it:
IKP
Dat
e:1
7.0
1.2
01
3
Pa
rtic
ipa
nts
in
th
e id
en
tifi
cati
on
pro
ce
ss (
inc
lud
ing
th
eir
fu
nc
tio
n):
Eir
ik D
juv
e (
stu
de
nt)
, M
ag
nu
s R
øn
nin
g (
su
pe
rvis
or)
, C
ha
rith
a U
din
i (c
o-s
up
erv
iso
r)
Acti
vit
y
fro
m t
he
iden
tifi
ca
Po
ten
tial
un
desir
ab
le
incid
en
t/str
ain
Lik
eli
ho
od
:C
on
seq
uen
ce:
Lik
eli
ho
od
(1-5
)
Hu
ma
n
(A-E
)
Rep
uta
tio
n
(A-E
)
P1
5A
5A
P2
4A
4A
P3
1D
1D
S1
3A
3A
Use
mas
k o
r k
eep
it
away
fro
m a
irw
ays
S2
1B
1B
S3
2B
2B
7 8
Cal
cin
atio
n
Ex
po
sure
to
UV
rad
iati
on
Sp
illi
ng a
nd
sp
lash
ing
Gas
lea
kag
e, e
xp
losi
on
Inn
hal
atio
n o
f d
ust
Sk
in e
xp
osu
reH
eat
exp
osu
re a
nd
gas
leak
age
Ris
k a
ssessm
ent
Act
ivit
y m
easu
rmen
ts u
sin
g
UV
-lig
ht
Han
dli
ng o
f m
eth
ano
lH
yd
rogen
gas
usa
ge
in G
C
cali
bra
tio
n a
nd
rea
ctiv
atio
n
Deg
uss
a P
25
TiO
2 h
and
lin
g
Co
pp
er(I
I) n
itra
te h
and
lin
gU
se g
lov
esW
ait
for
coo
lin
g,
use
ther
mo
glo
ves
Co
mm
en
ts/s
tatu
s
Su
gg
este
d m
eas
ure
s
Sk
in i
s ex
po
sed f
or
max
10
sec
. a
day
Use
go
ggle
s, g
lov
es a
nd
lab
co
at
Co
mm
en
ts/s
tatu
s
Su
gg
este
d m
eas
ure
s
Sk
in i
s ex
po
sed f
or
max
10
sec
. a
day
Use
go
ggle
s, g
lov
es a
nd
lab
co
atU
se g
as d
etec
tors
at
all
tim
es
Ris
k
valu
e
Hu
man
ID n
o.
XIII
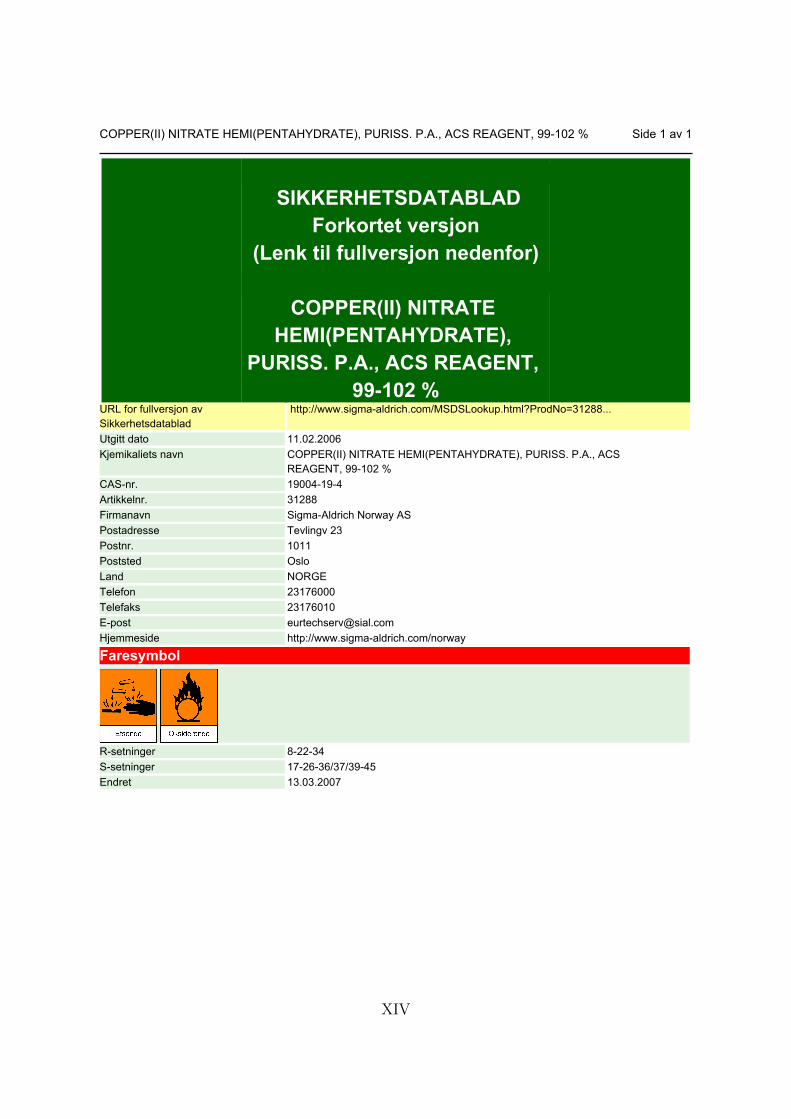
SIKKERHETSDATABLAD
Forkortet versjon(Lenk til fullversjon nedenfor)
COPPER(II) NITRATE HEMI(PENTAHYDRATE),
PURISS. P.A., ACS REAGENT, 99-102 %
URL for fullversjon av Sikkerhetsdatablad
http://www.sigma-aldrich.com/MSDSLookup.html?ProdNo=31288...
Utgitt dato 11.02.2006Kjemikaliets navn COPPER(II) NITRATE HEMI(PENTAHYDRATE), PURISS. P.A., ACS
REAGENT, 99-102 %CAS-nr. 19004-19-4Artikkelnr. 31288Firmanavn Sigma-Aldrich Norway ASPostadresse Tevlingv 23Postnr. 1011Poststed OsloLand NORGETelefon 23176000Telefaks 23176010E-post [email protected] http://www.sigma-aldrich.com/norway
Faresymbol
R-setninger 8-22-34S-setninger 17-26-36/37/39-45Endret 13.03.2007
COPPER(II) NITRATE HEMI(PENTAHYDRATE), PURISS. P.A., ACS REAGENT, 99-102 % Side 1 av 1
XIV
SIKKERHETSDATABLAD
Forkortet versjon(Lenk til fullversjon nedenfor)
Metanol
Seksjon 1: Identifikasjon av stoffet / blandingen og av selskapet / foretaketURL for fullversjon av Sikkerhetsdatablad
http://www.sigma-aldrich.com/MSDSLookup.html?ProdNo=32241...
Opplastet fullversjon av Sikkerhetsdatablad
Metanol.pdf
Utgitt dato 18.05.2006Revisjonsdato 08.02.2013
1.1. ProduktidentifikasjonKjemikaliets navn MetanolSynonymer METHANOL, ANHYDROUS, 99.8 %REACH reg. nr. 01-2119433307-44-XXXXCAS-nr. 67-56-1Indeksnr. 603-001-00-XArtikkelnr. 322415 (Sigma-Aldrich)
1.2. Relevant identifiserte bruksområder for stoffet eller blandingen og bruk det frarådes motKjemikaliets bruksområde Laboratoriekjemikalier, Produksjon av stoffer
1.3. Nærmere opplysninger om leverandøren av sikkerhetsdatabladetFirmanavn Sigma-Aldrich Norway ASPostadresse Tevlingv 23Postnr. 1011Poststed OsloLand NORGETelefon 23176000Telefaks 23176010E-post [email protected] http://www.sigma-aldrich.com/norway
1.4. NødtelefonNødtelefon Giftinformasjonssentralen:22 59 13 00
Seksjon 2: Fareidentifikasjon2.1. Klassifisering av stoff eller blanding2.2. EtikettinformasjonFarepiktogrammer (CLP)
Metanol Side 1 av 5
Revisjonsdato 08.02.2013
XV

Signalord FareFaresetninger H225 Meget brannfarlig væske og damp.
H301 Giftig ved svelging.H311 Giftig ved hudkontakt.H331 Giftig ved innånding.H370 Forårsaker organskader.
Sikkerhetssetninger P210 Holdes vekk fra varme/gnister/åpen flamme/varme overflater. - Røykingforbudt.P260 Ikke innånd støv /røyk/ gass/ tåke/ damp/ aerosoler.P280 Benytt vernehansker/ verneklær.P301 + P310 VED SVELGING: Kontakt umiddelbart et GIFTINFORMASJONSSENTEReller lege.P311 Kontakt et GIFTINFORMASJONSSENTER eller lege.
2.3 Andre farer
Seksjon 3: Sammensetning / opplysning om innholdsstoffer3.2. Blandinger
Seksjon 4: Førstehjelpstiltak4.1. Beskrivelse av førstehjelpstiltakGenerelt Kontakt lege. Vis dette sikkerhetsdatabladet til tilstedeværende lege.Innånding Ved innånding, fjern personen til frisk luft. Hvis den forulykkede ikke puster,
gi kunstig åndedrett. Kontakt lege.Hudkontakt Vask med såpe og mye vann. Pasienten bringes omgående til sykehus.
Kontakt lege.Øyekontakt Skyll grundig med rikelig med vann i minst 15 minutter og kontakt lege.Svelging Fremkall IKKE brekninger. Gi aldri noe gjennom munnen til en bevisstløs
person. Skyll munnen med vann. Kontakt lege.
4.2. Viktigste symptomer og effekter, både akutt og forsinketInformasjon til helsepersonell De viktigste kjente symptomer og virkninger er beskrevet i merking (se avsnitt
2.2), og / eller i avsnitt 11
4.3. Informasjon om umiddelbar legehjelp og spesiell behandling som eventuelt er nødvendig
Seksjon 5: Tiltak ved brannslukning5.1. BrannslukningsmidlerPassende brannslukningsmidler Bruk vannspray, alkoholresistent skum, tørrkjemikalier eller karbondioksid.
5.2. Spesielle farer som stoffet eller blandingen kan medføreBrann- og eksplosjonsfarer Spesielle farer som kommer fra stoffet eller blandingen
Karbonoksider
5.3. Anvisninger for brannmannskaperPersonlig verneutstyr Bruk om nødvendig trykkluftmaske ved brannslukning.Brannslukningsmetoder Vannspray kan brukes for å avkjøle uåpnede beholdere.
Seksjon 6: Tiltak ved utilsiktet utslipp6.1. Personlige forholdsregler, verneutstyr og nødprosedyrerGenerelle tiltak Bruk åndedrettsvern. Unngå innånding av damp, tåke eller gass. Sørg for
skikkelig ventilasjon. Alle tennkilder fjernes. Evakuer personalet til sikkert område. Vis forsiktighet for oppsamling av damper som danner eksplosive
Metanol Side 2 av 5
Revisjonsdato 08.02.2013
XVI

konsentrasjoner. Damper kan samles på lave områder. For personlig beskyttelse, se seksjon 8.
6.2. Sikkerhetstiltak for å beskytte ytre miljøSikkerhetstiltak for å beskytte ytre miljø
Forhindre ytterligere lekkasje eller søl dersom det er forsvarlig. Forhindre utslipp til avløpsystemet.
6.3. Metoder for opprydding og rengjøringMetoder for opprydding og rengjøring
Oppbevar og samle spill med en elektrisk beskyttet støvsuger eller ved våt-børsting og plasser i beholder for avskaffelse i henhold til lokale bestemmelser (se seksjon 13).
6.4. Referanse til andre seksjoner
Seksjon 7: Håndtering og lagring7.1. Forholdsregler for sikker håndteringHåndtering Unngå kontakt med huden og øynene. Unngå innånding av damp eller tåke.
Holdes vekk fra antennelseskilder - Røyking forbudt.Ta forholdsregler for å forhindre oppbygging av elektrostatisk ladning.For forholdsregler se avsnitt 2.2.
7.2. Betingelser for sikker oppbevaring, inklusiv eventuelle uforenligheterOppbevaring Lagre på en kjølig plass. Hold beholderen tett lukket på et tørt og godt
ventilert sted. Åpne beholdere må lukkes med forsiktighet og lagres i oppreist stilling for å hindre lekkasje.
7.3 Spesifikk brukAnbefalinger Bortsett fra bruksområdene nevnt i avsnitt 1.2 er det ikke andre spesifikke
bruksområder foreskrevet
Seksjon 8: Eksponeringskontroll / personlig verneutstyr8.1. Kontrollparametere8.2 Begrensning av eksponering på arbeidsplassenBegrensning av eksponering på arbeidsplassen
Unngå kontakt med hud, øyne og klær. Vask hendene før arbeidspauser og med en gang etter å ha håndtert stoffet.
ÅndedrettsvernÅndedrettsvern Når risikovurdering viser at luftrensende åndedrettsvern er hensiktsmessig,
bruk helmaske, med flerbrukskombinasjonsfilter eller type AXBEK-filter (EN 14387) som støtte til eksterne ventilasjonssystemer. Dersom åndedrettsvern er den eneste beskyttelsen, bruk luftforsynt åndedrettsvern med helmaske. Bruk åndedrettsvern og komponenter som er testet og godkjent etter standarder som NIOSH (US) eller CEN (EU).
HåndvernHåndvern Håndteres med vernehansker. Hansker må inspiseres før bruk. Bruk riktig
teknikk ved fjerning av hansker (uten å berøre hanskens overflate) for å unngå hudkontakt med dette produktet. Kast forurensede hansker etter bruk i henhold til gjeldende lover og god laboratoriepraksis. Vask og tørk hendene.De valgte vernehanskene må tilfredsstille spesifikasjonene til EU Direktiv 89/686/EØF og standarden EN 374 derivert fra direktivet.Full kontakt:Materiale: butylgummiminimum hansketykkelse: 0,3 mmGjennomtrengningstid: 480 minMateriale testet:Butoject® (KCL 897 / Aldrich Z677647, Størrelse M)Sprut:Materiale: Nitrilgummi
Metanol Side 3 av 5
Revisjonsdato 08.02.2013
XVII
minimum hansketykkelse: 0,4 mmGjennomtrengningstid: 31 minMateriale testet:Camatril® (KCL 730 / Aldrich Z677442, Størrelse M)datakilde: KCL GmbH, D-36124 Eichenzell, Telefon +49 (0)6659 87300, e-mail [email protected],testmetode: EN374Dersom de brukes i oppløsningsmidler eller blandes med andre stoffer og under forhold som ikke dekkes av EN 374, ta kontakt med leverandøren til de EF godkjente hanskene. Denne anbefalingen er bare rådgivende, og bør vurderes av ansvarlig kjemiker, som kjenner den forventede bruk. Dette skal ikke oppfattes som en godkjenning av ethvert bruksscenario.
Øye- / ansiktsvernØyevern Ansiktsvern og vernebriller Bruk utstyr for øyebeskyttelse som er testet og
godkjent i henhold til standarder som NIOSH (US) og EN 166 (EU).
HudvernAnnet hudvern enn håndvern Komplett drakt for beskyttelse mot kjemikalier, Flammehemmende antistatisk
kledning, Typen av verneutstyr må velges i henhold til konsentrasjonen og mengden av det farlige stoffet på arbeidsplassen.
Seksjon 9: Fysiske og kjemiske egenskaper9.1. Informasjon om grunnleggende fysiske og kjemiske egenskaperTilstandsform væskeFarge fargeløsLukt påtrengendeSmeltepunkt/smeltepunktintervall Verdi: -98 °CKokepunkt / kokepunktintervall Verdi: 64,7 °CFlammepunkt Verdi: 9,7 °C
9.2 Annen informasjon
Seksjon 10: Stabilitet og reaktivitet10.1. Reaktivitet10.2. Kjemisk stabilitet10.3. Risiko for farlige reaksjoner10.4. Forhold som skal unngås10.5. Materialer som skal unngås10.6 Farlige spaltningsprodukter
Seksjon 11: Toksikologisk informasjon11.1 Informasjon om toxiologiske effekter
Seksjon 12: Miljøopplysninger12.1. Toksisitet12.2. Persistens og nedbrytbarhet12.3. Bioakkumulasjonspotensial12.4. Mobilitet i jord12.5. Resultater av PBT og vPvB vurdering12.6. Andre skadevirkninger
Metanol Side 4 av 5
Revisjonsdato 08.02.2013
XVIII

Seksjon 13: Fjerning av avfall13.1. Metoder for avfallsbehandling
Seksjon 14: Transportinformasjon14.1. UN-nummer14.2. UN varenavn14.3. Transport fareklasse14.4. Emballasjegruppe14.5. Miljøfarer14.6. Spesielle forholdsregler for bruker14.7. Transport i bulk i henhold til vedlegg II til MARPOL 73/78 og IBC-koden
Seksjon 15: Opplysninger om lover og forskrifterFaresymbol
R-setninger R11 Meget brannfarlig.R23/24/25 Giftig ved innånding, hudkontakt og svelging.R39/23/24/25 Giftig: fare for alvorlig varig helseskade ved innånding, hudkontakt og svelging.
15.1. Forskrift / regelverk om stoff eller blanding i forhold til sikkerhet, helse og miljø15.2. Vurdering av kjemikaliesikkerhet
Seksjon 16: Andre opplysningerAnsvarlig for Sikkerhetsdatablad Sigma-Aldrich Norway AS
Metanol Side 5 av 5
Revisjonsdato 08.02.2013
XIX