fortification of pasta with chickpea and quinoa …
TRANSCRIPT

FORTIFICATION OF PASTA WITH CHICKPEA AND QUINOA FLOURS
A Thesis presented to
the Faculty of the Graduate School
at the University of Missouri
In Partial Fulfillment
of the Requirements for the Degree
Master of Science
by
MELISSA SLINKARD
Dr. Andrew D. Clarke, Thesis Supervisor
MAY 2014
The undersigned, appointed by the dean of the Graduate School, have examined the
thesis entitled
FORTIFICATION OF PASTA WITH CHICKPEA AND QUINOA FLOURS
Presented by Melissa Slinkard,
a candidate for the degree of Master of Science,
and hereby certify that, in their opinion, it is worthy of acceptance.
Dr. Andrew D. Clarke, Food Science
Dr. Ingolf Gruen, Food Science
Dr. Fu-hung Hsieh, Biological Engineering

ii
ACKNOWLEDGEMENTS
First of all, I would like to thank my advisor, Dr. Andrew D. Clarke. He tirelessly
provided me teaching, guidance, comments, and direction as I learned my way through
this process. His willingness to take on an engineer to train in food science, gave me a
chance to pursue a field that I have and will continue to truly love. I would also like to
thank my committee members, Dr. Ingolf Gruen and Dr. Fu-hung Hsieh, for their
guidance and assistance. I am grateful for your contributions to my work.
I would like to thank Harold Huff for his guidance in instructing me how to
operate and understand the Texture Analyzer, and Dr. Mark Ellersieck for his assistance
in statistical analysis. Additionally, many thanks go out to JoAnn Lewis and Starsha
Ferguson for their endless administrative assistance throughout my graduate career.
Special thanks to my fellow lab mates, Ayca Gedikoglu, Huisuo Huang, Shuhui
Jia, and Kangzi Ren, for their company and assistance.

iii
TABLE OF CONTENTS
ACKNOWLEDGEMENTS……………………………………………………………….ii
LIST OF FIGURES……………………………………………………………………....vi
LIST OF TABLES…………………………………………………………………….....vii
ABSTRACT…………………………………………………………………………….viii
Chapter
1. INTRODUCTION………………………………………………………………...1
2. LITERATURE REVIEW…………………………………………………………3
2.1 Pasta…………………………………………………………………………...3
2.1.1 Overview………………………………………………………………...3
2.1.2 Durum Wheat……………………………………………………………5
2.1.3 Wheat Protein Complex…………………………………………………7
2.1.4 Nutritional benefits……………………………………………………...9
2.2 Chickpea……………………………………………………………………..10
2.3 Quinoa………………………………………………………………………..13
3. MATERIALS AND METHODS………………………………………………...19
3.1 Pasta preparation……………………………………………………………..19
3.2 Cooking time…………………………………………………………………22
3.3 Cooking loss…………………………………………………………………22
3.4 Texture measurement………………………………………………………...23
3.4.1 Texture profile analysis (TPA)………………………………………...23
3.4.2 Firmness………………………………………………………………..25
iv
3.5 Color measurement…………………………………………………………..25
3.6 Proximate composition………………………………………………………26
3.7 Amino acid analysis………………………………………………………….26
3.8 Consumer acceptance testing………………………………………………...26
3.9 Data analysis…………………………………………………………………27
4. RESULTS AND DISCUSSION…………………………………………………28
4.1 Pasta preparation……………………………………………………………..28
4.2 Cooking time…………………………………………………………………29
4.3 Cooking Loss………………………………………………………………...29
4.4 Texture measurement………………………………………………………...30
4.4.1 Hardness………………………………………………………………..33
4.4.2 Adhesiveness…………………………………………………………...33
4.4.3 Springiness……………………………………………………………..33
4.4.4 Cohesiveness…………………………………………………………...34
4.4.5 Chewiness……………………………………………………………...34
4.4.6 Firmness………………………………………………………………..35
4.5 Color measurement…………………………………………………………..35
4.5.1 Lightness……………………………………………………………….36
4.5.2 Redness………………………………………………………………...36
4.5.3 Yellowness……………………………………………………………..37
4.6 Proximate composition………………………………………………………38
4.6.1 Crude Protein…………………………………………………………..38
4.6.2 Moisture………………………………………………………………..38
v
4.6.3 Crude Fat……………………………………………………………….39
4.6.4 Crude fiber……………………………………………………………..39
4.6.5 Ash……………………………………………………………………..39
4.7 Amino acid analysis………………………………………………………….39
4.8 Consumer acceptance testing………………………………………………...42
5. CONCLUSION…………………………………………………………………..43
REFERENCES………………………………………………………………………46

vi
LIST OF FIGURES
Figure Page
2.1 Diagram of wheat kernel (Hill 2012).……………………………………………..6
2.2 Illustration of gliadin and glutenin protein structures (left) Scan electron
micrograph of structural interaction of proteins (right) (Fasano 2011)…………...8
2.3 Graph of global chickpea production from 1980-2012 (FAOSTAT 2014)……...12
2.4 Graph of global quinoa production from 1980-2012 (FAOSTAT 2014)……......17
3.1 Pasta preparation……………………………………………................................21
3.2 Texture profile analysis of pasta perpendicular and parallel to grooves………...24
3.3 Typical texture profile analysis curve (Dhanasettakorn 2008)…………………..24
3.4 Firmness test on pasta noodles…………………………………………………...25
4.1 Prepared pasta samples…………………………………………………………..28

vii
LIST OF TABLES
Table Page
2.1 Nutritional comparison of semolina and bread wheat flour (USDA 2013)…...…..6
2.2 Proximate analysis of raw chickpea seeds (USDA 2013)……………………….11
2.3 Mineral content of raw chickpea seeds (USDA 2013)……………….………….11
2.4 Amino acid content of raw chickpea seeds (USDA 2013)………………...…….11
2.5 Proximate analysis of raw quinoa (USDA 2013)………………………………..16
2.6 Mineral content of raw quinoa (USDA 2013)……………….…………….…….16
2.7 Amino acid content of raw quinoa (USDA 2013)………………...……………..16
3.1 Pasta formulations……………………………………………………………….19
4.1 Cooking loss of cooked pasta noodles, as percent of original weight………...…30
4.2 Texture profile and firmness of cooked pasta noodles…………………………..32
4.3 Color values of cooked pasta noodles…………………………………………...36
4.4 Proximate composition of dry pasta noodles……………………………………38
4.5 Amino acid profile of dry pasta noodles………………………………………....40
4.6 Results from consumer acceptance test……………………………………….…42
viii
FORTIFICATION OF PASTA WITH CHICKPEA AND QUINOA FLOURS
Melissa Slinkard
Dr. Andrew D. Clarke, Thesis Supervisor
ABSTRACT
Pasta was fortified with 30% chickpea and quinoa flours (5:25, 10:20, 15:15,
20:10, and 25:5 CQ) and evaluated against a control made of 100% semolina flour
(CTRL) for cooking quality, texture, color, proximate and amino acid analysis, and
consumer acceptance. Pasta products containing chickpea and quinoa flours had a
decreased cooking time than CTRL. Cooking loss of fortified pastas was significantly
(p<0.05) greater than the CTRL, but were within the acceptable range of 7-8% (Dick and
Youngs 1988). Hardness and adhesiveness of the pasta noodles increased as the
percentage of quinoa fortification increased. Adhesiveness and springiness were not
significantly (p>0.05) affected by fortification, and cohesiveness was moderately
affected. Firmness of pasta products made with chickpea and quinoa flours was less than
that of CTRL. Pasta 20:10 CQ was found to have the lowest firmness, as well as having
the least acceptability in sensory testing. Pasta was darker and more brown in color (L*
and b* values decreased while a* values increased) with the increased addition of quinoa
flour. Chickpea flour supplementation was found to increase protein, fat, fiber, ash, and
amino acid content of pasta, while quinoa flour had adverse effects on protein content
and amino acid profile when compared to CTRL. The untrained consumer panel (n=102)
significantly (p<0.05) preferred the CTRL pasta over those fortified with chickpea and
quinoa flours. All pasta variations were deemed acceptable in sensory study. Pasta 25:5
ix
CQ had the highest protein content and best amino acid profile while maintaining the
most overall acceptable color, texture, and sensory scores in comparison with CTRL.

1
CHAPTER 1
INTRODUCTION
Pasta is a popular food in many cultures, and its simple ingredient list and ease of
preparation make it a quick food option for people around the globe. As a wheat-derived
staple food with a very long shelf life, it is second only to bread in world consumption
(Mariani-Constantini 1988, Madhumitha 2011). The highest quality pasta is made solely
from durum wheat semolina flour. This creates a product that has great rheological
properties, cooking quality, and high consumer acceptance (Dexter and Matsuo 1979).
Semolina flour, however, has a limited nutritional profile and is lacking in the amino
acids lysine and threonine (Kies and Fox 1970, Abdel-Aal and Hucl 2002, Zhao and
others 2005).
High protein diets are presently very popular and highly acceptable among health
conscious consumers trying to watch their calorie intake, increase satiety, and lose
weight. Quinoa and chickpeas are two foods that have been gaining a lot of recognition in
the market for their high quality nutritional profile. Chickpeas are legumes that contain a
large quantity of high quality protein, along with a good balance of amino acids (Sabanis
and others 2006). Quinoa, a pseudo-cereal, is rich in histidine and lysine, amino acids
that traditional semolina flour lack (Mastromatteo and others 2011). Both of these
foodstuffs can be milled and used to replace or fortify typical durum wheat flour.
Fortification of foods has been used by the food industry for years and continues
to be beneficial in providing consumers with added nutrition. The World Health
Organization (WHO) and the United States Food and Drug Administration (FDA)
consider pasta to be a good product for nutritional improvement due to its low levels of
2
protein and fiber (Marconi and Carcea 2001). In 1949, the FDA made pasta one of the
first foods to permit vitamin and iron enrichment allowing pasta manufacturers the ability
to fortify their products with added nourishment (FDA 1999). Legume and pseudo-cereal
flours are a new frontier that many companies are turning to for added fortification.
Much research has been done on fortifying and supplementing pasta with different
combinations of non-traditional flours, such as green pea, yellow pea, chickpea, and lentil
flours (Zhao and others 2005), amaranth flour (Chillo and others 2008a), split pea and
faba bean flours (Petitot and others 2010a), and quinoa, oat, and broad bean flours
(Mastromatteo and others 2012). Studies have also been done on the effects of adding
solely chickpea flour (Wood 2009) and quinoa flour (Lorenz and others 1993) to pasta;
however, no studies have been identified using both chickpea and quinoa flour to fortify
semolina pasta.
The objective of this research is to formulate a pasta product with increased levels
of protein and an improved amino acid profile by adding chickpea and quinoa flours to
traditional durum wheat semolina. The effects of fortification on texture, color, cooking
quality, and consumer acceptance are to be analyzed, and the most desirable ratio of
quinoa and chickpea flours is to be determined. It is postulated that the high levels of
methionine and cysteine found in quinoa flour will balance out the lack of sulfur-
containing amino acids in chickpea flour, while both would increase the amount of
protein and lysine found in typical durum wheat pasta. The most desirable ratio is
expected to be either 10:20, 15:15, or 20:10 CQ where the deficient amino acids are all
increased without negatively affecting quality.

3
CHAPTER 2
LITERATURE REVIEW
2.1 Pasta
2.1.1 Overview
Due to its low price, ease of preparation, stable shelf life, and overall versatility,
pasta is consumed by many people worldwide. Having originated in Asia and the
Mediterranean, Italy is still most well-known for its pasta making and leads in national
consumer consumption per capita (International Pasta Organization 2011). Setting a
standard in innovation, Italian pasta makers formed trade associations by the 16th century.
These organizations regulated the industry by requiring things such as special license to
produce pasta made from anything other than durum wheat (Kill 2001a). This highly
regulated nation has set the benchmark for quality and preparation everywhere.
The versatility of pasta allows it to be formed into almost any shape and size. It
comes in varieties such as spaghetti, fettuccine, macaroni, rotini, and farfalle. It can even
be stuffed with meats or cheeses to make ravioli. Pasta is prepared in two styles, fresh or
dried. Fresh pasta eliminates the drying step and allows for a much quicker product to be
made, but has only a portion of the shelf life of dried pasta.
According to R. C. Kill (2001a), creating good quality pasta relies on three crucial
factors: raw material, mixing and production, and drying. Since basic pasta is made
using flour and water, the use of quality flour is essential, hence, the strong preference to
durum wheat. Another common variation of pasta is egg noodles. Adding egg increases
nutritional value, changes mouth-feel, and makes for a stronger noodle (Kill 2001b).
Another frequent practice in pasta making is altering the color from its traditional yellow
4
to red or green. This is done by adding powdered spinach or tomato to the flour before
hydrating (Kill 2001b).
The mixing process in pasta making is essential for protein binding and gluten
matrix formation. In this step, water is added to the dry ingredients to achieve a dough
with moisture content of 30-32% (Dintheer 2001). There are three approaches to forming
and extruding the pasta dough. The approach used most often at-home and in small scale
pasta production utilizes a batch mixer and hand-held extruder. In this process, the dough
is formed by hand or in a small mixer, and then run through the extruder. A semi-
continuous approach requires first mixing the flour and water into a crumbly dough mass
before being homogenized by screw presses and then extruded (Dintheer 2001). The last
approach, most often utilized by industrial pasta manufacturers, is continuous
mixing/kneading where flour and water are added directly to the twin-screw extruder and
homogenized right before being extruded (Dintheer 2001). The temperature, moisture
content, and pressure are all important parameters of pasta production and have a direct
effect on pasta quality (Dintheer 2001). In commercial pasta production, these
parameters have been carefully established and are closely monitored.
The third critical aspect of creating quality pasta is drying. Studies have shown
that the drying of pasta is very important to the structure and stability of pasta, and when
dried, the moisture content is similar to that of the original material (Kill 2001a). It is
important to note that although the pasta drying process is important to pasta quality, it is
not the focus of this research and will not be further discussed.

5
2.1.2 Durum Wheat
For centuries, durum wheat has been the preferred flour source for both
commercial and at-home pasta making. Typical bread wheat, or common wheat, lacks the
hardness, gluten quality, and yellow color that durum wheat boasts for excellent pasta
products (Kill 2001a). Both durum wheat, or Triticum durum, and common wheat, or
Triticum aestivum, are members of the genus Triticum, home to all wild and cultivated
wheat (Wiseman 2001). These wheat are cereals and a part of the large grass family,
Gramineae [Poaceae]. Durum wheat is rarer than common wheat, and can be grown in
only certain parts of the world (Kill 2001a). While common wheat can adapt to a wide
range of environments, durum wheat thrives in semi-arid climates, having 55-60% of its
crops grown in the Mediterranean region (Kill 2001a, Wiseman 2001). Common wheat is
easily milled and has a starchy, floury endosperm, making it ideal for use in breads
(Wiseman 2001). Durum wheat, on the other hand, has a particularly hard endosperm,
resulting in a coarse yellow milled product containing very few fine flour particles
(Wiseman 2001). This milled product is called semolina.
Wheat kernels are made up of three main parts: the bran, endosperm, and germ.
The bran is the outer coating of the wheat kernel and protects the endosperm and germ. It
makes up approximately 13% of the kernel. The germ is the smallest part of the kernel,
comprising only about 3% of its weight. It is home to the developing plant or embryo.
The starchy endosperm is the storage site of food for the plant and home to most of its
proteins. It is the largest component of the wheat kernel, making up approximately 82%
of its weight (Orth and Shellenberger 1988). Figure 2.1 illustrates the different parts of
the wheat kernel.

6
Milling is the multi-step process where the wheat kernel is broken up and the
endosperm is separated from the bran and germ, resulting in wheat flour. Semolina flour
has an amber color compared to common flour because of the carotenoid pigments in the
endosperm (Donnelly 1991). Table 2.1 shows the nutritional values of semolina flour and
bread wheat flour.
Semolina Bread Wheat
(Value per 100g)
Water 12.67 g 13.36 g
Energy 360 kcal 361 kcal
Protein 12.68 g 11.98 g
Total lipid (fat) 1.05 g 1.66 g
Ash 0.77 g 0.47 g
Carbohydrates* 72.83 g 72.53 g
Figure 2.1 Diagram of wheat kernel (Hill 2012)
Table 2.1 Nutritional comparison of semolina and
bread wheat flour (USDA 2013)

7
Minerals
Semolina Bread Wheat
(Value per 100g)
Calcium, Ca 17 mg 15 mg
Iron, Fe 1.23 mg 0.9 mg
Magnesium, Mg 47 mg 25 mg
Phosphorus, P 136 mg 97 mg
Potassium, K 186 mg 100 mg
Sodium, Na 1 mg 2 mg
Zinc, Zn 1.05 mg 0.85 mg
2.1.3 Wheat Protein Complex
The two key components in pasta manufacturing are the gluten proteins and starch
(Johnston 2001). Wheat consists of both soluble and insoluble protein fractions. Albumin
and globulin are soluble proteins and are found mostly in the germ and bran of the kernel.
The insoluble protein fractions, gliadin and glutenin, are found in the endosperm and
make up approximately 85-90% of the protein fractions (Swanson 2007). Together,
gliadins and glutenins form gluten. This protein complex “described as a cohesive, elastic
and extensible fibrillar network covered with a protein membrane” (Swanson 2007) is
responsible for maintaining the structure of wheat products, such as bread and pasta.
Gliadins are necessary for the elasticity of gluten. They are single-chained
molecules distinguished by their intramolecular disulfide bonding which form compact
globular molecules. Glutenins are responsible for providing strength and cohesion of the
wheat gluten complex. They are characterized by intermolecular disulfide bonding
making them large, multi-chained molecules, containing many exposed functional groups
(Swanson 2007).
Table 2.1 (continued) Nutritional comparison of
semolina and bread wheat flour (USDA 2013)
*found by difference

8
In the pasta making process, water is added to flour, hydrating the grains and
forming hydrogen bonds between the water and protein molecules. This hydration
combined with mechanical manipulation (or kneading), causes the gliadin and glutenin
proteins to unfold and align, forming gluten (Swanson 2007). The gliadin and glutenin
protein structures can be seen in Figure 2.2.
Protein content and quality of flour are both important factors in gluten formation.
The greater amount of protein present, the stronger the gluten structure will be formed.
However, if pasta contains too high a protein content, particularly gliadin and glutenin,
then the yielded product is reported to stretch too much during extrusion (Dick and
Matsuo 1988). Donnelly (1991) determined that flour with a minimum of 11% protein is
needed to produce a good quality pasta. Durum wheat falls in the medium protein range
with that which is commercially available containing 9-18% protein.
The protein matrix is crucial to the formation of pasta. If it is disrupted by other
additives, it will negatively affect cooking quality leading to a decreased optimum
Figure 2.2 Illustration of gliadin and glutenin protein structures (left) Scanning electron
microscope image of structural interaction of proteins (right) (Fasano 2011)
9
cooking time (Chillo and others 2007, Chillo and others 2008b) and a higher cooking loss
(Ugarcic-Hardi and others 2003, Sabanis and others 2006). Gluten “contributes to the
development of a strong protein network that prevents the dissolution of pasta during
cooking” (Marconi and Carcea 2001). When pasta is cooked, an insoluble network of
proteins is formed that entraps swollen and gelatinized starch granules (Smewing 1997).
If less protein surrounds the starch granules, they swell and gelatinize faster, lowering the
cooking time (Grzybowski and Donnelly 1977). If this network is weakened by too great
of an addition, then the integrity of the pasta is compromised and the structure is
weakened. Sabanis and others (2006) and Wood (2009) found that substituting non-
gluten containing flours for greater than 30% of wheat flour negatively affected the
protein matrix, creating pasta products that were difficult to extrude and overall
unacceptable.
2.1.4 Nutritional benefits
On its own, the nutritional content of pasta is similar to that of semolina flour. In a
review by Douglass and Matthews (1982), researchers compared the nutrient content of
semolina flour and macaroni as a percent concentration of durum wheat, and found that
the greatest change in nutritional content from processing occurs when durum wheat is
milled into semolina flour. From this study, it can be seen that the processing of pasta
does not adversely affect the nutritional content of semolina flour, but rather, pasta
products remain closely similar to that of the flour used. Compared to durum wheat, the
semolina and macaroni tested maintained most of the original protein, but lost almost
50% of both fat and ash (Douglass and Matthews 1982). Since semolina flour is limited
in amino acids, such as lysine and threonine (Kies and Fox 1970, Abdel-Aal and Hucl
10
2002, Zhao and others 2005), it is understood that pasta is also deficient in these
compounds.
Although pasta contains some nutritional content, it is rarely eaten on its own due
to its simple lack of flavor. This is why it is typically used as a base to meals and served
with sauces or other toppings.
2.2 Chickpea
Chickpeas, or cicer arietinum, are part of the Cicer genus, and are to have
originated in southeastern Turkey (Maiti 2001). The Cicer genus is a member of the
Fabaceae family, home to beans, peas, and other grain legumes that are also referred to
as pulses (Singh 2001). Chickpeas are consumed worldwide and are known under other
common names such as gram in India and garbanzo in Latin America (Maiti 2001).
Although they are commonly known for their high protein content (20.9-25.27%), their
nutritional profile also boasts low lipid content comparable to cereals, and a high
availability of iron and calcium (Dhawan and others 1991, Wesche-Ebeling and others
2001). Similarly to other pulse proteins, chickpeas have high amounts of lysine, but are
limited in sulfur-containing amino acids such as methionine and cysteine (Dhawan and
others 1991, Maiti 2001). This can be contributed to the high amounts of glutelins and
globulins that are the major storage protein in the endosperm, making up about 53-60%
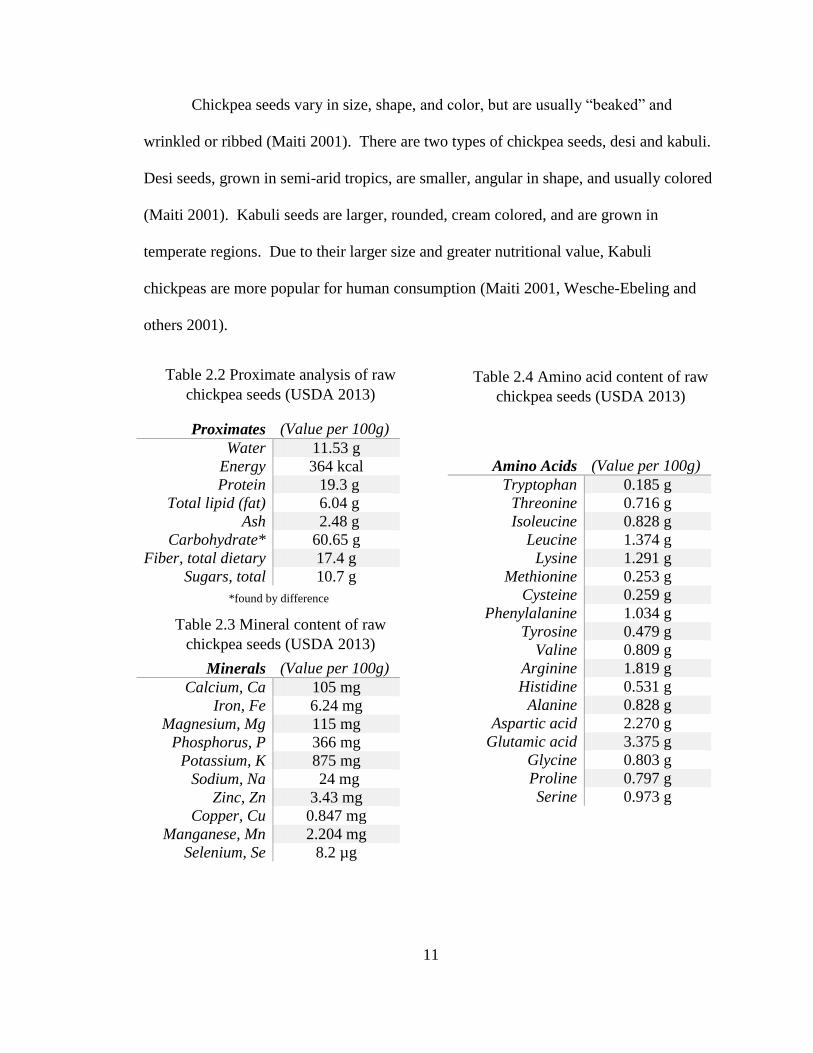
(Dhawan and others 1991). The proximate analysis, mineral, and amino acid content of
raw chickpea seeds can be seen in Tables 2.2 - 2.4. Chickpea seeds have many culinary
uses and can be dried, canned, or milled into flour. A common form of consuming
chickpeas is mashed and mixed with spices and oils in the Middle Eastern dish, hummus.
11
Chickpea seeds vary in size, shape, and color, but are usually “beaked” and
wrinkled or ribbed (Maiti 2001). There are two types of chickpea seeds, desi and kabuli.
Desi seeds, grown in semi-arid tropics, are smaller, angular in shape, and usually colored
(Maiti 2001). Kabuli seeds are larger, rounded, cream colored, and are grown in
temperate regions. Due to their larger size and greater nutritional value, Kabuli
chickpeas are more popular for human consumption (Maiti 2001, Wesche-Ebeling and
others 2001).
Proximates (Value per 100g)
Water 11.53 g
Energy 364 kcal
Protein 19.3 g
Total lipid (fat) 6.04 g
Ash 2.48 g
Carbohydrate* 60.65 g
Fiber, total dietary 17.4 g
Sugars, total 10.7 g
Minerals (Value per 100g)
Calcium, Ca 105 mg
Iron, Fe 6.24 mg
Magnesium, Mg 115 mg
Phosphorus, P 366 mg
Potassium, K 875 mg
Sodium, Na 24 mg
Zinc, Zn 3.43 mg
Copper, Cu 0.847 mg
Manganese, Mn 2.204 mg
Selenium, Se 8.2 µg
Amino Acids (Value per 100g)
Tryptophan 0.185 g
Threonine 0.716 g
Isoleucine 0.828 g
Leucine 1.374 g
Lysine 1.291 g
Methionine 0.253 g
Cysteine 0.259 g
Phenylalanine 1.034 g
Tyrosine 0.479 g
Valine 0.809 g
Arginine 1.819 g
Histidine 0.531 g
Alanine 0.828 g
Aspartic acid 2.270 g
Glutamic acid 3.375 g
Glycine 0.803 g
Proline 0.797 g
Serine 0.973 g
Table 2.2 Proximate analysis of raw
chickpea seeds (USDA 2013)
Table 2.3 Mineral content of raw
chickpea seeds (USDA 2013)
Table 2.4 Amino acid content of raw
chickpea seeds (USDA 2013)
*found by difference

12
Chickpea flour is produced when chickpeas undergo a milling process. In this
process, chickpeas are cleaned and graded (normally by size) before the hull is removed
from the endosperm through stages of soaking and mechanical action (Wesche-Ebeling
and others 2001). For desi chickpeas, the hull makes up 12-15% of the seed weight,
resulting in a maximum flour yield of 85% (Wesche-Ebeling and others 2001). After
being dehulled, the chickpea seeds are milled to flour and roasted.
Over the past five years, the major producers of chickpeas have been India,
Australia, Turkey, Pakistan, and Myanmar (FAOSTAT 2014). In 2009, the world saw a
large increase in chickpea production, producing over 10 million metric tons of product
(FAOSTAT 2014). In recent years, the amount produced has remained above the
historical average. Figure 2.3 shows the increase in chickpea production from 1980-2012.
4,000,000
5,000,000
6,000,000
7,000,000
8,000,000
9,000,000
10,000,000
11,000,000
12,000,000
Chickpea Production (in tonnes)
Figure 2.3 Graph of global chickpea production from 1980-2012 (FAOSTAT 2014)

13
Studies have shown that smaller chickpea seeds contain a higher content of
essential amino acids (Wesche-Ebeling and others 2001). Singh (2001) reported that
supplementing cereals with high protein legumes, such as chickpeas, was “one of the best
solutions to the protein-calorie malnutrition, particularly in developing countries.” When
combined with cereals, chickpeas have an increased digestibility of proteins (Wesche-
Ebeling and others 2001). Adding 25% chickpea flour to pasta is also known to
significantly lower the glycemic index of wheat pasta (Goni and Valentin-Gamazo 2003).
In 2009, Wood studied pasta fortified with varying amounts of chickpea flour (0-
30%) and found that increasing the amount of chickpea flour significantly (p<0.05)
decreased water absorption leading to less stable dough. Wood (2009) also concluded
that pasta cannot be fortified with over 30% chickpea flour due to the weakening of the
gluten matrix, and that chickpea flour increased all amino acids except for cysteine and
methionine (no significant change) and glutamine/glutamic acid and proline (significantly
decreased).
2.3 Quinoa
Quinoa, or chenopodium quinoa, is a member of the Amaranthaceae plant family.
Although it is a flowering plant, quinoa’s grass-like uses and qualities cause it to be
considered a pseudo-cereal. This ancient grain originated in the Andean region of South
America where it was prevalently grown and consumed by the Inca Empire (Fleming and
Galwey 1995). When the Spanish conquest entered the region, however, they replaced
the crops with their European species of wheat and barley, leading to a severe decline in
quinoa production (Fleming and Galwey 1995). It was not until the 1970’s that the
14
indigenous crop began to receive attention from outside nations and researchers (Fleming
and Galwey 1995).
Quinoa grains are disc-shaped and range from 1-3 millimeters in diameter. They
come in various colors, such as white, yellow, orange, pink, red, brown, grey, and black
(Fleming and Galwey 1995). The pericarp, or outer coating, of quinoa contains saponins,
which are anti-nutritional compounds that give off a bitter flavor. Rinsing quinoa prior to
use helps rid the grain of these compounds.
Quinoa grains can be used for many things. They can be toasted, ground into
flour, boiled and added to soup, or cooked and served similar to rice. Quinoa flour can be
used to make pasta or breads. Unlike cereals, quinoa has a soft outer layer that does not
need to be removed before milling. This allows quinoa to yield roughly 100% flour
(Fleming and Galwey 1995). After being rinsed of saponins, quinoa is usually dried
before being ground into fine particles.
In 2011, the United Nations declared 2013 the International Year of Quinoa to
recognize the indigenous people’s preservation of the grain and to increase world
knowledge of its nutritional, economic, environmental, and cultural properties (United
Nations 2011). The aim of their initiative was to focus world attention on the role it can
play in decreasing poverty and providing food security (United Nations 2011).
One attributing factor to the increased popularity of quinoa is its adaptability to
various growing conditions. Quinoa grows well in poor environmental conditions, harsh
climates, and is rarely affected by droughts and flooding (Fleming and Galwey 1995).
Quinoa plants are classified into five different types based on their ecological adaptation
zone and region. Valley quinoa is irrigated and grown in the Andean valleys, while

15
altiplano quinoa is grown in temperate conditions with low precipitation (Fleming and
Galwey 1995, FAO 2013). Saltflat (or salar) quinoa is adapted to desert climates, while
sea level quinoa is produced in humid conditions with regulated temperature, and
subtropical quinoa is adapted to high precipitation and heat (Fleming and Galwey 1995,
FAO 2013).
Studies have shown that quinoa is a good source of quality protein (10.4-17.0%),
dietary fiber, polyunsaturated fats, and minerals (FAO 2013). At 6.3%, it contains more
fat than most grains and legumes, but over half of that comes from polyunsaturated fats,
which are essential to the body (FAO 2013). These fats are shown to maintain their
quality due to the prevalence of vitamin E, a natural antioxidant (Su-Chuen and others
2007). The nutritional profile of raw chickpea seeds can be seen in Tables 2.5 – 2.7.
Although quinoa has a high amount of protein, it is the quality of protein that is
most notable. Quinoa boasts an excellent amino acid balance comparable to that of
casein protein in milk or skim milk powder (Fleming and Galwey 1995). It is rich in
lysine and sulfur-containing amino acids that most grains lack, making it a good
complement to wheat products (Lorenz and others 1993). The content and composition of
quinoa protein depends largely on the variety and growing conditions (Fleming and
Galwey 1995). It has been found to contain between 10-21% protein, with most products
averaging around 13% (Fleming and Galwey 1995, Regional Office for Latin America
and the Caribbean 2011). Since quinoa is gluten-free, most of the protein fractions
contained are albumins and globulins, making up 44-77% (Jancurova and others 2009).
These proteins are rich in lysine, which most grains lack (Fleming and Galwey 1995).

16
Others have noted that quinoa is also beneficial when paired with legumes such as
chickpeas, due to their lack of methionine and cysteine (Jancurova and others 2009).
Quinoa has a relatively large amount of highly-available iron, making it a good
source of the nutrient for the human diet (Allred and others 1976, Valencia and others
1999). Quinoa is also a rich source of magnesium (Vitali and others 2010), zinc, and the
B-vitamins, riboflavin and folic acid (FAO 2013).
Proximates (Value per 100g)
Water 13.28 g
Energy 368 kcal
Protein 14.12 g
Total lipid (fat) 6.07 g
Ash 2.38 g
Carbohydrate* 64.16 g
Fiber, total dietary 7.0 g
Starch 52.22 g
Minerals (Value per 100g)
Calcium, Ca 47 mg
Iron, Fe 4.57 mg
Magnesium, Mg 197 mg
Phosphorus, P 457 mg
Potassium, K 563 mg
Sodium, Na 5 mg
Zinc, Zn 3.1 mg
Copper, Cu 0.59 mg
Manganese, Mn 2.03 mg
Selenium, Se 8.5 µg
Amino Acids (Value per 100g)
Tryptophan 0.167 g
Threonine 0.421 g
Isoleucine 0.504 g
Leucine 0.840 g
Lysine 0.766 g
Methionine 0.309 g
Cysteine 0.203 g
Phenylalanine 0.593 g
Tyrosine 0.267 g
Valine 0.594 g
Arginine 1.091 g
Histidine 0.407 g
Alanine 0.588 g
Aspartic acid 1.134 g
Glutamic acid 1.865 g
Glycine 0.694 g
Proline 0.773 g
Serine 0.567 g
The main countries producing quinoa are Peru and Bolivia, accounting for more
than 90% of the world’s production (FAOSTAT 2014). With its gained popularity, crop
production doubled in Bolivia and almost tripled in Peru and Ecuador from 1992-2010
Table 2.5 Proximate analysis of raw
quinoa (USDA 2013)
Table 2.6 Mineral content of raw
quinoa (USDA 2013)
Table 2.7 Amino acid content of raw
quinoa (USDA 2013)
*found by difference
17
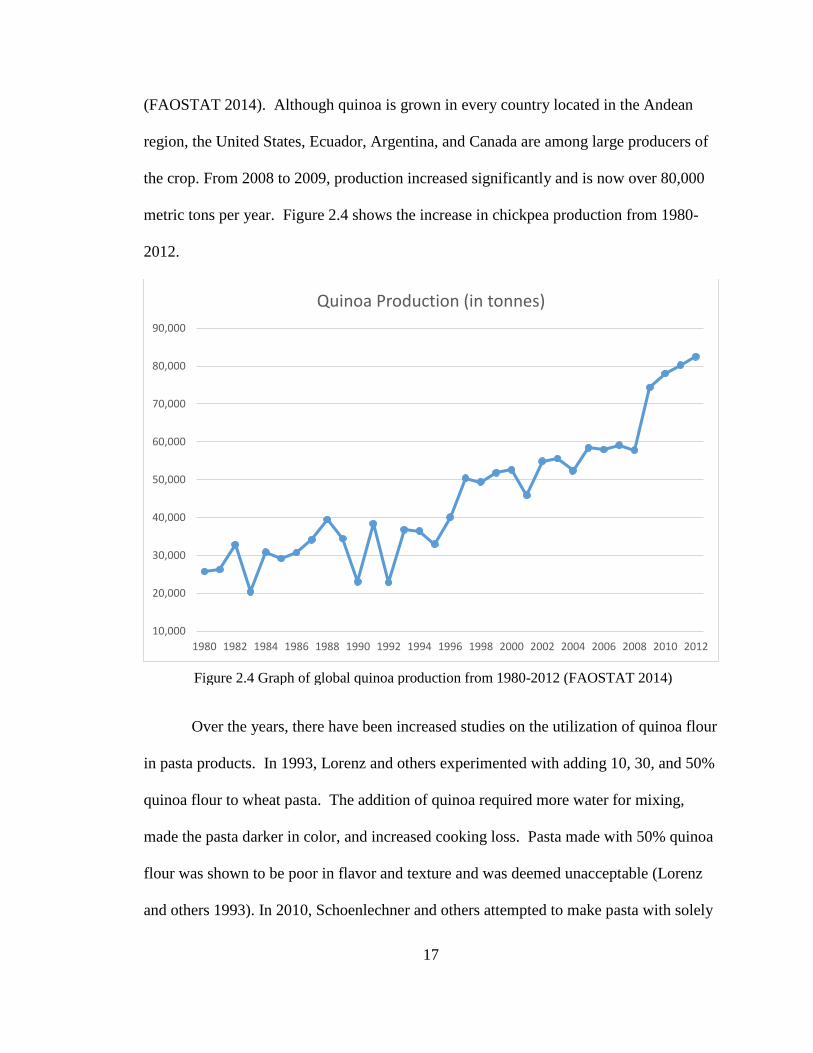
(FAOSTAT 2014). Although quinoa is grown in every country located in the Andean
region, the United States, Ecuador, Argentina, and Canada are among large producers of
the crop. From 2008 to 2009, production increased significantly and is now over 80,000
metric tons per year. Figure 2.4 shows the increase in chickpea production from 1980-
2012.
Over the years, there have been increased studies on the utilization of quinoa flour
in pasta products. In 1993, Lorenz and others experimented with adding 10, 30, and 50%
quinoa flour to wheat pasta. The addition of quinoa required more water for mixing,
made the pasta darker in color, and increased cooking loss. Pasta made with 50% quinoa
flour was shown to be poor in flavor and texture and was deemed unacceptable (Lorenz
and others 1993). In 2010, Schoenlechner and others attempted to make pasta with solely
10,000
20,000
30,000
40,000
50,000
60,000
70,000
80,000
90,000
1980 1982 1984 1986 1988 1990 1992 1994 1996 1998 2000 2002 2004 2006 2008 2010 2012
Quinoa Production (in tonnes)
Figure 2.4 Graph of global quinoa production from 1980-2012 (FAOSTAT 2014)

18
quinoa flour and egg and found that it, too, was unacceptable due to high cooking loss.
Due to its lack of gluten-forming proteins, others have attempted to make gluten-free
pasta with quinoa and other non-traditional flours, such as amaranth and broad bean
(Chillo and others 2008a), soy and maize (Mastromatteo and others 2011), and oat and
chickpea (Mastromatteo and others 2012).
19
CHAPTER 3
MATERIALS AND METHODS
3.1 Pasta preparation
Samples of semolina (Lot 255504), chickpea (Lot 313160GFGRBZFL), and
quinoa (Lot 313160GFOQNAFL) flours were received from ConAgra Mills (Omaha,
NE), kept in original packaging, and stored in air-tight containers until use. Pasta
samples were produced by hand in a homemade style. The control sample (CTRL) was
made of 100% semolina flour, while five different variations were made by replacing
30% semolina flour with different ratios of chickpea and quinoa flours. The ratios
consisted of 5% chickpea flour and 25% quinoa flour (5:25 CQ), 10% chickpea flour and
20% quinoa flour (10:20 CQ), 15% each chickpea and quinoa flours (15:15 CQ), 20%
chickpea flour and 10% quinoa flour (20:10 CQ), and 25% chickpea flour and 5% quinoa
flour (25:5 CQ). The pasta formulations are shown in Table 3.1.
Formula
Semolina
flour (g)
Chickpea
flour (g)
Quinoa
flour (g)
Water (mL)
5:25 CQ 63.0 4.5 22.5 40.0
10:20 CQ 63.0 9.0 18.0 40.0
15:15 CQ 63.0 13.5 13.5 40.0
20:10 CQ 63.0 18.0 9.0 40.0
25:5 CQ 63.0 22.5 4.5 40.0
CTRL 90.0 0.0 0.0 40.0
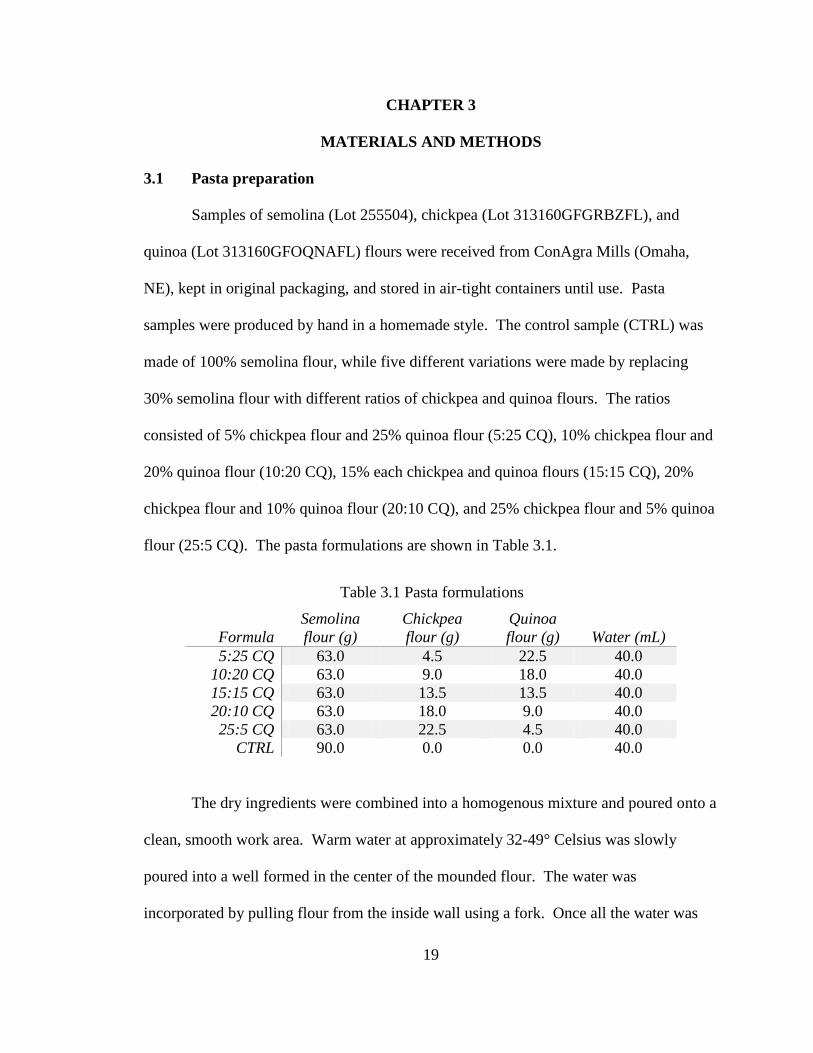
The dry ingredients were combined into a homogenous mixture and poured onto a
clean, smooth work area. Warm water at approximately 32-49° Celsius was slowly
poured into a well formed in the center of the mounded flour. The water was
incorporated by pulling flour from the inside wall using a fork. Once all the water was
Table 3.1 Pasta formulations
20
added and mixing with a fork became difficult, the remaining flour was blended in by
hand. The crumbly dough mass was then kneaded for approximately 10 minutes,
forming a smooth, elastic dough. Kneading was done by the repeated action of flattening
the dough with the palm of the hand, rotating the dough, and folding over. The kneaded
dough was wrapped in plastic film and set to rest at room temperature for one hour. Once
rested, the dough ball was divided into two pieces for processing. Each dough piece was
flattened and sent through the pasta machine (Imperia Tipo Lusso SP150, Torino, Italy)
starting on the thickest setting (number 1). The dough was folded into thirds and sent
through again. It was then folded in half, run through, and cut into manageable lengths.
Sheets of dough were fed through the pasta machine at decreasing thicknesses (numbers
2, 3, and 4, respectively). The thin, flattened sheets were laid to dry on a wire rack for 10
minutes (5 on each side) before being passed through the fettuccine cutter. The cut
strands were laid on wire racks and covered with a towel to dry overnight. Pictures of the
process can be seen in Figure 3.1. The dried pasta was stored in Ziploc bags at room
temperature until further use.
21
Figure 3.1 Pasta preparation

22
3.2 Cooking time
Optimal cooking time was determined by a modified American Association of
Cereal Chemists (AACC) approved method 16-50 (2000). Salt (0.6 grams) was dissolved
with 300mL of tap water in a 750mL saucepan. The saucepan was placed on a stovetop
burner set to medium-high heat and brought to a rolling boil (approximately 98° Celsius).
Twenty-five grams of pasta, broken into five centimeter long pieces, was added to the
boiling water. Cooking water was stirred occasionally and volume was maintained at
90% throughout procedure using another pot of boiling salt water. Samples were
removed every 30 seconds and squeezed between 2 pieces of clear plastic. Optimal
cooking time was determined when the white center core just disappeared. All
subsequent analyses were conducted on pasta cooked for the optimal cooking time.
3.3 Cooking loss
Cooking loss was determined by modifying AACC approved method 16-50
(2000). Three hundred milliliters of distilled water was brought to a rolling boil in a
750mL saucepan. Salt was not added to the cooking water as to not contribute to cooking
water residue. Twenty grams of dried pasta were added and cooked for the optimal
cooking time, stirring occasionally. Cooked pasta was strained over a large pot and
rinsed for 5 seconds with distilled water. The cooking water was quantitatively
transferred to a pre-weighed 400mL beaker and covered with perforated plastic wrap.
The beakers were placed on a baking sheet and were dried in a convection oven heated by
pilot light for three days. The oven maintained a temperature of 52-60° Celsius. Once all
cooking water had evaporated and a constant weight was reached, the beakers were
removed from the oven, cooled in a desiccator, and re-weighed. The remaining residue
23
was determined by difference in weight of beaker, and is expressed as percent of original
weight. Testing of each pasta formula was performed in duplicate.
3.4 Texture measurement
Texture profile analysis and firmness tests were conducted using a TA.HDi
Texture Analyzer (Texture Technologies Corp., Scarsdale, NY) following the method
described by Tang and others (1999). Since texture analyses are affected by temperature,
each pasta formula was cooked fresh immediately prior to each test and stored in a Ziploc
bag placed in a warm water bath to retain temperature. Data was obtained, calculated,
and graphed using the texture analyzer PC software program Texture Expert Exceed
(Version 2.62, Texture Technologies Corp., Scarsdale, NY).
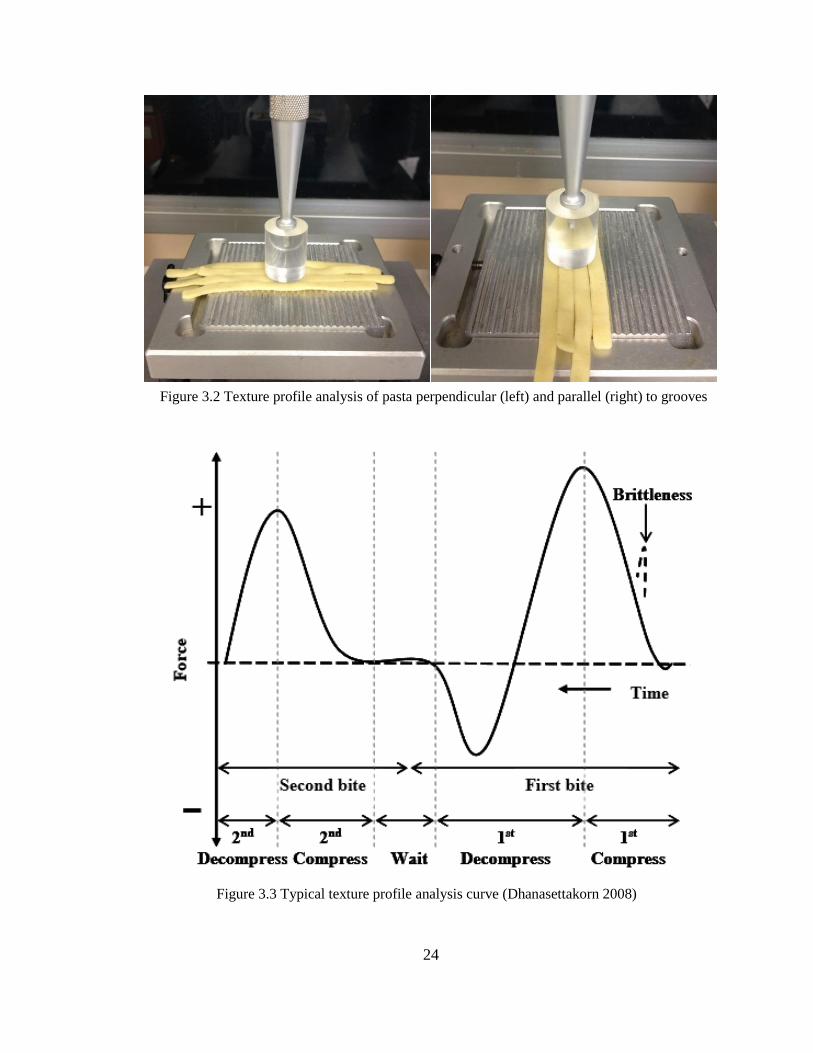
3.4.1 Texture profile analysis (TPA)
In performing TPA, 4 strands of pasta were arranged side-by-side on a sample
holder with a surface serrated by 90° vee grooves, 1.5 mm deep, and spaced at 3.6 mm.
Four samples of each formula were tested, two readings were taken with pasta laying
parallel to the grooves and two were taken with pasta placed perpendicular (Figure 3.2).
Noodles were compressed to a 70% fixed strain (as a percentage of sample height) by a
flat cylindrical plexiglass plunger, 25 mm in diameter, with a 5 kg load cell at a crosshead
speed of 0.2 mm per second. Each sample was compressed twice to emulate human bite,
resulting in a texture profile analysis curve (Figure 3.3). Results obtained from this
analysis are given as hardness, adhesiveness, springiness, cohesiveness, gumminess, and
chewiness. Tests were conducted in triplicate for each pasta formula.
24
Figure 3.2 Texture profile analysis of pasta perpendicular (left) and parallel (right) to grooves
Figure 3.3 Typical texture profile analysis curve (Dhanasettakorn 2008)
25
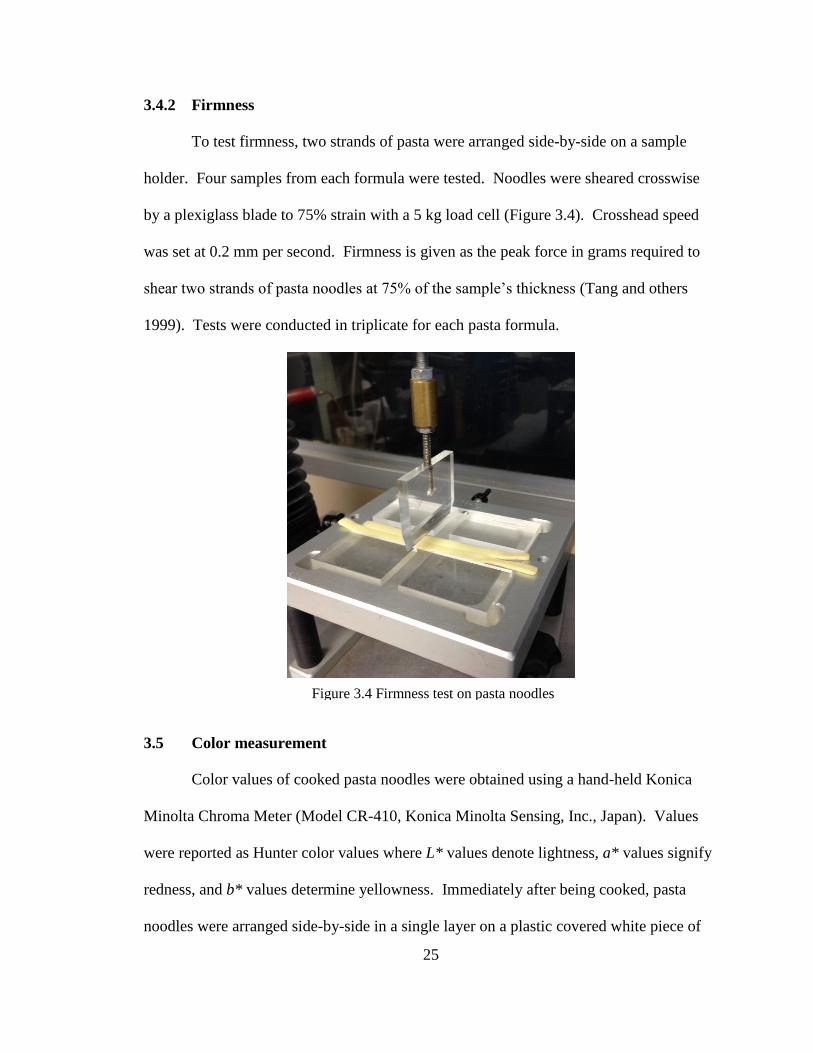
3.4.2 Firmness
To test firmness, two strands of pasta were arranged side-by-side on a sample
holder. Four samples from each formula were tested. Noodles were sheared crosswise
by a plexiglass blade to 75% strain with a 5 kg load cell (Figure 3.4). Crosshead speed
was set at 0.2 mm per second. Firmness is given as the peak force in grams required to
shear two strands of pasta noodles at 75% of the sample’s thickness (Tang and others
1999). Tests were conducted in triplicate for each pasta formula.
3.5 Color measurement
Color values of cooked pasta noodles were obtained using a hand-held Konica
Minolta Chroma Meter (Model CR-410, Konica Minolta Sensing, Inc., Japan). Values
were reported as Hunter color values where L* values denote lightness, a* values signify
redness, and b* values determine yellowness. Immediately after being cooked, pasta
noodles were arranged side-by-side in a single layer on a plastic covered white piece of
Figure 3.4 Firmness test on pasta noodles
26
paper. A glass Pyrex petri dish was placed between the surface of the pasta noodles and
the Chroma Meter. Four readings were taken from each pasta sample. Testing was
performed in triplicate.
3.6 Proximate composition
Proximate analyses were performed on dried ground uncooked pasta. Grinding
was done using a Fresh Grind™ Coffee Grinder (Model 80335, Hamilton Beach®,
Southern Pines, NC). Tests were completed by the Agricultural Experiment Station
Chemical Laboratories (ESCL) at the University of Missouri (Columbia, MO). Total
nitrogen, or crude protein, was found using Combustion Analysis (LECO) according to
the Association of Official Agricultural Chemists (AOAC) official method 990.03 (2006)
and multiplying by a nitrogen-to-protein factor of 5.70. Crude fat was obtained by ether
extraction following the AOAC official method 920.39 (A) (2006). Moisture was
determined in a vacuum oven by AOAC official method 934.01 (2006). AOAC official
method 942.05 was used to determine ash content, and AOAC official method 978.10
(2006) was used for crude fiber. Total carbohydrates were found by difference.
3.7 Amino acid analysis
Amino acid analyses were also performed by ESCL on dried ground uncooked
pasta samples using AOAC official method 982.30 E (a, b, c), chapter 45.3.05 (2006).
3.8 Consumer acceptance testing
Pasta formulations were evaluated for consumer acceptance by 102 untrained
panelists. Panelists were recruited based on willingness to participate and consisted of
people of various ages (at least 18 years old), genders, and ethnic backgrounds. Testing
27
was completed in the Sensory Lab in Eckles Hall at the University of Missouri following
approval from the University of Missouri Human Subject Institutional Review Board.
Pasta noodles were prepared in advance and stored in Ziploc bags in the
refrigerator. Upon a panelist’s arrival, samples of pasta (5-10 grams) were individually
reheated by being submersed in boiling water for 2-3 seconds, strained, and served in
small plastic cups. A 3-digit random number was assigned to each of the 6 samples, and
the order of the samples was randomized. Panelists were asked to taste each sample and
rate overall liking before moving on to the next one. To reduce carry-over effect,
panelists were given water to help cleanse their palates. A sensory ballot utilizing a 9-
point hedonic scale was given with the descriptive options of dislike extremely, dislike
very much, dislike moderately, dislike slightly, neither like nor dislike, like slightly, like
moderately, like very much, and like extremely. Upon analysis, numbers were assigned
to each description with 1 = dislike extremely, 5 = neither like nor dislike, and 9 = like
extremely.
3.9 Data analysis
Statistical analysis of collected data was performed by the software program
SAS® for Windows™ (Version 9.2, SAS Institute Inc., Cary, NC) using the general
linear model (GLM) procedure program. Data was analyzed by analysis of variance
(ANOVA) at p<0.05 followed by Fisher’s least significant difference (LSD) test to
compute the smallest significant difference between two means.
28
CHAPTER 4
RESULTS AND DISCUSSION
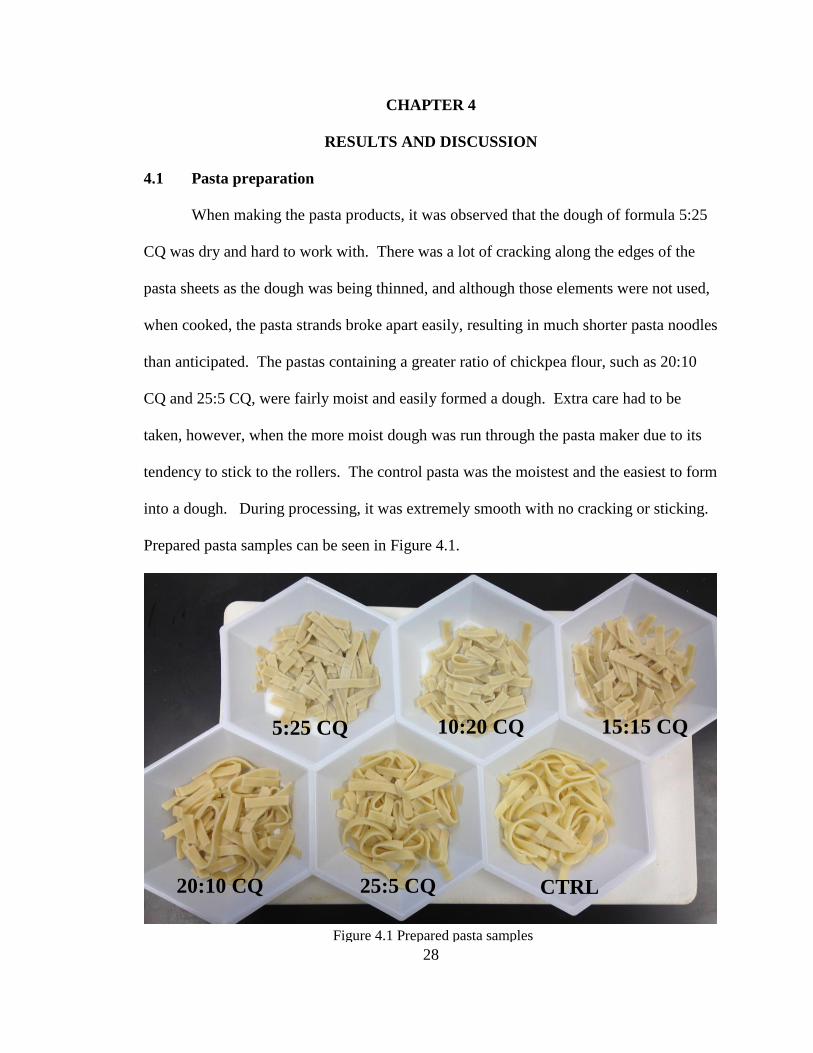
4.1 Pasta preparation
When making the pasta products, it was observed that the dough of formula 5:25
CQ was dry and hard to work with. There was a lot of cracking along the edges of the
pasta sheets as the dough was being thinned, and although those elements were not used,
when cooked, the pasta strands broke apart easily, resulting in much shorter pasta noodles
than anticipated. The pastas containing a greater ratio of chickpea flour, such as 20:10
CQ and 25:5 CQ, were fairly moist and easily formed a dough. Extra care had to be
taken, however, when the more moist dough was run through the pasta maker due to its
tendency to stick to the rollers. The control pasta was the moistest and the easiest to form
into a dough. During processing, it was extremely smooth with no cracking or sticking.
Prepared pasta samples can be seen in Figure 4.1.
Figure 4.1 Prepared pasta samples
…..
5:25 CQ
25:5 CQ
10:20 CQ
20:10 CQ
15:15 CQ
CTRL

29
4.2 Cooking time
The optimal cooking time for the control pasta was found to be 13 minutes, while
the optimal cooking time for the fortified pastas was 11.5 minutes. The decrease in
cooking time for pasta products containing non-gluten flour is in accordance with a study
by Chillo and others (2008b) who attribute the increase in speed of water penetration of
the core to the physical disruption of the gluten matrix caused by the addition of non-
gluten material. Grzybowski and Donnelly (1977) found that when less protein
surrounds starch granules, they swell and gelatinize faster. These results are similar to
those found by Petitot and others (2010b) where the addition of legume flours (split pea
and faba bean) led to a decrease in cooking time.
4.3 Cooking Loss
Cooking loss was significantly (p<0.05) affected by the addition of chickpea and
quinoa flours. Table 4.1 shows that the control pasta made with 100% semolina flour had
significantly (p<0.05) less cooking loss, as percent of original weight, than the formulas
containing chickpea and quinoa flours. This is in accordance to reports of others that
fortifying pasta with legume flours (pea, lupin, chickpea, lentil, split pea, or faba bean)
increases cooking loss (Nielson and others 1980, Rayas-Duarte and others 1996, Zhao
and others 2005, Petitot and others 2010b). Lorenz and others (1993) also found that
adding quinoa flour to pasta resulted in a higher cooking loss than the control made from
wheat flour. As with cooking time, the increase in cooking loss can be attributed to the
weakening of the gluten structure from the addition of non-gluten material, allowing
more solids from the noodles to leach out into the cooking water (Rayas-Duarte and
others 1996). Cooking loss, or cooking water residue, can also be attributed to starch

30
damage, where increased levels of starch damage lead to an increase in cooking loss
(Lorenz and others 1993).
Formula Cooking loss (%)
5:25 CQ 7.68a
10:20 CQ 7.74a
15:15 CQ 7.77a
20:10 CQ 7.71a
25:5 CQ 7.45a
CTRL 4.22b
The pasta products made with different ratios of chickpea and quinoa flours did
not have significantly different (p>0.05) cooking losses. This shows that the type of
fortification does not affect the cooking loss, but more so the amount of fortification.
This is in accordance with Bahnassey and Khan (1986) and Lorenz and others (1993),
who found that cooking loss increased as the level of fortification increased.
Although the fortified pastas have a significantly higher percent of cooking loss
than the control, they do not exceed 7-8%, which Dick and Youngs (1988) state as the
expected range for cooking loss for spaghetti made from semolina flour. Therefore, all
pastas in this study have acceptable cooking loss levels.
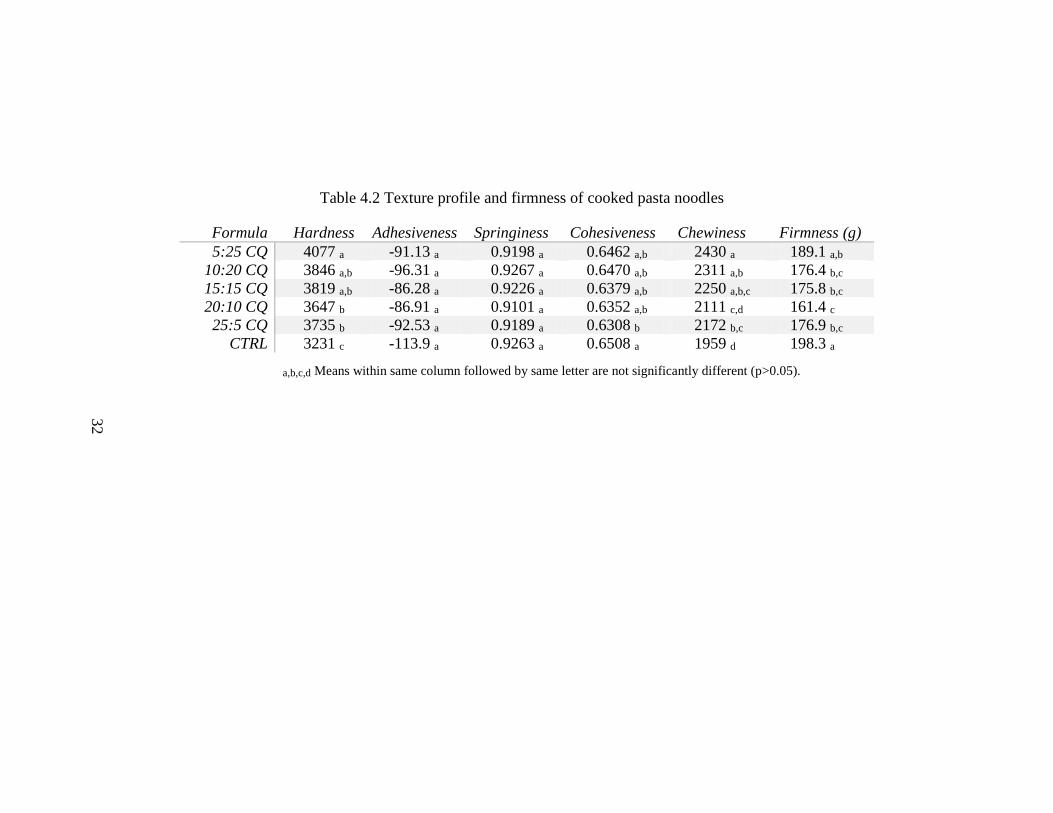
4.4 Texture measurement
Texture measurement results can be seen in Table 4.2. The hardness,
adhesiveness, springiness, cohesiveness, and chewiness of the pasta samples were
determined from the texture profile analysis, while firmness was found by an independent
test. According to definition, both gumminess and chewiness should not be analyzed for
Table 4.1 Cooking loss of cooked pasta noodles, as percent of original weight
a,b Means within same column followed by same letter are not significantly different (p>0.05).

31
the same sample. Gumminess is a measurement of semisolid foods, while chewiness is
the attribute used for solid food products (Bourne 2002). Although the texture profile
analysis gave results for gumminess of the samples, it will not be included in this
discussion.
32
Formula Hardness Adhesiveness Springiness Cohesiveness Chewiness Firmness (g)
5:25 CQ 4077 a -91.13 a 0.9198 a 0.6462 a,b 2430 a 189.1 a,b
10:20 CQ 3846 a,b -96.31 a 0.9267 a 0.6470 a,b 2311 a,b 176.4 b,c
15:15 CQ 3819 a,b -86.28 a 0.9226 a 0.6379 a,b 2250 a,b,c 175.8 b,c
20:10 CQ 3647 b -86.91 a 0.9101 a 0.6352 a,b 2111 c,d 161.4 c
25:5 CQ 3735 b -92.53 a 0.9189 a 0.6308 b 2172 b,c 176.9 b,c
CTRL 3231 c -113.9 a 0.9263 a 0.6508 a 1959 d 198.3 a
Table 4.2 Texture profile and firmness of cooked pasta noodles
a,b,c,d Means within same column followed by same letter are not significantly different (p>0.05).
33
4.4.1 Hardness
Hardness of the pastas was significantly (p<0.05) affected by the addition of
chickpea and quinoa flours. Hardness is the height of the force peak of the first
compression cycle (Bourne 2002). In this study, it is the maximum force required to
compress the sample to 70% of its original height, representing the effort of the jaw to
bite down on the sample. The control pasta was found to be significantly (p<0.05) less
hard than the fortified pasta products. Pasta formula 5:25 CQ was significantly (p<0.05)
more hard than pastas 20:10 CQ and 25:5 CQ, while pastas 10:20 CQ and 15:15 CQ were
not significantly (p>0.05) different. The addition of chickpea and quinoa flours increase
hardness of pasta, and more so, the addition of quinoa flour has a greater effect on pasta
hardness. These results are similar to those found by Petitot and others (2010b) where
pasta fortified with 35% legume flours (split pea or faba bean) significantly increased the
hardness of pasta, which they attributed to increased protein content and decreased water
uptake.
4.4.2 Adhesiveness
The addition of chickpea and quinoa flours did not significantly (p>0.05) affect
the adhesiveness of pasta made from 100% semolina flour. Adhesiveness is the negative
force area of the first bite, or the work necessary to pull the molars away from the food
(Bourne 2002). Although not significantly different, the control pasta had greater
adhesiveness than those containing chickpea and quinoa flours.
4.4.3 Springiness
Springiness of the pasta products was not significantly (p>0.05) affected by the
addition of chickpea and quinoa flours. Springiness, or elasticity, is the rate at which the

34
compressed sample returned to its original height after the deforming force was removed
(Tang and others 1999). There was no pattern in springiness among samples.
4.4.4 Cohesiveness
The addition of chickpea and quinoa flours had a moderate effect on the
cohesiveness of pasta. Cohesiveness is the ratio of positive force areas under the first and
second compression, where the second is divided by the first (Bourne 2002). This shows
the strength of the internal bonds of the food (Rosenthal 1999). The only pasta product
significantly (p<0.05) less cohesive than the control pasta was formula 25:5 CQ. Similar
results were found by Petitot and others (2010b) where the addition of 35% legume flours
had no impact on cohesiveness between samples. Overall, the pastas maintained a high
level of cohesiveness, ranging from 63-65%.
4.4.5 Chewiness
Chewiness is the energy required to chew a solid food until it is ready for
swallowing. It is determined as the product of hardness, cohesiveness, and springiness
(Bourne 2002). The addition of chickpea and quinoa flours significantly (p<0.05)
affected the chewiness of the pasta products. All fortified pastas, with the exception of
20:10 CQ, were significantly (p<0.05) more chewy than the control pasta. The pastas
with the highest levels of chewiness were 5:25, 10:20, and 15:15 CQ. With the pastas
containing the largest amounts of quinoa flour having the highest levels of chewiness,
this again shows that quinoa flour has a profound effect on the textural properties of
semolina pasta.

35
4.4.6 Firmness
The firmness of pasta was significantly (p<0.05) altered by the addition of
chickpea and quinoa flours. Firmness is the maximum force, in grams, required to shear
two strands of pasta noodles to the depth of 75% their original height (Tang and others
1999). The control pasta was found to be significantly firmer than the fortified pastas,
with the exception of 5:25 CQ. This is inconsistent with the TPA results for hardness
where the control pasta was found to require less force to compress than the pastas made
with chickpea and quinoa flours. The 20:10 CQ pasta had the overall lowest firmness
value, showing that it was the softest in texture of the pasta samples. This is similar to
the hardness results where, with the exception of the control, 20:10 CQ was found to be
the least hard pasta product.
In looking at the literature, similar results were found by Wood (2009), where
pasta fortified at 20-30% had a decreased firmness when compared to the control.
Bahnassey and Khan (1986), on the other hand, found opposing results in that the
firmness of pasta increased as the percent of fortification increased. Zhao and others
(2005) also determined that firmness increased with the addition of green pea and lentil
flours. There was no significant change, however, in firmness of pasta made with
chickpea and yellow pea flours.
4.5 Color measurement
Color values of cooked pasta noodles were significantly (p<0.05) affected by the
addition of chickpea and quinoa flours. Table 4.3 shows the results of the color
measurements taken by the Chroma Meter.

36
Formula L* a* b*
5:25 CQ 66.60 d 0.935 a 17.47 f
10:20 CQ 67.82 c 0.456 b 18.69 e
15:15 CQ 68.13 b,c 0.336 b,c 19.71 d
20:10 CQ 69.04 b -0.028 c 21.24 c
25:5 CQ 68.95 b 0.126 b,c 22.07 b
CTRL 73.31 a -2.848 d 24.27 a
4.5.1 Lightness
Lightness of the pastas was significantly (p<0.05) affected by the addition of
chickpea and quinoa flours. The control pasta was significantly (p<0.05) lighter in color
than the other samples. The pasta then decreased in brightness (L* value decreased) as
the amount of quinoa flour increased. Pasta 5:25 CQ was significantly (p<0.05) darker
than all the other pasta products. This decrease in brightness of pastas containing legume
flours is in accordance with many researchers who have experimented with legumes such
as chickpea, green pea, yellow pea, split pea, faba bean, soy, and lentil, as well as
pseudo-cereals like quinoa (Lorenz and others 1993, Ugarcic-Hardi 2003, Zhao and
others 2005, Wood 2009, Petitot and others 2010b). Oliver and others (1993) attribute
the decrease in brightness to a higher ash content in legume flours.
It is known that consumers prefer bright yellow translucent pasta products
(Ugarcic-Hardi and others 2003), but the limit of acceptable brightness is undefined. It
would be of interest to researchers to perform further consumer studies on the level of
acceptability of pasta brightness.
4.5.2 Redness
Redness of the pasta noodles was significantly (p<0.05) affected by the addition
of chickpea and quinoa flours. The control pasta was significantly (p<0.05) less red than
Table 4.3 Color values of cooked pasta noodles
a,b,c,d,e,f Means within same column followed by same letter are not significantly different (p>0.05).

37
the other pastas. Similar to lightness decreasing, redness increased (a* value increased)
as more quinoa flour was added. Pasta 5:25 CQ was significantly (p<0.05) more red than
the other pasta products. It can be concluded that the amount of quinoa flour added to
pasta significantly affects redness of the product. Similar results were found by Petitot
and others (2010b) where pasta fortified with faba bean flour saw a significant increase in
redness. Petitot and others (2010b) also noted that yellowness (b* values) was not
affected in this change. This is important to note because according to Ugarcic-Hardi and
others (2003), bright yellow pasta is achieved by having both high b* values and low a*
values.
4.5.3 Yellowness
Yellowness of the pastas was significantly (p<0.05) affected by the addition of
chickpea and quinoa flours. All b* values were found to be significantly (p<0.05)
different from one another. This shows that yellowness is affected not only the addition
of chickpea and quinoa flours, but also by the ratio of the flours. The control pasta was
found to be the most yellow (highest b* value), with yellowness significantly (p<0.05)
decreasing as more quinoa flour was added. This is in accordance with other researchers
who have seen a decrease in yellowness of pastas containing chickpea, green pea, yellow
pea, lentil, and quinoa flours (Lorenz and others 1993, Zhao and others 2005, Wood
2009). This decrease in yellowness may be due to the leaching and/or degradation of
color pigments, such as carotenoids and xanthophyll (Wood 2009). Since traditional
pasta is made of durum wheat which yields a bright yellow product, high levels of
yellowness are desirable for pasta (Dexter and Matsuo 1977, Kill 2001a). As whole
wheat pastas increase in popularity, pastas that are less yellow in color may become more
38
acceptable to consumers. The best way to test acceptability of pasta color is by consumer
panel. In 2009, Wood included color in a sensory survey and found that there was not a
statistical difference in panelist’s perception of pasta color.
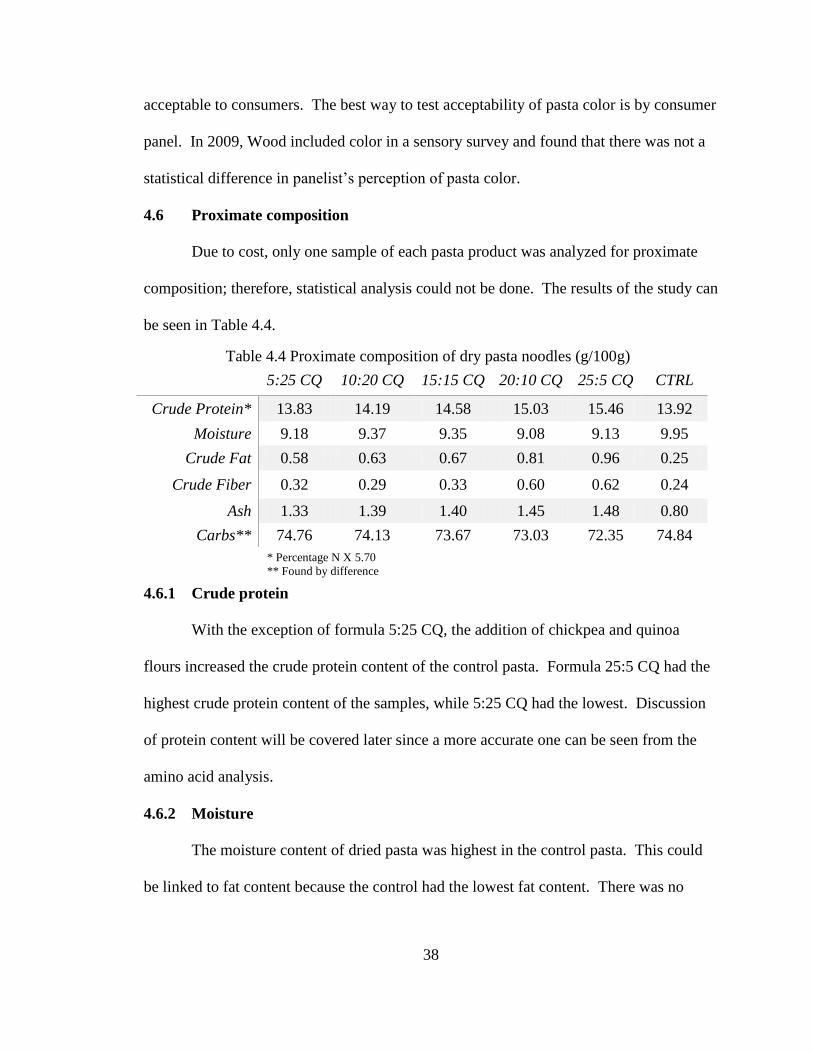
4.6 Proximate composition
Due to cost, only one sample of each pasta product was analyzed for proximate
composition; therefore, statistical analysis could not be done. The results of the study can
be seen in Table 4.4.
5:25 CQ 10:20 CQ 15:15 CQ 20:10 CQ 25:5 CQ CTRL
Crude Protein* 13.83 14.19 14.58 15.03 15.46 13.92
Moisture 9.18 9.37 9.35 9.08 9.13 9.95
Crude Fat 0.58 0.63 0.67 0.81 0.96 0.25
Crude Fiber 0.32 0.29 0.33 0.60 0.62 0.24
Ash 1.33 1.39 1.40 1.45 1.48 0.80
Carbs** 74.76 74.13 73.67 73.03 72.35 74.84
4.6.1 Crude protein
With the exception of formula 5:25 CQ, the addition of chickpea and quinoa
flours increased the crude protein content of the control pasta. Formula 25:5 CQ had the
highest crude protein content of the samples, while 5:25 CQ had the lowest. Discussion
of protein content will be covered later since a more accurate one can be seen from the
amino acid analysis.
4.6.2 Moisture
The moisture content of dried pasta was highest in the control pasta. This could
be linked to fat content because the control had the lowest fat content. There was no
* Percentage N X 5.70
** Found by difference
Table 4.4 Proximate composition of dry pasta noodles (g/100g)
39
clear pattern in moisture content of fortified pastas made with different ratios of chickpea
and quinoa flours.
4.6.3 Crude fat
There was a difference in crude fat between the control and the pasta products
containing chickpea and quinoa flours. The control pasta had the lowest amount of crude
fat, while 25:5 CQ had the highest. The amount of fat increased as the percent of
chickpea flour in the pasta samples increased. From this, it can be concluded that
chickpea and quinoa flours contain more fat than semolina, with chickpea flour having
the largest amount.
4.6.4 Crude fiber
The control pasta had the lowest crude fiber content of the samples analyzed.
Formula 25:5 CQ had the largest amount of crude fiber, over twice as much as the control
sample. Similar results were found by Bahnassey and others (1986) who determined that
fiber levels of pasta made with legume flours exceeded that of the control. Kaur and
others (2011) also found that adding chickpea flour to pasta increased the fiber while
keeping the fat at an optimum level.
4.6.5 Ash
Ash content had a tendency to be greater in the pasta products made from
chickpea and quinoa flours. The control pasta contained the lowest reported amount of
ash. This is parallel with the results of Bahnassey and others (1986).
4.7 Amino acid analysis
Due to cost, only one sample of each pasta formula was sent in for amino acid
analysis; therefore, statistical tests could not be done. The results of assessment,

40
however, can still be examined (Table 4.5). As seen in the proximate analysis, fortifying
pasta with chickpea and quinoa flours resulted in an increased protein content than that of
the control, with the exception of formula 5:25 CQ. The pasta with the greatest increase
in protein content is 25:5 CQ. From this, it can be inferred that the addition of chickpea
flour has a positive effect on the protein level of pasta, while quinoa flour negatively
affects it.
5:25 CQ 10:20 CQ 15:15 CQ 20:10 CQ 25:5 CQ CTRL
Taurine 0.09 0.08 0.08 0.08 0.09 0.08
Hydroxyproline 0.06 0.04 0.00 0.05 0.04 0.00
Aspartic Acid 0.85 0.92 0.98 1.05 1.10 0.62
Threonine 0.43 0.44 0.45 0.47 0.48 0.38
Serine 0.62 0.65 0.66 0.68 0.71 0.63
Glutamic Acid 3.93 4.05 4.12 4.18 4.22 4.77
Proline 1.33 1.39 1.41 1.45 1.41 1.69
Glycine 0.55 0.55 0.56 0.57 0.57 0.46
Alanine 0.51 0.52 0.54 0.55 0.56 0.45
Cysteine 0.27 0.29 0.29 0.30 0.30 0.31
Valine 0.64 0.67 0.68 0.71 0.71 0.63
Methionine 0.25 0.26 0.26 0.26 0.26 0.23
Isoleucine 0.58 0.60 0.62 0.64 0.66 0.57
Leucine 1.06 1.10 1.13 1.17 1.18 1.07
Tyrosine 0.44 0.45 0.45 0.46 0.46 0.42
Phenylalanine 0.73 0.77 0.79 0.83 0.86 0.75
Hydroxylysine 0.07 0.08 0.08 0.09 0.09 0.05
Lysine 0.51 0.55 0.57 0.62 0.64 0.36
Histidine 0.40 0.41 0.41 0.43 0.42 0.38
Arginine 0.77 0.83 0.88 0.95 0.99 0.55
Tryptophan 0.18 0.19 0.19 0.19 0.19 0.18
Total 14.27 14.84 15.16 15.74 15.95 14.59
The results of this analysis confirm the findings of others that semolina lacks
threonine and lysine (Kies and Fox 1970, Abdel-Aal and Hucl 2002, Zhao and others
Table 4.5 Amino acid profile of dry pasta noodles (g/100g)

41
2005), and that quinoa and chickpeas have a supplementing amount of those amino acids
(Lorenz and others 1993, Dhawan and others 1991, Maiti 2001, and Mastromatteo and
others 2011). Many results that were found by Wood (2009) in adding chickpea flour to
pasta were confirmed in this study, such as the decrease in proline and glutamic acid in
the fortified pastas and the lack of distinction in the amounts of cysteine and methionine.
The decrease in glutamic acid reflects the decrease in gluten-forming proteins from the
replacement of semolina flour with non-traditional flours.
The addition of quinoa flour did not contribute as much fortification as
hypothesized. Research proposed that quinoa would make a good pair for chickpeas due
to its greater amounts of the sulfur-containing amino acids, methionine and cysteine,
which chickpeas lack (Dhawan and others 1991, Maiti 2001, Jancurova and others 2009).
However, results from this analysis show that pasta products containing more chickpea
flour had higher levels of those amino acids. This discrepancy may be due to loss in the
milling process. Caperu and others (2000) found that milled quinoa contained less than
30% of the total protein of whole quinoa and a quarter of the amount of cysteine. A loss
of cysteine in the milling process explains why the amount of cysteine only slightly
varied in the samples made with quinoa flour. Another possible cause for quinoa not
contributing as large of an amount of amino acids is due to quinoa flour proteins losing
their solubility during storage (Abugoch and others 2009). Since quinoa protein content
depends on the variety and growing conditions of the plant (Fleming and Galwey 1995),
it would be advantageous to further analyze the flour used and compare it to others
available.
42
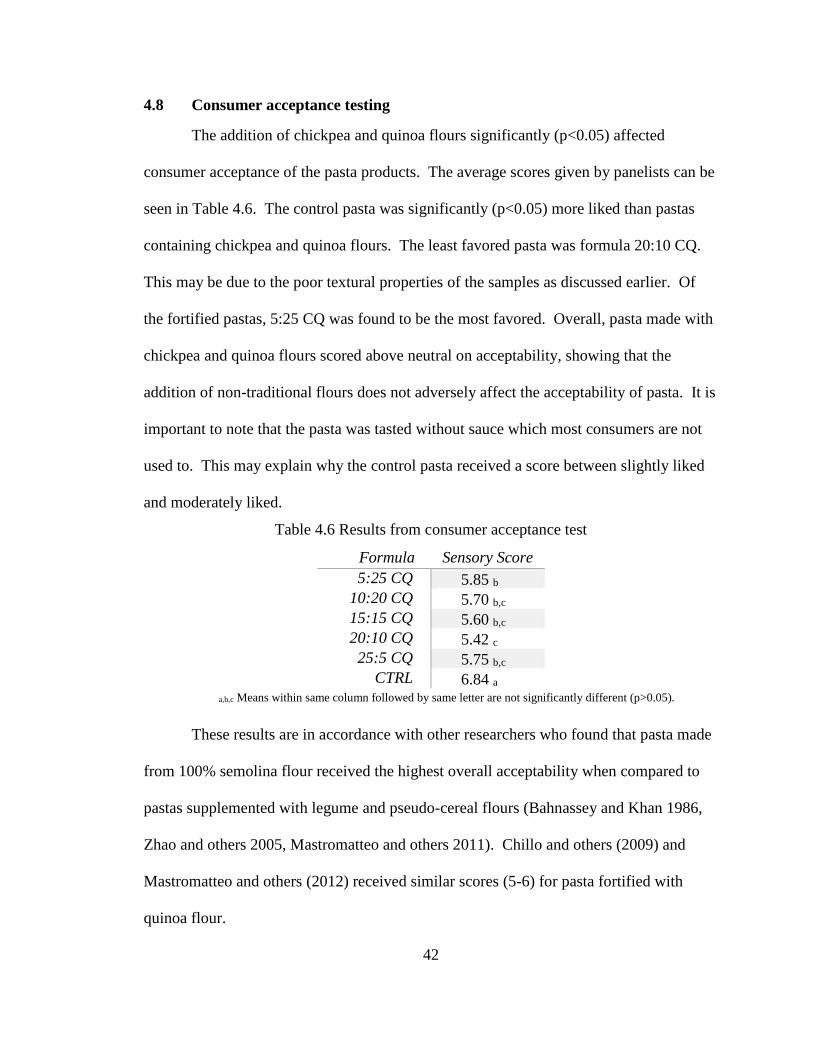
4.8 Consumer acceptance testing
The addition of chickpea and quinoa flours significantly (p<0.05) affected
consumer acceptance of the pasta products. The average scores given by panelists can be
seen in Table 4.6. The control pasta was significantly (p<0.05) more liked than pastas
containing chickpea and quinoa flours. The least favored pasta was formula 20:10 CQ.
This may be due to the poor textural properties of the samples as discussed earlier. Of
the fortified pastas, 5:25 CQ was found to be the most favored. Overall, pasta made with
chickpea and quinoa flours scored above neutral on acceptability, showing that the
addition of non-traditional flours does not adversely affect the acceptability of pasta. It is
important to note that the pasta was tasted without sauce which most consumers are not
used to. This may explain why the control pasta received a score between slightly liked
and moderately liked.
Formula Sensory Score
5:25 CQ 5.85 b
10:20 CQ 5.70 b,c
15:15 CQ 5.60 b,c
20:10 CQ 5.42 c
25:5 CQ 5.75 b,c
CTRL 6.84 a
These results are in accordance with other researchers who found that pasta made
from 100% semolina flour received the highest overall acceptability when compared to
pastas supplemented with legume and pseudo-cereal flours (Bahnassey and Khan 1986,
Zhao and others 2005, Mastromatteo and others 2011). Chillo and others (2009) and
Mastromatteo and others (2012) received similar scores (5-6) for pasta fortified with
quinoa flour.
Table 4.6 Results from consumer acceptance test
a,b,c Means within same column followed by same letter are not significantly different (p>0.05).
43
CHAPTER 5
CONCLUSION
In this study, the effects of non-traditional flours on cooking quality, texture,
composition, and consumer acceptance of pasta were evaluated. Thirty percent of
traditional semolina flour used to make pasta was replaced with different ratios of
chickpea and quinoa flours. Parameters evaluated in this study were cooking loss, texture
profile analysis, firmness, Hunter color values (L*, a*, b*), proximate composition,
amino acid profile, and consumer acceptance. The variables assessed were the ratios
(5:25, 10:20, 15:15, 20:10, and 25:5 CQ) of chickpea and quinoa flours used.
Results indicated that pasta containing 30% chickpea and quinoa flours had a
decreased optimal cooking time of 11.5 minutes compared to the control pasta time of 13
minutes. Cooking loss was found to be significantly (p<0.05) greater for pasta products
containing chickpea and quinoa flours. Although the addition of these flours negatively
affected the cooking loss, the percentages were still found to be at an acceptable level.
The results of the texture profile analysis indicated that hardness and chewiness
were significantly (p<0.05) affected by the addition of non-traditional flours. Hardness
and chewiness were significantly (p<0.05) higher in pastas containing chickpea and
quinoa flours compared to the control. More so, quinoa flour had a greater effect on
hardness and chewiness than chickpea flour, leading to increased values as more quinoa
flour was added. Adhesiveness and springiness were not significantly (p>0.05) affected
by fortification, and cohesiveness was only moderately affected. Pastas maintained high
cohesiveness at 63-65%, and formula 25:5 CQ was found to be significantly (p<0.05) less
cohesive than the others.

44
The results of the firmness test were in opposition of the results for hardness from
the texture profile analysis. The control pasta was found to be significantly (p<0.05)
more firm than those made with chickpea and quinoa flours, with the exception of 5:25
CQ. Both hardness and firmness tests, however, revealed that pasta 20:10 CQ was the
softest of the fortified pastas, which consumer testing later revealed leads to lower
acceptability.
Results of the Hunter color test indicated that the control pasta was significantly
(p<0.05) lighter than the pastas containing chickpea and quinoa flours, with those
containing the highest amounts of quinoa being the darkest. Redness (a* values)
significantly (p<0.05) increased with the addition of chickpea and quinoa flours, while
yellowness (b* values) decreased. The yellowness of pastas was found to be affected not
only by the addition of chickpea and quinoa flours, but also by the ratio of the two
additional flours.
Although statistical analysis could not be performed on the results of proximate
composition and amino acid analysis, the results were in agreement with many previous
studies. The addition of chickpea flour greatly increased the protein, fat, fiber, ash, and
amino acid content of pasta, with pasta 25:5 CQ having the highest values of all of these.
From this, it can be determined that the addition of chickpea flour had the greatest effect
on fortifying wheat pasta, while quinoa flour had little to no effect. This could be the
result of nutritional composition being lost in the milling process or flour storage.
Further studies should be done to better analyze and maintain the nutritional profile of
quinoa flour.

45
Finally, results of the consumer acceptance test indicated that panelists
significantly (p<0.05) preferred the control pasta. Formula 20:10 CQ received the lowest
sensory score of 5.422, which is slightly above neutral. Since all pasta variations
received scores above neutral, it was determined that the addition of chickpea and quinoa
flours does not adversely affect the acceptability of pasta products.
In conclusion, the pasta product with the most beneficial ratio of chickpea and
quinoa flours is that containing 25% chickpea flour and 5% quinoa flour. Formula 25:5
CQ had the highest protein content and best amino acid profile, along with increased fat
and fiber content. Its cooking loss was found to be in an acceptable range, and besides
having lower values of cohesiveness, the texture attributes were not adversely affected by
fortification. The color characteristics of pasta 25:5 CQ were also closest to that of the
control, leading to a high level of visual acceptability.
Further studies of proximate composition and amino acid profile are still needed
to statistically evaluate the influence of adding chickpea and quinoa flours to pasta.
Further assessment of the discrepancies between hardness and firmness should be
completed. Finally, in order to better understand the nutritional composition of quinoa
flour, it would be valuable to analyze different seed sources and milling processes.
46
REFERENCES
Abdel-Aal ESM, Hucl P. 2002. Amino acid composition and in vitro protein digestibility
of selected ancient wheats and their end products. J Food Compos Anal 15(6):737.
Abugoch L, Castro E, Tapia C, Anon MC, Gajardo P, Villarroel A. 2009. Stability of
quinoa flour proteins (chenopodium quinoa willd.) during storage. International J Food
Sci Tech 44(10):2013-20.
Allred L, Hendricks DG, Mahoney AW. 1976. The availability of iron in quinoa. Nutr
Rep Int 14(5):575-9.
American Association of Cereal Chemists (AACC). 2000. Approved methods of the
American Association of Cereal Chemists. 10th ed. St. Paul, MN: AACC International.
Association of Official Agricultural Chemists (AOAC). 2006. Official methods of
analysis of AOAC International. 18th ed. Arlington, VA: AOAC International.
Bahnassey Y, Khan K. 1986. Fortification of spaghetti with edible legumes. II.
Rheological, processing, and quality evaluation studies. Cereal Chem 63(3):216-19.
Bahnassey Y, Khan K, Harrold R. 1986a. Fortification of spaghetti with edible legumes.
I. physicochemical, antinutritional, amino acid, and mineral composition. Cereal Chem
63(3):210-215.
Bourne MC. 2002. Principles of objective texture measurement. In: Bourne MC, editor.
Food texture and viscosity: concept and measurement. 2nd ed. California: Academic
Press. p107-88.
Caperuto LC, Amaya-Farfan J, Camargo CR. 2000. Performance of quinoa
(chenopodium quinoa willd) flour in the manufacture of gluten-free spaghetti. J Sci Food
Agric 81:95-101.
Chillo S, Laverse J, Falcone PM, Del Nobile MA. 2007. Effect of
carboxymethylcellulose and pregelatinized corn starch on the quality of amaranthus
spaghetti. J Food Eng 83:492-500.
Chillo S, Laverse J, Falcone PM, Del Nobile MA. 2008a. Quality of spaghetti in base
amaranthus wholemeal flour added with quinoa, broad bean and chick pea. J Food Eng
84:101-107.
Chillo S, Laverse J, Falcone PM, Protopapa A, Del Nobile MA. 2008b. Influence of the
addition of buckwheat flour and durum wheat bran on spaghetti quality. J Cereal Sci
47:144-52.
Chillo S, Civica V, Iannetti M, Suriano N, Mastromatteo M, Del Nobile MA. 2009.
Properties of quinoa and oat spaghetti loaded with carboxymethylcellulose sodium salt
and pregelatinized starch as structuring agents. Carbohyd Polym 78:932-37.

47
Del Nobile MA, Baiano A, Conte A, Mocci G. 2005. Influence of protein content on
spaghetti cooking quality. J Cereal Sci 41:347-56.
Dexter JE, Matsuo RR. 1979. Influence of protein content on some durum wheat quality
parameters. Can J Plant Sci 57:717-27.
Dhanasettakorn K. 2008. Coenzyme Q10 content, composition, texture and
physiochemical characteristics of pasta fortified with freeze-dried beef heart [DPhil
dissertation]. Columbia, MO: Univ of Missouri. 174p. Available from:
http://hdl.handle.net/10355/6636.
Dhawan K, Malhotra S, Dahiya BS, Singh D. 1991. Seed protein fractions and amino
acid composition in gram (cicer arietinum). Plant Food Hum Nutr 41:225-32.
Dick IW, Matsuo RR. 1988. Durum wheat and pasta products. In: Pomeranz Y, editor.
Wheat chemistry and technology. St. Paul, MN: AACC. p507-48.
Dick JW, Youngs VL. 1988. Evaluation of durum wheat, semolina, and pasta in the
United States. In: Fabriani G, Lintas C, editors. Durum wheat: chemistry and technology.
St. Paul, MN: AACC. p237-248.
Dintheer W. 2001. Pasta mixing and extrusion: practical dosing, mixing and extrusion.
In: Kill RC, Turnbull K, editors. Pasta and semolina technology. Oxford: Blackwell
Science Ltd. p90-118.
Donnelly BJ. 1991. Pasta: raw materials and processing. In: Lorenz KJ, Kulp K, editors.
Handbook of cereal science and technology. New York: Marcel Dekker. p763-92.
Douglass JS, Matthews RH. 1982. Nutrient content of pasta products. Cereal Food World
27(11):558-61.
FAOSTAT [Internet]. Food and Agricultural Organization of the United Nations; 2014
[Accessed 2014 Mar 24]. Available from: http://faostat.fao.org.
Fasano A. 2011. Zonulin and its regulation of intestinal barrier function: the biological
door to inflammation, autoimmunity, and cancer. Physiol Rev 91(1):151-75.
Fleming FE, Galwey NW. 1995. Quinoa (chenopodium quinoa). In: Williams JT. Cereals
and pseudocereals. London: Chapman & Hall. p3-84.
Food and Drug Administration. 1999. Food Labeling: Health Claims; Soy protein and
coronary heart disease. Federal Register 64(206):57700-33.
Food and Agriculture Organization (FAO). 2013. International Year of Quinoa. United
Nations; 2013 [Accessed 2014 Mar 3] Available from: http://www.fao.org/quinoa-
2013/en/.
Goni I, Valentin-Gamazo C. 2003. Chickpea flour ingredient slows glycemic response to
pasta in healthy volunteers. Food Chem 81:511-15.
Grzybowski RA, Donnelly BJ. 1977. Starch gelatinization in cooked spaghetti. J Food
Sci 42(5):1304-05.

48
Hill M. 2012. Attack of the gluten. In: Bleam W, McKinney D, Tempest R, Jacobsen EK,
editors. Chem Matters Teacher’s Guide. ACS. p37-44.
International Pasta Organization [Internet]. Oct 2012 [Accessed 2014 Mar 4]. Available
from: www.internationalpasta.org.
Jancurova M, Minarovicova L, Dandar A. 2009. Quinoa-a review. Czech J Food Sci
27(2):71-79.
Johnston KW. 2001. Pasta mixing and extrusion: introduction and background. In: Kill
RC, Turnbull K, editors. Pasta and semolina technology. Oxford: Blackwell Science Ltd.
p86-90.
Kaur G, Sharma S, Nagi HPS, Ranote PS. 2011. Enrichment of pasta with different plant
proteins. J Food Sci Tech 50(5):1000-1005.
Kies C, Fox HM. 1970. Determination of the first-limiting amino acid of wheat and
triticale grain for humans. Cereal Chem 47:615-22.
Kill RC. 2001a. Introduction. In: Kill RC, Turnbull K, editors. Pasta and semolina
technology. Oxford: Blackwell Science Ltd. p1-10.
Kill RC. 2001b. Additional Ingredients. In: Kill RC, Turnbull K, editors. Pasta and
semolina technology. Oxford: Blackwell Science Ltd. p176-80.
Lorenz K, Gifford H, Johnson DL. 1993. Quinoa in pasta products. Dev Food Sci 32:781-
90.
Madhumitha S, Prabhasankar P. 2011. Influence of additives on functional and nutritional
quality characteristics of black gram flour incorporated pasta. J Texture Stud 42:441-450.
Maiti RK. 2001. The chickpea crop. In: Maiti RK, Wesche-Ebeling P, editors. Advances
in chickpea science. Enfield, NH: Science Publishers, Inc. p1-32.
Marconi E, Carcea M. 2001. Pasta from nontraditional raw materials. Cereal Food World
46(11):522-30.
Mariani-Constantini A. 1988. Image and nutritional role of pasta—changing food
patterns. In: Fabriani G, Lintas C, editors. Durum wheat: chemistry and technology. St.
Paul, MN: AACC p283-302.
Mastromatteo M, Chillo S, Iannetti M, Civica V, Del Nobile MA. 2011. Formulation
optimization of gluten-free functional spaghetti based on quinoa, maize and soy flours.
Int J Food Sci Tech 46:1201-1208.
Mastromatteo M, Chillo S, Civica V, Iannetti M, Suriano N, Del Nobile MA. 2012. A
multistep optimization approach for the production of healthful pasta based on
nonconventional flours. J Food Process Eng 35:601-621.
Nielsen MA, Sumner AK, Whalley LL. 1980. Fortification of pasta with pea flour and
air-classified pea protein concentrate. Cereal Chem 57(3):203-6.
49
Oliver JR, Blakeney AB, Allen HM. 1993. The color of flour streams as related to ash
and pigment contents. J Cereal Sci 17(2):169-82.
Orth RA, Shellenberger JA. 1988. Origin, production, and utilization of wheat. In:
Pomeranz Y, editor. Wheat chemistry and technology, vol 3. St. Paul, MN: AACC.
Petitot M, Barron C, Morel MH, Micard V. 2010a. Impact of legume flour addition on
pasta structure: consequences on its in vitro starch digestibility. Food Biophys 5:284-99.
Petitot M, Boyer L, Minier C, Micard V. 2010b. Fortification of pasta with split pea and
faba bean flours: pasta processing and quality evaluation. Food Res Int 43:634-641.
Rayas-Duarte P, Mock CM, Satterlee LD. 1996. Quality of spaghetti containing
buckwheat, amaranth, and lupin flours. Cereal Chem 73(3):381-87.
Regional Office for Latin America and the Caribbean. 2011. Quinoa: an ancient crop to
contribute to world food security. [Accessed 2014 Mar 3]. Available from:
http://www.rlc.fao.org/en/publications/quinoa-ancient-crop-food-security.
Rosenthal AJ. 1999. Relation between instrumental and sensory measures of food texture.
In: Rosenthal AJ, editor. Food texture: measurement and perception. Maryland: Aspen
Publishers, Inc. p 1–17.
Sabanis D, Makri E, Doxastakis G. 2006. Effect of durum flour enrichment with chickpea
flour on the characteristics of dough and lasagna. J Sci Food Agri 86:1938-1944.
Schoenlechner R, Drausinger J, Ottenschlaeger V, Jurackova K, Berghofer E. 2010.
Functional properties of gluten-free pasta produced from amaranth, quinoa and
buckwheat. Plant Food Hum Nutr 65(4):339-49.
Singh U. 2001. Functional properties of grain legume flours. J Food Sci Tech 38(3):191-
99.
Smewing J. 1997. Analyzing the texture of pasta for quality control. Cereal Food World
42:8-12.
Su-Chuen N, Anderson A, Coker J, Ondrus M. 2007. Characterization of lipid oxidation
products in quinoa (chenopodium quinoa). Food Chem 101(1):185-92.
Swanson RB. 2007. Grains and legumes. In: Hui YH, editor. Food chemistry: principles
and applications. 2nd ed. West Sacramento, CA: Science Technology System. p1-24.
Tang C, Hsieh F, Heymann H, Huff HE. 1999. Analyzing and correlating instrumental
and sensory data: a multivariate study of physical properties of cooked wheat noodles. J
Food Quality 22(2):193-211.
Ugarcic-Hardi Z, Hackenberger D, Subaric D, Hardi J. 2003. Effect of soy, maize and
extruded maize flour addition on physical and sensory characteristics of pasta. Ital J Food
Sci 15:277-286.
United Nations. 2011. International year of quinoa, 2013. General Assembly: United
Nations. A/RES/66/221. Available from http://undocs.org/A/RES/66/221.

50
United States Department of Agriculture (USDA) National Nutrient Database for
Standard Reference, Release 26. [Internet]: U.S. Department of Agriculture; 2013, [2014
March 3]. Available from: http://www.ars.usda.gov/ba/bhnrc/ndl.
Valencia S, Svanberg U, Sandberg A, Ruales J. 1999. Processing of quinoa
(chenopodium quinoa, willd): effects on in vitro iron availability and phytate hydrolysis.
Int J Food Sci Nutr 50:203-11.
Vitali D, Amidzic Klaric D, Dragojevic IV. 2010. Nutritional and functional properties of
certain gluten-free raw materials. Czech J Food Sci 28(6):495-505.
Wesche-Ebeling P, Maiti RK, Cuevas-Hernandez B, Verde-Star J. 2001. Food science
and feed quality. In: Maiti RK, Wesche-Ebeling P, editors. Advances in chickpea science.
Enfield, NH: Science Publishers, Inc. p189-214.
Wiseman G. 2001. Durum Wheat. In: Kill RC, Turnbull K, editors. Pasta and semolina
technology. Oxford: Blackwell Science Ltd. p11-42.
Wood JA. 2009. Texture, processing and organoleptic properties of chickpea-fortified
spaghetti with insights to the underlying mechanisms of traditional durum pasta quality. J
Cereal Sci 49:128-33.
Zhao YH, Manthey FA, Chang SK, Hou H, Yuan SH. 2005. Quality characteristics of
spaghetti as affected by green and yellow pea, lentil, and chickpea flours. J Food Sci
70(6):S371-76.
Zweifel C, Handschin S, Escher F, Conde-Petit B. 2003. Influence of high-temperature
drying on structural and textural properties of durum wheat pasta. Cereal Chem
80(2):159-167.