formulation of gluten-free pocket-type flat breads ... · pdf fileformulation of gluten-free...
TRANSCRIPT

BREADBAKI NG
Formulation of Gluten-Free Pocket-Type Flat Breads: Optimization of Methylcellulose,Gum Arabic, and Egg Albumen Levels by Response Surface Methodology
IMAD TOUFEILI, 2 SHAWKY DAGHER,' SOSSY SHADAREVIAN,1 ABIR NOUREDDINEIMAY SARAKBI,I and MOHAMMED T. FARRAN'
Cereal Chem. 71(6):594-601
Response surface methodology was used to analyze the effects of methyl-cellulose, egg albumen, and gum arabic on the sensory properties of gluten-free pocket-type flat bread baked from formulas based on pregelatinizedrice flour and pregelatinized corn starch with corn flour. A rotatablecentral-composite design consisting of three variables (methylcellulose,egg albumen, and gum arabic), in a five-level pattern (1.37, 2, 3, 4, and4.63 g) with 20 runs (gluten-free formulations), was prepared over threeblocks. This design was used to develop models for the different sensoryresponses. Responses were affected most by changes in methylcelluloseand egg albumen levels, and to a lesser extent by gum arabic levels.Individual contour plots of the different responses were superimposed,
Wheaten, pocket-type flat breads are the main dietary stapleof people in the Middle East, the Nile Valley, and the PersianGulf states. These breads are referred to as "Arabic", balady,shami, "Lebanese", and mafrood in the Arab countries and as"pita" in the United States and Europe. The formulation, process-ing, and characteristics of these flat breads were recently reviewedby Faridi (1988). Reliable statistics on the prevalence of glutenintolerance in the aforementioned countries is lacking, or at best,difficult to locate. However, gluten intolerance has been reportedin Northern Sudan (Suliman 1978), as well as in Middle Easterncountries such as Lebanon (Bitar et al 1970) and Iraq (Al-Hassany1975). The principal treatment consists of removing gluten fromthe diet. Exclusion of gluten from the diet is a formidable taskfor dietitians, as wheat flour is present in a wide range of productsincluding bread, biscuits, cakes, and pastas. The situation is partic-ularly irksome in the case of bread, as flat bread consumptionconstitutes the cornerstone of dietary patterns for these populations.
Gluten-free breads require polymeric substances that mimic theviscoelastic properties of gluten in bread doughs. To this end,gluten-free pan breads have been successfully formulated byincorporating gums (Kim and De Ruiter 1968, Smith 1971), soyproteins (Ranhotra et al 1975), and egg white (Eggleston et al1992) into nonwheat flours.
The effectiveness of response surface methodology (RSM) inthe development and optimization of cereal products has beenhighlighted by different workers (Vaisey-Genser et al 1987, Shelkeet al 1990, Malcolmson et al 1993). Recently, RSM was effectivelyutilized in mapping the levels of gums and water required forthe production of sensorially acceptable gluten-free pan breadfrom a formula based on rice flour and potato starch (Ylimakiet al 1988, 1991).
This article reports on the use of RSM in defining the levelsof methylcellulose, gum arabic, and egg albumen needed toformulate gluten-free pocket-type flat bread that is based on abake mix of pregelatinized rice and corn starch, and that is com-patible with regular wheat bread in key sensory attributes.
'Departments of Food Technology & Nutrition, Biology, and Animal Science,American University of Beirut, Lebanon.2Corresponding author.
© 1994 American Association of Cereal Chemists, Inc.
and regions meeting the maximum number of bread sensory attributeswere identified. When 3 g of gum arabic was included in the bake mix,gluten-free breads comparable to regular wheat bread in the frequencyof cracks, separation of layers, rollability, tearing quality, hardness,adhesiveness, and cohesiveness were obtained at methylcellulose levels>2.10 g and <4.12 g, and at egg albumen levels >2.18 g and <4.10 g.Higher levels (4.63 g) of gum arabic resulted in more cohesive products.Lower levels (1.37g) of gum arabic produced loaves that were less cohesiveand inferior to wheat bread in rollability. All breads possessed a perceptiblecorn flavor, a light-yellow crumb with apparent waxy patches, and afaster staling rate than that of regular wheat bread.
MATERIALS AND METHODS
MaterialsCorn flour and corn starch (B. V. Meelunie, Amsterdam) and
active dry yeast (Fermipan, Delft, Holland) were obtained froma local supplier. Methylcellulose (Methocel MC, 400 cP), gumarabic, and powdered sodium stearoyl-2-lactylate (Artodan SP55) were purchased from Fluka (Buchs, Switzerland), SigmaChemical Company (St. Louis, MO), and Grinsted Products(Brabrand, Denmark), respectively. Wheat flour, short-grain rice,eggs, sugar, and salt were procured from the local market.
Chemical and Physicochemical AnalysesProtein, fat, ash, moisture, and farinograph absorption were
determined according to standard methods (AACC 1983). Degreeof gelatinization was assayed as described by Chiang and Johnson(1977). Pasting temperature was determined from amylogramsrecorded with the 700 cm-g cartridge for 8% (w/v) flour slurries,as reported by Rasper (1980). Particle size distributions wereregistered on a Malvern Mastersizer SB.OA (Malvern Instruments,England) at a focal length of 300 mm. Analyses were made induplicate.
Experimental Flours and Dried Egg AlbumenPregelatinized corn starch. Corn starch (1 kg) was soaked in
water (12 L) for 15 min, and the suspension was heated in asteam-jacketed kettle at 950C for 20 min. The slurry was cooledto room temperature, spread on stainless steel trays, and driedin an air-draft oven (Hotpack, Philadelphia, PA) at 1100C for12 hr and then at 800C for an additional 12 hr. The dried flakeswere ground in a Wiley mill fitted with a 1-mm screen and thenin an Alpine mill (Kollopex, 160Z, Augsburg, Germany) to mini-mize graininess. The flakes were sieved to pass through 300-,umperforations and stored at 6°C until used. The powdercomposition was: protein (NX5.7), 0.44%; fat, 1.14%; moisture,8.01%; ash, 0.36%; degree of gelatinization, 98.3%. It had a particlesize distribution of 168.0 ,m maximum; 50% of the particleswere <182.07 ,im.
Pregelatinized rice flour. Whole rice (1 kg) was hydrated inwater (16 L) for 15 min, processed, and stored as described pre-viously. The powder composition was: protein (NX5.95), 6.59%;fat, 1.98%; moisture, 6.04%; ash, 0.47%; degree of gelatinization,96.7%. It had a particle size distribution of 159.20 ,um maximum;50% of the particles were <133.71 ,im.
594 CEREAL CHEMISTRY
ABSTRACT

TABLE IExperimental Design and Amounts of Water in I)ifferent Formulations
Coded LevelsbXI x2 x3Variables' (Methylcellulose) (Gum Arabic) (Egg Albumen) Water'(ml)
Block 1 -1 -lL -1 91.5+1 +±1 -1 101.5+1 -1] +1 101.5-1 +1] +1 94.3
00 0 99.10 0 0 96.7
Block 2 +1 -1 -1 100.0-1 +1 -1 93.5-1 -1 +1 93.1+1 +1 +1 104.2
0 0 0 98.50 0 0 97.2
Block 3 -1.633 0 0 91.3+1.633 0 0 100.2
0 -1.633 0 92.20 +1.633 0 95.00 0 -1.633 93.30 0 +1.633 96.10 0 0 96.90 0 0 95.6
a Y- I I~~~~~~~~~~~~~~~~~~~~~~~~~~~~~~~~~~~~~~~~~~~~~~~~~~~~~~~~~~~~~~~~~~~~~~~~~~~~~~~~~~~~~~~~~~~~~~~~~~~~~~~~~~~~
'Blocks and treatment combinations within a block were randomized.b1.633 (1.37 g), -1 (2 g), 0 (3 g), +1 (4 g), +1.633 (4.63 g). Reported on 100-g flour mass basis.cAverage of two replicates on 100 g (flour mass basis). Differences did not exceed 4.5%.
Corn flour. Corn flour composition was: protein (NX5.7),4.84%; fat, 2.18%; moisture, 14.13%; ash, 0.69%. The pastingtemperature was 770C. Particle size distribution was 258.61 /Ammaximum; 50% of the particles were <170.21 tim.
Dried egg albumen. Egg whites were separated manually fromthe yolks, mixed into a uniform mass, freeze-dried (Stokes 902-1-8,Penwalt, Philadelphia, PA), ground to a fine powder (Moulinex241, France), sieved to pass 300-,um perforations, and stored at60C. Before use, the powder was reconstituted by adding 8 partsof water to 1 part solids and holding for 3 hr at room temperature,as described by Sultan (1969).
Experimental DesignA response surface design was used to study the relative con-
tribution of different variables to bread quality and to determineoptimum gluten-free product formulations. Methylcellulose, gumarabic, and egg albumen were chosen as variables for this studyon the basis of data from preliminary screening experiments(Sarakbi 1985, Noureddine 1993). The gum and egg albumenlevels were varied according to a rotatable central-compositedesign with three blocks and six replicates of the center point(Gacula and Singh 1984). The experimental design (Table I), whichwas replicated twice, consisted of three variables, a five-levelpattern with 20 runs (bread formulations) prepared over threeblocks (consecutive weeks). For the statistical analysis, the fivelevels of the three variables were coded as -1.633, -1, 0, +1,and +1.633.
Preparation of Bread SamplesThe formula used in the preparation of experimental breads
is shown in Table II. Breads were prepared by mixing the ingredi-ents with simultaneous addition of water at speed 2 in Braundough mixer (type 4122, Frankfurt, Germany) until a cohesivedough mass was obtained (-7-10 min). The amounts of waterneeded for optimum dough consistency (assessed kinesthetically)are shown in Table I. The resultant dough was fermented for30 min in an incubator (GM, Precision) and maintained at 370C.The fermented dough was divided and rounded into balls of 20 geach. The balls were covered with a wet cloth and fermentedfor 20 min at 370C and then flattened into circular sheets of1.7-mm thickness with a plexiglass roller. Throughout the dough-handling stages, corn flour was used as the dusting powder. Theflattened sheets were proofed for 20 min and baked at 4700Cto optimum crust color (-50-70 sec), as reported by Maleki and
TABLE IIBasic Gluten-Free Pocket-Type Flat Bread Formula
Ingredients Mass (g)Pregelatinized rice flour 100Pregelatinized corn starch 50Corn flour 50Sodium stearoyl-2-lactylate 0.5Sugar 6.0Salt 3.0Yeast 4.0Methylcellulosea variableGum arabica variableEgg albumena variableWaterb
aAmounts varied according to the experimental design (Table I).bOptimum dough consistency was assessed kinesthetically. Amountsneeded for different formulations are shown in Table I.
Daghir (1967). After baking, the loaves were cooled for 10 min,placed in polyethylene bags to prevent moisture loss, and storedat -20 C until used.
A commercial bakers' flour (composition: protein [NX5.7],10.83%; ash, 0.64%; moisture basis, 14.0%; farinograph absorp-tion, 58.1%) (AACC 1983) was used in the preparation of thereference wheat bread. Dough preparation and baking were asdescribed above. Reference bread samples were subjected to thesame storage conditions as experimental breads.
Sensory EvaluationNine panelists (six female, three male, aged 22-26 years), who
had completed a graduate course in sensory analysis, were trainedin the profiling of pocket-type flat breads. The samples used fortraining included a range of wheat and rice-corn breads differingin formulation, processing, and storage conditions (time-tempera-ture combinations). During the four weeks of training (twelve1-hr sessions), panelists used group discussions to establishdescriptive terms characterizing flavor and textural attributes ofpocket-type flat breads. The attributes selected were: frequencyof cracks in layers, separation of layers, crumb color, grain distri-bution, rollability, tearing quality, first bite hardness, adhesive-ness, masticatory hardness, cohesiveness of mass, and corn flavor.Interestingly, rice flavor was not detected in rice-corn breads.Definitions of the aforementioned attributes were reported pre-viously (Meilgaard et al 1987, Qarooni et al 1987, Williams et
Vol. 71, No. 6,1994 595

al 1988).Consistency of the panel was checked by subjecting data for
the indicated attributes from five replicate ratings of five breadsamples to principal component analysis (Kwan and Kowalski1980, Powers 1984). The results (data not shown) revealed a clusterof seven assessors indicating agreement in evaluation, and twooutliers. Consequently, sensory measurements were conductedwith the "consistent" panel of seven assessors (five female, two male).
The attributes' descriptor ranges were: frequency of cracks(none-too many), separation of layers (fully separated insepa-rable), crumb color (creamy white yellow), grain distribution(continuous cellular structure no cellular structure, waxy), roll-ability (loaf retains integrity loaf cracks extensively), tearingquality (very easy very difficult), first bite hardness (very soft-very hard), adhesiveness (not sticky very sticky), masticatoryhardness (very soft very hard), cohesiveness of mass (veryloose very compact), and corn flavor (absent very strong).
The sensory score sheet consisted of 15-cm unstructured linescales anchored at the extremes with the appropriate descriptors.In evaluating the breads, panelists were instructed to place anarrow across the line at the point that best quantified theirresponse. The magnitude of the responses was scaled by measuringthe distance from zero to the position of the arrow.
Samples, selected at random from the different treatments, wereremoved from storage 30 min before evaluation to equilibrateto room temperature. The breads were rated in comparison toregular wheat bread on two consecutive days. After equilibration,loaves (with three-digit codes) were presented to the panelistsin a balanced random order and rated for continuity of surfaces,separation of layers, crumb color, grain distribution, rollability,tearing quality, first bite hardness, adhesiveness, masticatoryhardness, cohesiveness, and corn flavor. On the second day, loavesfrom the same treatments were assessed for keeping quality onthe basis of rollability, tearing quality, and cohesiveness after36 hr of storage at room temperature. Panelists were instructedto rinse their mouths with water between samples. Four experi-mental breads, along with a regular wheat bread sample, wereevaluated at each session. Apart from the first and last days,which included one session, two sessions per day were conducted,with the assessments completed over a 10-day period. The assess-ments, replicated twice, were conducted in partitioned boothsequipped with white light.
Statistical AnalysisData were analyzed as outlined by Ylimaki et al (1988, 1991).
For each sensory response measured by the panel, analysis of
TABLE IIIRange of Mean Sensory Response Scores for Gluten-Free Bread
and Reference Wheat Bread'
Range of MeanbRange of Mean Sensory Reference Bread
Response Response Scores' Scores
Frequency of cracks 2.5-4.3 0.5-3.1Separation of layers 13.2-15.0 13.5-15.0Crumb color 7.2-11.1* 0.9-1.2Grain distribution 6.3-9.3* 9.5-11.3Rollabilityic 6.3-13.5* 12.0-14.5Tearingic 6.1-8.9* 7.3-8.5First bite hardnessc 3.8-8.6* 5.3-6.7Adhesivenessc 6.2-10.9* 6.7-8.1Masticatory hardnessc 4.5-12.5* 6.1-8.1Cohesivenessic 6.6-9.7* 8.2-10.7Rollability2 d 2.4-7.4* 12.2-14.5Tearing 2d 1.7-4.5* 5.6-7.2Cohesiveness2 d 1.9-6.1* 6.7-9.2Corn flavor 4.1-6.2 0
aRange over 20 design points. N = 14 (7 panelists X 2 replicates). Maxi-mum score = 15. * = significant differences among scores determinedby ANOVA (P < 0.05).
bN = 70 (7 panelists X 10 replicates).c Sensory attributes judged on fresh bread samples (first day).dSensory attributes judged on aged bread samples (second day).
596 CEREAL CHEMISTRY
variance (ANOVA) was conducted to determine differences amongthe 15 treatment combinations. When the response showedsignificant differences, data were analyzed by multiple regression(MSTAT 1989) to estimate the effect of the variables on thesensory response. The effects were estimated by fitting the designto the second-order regression equations:
Y- bo + b1X1 + b2 X2 + b3 X3 + b11X12+ b2 2 X22
+ b3 3X 32 + bl 2 X1 X2 + b13 X1 X3 + b2 3 X2 X3
where XI = methylcellulose, X2 = gum arabic, and X3 = eggalbumen, including linear, quadratic, and interaction effects.Coefficients of determination (R2) were computed, and theadequacy of models was tested by separating the residual sumof squares into pure error and lack-of-fit (Gacula and Singh 1984).Contour plots, generated by Statgraphics (STSC 1991), wereproduced from the equations by holding the variable with theleast effect on the response equal to a constant value and changingthe other two variables. Each contour plot was compared to thecorresponding reference wheat bread data. Areas on each plotrepresenting rice-corn bread formulations that met referencestandards were identified. Finally, contour plots for the responseswere superimposed to locate gluten-free bread formulations thatmet regular wheat bread standards for the indicated sensorycharacteristics.
RESULTS AND DISCUSSION
The ranges of mean sensory scores, over all treatment com-binations, along with the reference wheat bread, are shown inTable III. ANOVA determined that differences were not significantin frequency of cracks, separation of layers, and corn flavor.Comparison of the mean sensory scores for these responses tothose of the reference revealed that the scores of cracks andseparation of layers fell within the range of the reference. Accord-ingly, gluten-free breads were considered to have met the referencestandards for the aforementioned attributes. All gluten-freeformulations had stronger corn flavor than did the reference bread.
ANOVA determined that differences were significant in crumbcolor, grain distribution, first day rollability (Rollability1 ), firstday tearing quality (Tearing,), first bite hardness, adhesiveness,first day cohesiveness (Cohesiveness,), second day rollability(Rollability 2), second day tearing quality (Tearing2), and secondday cohesiveness (Cohesiveness 2). Accordingly, regression equa-tions were computed for those attributes and are presented inTable IV.
Coefficients of determination (R2 ) indicated that regressionequations accounted for 43-96% of the variance in sensoryresponses. The low R2 values of 0.43 for Cohesiveness 2, 0.57 forcrumb color, and 0.63 for grain distribution suggested that factorsother than the levels of gums and egg albumen affected theresponses. More specifically, the apparent passivity of gums andegg albumen to changes in Cohesiveness2 point to the dominatingrole of starch in shaping the textural properties of bread duringstorage. Moreover, the unexplained variability in crumb colorscores may have resulted from the inherent instability of the qualityscores and the complexity of the judging task. Individual loavesoften exhibited pronounced variations in the intensity of colorin the inner layers. Furthermore, the marginal effects of gumsand egg albumen on the grain distribution are in line with previousobservations in regular wheat breads where grain characteristicswere affected mainly by fermentation variables (Qarooni et al1989). Each regression equation was tested for lack-of-fit.Responses for masticatory hardness, crumb color, Rolling2, Tear-ing2 , and Cohesiveness 2 showed significant lack-of-fit. The lack-of-fit of second-order models was attributed to 1) the hetero-geneity of the error term utilized in the calculation of lack-of-fit between the center point and the other design points (Ylimakiet al 1988); 2) the nonlinearity of the responses over the surveyedarea (Mora-Escobedo et al 1991); 3) the low sensitivity of theresponses to changes in the levels of the independent variables(Chow et al 1988). In spite of their significant lack-of-fit and

low R2 values, second-order models have been effectively utilizedin optimization studies of cereal-based formulations (Shelke etal 1990, Malcolmson et al 1993), presumably due to the explora-tory nature of RSM. Thus, contour plots for responses thatshowed significant differences by ANOVA were generated by hold-ing the value of the variable with the least effect on the responsesconstant at - 1.633, 0 and + 1.633, and varying the levels of methyl-cellulose and egg albumen. Each contour plot was compared tothe reference standards. Areas on the contour plots that repre-sented gluten-free formulations, predicted to meet the range ofreference response values for that specific response were identified.
Gluten-free formulations had a decidedly yellow crumb colorwhen compared to the creamy white crumb of the reference bread,presumably due to the carotenoid pigments present in corn flour(Weber 1987). Inclusion of sodium stearoyl-2-lactylate into thebake mix enhanced the whiteness of the crumb. However, thelevel of addition was limited to 0.25% (flour mass basis), becausehigher concentrations of the surfactant led to a marked deteriora-tion in the textural attributes of experimental breads (Noureddine1993). Gluten-free formulations were less grainy than the refer-ence, with waxy (no cellular structure) patches apparent in theinner surfaces of both layers of the loaf. An effect (albeit non-significant) was noted for gum arabic on the grain distributionof the experimental breads. Thus, while none of the formulationsmet standards at the medium level of gum arabic, regions predictedto fall in the range of the reference were identified at the lowand high levels of the gum. Grain distribution was predicted tomeet that of the reference at methylcellulose-to-egg albumen levelsof <4.2 to >3.9 g and >4.3 to <4.3 g at the -1.633 (1.37 g)and +1.633 (4.63 g) levels of gum arabic, respectively.
The breads' first day rollability (Rollabilityl) was affected moreby changes in methylcellulose concentration than by changes inegg albumen levels. The response was affected slightly by gumarabic; a deterioration in rollability was noted at the extremelevels. Thus, while none of the formulations met reference stan-dards at low levels of gum arabic, treatment combinationsapproached the lower limit of the reference range at the highlevel of the gum. Gluten-free formulations satisfied the referencestandards for Rollability1 at the medium level of gum arabic whenlevels of methylcellulose between 1.37 and 3.30 g and egg albumenconcentrations between 2.18 and 4.40 g were included in the bakemix (Fig. 1, top).
Experimental breads met tearing quality standards at all levelsof gum arabic and at specific combinations of methylcelluloseand egg albumen. At the +1.633 (4.63 g) level of gum arabic,
breads with scores for Tearing1 similar to that of the referencewere obtained in the complement of the subset defined by methyl-cellulose levels of 2.55-4.63 g, and egg albumen concentrationsof 1.90-4.63 g, in the region of methylcellulose >2.18 g and eggalbumen Ž1.60 g. Combinations described by the elliptical curvelocated in the region of methylcellulose levels of >2.60 and 2.18g < egg albumen < 4.20 g satisfied standards at the 0 (3 g) levelof gum arabic. At the lowest level of gum arabic, gluten-freeformulations met the reference criterion for Tearing1 over a widerange of methylcellulose and egg albumen levels. Regions withminimum responses were identified in the uppermost left andlowermost right quadrants at egg albumen levels >2.18 and •1.58 g,respectively (Fig. 1, middle).
The first bite hardness of breads met reference standards overa wide range of egg albumen levels at methylcellulose concentra-tions >2.18 g. At the low and medium levels of gum arabic,formulations with high-low and low-high combinations ofmethylcellulose and egg albumen that were compatible with thereference for the indicated response were identified in the regionof methylcellulose levels of >3.18 g, and at all levels of eggalbumen. Combinations of high levels of methylcellulose and eggalbumen invariably resulted in excessively hard bread. At the+1.633 (4.63 g) level of gum arabic, optimum first bite hardnesswas realized at 2.38 g < methylcellulose levels < 4.10 g overthe full range of egg albumen levels (Fig. 1, bottom).
Apart from the curvature at the low levels of methylcellulose,contour plots for masticatory hardness were similar to those offirst bite hardness. Again, combinations of high and low levelsof methylcellulose and egg albumen that satisfied standards wereobtained at a wide range of egg albumen when methylcelluloseconcentrations of <4.1 g were present in the formula, irrespectiveof gum arabic levels. Low-low and high-high combinations ofmethylcellulose and egg albumen yielded products with excessivesoftness and hardness, respectively.
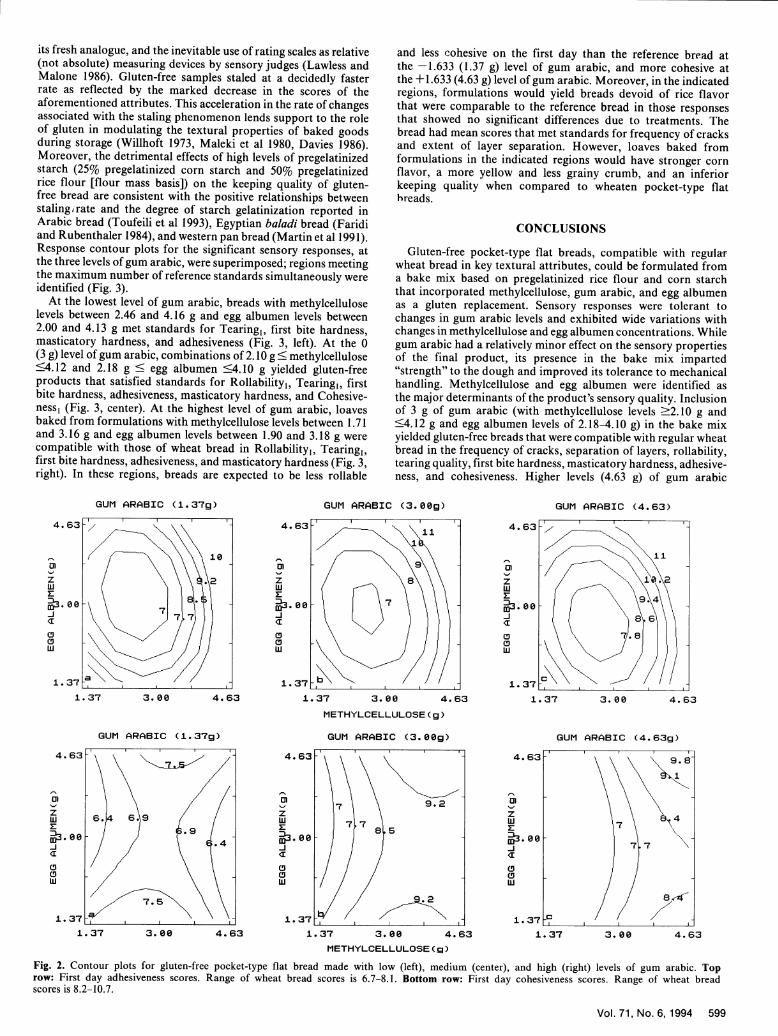
Adhesiveness responses were affected by changes in the levelsof the three variables; the effect of gum arabic was significantat P < 0.05. Combinations meeting the reference standards foradhesiveness were obtained over a wide range of methylcelluloseand egg albumen at the different levels of gum arabic. Increasingconcentrations of gum arabic in the bake mix allowed for optimumresponses to be achieved in narrower regions of methylcelluloseand egg albumen (Fig. 2, top).
The response surface for Cohesiveness, was saddle-shaped, andsimilar values were encountered at various combinations ofminimum and maximum levels of the independent variables (Fig.
TABLE IVRegression Analysisa of Sensory Responses of Gluten-Free Pocket-Type Flat Bread
Grain FirstCrumb Distri- Rolla- Bite Adhesive- Masticatory Cohesive- Rolla- Cohesive-Color bution bilitylb Tearing1b Hardnessb nessb Hardnessb ness1 b bility2 c Tearing2 c ness,2c
bo 6.005 7.400 12.732 7.972 5.696 6.938 5.969 8.596 4.257 3.635 2.680b, 0.118 0.594**e -1.362** 0.582** 1.120** 1.040 1.879** 0.689** -0.962** 0.309* -0.093b2 0.239 -0.098 -0.237 0.130 0.182 0.303* 0.347 0.040 0.454* 0.371* 0.006b3 0.148 0.315 -0.168 -0.097 0.601* 0.315** 0.835** 0.008 -0.387 0.593** -0.327bl, 0.342 0.406 -1.145** -0.427** 0.319 1.128** 0.886** -0.388** 0.523* -0.173 0.714b22 0.316 0.162 -0.483 0.276 -0.103 0.028 0.260 -0.558** 0.055 -0.144 0.394b33 0.550 -0.016 -0.946** -0.569** -0.003 0.815** 0.320 0.289* -0.215 -0.234 0.639b 12 1.512** 0.306 -0.509 0.267 0.256 -0.053 0.169 0.454** 0.177 0.469* 0.459b13 0.154 -0.269 -0.864* 0.347 0.286 0.380* 0.214 0.164 0.357 -0.269 -0.086b23 0.227 -0.081 -0.834* 0.202 -0.119 0.247 0.197 0.057 -0.310 -0.147 -0.216
R2d 0.57 0.63 0.86 0.86 0.78 0.96 0.94 0.91 0.82 0.80 0.43
Equationsignificance ** ** * *** *** *** ** *
Lack-of-fit * * * * *
ay = bo + bix, + b2x2 + b3x3 + b11x12 + b22x2
2 + b33x32 + b12xIx 2 + b1 3xIx3 + b23x2x3 , where xi = methylcellulose, x2 = gum arabic, X3 =
egg albumen.bSensory attributes judged on fresh bread samples (first day).c Sensory attributes judged on aged bread samples (second day).dCoefficient of determination.e* ** *** significant at P < 0.05, P < 0.01, P < 0.001, respectively.
Vol. 71, No. 6,1994 597

2, bottom). Gum arabic notably affected cohesiveness of breadsamples. Thus, while none of the formulations met the referenceCohesiveness, at the low level of gum arabic, the response wassatisfied between methylcellulose levels of >2.90 and <2.18 gover the full range of egg albumen, and in the range of 2.80 g< methylcellulose levels <4.40 g, with egg albumen concentrations<1.80 g, and at methylcellulose levels >2.80 g and egg albumen>3.82 g, at the 0 (3 g) level of gum arabic. At the +1.633 (4.63 g)level of gum arabic, Cohesiveness, met reference standards atmethylcellulose levels of >3.81 g, egg albumen levels of <2.90 g,and in the region defined by methylcellulose and egg albumenlevels >3.15 g and >2.80 g, respectively.
Although the rollability, tearing quality, and cohesiveness afterovernight storage of the experimental breads were predicted to
be realized with specific combinations of the independent variables(plots not shown), none of the formulations met the referencecriteria for the indicated attributes (Table II). All gluten-freeformulations cracked extensively upon application of stress, hada markedly reduced ability to resist shearing forces, and werenotably less cohesive when compared to regular bread aged fora similar interval of time.
The deterioration in rollability, tearing quality, and cohesive-ness of breads upon storage have been used by different workersas indicators of the rate of staling (Qarooni et al 1987, Quailet al 1991). The relatively small differences in rollability, tearing,and cohesiveness in the reference wheaten sample after overnightstorage that were observed in this study may have resulted fromits simultaneous rating with the experimental breads, rather than
GUM ARABIC (1.37g) GUM ARABIC (3.00g)
l l I 14.63
1 . 3 7 1a I , , ,
1.37 3.00 4.63
GUM ARABIC (1.37g)
GUM ARABIC (4.63g)
4.63
Li 11
1.37 b
1.37 3.00 4.63
METHYLCELLULOSE(g)
GUM ARABIC (3.00g)
01-z
'L23.
CDllJ
1.37 3.00
GUM ARABIC (4.63g)
1.37 3.00 4.63 1.37 3.00 4.63
METHYLCELLULOSE(g)
GUM ARABIC (1.37g) GUM ARABIC (3.00g) GUM ARABIC (4.63g)
17 / I I I I 1.37Fb -a- \ \
01
z
LUE23.
<1
LUI
1. J_( J. 0 0 4.uJ 61.37 3.00 4.63 1.37 3.00 4.63
METHYLCELLULOSE(g)
Fig. 1. Contour plots for gluten-free pocket-type flat bread made with low (left), medium (center) and high (right)'levels of gum arabic. Top row:First day rollability scores. Range of wheat bread scores is 12.0-14.5. Middle row: First day tearing quality scores. Range of wheat bread scoresis 7.3-8.5. Bottom row: First bite hardness (first day) scores. Range of wheat bread scores is 5.3-6.7.
598 CEREAL CHEMISTRY
4.
01-
z
3.1
00LU
4.63
1.37 3.00 4.63
I
-
its fresh analogue, and the inevitable use of rating scales as relative(not absolute) measuring devices by sensory judges (Lawless andMalone 1986). Gluten-free samples staled at a decidedly fasterrate as reflected by the marked decrease in the scores of theaforementioned attributes. This acceleration in the rate of changesassociated with the staling phenomenon lends support to the roleof gluten in modulating the textural properties of baked goodsduring storage (Willhoft 1973, Maleki et al 1980, Davies 1986).Moreover, the detrimental effects of high levels of pregelatinizedstarch (25% pregelatinized corn starch and 50% pregelatinizedrice flour [flour mass basis]) on the keeping quality of gluten-free bread are consistent with the positive relationships betweenstalingirate and the degree of starch gelatinization reported inArabic bread (Toufeili et al 1993), Egyptian baladi bread (Faridiand Rubenthaler 1984), and western pan bread (Martin et al 1991).Response contour plots for the significant sensory responses, atthe three levels of gum arabic, were superimposed; regions meetingthe maximum number of reference standards simultaneously wereidentified (Fig. 3).
At the lowest level of gum arabic, breads with methylcelluloselevels between 2.46 and 4.16 g and egg albumen levels between2.00 and 4.13 g met standards for Tearing,, first bite hardness,masticatory hardness, and adhesiveness (Fig. 3, left). At the 0(3 g) level of gum arabic, combinations of 2.10 g < methylcellulose<4.12 and 2.18 g < egg albumen <4.10 g yielded gluten-freeproducts that satisfied standards for Rollabilityl, Tearing1 , firstbite hardness, adhesiveness, masticatory hardness, and Cohesive-ness, (Fig. 3, center). At the highest level of gum arabic, loavesbaked from formulations with methylcellulose levels between 1.71and 3.16 g and egg albumen levels between 1.90 and 3.18 g werecompatible with those of wheat bread in Rollabilityl, Tearing1 ,first bite hardness, adhesiveness, and masticatory hardness (Fig. 3,right). In these regions, breads are expected to be less rollable
and less cohesive on the first day than the reference bread atthe -1.633 (1.37 g) level of gum arabic, and more cohesive atthe +1.633 (4.63 g) level of gum arabic. Moreover, in the indicatedregions, formulations would yield breads devoid of rice flavorthat were comparable to the reference bread in those responsesthat showed no significant differences due to treatments. Thebread had mean scores that met standards for frequency of cracksand extent of layer separation. However, loaves baked fromformulations in the indicated regions would have stronger cornflavor, a more yellow and less grainy crumb, and an inferiorkeeping quality when compared to wheaten pocket-type flatbreads.
CONCLUSIONS
Gluten-free pocket-type flat breads, compatible with regularwheat bread in key textural attributes, could be formulated froma bake mix based on pregelatinized rice flour and corn starchthat incorporated methylcellulose, gum arabic, and egg albumenas a gluten replacement. Sensory responses were tolerant tochanges in gum arabic levels and exhibited wide variations withchanges in methylcellulose and egg albumen concentrations. Whilegum arabic had a relatively minor effect on the sensory propertiesof the final product, its presence in the bake mix imparted"strength" to the dough and improved its tolerance to mechanicalhandling. Methylcellulose and egg albumen were identified asthe major determinants of the product's sensory quality. Inclusionof 3 g of gum arabic (with methylcellulose levels >2.10 g and<4.12 g and egg albumen levels of 2.18-4.10 g) in the bake mixyielded gluten-free breads that were compatible with regular wheatbread in the frequency of cracks, separation of layers, rollability,tearing quality, first bite hardness, masticatory hardness, adhesive-ness, and cohesiveness. Higher levels (4.63 g) of gum arabic
GUM ARABIC (1.37g)
4.63f- _ \ \\ d
3.00 4.63
4.63
GUM ARABIC (3.00g)
,' -,\ \ JJ11
01-z111ER3.00
'3<110U]
1.37 b\ \ / j /j1.37 3.0O0 4.63
METHYLCELL.ULOSE(g)
3.00 4.63
GUM ARABIC (3.00g)I I I~~~~~~~~~~~~~~~~~~~~~~~~~
17pS / I/-
1.37 3.00 4.63
METHYLCELLULOSE ( g)
GUM ARABIC (4.63g)
01-
7all
<rR3.00
-J
'I
0UJ
1.37 _C I I 11.37 3.00 4.63
Fig. 2. Contour plots for gluten-free pocket-type flat bread made with low (left), medium (center), and high (right) levels of gum arabic. Toprow: First day adhesiveness scores. Range of wheat bread scores is 6.7-8.1. Bottom row: First day cohesiveness scores. Range of wheat breadscores is 8.2-10.7.
Vol. 71, No. 6,1994 599
01-
z
Lil
b3.00
<C
C110
GUM ARABIC (4.63)
4.63 __ '
1.37
1.37
4.
GUM ARABIC (1.37g)
1.37 3.00
01-
z
13.00
I'll
4.63
1.37 d
1.37
-F
I
I
I

4.63f-
3.00k
-1.37 kI 3 I 3 . I I
1.37 3.00 4.63
METHYLCELLULOSE (g)
Fig. 3. Superimposed contour plot for the sensory responses of gluten-free pocket-type flat bread made with gum arabic. Left: 1.37 g of gumarabic. Shaded region met reference standards for continuity of surfaces, separation of layers, adhesiveness, and first day tearing quality, first bitehardness, and masticatory hardness. Center: 3 g of gum arabic. Shaded region met reference standards for continuity of surfaces, separation oflayers, adhesiveness, and first day tearing quality, rollability, cohesiveness, first bite hardness, and masticatory hardness. Right: 4.63 g of gum arabic.Shaded region met reference standards for continuity of surfaces, separation of layers, adhesiveness, and first day tearing quality, rollability, firstbite hardness, and masticatory hardness.
resulted in more cohesive products. Lower levels (1.37 g) of thegum arabic resulted in loaves that were less cohesive and inferiorto wheat bread in rollability. All breads possessed a perceptiblecorn flavor, a light-yellow crumb with apparent waxy patches,and a faster rate of staling than that of regular wheat bread.
ACKNOWLEDGMENT
We gratefully acknowledge the help of I. Van Damme (Reading Univer-sity Scientific Services, UK) with the viscoamylograph and particle sizedistributions studies, and the URB of AUB for the financial support.
LITERATURE CITED
AL-HASSANY, M. 1975. Celiac disease in Iraki children. J. Trop. Pediatr.21: 178-179.
AMERICAN ASSOCIATION OF CEREAL CHEMISTS. 1983.Approved Methods of the AACC, 8th ed. Methods 08-01, 30-10, 44-15A, 46-12, 54-21. The Association: St. Paul, MN.
BITAR, G. J., SALEM, A. A., and NASR, A. T. 1970. Celiac diseasefrom the Middle East. Leban. Med. J. 23:423-444.
CHIANG, B.-Y., and JOHNSON, J. A. 1977. Measurement of total andgelatinized starch by glucoamylase and O-toluidine reagent. CerealChem. 54:429-435.
CHOW, E. T. S., NEIL, L. S., DEVOR, R. E., and STEINBERG, M.P. 1988. Performance of ingredients in a soybean whipped topping:A response surface analysis. J. Food Sci. 53:1761-1765.
DAVIES, A. P. 1986. Protein functionality in bakery products. Pages89-104 in: Chemistry and Physics of Baking. J. M. V. Blanshard, P.J. Frazier, and T. Galliard, eds. J. W. Arrowsmith Ltd.: Bristol, England.
EGGLESTON, G. O., OMAKA, P. E., and IHEDIOHA, D. 0. 1992.Development and evaluation of products from cassava flour as newalternatives to wheaten breads. J. Sci. Food Agric. 59:377-385.
FARIDI, H. A. 1988. Flat breads. Pages 457-506 in: Wheat: Chemistryand Technology, Vol. 2, 3rd Ed. Y. Pomeranz, ed. Am. Assoc. CerealChem.: St. Paul, MN.
FARIDI, H. A., and RUBENTHALER, G. A. 1984. Effect of bakingtime and temperature on bread quality, starch gelatinization, and stalingof Egyptian baladi bread. Cereal Chem. 61:151-154.
GACULA, M. C., JR., and SINGH, J. 1984. Statistical Methods in Foodand Consumer Research. Academic Press: New York.
KIM, J. C., and DE RUITER, D. 1968. Bread from non-wheat flours.Food Technol. 22:867-878.
KWAN, W.-O., and KOWALSKI, B. R. 1980. Data analysis of sensoryscores. Evaluations of panelists and wine score cards. J. Food Sci.45:213-216.
LAWLESS, H. T., and MALONE, G. J. 1986. A comparison of ratingscales: Sensitivity, replicates and relative measurements. J. Sens. Stud.1:155-174.
MALCOLMSON, L. J., MATSUO, R. R., and BALSHAW, R. 1993.
600 CEREAL CHEMISTRY
Effects of drying temperature and farina blending on spaghetti qualityusing response surface methodology. Cereal Chem. 70:1-7.
MALEKI, M., and DAGHIR, S. 1967. Effect of baking on retentionof thiamine, riboflavin, and niacin in arabic bread. Cereal Chem. 44:483-487.
MALEKI, M., HOSENEY, R. C., and MATTERN, P. J. 1980. Effectsof loaf volume, moisture content and protein quality on the softnessand staling rate of bread. Cereal Chem. 57:138-140.
MARTIN, M. L., ZELEZNAK, K. J., and HOSENEY, R. C. 1991. Amechanism of bread firming. I. Role of starch swelling. Cereal Chem.68:498-503.
MEILGAARD, M., CIVILLE, G. V., and CARR, B. T. 1987. SensoryEvaluation Techniques. CRC Press: Boca Raton, FL.
MORA-ESCOBEDO, R., PAERDES-LOPEZ, P., and DOMINGUEZ,J. 1991. Optimization of a germination procedure by response surfacemethodology. Lebensm. Wiss. Technol. 28:518-522.
MSTAT. 1989. User's guide: A microcomputer program for the design,management, and analysis of agronomic research experiments. Version5.0. Michigan State University: East Lansing.
NOUREDDINE, A. 1993. Optimization of structure-supporting agentsin gluten-free pocket-type flat-breads by response surface methodology.MS thesis. American University of Beirut: Lebanon.
POWERS, J. J. 1984. Using general statistical programs to evaluatesensory data. Food Technol. 38:74-82, 84.
QAROONI, J., ORTH, R. A., and WOOTTON, M. 1987. A test bakingtechnique of arabic bread quality. J. Cereal Sci. 6:81-90.
QAROONI, J., MISKELLI, Y. D., and WOOTTON, M. 1989. Factorsaffecting the quality of arabic bread: Fermentation variables. J. Sci.Food Agric. 48:99-109.
QUAIL, K. J., McMASTER, G. J., and WOOTTON, M. 1991. Flourquality tests for selected wheat cultivars and their relationship to arabicbread quality. J. Sci. Food Agric. 54:99-110.
RANHOTRA, G. S., LOEWE, R. J., and PUYAT, L. V. 1975. Prepara-tion and evaluation of soy-fortified gluten free bread. J. Food Sci.40:62-64.
RASPER, V. 1980. Theoretical aspects of amylographology. Pages 1-6in: The Amylograph Handbook. W. C. Shuey and K. H. Tipples, eds.Am. Assoc. Cereal Chem.: St. Paul, MN.
SARAKBI, M. 1985. Formulation and nutritive value of arabic breadprepared for uremia, cirrhosis and gluten intolerance diseases. MSthesis. American University of Beirut: Lebanon.
SHELKE, K., DICK, J. W., HOLM, Y. F., and LOO, K. S. 1990. Chinesewet noodle formulation: A response surface methodology study. CerealChem. 67:338-342.
SMITH, E. B. 1971. Gluten free breads for patients with uremia. J. Am.Diet. Assoc. 59:572-574.
STSC. 1991. Statgraphics. Version 5.0. Statistical Graphics Corporation:Rockville, MD.
SULIMAN, G. E. 1978. Celiac disease in Sudanese children. Gut 19:121-125.SULTAN, W. J. 1969. Practical Baking, 2nd ed. Avi Publishing: Westport, CT.TOUFEILI, I., SLEIMAN, G., and ABU SALMAN, R. 1993. Correlation
4.&3 1

of selected biochemical, chemical and physicochemical parameters andsensory perception of staling in arabic bread. Lebensm. Wiss. Technol.26:34-37.
VAISEY-GENSER, M., YLIMAKI, G., and JOHNSON, B. 1987. Theselection of canola oil, water, and an emulsifier system in cake formula-tions by response surface methodology. Cereal Chem. 64:50-54.
WEBER, E. J. 1987. Lipids of the kernel. Pages 311-349 in: Corn:Chemistry and Technology. S. A. Watson and P. E. Ramstad, eds.Am. Assoc. Cereal Chem.: St. Paul, MN.
WILLHOFT, E. M. A. 1973. Mechanism and theory of staling of breadand baked goods, and associated changes in textural properties. J.
Texture Stud. 4:292-322.WILLIAMS, P. C., EL-HARMEIN, F. J., NELSON, W., and
SRIVASTAVA, P. J. 1988. Evaluation of wheat quality for the bakingof Syrian-type two-layered flat breads. J. Cereal Sci. 7:195-207.
YLIMAKI, G., HAWRYSH, Z. J., HARDIN, R. T., and THOMSON,A. B. R. 1988. Application of response surface methodology to thedevelopment of rice flour yeast breads: Objective measurements. J.Food Sci. 53:1800-1805.
YLIMAKI, G., HAWRYSH, Z. J., HARDIN, R. T., and THOMSON,A. B. R. 1991. Response surface methodology in the development ofrice flour yeast breads: Sensory evaluation. J. Food Sci. 56:751-755.
[Received January 24, 1994. Accepted July 12, 1994.]
SOFT WHEAT PRODUCTS
Association of Sugar-Snap Cookie Quality with High Molecular WeightGlutenin Alleles in Soft White Spring Wheats'
E. SOUZA,2 3 M. KRUK, 2 and D. W. SUNDERMAN 2'4
ABSTRACT Cereal Chem. 71(6):601-605
High molecular weight glutenins (HMW-G/u) affect the quality of leaven derived from previously published research. The glutenin strength (GRSbreads produced from wheat (Triticum aestivum L.) flour. However, score) of cultivars and breeding lines was negatively correlated to cookieeffects of these proteins on pastry quality are poorly understood. Sugar- diameter (b = 0.02 cm unit-'; P < 0.05). The negative correlation betweensnap cookie quality was compared to HMW-Glu alleles of soft white GRS score and cookie diameter was greatest in the year with the lowestspring wheat breeding lines and cultivars from multiple trials over four average flour protein content and least in the year with the highest averageyears at Aberdeen, ID. Sugar-snap cookie quality was affected less by protein content. The effect of allelic variation was probably masked inthe composition of the flour protein than by the quantity of flour protein. the years with high average protein content due to the overriding effectsIndividual alleles did not have significant effects on cookie diameter, of total protein content. Selection for cultivars with low GRS scoresexcept for the 13+19 allele of the Glu- 1 B locus, which was associated may produce cultivars with better and more predictable sugar-snap cookiewith smaller cookie diameters. The glutenin strength of alleles at the quality.three HMW-Glu loci was estimated using a glutenin rank sum (GRS)
Quality of pastry wheat (Triticum aestivum L.) can be assessedthrough indirect tests such as alkaline water retention or particlesize index, or directly by baking test products such as standardizedcookies, crackers, sponge cakes, or udon noodles (Hoseney etal 1988). The protein content of a soft wheat flour is also usedas a predictor of the flour quality (Finney et al 1987). Phenotypiccorrelation of protein percentage and pastry quality is stronglynegative. However, the genotypic correlation between a cultivar'sflour protein and pastry quality is generally poor within a popula-tion of improved soft wheat cultivars. Patterson and Allan (1981)identified genotypes with quite high protein content and goodpastry characteristics. Strength of the gluten developed by a flour'sprotein is negatively associated with pastry quality, as measuredby sugar-snap cookies. Alveograph dough strength (P value) hasbeen found to be negatively correlated to cookie quality and couldbe used to predict residual effects from a simple linear modelof flour protein content estimation of cookie spread (Bettge et
'Manuscript 94708 of the Idaho Agricultural Experiment Station. Researchsupported in part by Hatch Project H962.2Dept. of Plant, Soils, and Entomological Science, University of Idaho, AberdeenResearch and Extension Center.
'Corresponding author.4Retired.
This article is in the public domain and not copyrightable. It may be freelyreprinted with customary crediting of the source. American Association ofCereal Chemists, Inc., 1994.
al 1989). The composition of the flour protein, therefore, maydetermine, in part, the intrinsic pastry quality of a cultivar.
The high molecular weight glutenin alleles (HMW-Glu) area class of genes that can influence gluten strength. Three homeo-allelic loci for HMW-Glu are located on chromosomes IA, lB,and 1 D (respectively Glu-1A, Glu-l B, and Glu-l D). Each locusis complex, conferring zero to two distinct proteins (Graybosch1992). Allelic variation is noted by numbering each HMW-Glusequentially, based on mobility in sodium dodecyl sulfate poly-"acrylamide gel electrophoresis (SDS-PAGE) (Payne 1987).
The effect of HMW-Glu alleles on end-use quality of soft orpastry-type wheats has had little attention previously. However,the HMW-Glu allelic variation in hard wheats can significantlyinfluence bread-baking quality (Payne 1987). Cressey et al (1987),for example, compared two allelic variants for the Glu- 1D locus,2+12 and 5+10, and found an average of 5% greater loaf volumein cultivars with the 5+10 allele than in cultivars with the 2+12allele. Payne et al (1984) summarized previous work on the generaleffects of HMW-Glu loci on bread wheat quality. At the Glu-lAlocus, the null allele is inferior to the 2* and 1 allele, with the2* and 1 alleles approximately equal in effect (null < 2* = 1).The alleles of the Glu- 1 B locus with known effects on bread qualityare: (in order of increasing favorable effects) 6+8 < 7 < 7+9< 17+18 = 13+16 = 7+8. The third locus, Glu-lD, has twocommon alleles, 2+12 and 5+10, of which 5+10 is the morefavorable for bread quality. The alternate alleles at the Glu-1Dlocus 3+12 and 4+12 have been found to be less favorable forbread quality than either the 2+12 or 5+10 alleles. Payne et al
Vol. 71, No. 6,1994 601