formal modeling and analysis of the hexosamine … 1 march 2016 accepted 19 july 2016 published 27...
TRANSCRIPT
Submitted 1 March 2016Accepted 19 July 2016Published 27 September 2016
Corresponding authorsJamil Ahmad,[email protected] Kanwal,[email protected] Ali, [email protected]
Academic editorWei Xu
Additional Information andDeclarations can be found onpage 23
DOI 10.7717/peerj.2348
Copyright2016 Saeed et al.
Distributed underCreative Commons CC-BY 4.0
OPEN ACCESS
Formal modeling and analysis of thehexosamine biosynthetic pathway: role ofO-linked N-acetylglucosamine transferasein oncogenesis and cancer progressionMuhammad Tariq Saeed1, Jamil Ahmad1,2, Shahzina Kanwal3,Andreana N. Holowatyj4, Iftikhar A. Sheikh1, Rehan Zafar Paracha1,Aamir Shafi5,6, Amnah Siddiqa1, Zurah Bibi1, Mukaram Khan1 and Amjad Ali7
1Research Centre for Modeling and Simulation (RCMS), National University of Sciences and Technology(NUST), Islamabad, Pakistan
2 School of Computer Science and IT, Stratford University, VA, United States3Guangzhou Institutes of Biomedicine and Health, Chinese Academy of Sciences, Guangzhou, China4Department of Oncology, Wayne State University School of Medicine and Barbara Ann Karmanos CancerInstitute, Detroit, MI, United States
5 School of Electrical Engineering and Computer Science (SEECS), National University of Sciences andTechnology (NUST), Islamabad, Pakistan
6College of Computer Science and Information Technology, University of Dammam, Al Khobar,Kingdom of Saudi Arabia
7Atta-ur-Rehman School of Applied Bio-science (ASAB), National University of Sciences and Technology(NUST), Islamabad, Pakistan
ABSTRACTThe alteration of glucose metabolism, through increased uptake of glucose andglutamine addiction, is essential to cancer cell growth and invasion. Increased flux ofglucose through the Hexosamine Biosynthetic Pathway (HBP) drives increased cellularO-GlcNAcylation (hyper-O-GlcNAcylation) and contributes to cancer progression byregulating key oncogenes. However, the association between hyper-O-GlcNAcylationand activation of these oncogenes remains poorly characterized. Here, we implementa qualitative modeling framework to analyze the role of the Biological RegulatoryNetwork in HBP activation and its potential effects on key oncogenes. Experimentalobservations are encoded in a temporal language format and model checking is appliedto infer themodel parameters and qualitativemodel construction. Using this model, wediscover step-wise genetic alterations that promote cancer development and invasiondue to an increase in glycolytic flux, and reveal critical trajectories involved in cancerprogression. We compute delay constraints to reveal important associations betweenthe production and degradation rates of proteins. O-linked N-acetylglucosaminetransferase (OGT), an enzymeused for addition ofO-GlcNAc duringO-GlcNAcylation,is identified as a key regulator to promote oncogenesis in a feedbackmechanism throughthe stabilization of c-Myc. Silencing of the OGT and c-Myc loop decreases glycolyticflux and leads to programmed cell death. Results of network analyses also identify asignificant cycle that highlights the role of p53-Mdm2 circuit oscillations in cancerrecovery and homeostasis. Together, our findings suggest that the OGT and c-Mycfeedback loop is critical in tumor progression, and targeting these mediators mayprovide a mechanism-based therapeutic approach to regulate hyper-O-GlcNAcylationin human cancer.
How to cite this article Saeed et al. (2016), Formal modeling and analysis of the hexosamine biosynthetic pathway: role of O-linked N-acetylglucosamine transferase in oncogenesis and cancer progression. PeerJ 4:e2348; DOI 10.7717/peerj.2348

Subjects Computational Biology, OncologyKeywords Biological regulatory networks (BRNs), René Thomas, Qualitative modeling, Modelchecking, Cancer, Hexosamine biosynthetic pathway, O-GlcNAcylation, OGT, SMBioNet
INTRODUCTIONCancer, a diverse group of diseases caused by an accumulation of genetic alterations thatleads to abnormal cellular growth, ranks as a leading cause of death worldwide (WorldHealth Organization, 2014). Genetic alterations result in activating oncogenes andinactivating tumor suppressor genes to regulate gene expression and support tumorprogression. Oncogenes such as MYC, PI3K, and EGFR, are activated throughmechanisms that include genetic translocation, amplification, DNA methylation, andhistone modifications (Negrini, Gorgoulis & Halazonetis, 2010; Hanahan &Weinberg,2011; Jones & Baylin, 2007). Repression of tumor suppressors such as p53 and PTEN isacquired through various chromatin modifications, deletions, and point mutations (Walsh& King, 2007). However, understanding the role of these aberrations in tumorigenesis isdifficult as studies have shown that genomic alterations tend to be cancer-specific anddrastically differ between human tumor types.
Despite the heterogeneity and complexity of these malignancies, key functions in tumordevelopment are common. These hallmarks of cancer include: acquiring resistance towardprogrammed cell death (PCD), uncontrolled cell proliferation, reprogramming cellularmetabolism to support chronic neoplastic proliferation, and activation of inflammatoryresponses to enable tumor growth (Hanahan &Weinberg, 2000; Hanahan &Weinberg,2011). These nearly universal capabilities of cancer cells promote tumorigenesis andunderlie the fundamentals of cancer biology. Thus, analyzing these network interactionsand mechanisms of tumorigenesis will drive therapeutic development to selectively targetthese hallmark traits.
Metabolic reprogramming and oncogenesisThe capability of tumors to reprogram cellular metabolism and promote uncontrolledproliferation has only recently emerged as a cancer hallmark (Hanahan &Weinberg, 2011;Cairns, Harris & Mak, 2011; Dang, 2012). However, alterations of energy metabolism incancer cells to stimulate cell growth and division first observed by Otto Warburg date backto the early twentieth century (Warburg, 1910; Weinhouse et al., 1956; Warburg, 1956). Tofuel growth, tumor cells flip a metabolic switch to reprogram glucose metabolism fromoxidative phosphorylation to aerobic glycolysis, and secrete lactate (‘‘Warburg-effect’’).While glycolysis produces adenosine 5′-triphosphate (ATP) faster, this process occursat a less efficient rate. To compensate for this metabolic switch, neoplastic cells becomeaddicted to glucose and glutamine to maintain rapid cell proliferation (Potter, 1958;VanderHeiden, Cantley & Thompson, 2009; DeBerardinis et al., 2007; Lunt & Vander Heiden, 2011;Mullen et al., 2012; DeBerardinis et al., 2008). This phenomenon of increased glycolyticflux and glucose uptake importantly increases flux into biosynthetic pathways, such as theHexosamine Biosynthetic Pathway (HBP) (Fig. 1).
Studies have also found an association between glycolytic fueling and mutant tumorsuppressors or activated oncogenes that play critical roles in evading apoptosis and
Saeed et al. (2016), PeerJ, DOI 10.7717/peerj.2348 2/32
GLU
UDP-GlcNAC UDP
OGT
OGA
Paxillin ILK
FAK PI3K
Integrins
IRS-1
PIP3
PDK1
Gab-2
Gab1 PI3K
RTK
Jak-1 PI3K
Cytokine Receptor
PI3K
AKTAKT
TPL2 IKK-α
NFkB
CD19 Growth factor Receptor
PI3K
FOXO3A FOXM1
NucleusNFkB
P53 P21Cip1/Waf1
Rb
E2F
TPL2 IKK-α
TPL2
c-Myc
Genotoxic Stress
MDM2
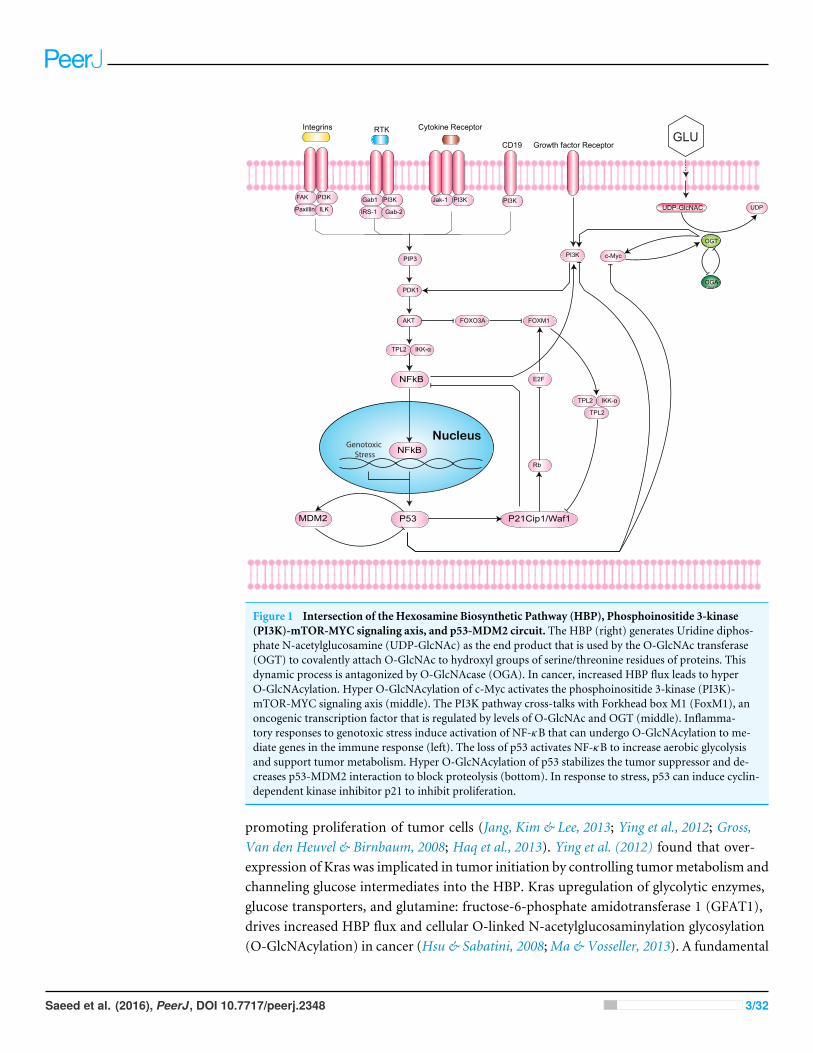
Figure 1 Intersection of the Hexosamine Biosynthetic Pathway (HBP), Phosphoinositide 3-kinase(PI3K)-mTOR-MYC signaling axis, and p53-MDM2 circuit. The HBP (right) generates Uridine diphos-phate N-acetylglucosamine (UDP-GlcNAc) as the end product that is used by the O-GlcNAc transferase(OGT) to covalently attach O-GlcNAc to hydroxyl groups of serine/threonine residues of proteins. Thisdynamic process is antagonized by O-GlcNAcase (OGA). In cancer, increased HBP flux leads to hyperO-GlcNAcylation. Hyper O-GlcNAcylation of c-Myc activates the phosphoinositide 3-kinase (PI3K)-mTOR-MYC signaling axis (middle). The PI3K pathway cross-talks with Forkhead box M1 (FoxM1), anoncogenic transcription factor that is regulated by levels of O-GlcNAc and OGT (middle). Inflamma-tory responses to genotoxic stress induce activation of NF-κB that can undergo O-GlcNAcylation to me-diate genes in the immune response (left). The loss of p53 activates NF-κB to increase aerobic glycolysisand support tumor metabolism. Hyper O-GlcNAcylation of p53 stabilizes the tumor suppressor and de-creases p53-MDM2 interaction to block proteolysis (bottom). In response to stress, p53 can induce cyclin-dependent kinase inhibitor p21 to inhibit proliferation.
promoting proliferation of tumor cells (Jang, Kim & Lee, 2013; Ying et al., 2012; Gross,Van den Heuvel & Birnbaum, 2008; Haq et al., 2013). Ying et al. (2012) found that over-expression of Kras was implicated in tumor initiation by controlling tumormetabolism andchanneling glucose intermediates into the HBP. Kras upregulation of glycolytic enzymes,glucose transporters, and glutamine: fructose-6-phosphate amidotransferase 1 (GFAT1),drives increased HBP flux and cellular O-linked N-acetylglucosaminylation glycosylation(O-GlcNAcylation) in cancer (Hsu & Sabatini, 2008;Ma & Vosseller, 2013). A fundamental
Saeed et al. (2016), PeerJ, DOI 10.7717/peerj.2348 3/32

role of the HBP is to control O-GlcNAcylation. O-GlcNAcylation is a post-translationalmodification catalyzed by O-GlcNAc-transferase (OGT) that covalently adds a GlcNAcsugar moiety to hydroxyl groups of serine/threonine residues of proteins (Torres & Hart,1984; Hart, Housley & Slawson, 2007; Issad & Kuo, 2008). This process is antagonized byO-GlcNAcase (OGA), which allows for dynamic regulation of O-GlcNAcylation in cells(Fig. 1).
Recently, O-GlcNAcylation has been proposed as a novel cancer hallmark and approachfor cancer treatment due to its significant regulatory role in tumorigenesis (Fardini et al.,2013). Increased O-GlcNAcylation, termed hyper O-GlcNAcylation, and elevated OGTlevels have been observed in various tumor types, including cancers of the breast, lung,liver, bladder, endometrial, prostate, pancreas, and colon (Ying et al., 2012; Gu et al., 2010;Mi et al., 2011; Zhu et al., 2012; Rozanski et al., 2012; Krześlak et al., 2012b; Lynch et al.,2012). Importantly, the inhibition of OGT has been associated with decreased proliferationof breast and prostate cancer cells (Caldwell et al., 2010; Itkonen et al., 2013). Understandingthe proteins that control deregulation of cellular energy metabolism and hyper O-GlcNAcylation is needed to elucidate the mechanisms of metabolic switch in cancercells, characterize the glycolytic phenotype, and decipher the link to cellular growth andapoptotic pathways.
Signaling pathwaysThe ability of tumors to promote an inflammatory response and escape immune destructionalso enables cellular proliferation and evasion of innate immunity (Dvorak, 1986; Colottaet al., 2009; Hanahan &Weinberg, 2011; Markert, Levine & Vazquez, 2012; Kroemer &Pouyssegur, 2008). Inflammation is the protective response of the innate immune system toa physiological, physical, and/or oxidative stress. The development of innate immunity isassociated with the NF-κB signaling cascade, where NF-κB is activated through subunits ofthe IKK complex in response to stimuli (Karin, 2009; Hoesel & Schmid, 2013). Activationof NF-κB targets and eliminates transformed cells, Disis (2010) supporting subsequentincreases in apoptotic processes as an inflammatory response (Ernst, 1999; Cordon-Cardo & Prives, 1999). Further studies revealed additional roles of NF-κB in controllingnormal cellular and malignant processes, such as proliferation, apoptosis, and metabolism(Guttridge et al., 1999; La Rosa, Pierce & Sonenshein, 1994; Perkins, 1997; Moretti et al.,2012; Kawauchi et al., 2009; Kawauchi et al., 2008).
The subunits of NF-κB contain sites for post-translational modifications to promotecross-talk with signaling pathways. O-GlcNAcylation of the c-Rel subunit of NF-κB wasrecently demonstrated to mediate the expression of various cytokine-encoding genesinvolved in the immune response (Alexandrov et al., 2013). More recent studies have notedthat expression of OGT, the enzyme that catalyzes O-GlcNAcylation, is correlated withc-Myc protein levels and may be involved in protein stabilization (Itkonen et al., 2013).
c-Myc belongs to the PI3K-mTOR-MYC signaling pathway, one of the most commonlymutated pathways in cancer (Fig. 1). Activation of this signaling cascade has been shown toincrease hyper O-GlcNAcylation activity in breast cancer (Sodi et al., 2015). Notably,treatment of tumor cells with PI3K and mTOR inhibitors led to decreased protein
Saeed et al. (2016), PeerJ, DOI 10.7717/peerj.2348 4/32
expression of OGT and overall lower levels of O-GlcNAcylation. The PI3K pathway has alsobeen reported to cross-talk with Forkhead box M1 (FoxM1), an oncogenic transcriptionfactor (Major, Lepe & Costa, 2004). FoxM1 plays a critical role in cancer metabolism, asthe reduction of O-GlcNAc levels and OGT in cancer cells is associated with a decrease inprotein expression of FoxM1 in breast cancer (Caldwell et al., 2010). However, studies todate have not detected O-GlcNAc modifications on FoxM1.
In addition toNF-κB and c-Myc, p53 has also been shown to be directlyO-GlcNAcylated.p53 plays critical roles in DNA damage repair and apoptosis, and is one of the mostfrequently mutated genes in cancer. Hyper O-GlcNAcylation of p53 stabilizes the tumorsuppressor and decreases p53-MDM2 interaction to block proteolysis (Fig. 1) (Yang et al.,2006). In contrast, overexpression of OGA, the antagonist to OGT, stimulates MDM2-p300interaction and degrades p53 (Soesanto et al., 2008). Consequently, loss of p53 activatesNF-κB to increase aerobic glycolysis and support tumor metabolism (Kawauchi et al.,2008). Under stress, p53 can induce cyclin-dependent kinase inhibitor p21 to arrest the cellcycle and inhibit proliferation (Gartel & Tyner, 1999). Taken together, disentangling thecomplex interplay between NF-κB, c-Myc, p53, MDM2, FoxM1, p21, and OGT is criticalto understanding the roles of hyper O-GlcNAcylation, pathway signaling and cross-talk,metabolism, and programmed cell death in cancer.
Our contributionIn this study, we examine the role of hyper O-GlcNAcylation in cancer progression byregulating the activation of oncogenes. We construct a qualitative Biological RegulatoryNetwork (BRN) comprised of important entities involved in O-GlcNAc signaling todemonstrate activation and inhibition relationships. Model parameters are computedfrom known experimental observations by using a formal verification technique, calledmodel checking. These parameters are used to translate BRN into a qualitative modelwhich highlights important behaviors as trajectories, stable states, and cycles. Networkanalysis of the qualitative model is performed to identify important trajectories involvedin oncogenic activation, cancer progression, and recovery. We identify significant cyclesthat represent normal behavior of the overall system and use hybrid modeling to computedelay constraints, which limit the system to maintain homeostasis. A similar modelingapproach has been used in the past for formal modeling of biological networks, includingthe MAL-Associated Biological Regulatory Network (BRN) (Ahmad et al., 2012), theregulatory network of dengue virus pathogenesis and clearance (Aslam et al., 2014), themechanism of tail resorption in tadpoles (Khalis et al., 2009), and the immunity controlmechanism in bacteriophage lambda (Richard, Comet & Bernot, 2006). The results of ourstudy highlight that O-GlcNAc transferase (OGT) plays an important regulatory rolein oncogenic activation. The qualitative model reveals that persistent over-expressionof OGT and c-Myc leads to deadlock state, from which the system cannot proceed toa recovery state. Another important insight obtained from the model is that silencingof the OGT and c-Myc loop decreases glycolytic flux and results in programmed celldeath. Based on the results of network analysis carried out using Cytoscape, we identify asignificant cycle, which highlights the important role of p53-Mdm2 oscillations to bring the
Saeed et al. (2016), PeerJ, DOI 10.7717/peerj.2348 5/32

Literature Review
Experimental Observations
Extraction of Pathway
Construction of BRN
CTL Encoding
Parameter Inference
Qualitative Modeling
Network Analysis
Hybrid Modeling
Figure 2 Flow diagram of the study showing sequence of methods.
system towards recovery state. The results of hybrid modeling suggest delay constraints tomaintain homeostasis. We compare the important insight gained through computationalmodeling to show that results are in agreement with previous studies. Together, our findingssuggest that the OGT and c-Myc loop is critical in tumor progression, and targeting thesemediators may represent a novel therapeutic strategy to regulate hyper-O-GlcNAcylationfor the treatment of cancer.
METHODSIn practice, elements of a biological system interact with each other in a positive ornegative manner, that is, the expression level of an entity (gene or protein) may favor ordegrade the rate of synthesis of other entities or itself. Usually, these systems are describedusing continuous modeling approaches that use a set of ordinary or partial differentialequations, which are often highly non-linear, and even simple systems involving only fewentities cannot be solved analytically (De Jong, 2002; Karlebach & Shamir, 2008). Secondly,differential equations involve time derivatives of quantitative data (concentration levels,reaction rates etc.), which in many cases can not be measured experimentally. Theselimitations paved the way towards qualitative description of biological systems withdiscrete variables, having limited expression levels, often only two (0 or 1). Thomas, in the1970s, proposed a logical formalism based on qualitative representation of biologicalregulations (Thomas, 1973; Thomas, 1991; Thieffry & Thomas, 1995). The qualitativemodeling approach, described by Thomas, employed directed graphs (also called interactiongraphs) to represent the topology of a Biological Regulatory Network (BRN).
The work presented in this paper mainly employs a qualitative framework for modelingbiological regulations. The methods used in this study (Fig. 2) are discussed in subsequentsubsections. First, we construct a qualitative Biological Regulatory Network (BRN) whichis comprised of important entities isolated from signaling pathways. The unknown modelparameters are inferred by encoding experimental observations into a model checker.The qualitative BRN is then translated to a stategraph by using Thomas’s framework.Important behaviors in a stategraph, such as steady states, oscillations (cycles) and
Saeed et al. (2016), PeerJ, DOI 10.7717/peerj.2348 6/32

Figure 3 Activation and Inhibition delays (adopted from Aslam et al., 2014). The clock ha measuresthe time of evolution between two discrete levels. Initially the clock is set to zero and the changes in thelevel occurs in a delay time d+/−.
important trajectories are identified. Finally, we use hybrid modeling to compute delayconstraints which limit the system to remain in a normal cycle (homeostasis).
Qualitative modeling frameworkThe qualitative modeling framework introduced by René Thomas uses a graph-theoraticapproach to model BRNs. Each BRN is modeled as a weighted directed graph in whichnodes represent biological entities such as genes or proteins, whereas the activation andinhibition relationships between nodes are represented by edges. Here, we briefly introducesemantics of the qualitativemodeling framework,mainly adopted fromBernot et al. (Bernotet al., 2007; Bernot et al., 2004; Saeed & Ahmad, 2014).
‘‘
Definition 1 (Directed Graph): A directed graph G is an ordered pair G= (V ,E), where
• V is the set of all vertices or nodes• E is an ordered pair of nodes i.e., if e ∈ E , then e= (vi,vj) and V =
{vi,vj
}.
The edge (vi,vj) is directed from vi to vj , where vi is called the head and vj is called thetail. In G, the set of predecessors and successors of a node vj are denoted as G−vj and G+vj ,respectively.
Saeed et al. (2016), PeerJ, DOI 10.7717/peerj.2348 7/32

Definition 2 (Biological Regulatory Network): A Biological Regulatory Network (BRN)is a labeled directed graph G= (V ,E), where biological entities are represented by set of nodesV and interactions are represented by set of edges E ⊆ V×V . Each edge (vi,vj) is labeled by apair (τ ,σ ), where τ is the threshold at which gene u starts regulating gene v, and σ = {+,−}is called sign of interaction (+ for activation and− for inhibition).
Each node vi ∈ V has its abstract expression level in the set δvi = {0...`vi} where`vi ≤
∣∣G+vi ∣∣. The state of a BRN is a configuration of expression levels of all entities at aparticular time instant.
Definition 3 (State): A State of BRN is n-tuple S={sv1,..,svn
}, ∀svi ∈ δvi , where svi is the
abstract expression level of vi.
In a given state, each vi is regulated by its predecessors G−vi , formally denoted as set ofresources, ωvi , defined as follows:
Definition 4 (Resources): Let G= (V ,E) be a BRN. The set of resources Wvj at level svj ,is defined as; ωvj = vi ∈G−vj | (svi ≥ τvi,vj and σvi,vj =+) or (svi <τvi,vj and σvi,vj =−).
Definition 5 (Parameters of a BRN): The logical parameters of a BRN are indexed by its setof resources. The parameter set is a Cartesian product of each variable’s resources and its ele-ments are of the form Kωvi . The evolution from one qualitative state to another state is deter-mined by an evolution operator which compares discrete values of resources and parameters.
Definition 6 (Evolution Operator, Bernot et al. (2007) �): Let svi ∈N and Kωvi ∈N, theevolution operator (�) is defined as follows;
sνi �Kωvi =
svi+1 iff svi <Kωνisvi−1 iff svi >Kωνisvi otherwise.
(1)
Definition 7 (State Graph): Let G= (V ,E) be a BRN and svx is expression level of vx ina state s ∈ S. Then the state graph R= (S,T ) is a directed graph, where S represents set ofstates, and T ⊆ S×S is a relation between states, also called the transition relation, such thats→ s′ ∈T iff :
• ∃ a unique vxεV such that svx 6= s′vx and s′vx = svx �Kx(ωvx ), and• ∀ vyεV \{x}s′vy = svy .’’
Parameter inference using model checkingThe dynamics of Thomas’s method are generated by translating the interaction graph to astate transition graph using a set of logical parameters, which are not known in advance. Theestimation of model parameters constitutes an important step in qualitative modeling ofbiological networks. Bernot et al. (2004) introduced a method to decipher these parametersby employing a formal verification approach, called model checking. In this approach,
Saeed et al. (2016), PeerJ, DOI 10.7717/peerj.2348 8/32

known experimental observations are encoded in a temporal logic framework, calledComputation Tree Logic (CTL), and then using the model checker, different parametercombinations are evaluated to finally select parameters which satisfy CTL observations. InCTL, experimental observations are encoded into formulas by using a set of quantifierswhich define criteria to explore different states or paths originating from a given state.Here, we provide a brief description of these quantifiers, the detailed semantics of whichcan be found in Clarke, Grumberg & Peled (1999).
• A: This is a path quantifier which enforces that a given property should hold in all pathsoriginating from the given state. The quantifier itself is read as ‘‘For all paths.’’
• E: Known as the ‘‘Existential Quantifier,’’ this is also a path quantifier which enforcesthat a given property must hold in at least one path originating from the given state. Thequantifier is read as: ‘‘There exists a path.’’
• G: This quantifier is known as the ‘‘Global Quantifier’’ and is a state quantifier whichenforces that a property holds in all states of a path originating from the given state,inclusive of the given state as well. It is read as: ‘‘Globally.’’
• F: The ‘‘Future Quantifier’’ is the second state quantifier and enforces that a givenproperty must hold in one of the future states in the path originating from the givenstate. It is read as: ‘‘In future’’ or ‘‘Eventually.’’ The Future Quantifier also covers thecurrent/given state as well when checking the property.
• X: The ‘‘Next Quantifier’’ is the third state quantifier and enforces that a given propertymust hold in the immediate successor state. It is read as: ‘‘Next.’’
SMBioNet (Khalis et al., 2009; Bernot et al., 2004) is a tool for the parameter estimationof biological networks, based on the qualitative formalism of René Thomas (Thomas,1978; Atkinson, 1965). Given a model of a BRN in the form of Thomas’s network andbehavioral properties (observations), expressed as CTL formulas, SMBioNet exhaustivelyenumerates all compatible parameterizations by generating a state graph for each parametercombination and by verifying the formulas on each state graph. The verification of theCTL property is performed by invoking model checker NuSMV (Cimatti et al., 2002). Theparameter combinations are reduced by applying Snoussi and observability constraints(Snoussi & Thomas, 1993). Finally, all the models that satisfy the CTL properties areshortlisted. SMBioNet has been applied in studies such as: tail resorption in tadpolemetamorphosis (Khalis et al., 2009), and immunity control in bacteriophage lambda(Richard, Comet & Bernot, 2006).
Network analysisGraph Theory (Bondy & Murty, 1976) plays an important role in the modeling and analysisof processes in several application areas, including systems biology (Pavlopoulos et al., 2011;Barabasi & Oltvai, 2004; Mason & Verwoerd, 2007). The graph-theoratic approaches areemployed to analyze topological and structural parameters of biological networks todiscover key properties that provide meaningful insights into the functionality of biologicalsystems. Identification of important nodes in a large biological regulatory network iscritical in the understanding of cellular mechanisms. The most widely used measure to
Saeed et al. (2016), PeerJ, DOI 10.7717/peerj.2348 9/32

compute the ranking of nodes in graph-theoraticmodels, based on the concept of Centrality(Aittokallio & Schwikowski, 2006; Mason & Verwoerd, 2007), mainly originate from SocialNetwork Analysis (Wasserman, 1994). Centrality Analysis has also been employed toinvestigate important properties of complex biological regulatory networks (Koschützki &Schreiber, 2008).
Definition 8 (Betweenness Centrality): For a state graph R= (S,T ) of an interactiongraph G = (V ,E), let x,y and z be the distinct qualitative states in R, and let σx,y bethe total number of trajectories from state x to state y, and let σy,x be the total number oftrajectories from qualitative state y to x, passing through a state z. Let Ox represents the set ofall ordered pairs, (y,x) such that x,y and z are all distinct. Then, the Betweenness Centralityof the qualitative state z can be computed from Eq. (2):
Cb(z)=∑
(x,y)∈O
σx,y(z)σx,y
. (2)
Hybrid modeling with delaysDiscretemodeling provides useful insights into qualitative dynamics of biological networks.However, an increase or decrease in protein expression, described by a step function, isnot coherent with actual changes in protein expression taking place within a cell. Theconcentration level of a protein, for instance, does not jump from one discrete value toanother discrete value. In order to capture the sigmoidal change of protein expressions,Ahmad et al. (2007) introduced a new framework based on piece-wise linear equations.In this framework, states of a system are modeled as discrete locations. Additionally,specialized variables, called clocks, are used to specify constraints for transition from onediscrete location to another (Fig. 3). Here, we provide a brief description of the hybridmodeling framework, adopted from Ahmad et al. (2007) and Aslam et al. (2014).
‘‘Clock variables are used to measure the ‘delays’ (the time duration) that needs topass between two consecutive expression levels. Thus, a clock variable h is associated witheach protein in the BRN. The initial values of each h are set to zero, which then approacheither d+ or d−. d+ signifies a production delay, that is, the delay required to increase theconcentration level of the associated protein by 1. Similarly, d− signifies the degradationdelay, that is, the delay to decrease the protein concentration by a single level. The rateof evolution of each h is given by the first order derivative dh/dt = r where r ∈ {0,1,−1}(Ahmad et al., 2007).
In most cases, the exact values of the delays associated with the proteins are not known,which is why unvalued parametric delays are used. Thus, the hybrid model was constructedusing the Parametric Bio Linear Hybrid Automaton (Ahmad, 2009) defined below.
Let C=(X ,P), C≤(X ,P), and C≥(X ,P) be the set of constraints using only=,≤, and≥,respectively. Here,X and P are the sets of real valued variables and parameters, respectively.
Definition 9 (Parametric Bio Linear Hybrid Automaton (Bio-LHA)): A parametric BioLinear Hybrid Automaton B is a tuple (L,l0,X ,P,E,Inv,Dif) where:
Saeed et al. (2016), PeerJ, DOI 10.7717/peerj.2348 10/32

• L is a finite set of locations,• l0 ∈ L is the initial location,• P is a finite set of parameters (delays),• X is a finite set of real-valued variable (clocks),• E ⊆ L×C=(X ,P)×2X×L is a finite set of edges with typical element e = (l,g ,R,l ′) ∈ Erepresenting an edge from l to l ′ with guard g and the reset set R⊆ X. The set of clocksg ∈R,• Inv : L→C≤(X ,P)∪C≥(X ,P) assigns an invariant to any location,• Dif : L×X→{−1,0,1}maps each pair (l,h) to an evolution rate.The Transition System related semantics of the parametric Bio-LHA are given below
according to the time domain T, where T∗=T\{0}.
Definition 10 (Semantics of Bio-LHA): Let γ be a valuation for the parameters P andν represents the values of clocks in a location. The (T,γ )-semantics of a parametric Bio-LHA B= (L,`0,X ,P,E,Inv,Dif) is defined as a timed transition system B = (S,s0,T,→)where: (1) S= {(`,ν) | ` ∈ L and ν |H Inv(`)}; (2) s0 is the initial state and (3) the relation→⊆ S×T×S is defined for t ∈T as:
• discrete transitions: (`,ν)0→(`′,ν ′) if ∃(`,g ,R,`′)∈ E such that g (ν)= true, ν ′(h)= 0 if
h∈R and ν ′(h)= ν(h) if h 6∈R.• continuous transitions: For t ∈T∗, (`,ν) t
→(`′,ν ′) if `′= `, ν ′(h)= ν(h)+Dif(`,h)×t ,and for every t ′ ∈ [0,t ], (ν(h)+Dif(`,h)×t ′) |H Inv(`), where |H represents satisfactionoperator.Using the semantics of the Bio-LHA, Ahmad et al. (2007) then defined the temporal
state space and the invariance kernel set which have been adapted below.
Definition 11 (Temporal Zone): Temporal zone is defined as a region where time elapsesuntil a discrete transition between states takes place.
Definition 12 (Temporal State Space): The temporal state of a BRN is composed of thecomplete set of temporal zones derived from the discrete model of the said BRN.
In the hybrid model of the BRN, we denote φ(t ) for t ∈R≥ 0, while the sequence ofpoints of a trajectory and the set of all points in the state space is denoted by S. A particulartrajectory is said to be viable if it remains within a prescribed region known as its viabilitydomain. The state pace is denoted by S. A particular trajectory is said to be viable if itremains within a prescribed region known as its viability domain.
Definition 13 (Invariance Kernel): A trajectory φ(t ) is said to be viable in S if φ(t ) ∈S ∀ t ≥ 0. A subset K of S is the invariant if for any point p ∈ K, a trajectory starting in p isviable in K . An invariance kernel K is the largest invariant subset of S. ’’
Saeed et al. (2016), PeerJ, DOI 10.7717/peerj.2348 11/32

PI3K
p21
NFκB p53
MDM2
FoxM1 c-Myc
OGT OGA
-1
-1
-1
-1 -1
-1
-1
-1
-1
+1
+1
+1
+1
+1 +1+1+1
Figure 4 Qualitative Biological Regulatory Network (BRN). The entities are shown as nodes whereasinteractions between two entities are represented with arrows. There are two types of interactions: activa-tions (black arrows) and inhibitions (red dashed heads).
RESULTSModel constructionFrom study of the existing literature, we construct a qualitative BRN comprised of ninegenes and seventeen interactions (Fig. 4). The BRN is composed of a set of well-knownregulatory motifs, each of which give rise to a specific functionality of the system. First,we observe an inhibitory set of genes (OGT vs OGA) that produces a positive feedbackloop, known to generate multiple stable states. In practice, a positive feedback circuit iscomprised of an even number of negative elements (Plahte, Mestl & Omholt, 1995), andacts as a toggle-switch in which only one of the two genes is expressed at a time (Gardner,Cantor & Collins, 2000). On the other hand, a negative circuit is comprised of an oddnumber of negative interactions, such as the interaction between p53 andMdm2, that leadsto a periodic behavior or homeostasis. An important oscillatory behavior is characterizedby two nested regulatory modules involving PI3K: (i) a positive feedback loop via p21 andNF-κB; and (ii) a positive feedback loop between FoxM1, p21 and NF-κB. The logicalanalysis of these regulatory motifs provides useful information about the potential behaviorof a system. However, functional dynamics of a complex system, that involve both positiveand negative circuits, can only be rendered with proper parameter values.
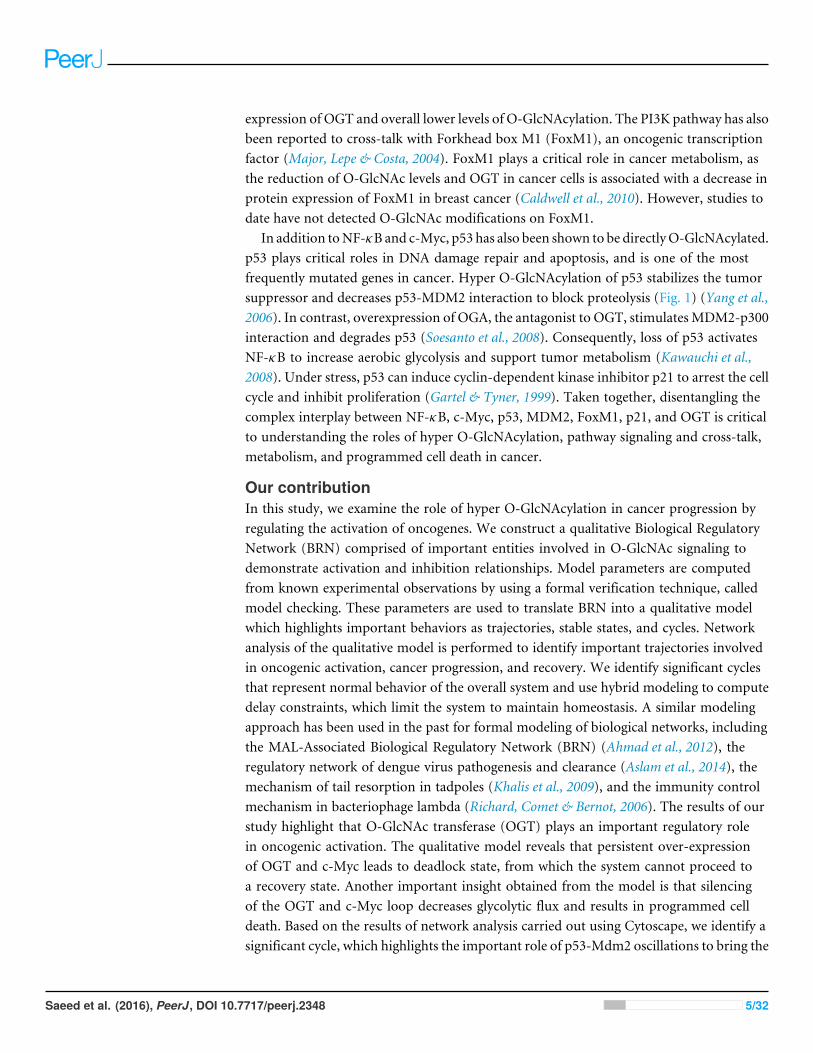
Logical parametersTable 1 enlists the final values of logical parameters which are used to generate modeltrajectories as a state transition graph. These parameters are computed from knownqualitative observations expressed as CTL formulas (Eqs. (3)–(6)), the most important ofwhich is the change in expression levels of OGT and OGA in different types of cancers,including tumors of the breast and colon (Singh et al., 2015; Fardini et al., 2013;De Queiroz,Carvalho & Dias, 2014). The sub-formulas ψ1 and ψ2 represent changes in the HBP
Saeed et al. (2016), PeerJ, DOI 10.7717/peerj.2348 12/32
Table 1 Values of logical parameters estimated by using SMBioNet. The first column (Sr) indicates the serial number of each parameter with re-spect to its order of appearance in the SMBioNet input file (Supplemental Information 1). Each parameter is listed along with resources and permis-sible expression levels in second, third and fourth column, respectively. The fifth column (Selected) shows final values of logical parameters, com-puted by using SMBioNet.
Sr. Parameter Resource Range Selected Sr. Parameter Resource Range Selected
1 KNFκB {} [0] 0 21 K P21 {p53} [0-1] 02 KNFκB {P21} [0-1] 0 22 K P21 {PI3K} [0-1] 03 KNFκB {PI3K} [0-1] 0 23 K P21 {FoxM1,p53} [0-1] 14 KNFκB {P21,PI3K} [1] 1 24 K P21 {p53,PI3K} [0-1] 15 K PI3K {} [0] 0 25 K P21 {FoxM1,PI3K} [0-1] 16 K PI3K {NFκB} [0-1] 0 26 K P21 {FoxM1,p53,PI3K} [0-1] 17 K PI3K {OGT} [0-1] 1 27 K FoxM1 {} [0] 08 K PI3K {p53} [0-1] 0 28 K FoxM1 {p53} [0-1] 09 K PI3K {NFκB,OGT} [0-1] 1 29 K FoxM1 {PI3K} [0-1] 110 K PI3K {OGT,p53} [0-1] 1 30 K FoxM1 {p53,PI3K} [1] 111 K PI3K {NFκB,p53} [0-1] 1 31 KOGT {} [0] 012 K PI3K {NFκB,OGT,p53} [1] 1 32 KOGT {C-Myc} [0-1] 113 KOGA {} [0] 0 33 KOGT {OGA} [0-1] 014 KOGA {OGT} [1] 1 34 KOGT {C-Myc,OGA} [1] 115 K p53 {} [0] 0 35 KMdm2 {} [0] 016 K p53 {Mdm2} [0-1] 1 36 KMdm2 {p53} [1] 117 K p53 {NFκB} [0-1] 1 37 KC-Myc {} [0] 018 K p53 {Mdm2,NFκB} [0-1] 1 38 KC-Myc {OGT} [0-1] 119 K P21 {} [0] 0 39 KC-Myc {p53} [0-1] 020 K P21 {FoxM1} [0-1] 0 40 KC-Myc {OGT,p53} [1] 1
pathway, triggered by a change in the expression level of two genes: OGT and OGA.The sub-formula ψ1 describes behavior of the biological system under enhanced OGTexpression leading to a future state in which the expression of oncogenes remain high.The sub-formula ψ2 describes that there is at-least one trajectory in which expressionof oncogenes remain low when OGT is initially not expressed. Finally, the sub-formulaψ3 represents oscillatory behavior exhibited by the HBP pathway and tumor suppressorproteins p53 and p21. We used SMBioNet software (Bernot et al., 2004; Khalis et al.,2009) to select only those parameters that satisfy the CTL formulas. SMBioNet selectedfour models (Supplemental Information 2 and 3) which show a single deadlock state(1,0,1,1,1,1,1,0,1) and plausible biological trajectories in cancer progression and recovery.
ψ1= ((OGT= 1∧OGA= 0)⇒EF(AG(OGT= 1∧OGA= 0∧PI3K= 1∧FOXM= 1∧P21= 0∧CMyc= 1)))
(3)
ψ2= ((OGT= 0∧OGA= 1)⇒EF(AG(OGT= 0∧OGA= 1∧PI3K= 0∧FOXM= 0∧P21= 1∧CMyc= 0)))
(4)
ψ3= ((OGT= 0∧OGA= 1∧p53= 1∧P21= 1)⇒EX(EF(OGT= 0∧OGA= 1∧p53= 1∧P21= 1)))
(5)
8= (ψ1)∧ (ψ2)∧ (ψ3). (6)
Saeed et al. (2016), PeerJ, DOI 10.7717/peerj.2348 13/32

The tendency of each gene to change its expression level is a function of presence orabsence of its resources. The change in expression level of a gene can be determined bycomparing its current state, at any particular time, with values of logical parameters listedin Table 1. The inferred parameters indicate that in the presence of the PI3K activationsignal, NFκB maintains a higher expression level (if already expressed i.e., 1) or showsan increase in its expression level. On the other hand, PI3K shows a rise in expressioneven in the presence of a p53 inhibition signal when both NFκB and OGT are activatingPI3K. The expression level of tumor suppressor protein p53 shows an increase only inthe absence of the MDM2 inhibition signal. The inferred parameters show increase inexpression level of OGT and C-Myc when there is an activation signal between them. Thecollective behavior of genes involved in a biological system can only be determined only byanalyzing trajectories in a state transition graph.
State transition graphA state transition graph of the biological regulatory network with 512 nodes and 2,304edges (Supplemental Information 4) is rendered using Cytoscape software (Shannon et al.,2003) (Fig. 5). The graph is generated from selected logical parameters (Table 1) usingGENOTECH software (Ahmad, 2009; Aslam et al., 2014; Ahmad et al., 2012) and states aresorted on the basis of betweenness centrality. A parameterized BRN is also attached forthe GINsim Tool software (Supplemental Information 8) (Chaouiya, Naldi & Thieffry,2012). The deadlock state (1,0,1,1,1,1,1,0,1) (Fig. 5D) shows high expression levels of OGTand oncogenes. The immediate predecessors (up to two levels) of the deadlock state havelow betweenness centrality, indicated with circles, having comparatively larger diametersand darker colors. The model also shows several cycles, and rendered as an outermostcircle (Fig. 5). These states have high betweenness centrality, represented using circleswith smaller diameters and lighter colors. The cycles demonstrate normal behaviors of thesystem characterized by low expression levels of oncogenes, oscillation of the p53-Mdm2circuit, and moderate expression levels of tumor suppressor proteins. In the state graph,the state of the system at a particular time is represented by a vector containing expressionlevels of all entities. The normal state is characterized by low expression levels of OGT,PI3K, and FoxM1 along with the presence of tumor suppressor proteins p53 and p21. Thisstate is represented as a vector (OGT = 0, OGA = 1, PI3K = 0, FoxM1 = 0, p53 = 1, p21= 1). Conversely, the pathogenic state is characterized by high expression levels of OGTalong with PI3K and FoxM1. (OGT = 0, OGA = 1, PI3K = 0, FoxM1 = 0, p53 = 1, p21 =1) represents a normal or recovery state of the system. Biological systems, under normalcircumstances, exhibit oscillatory behavior or homeostasis during which the overall stateof the system remains in a cycle of normal states. Therefore, the desirable qualitative modelshould exhibit pathogenic trajectories along with normal homeostatic behavior representedas a cycle or closed path. The normal behavior, characterized by low expression levels ofOGT and the presence of OGA, is encoded as CTL formula ψ2. It states that, under normalcircumstances, when the expression level of OGT is low, the system will always remain ina stable state characterized by low expression of oncogenes (OGT, FoxM1, PI3K, c-Myc)and the presence of tumor suppressors (p53 and p21).
Saeed et al. (2016), PeerJ, DOI 10.7717/peerj.2348 14/32
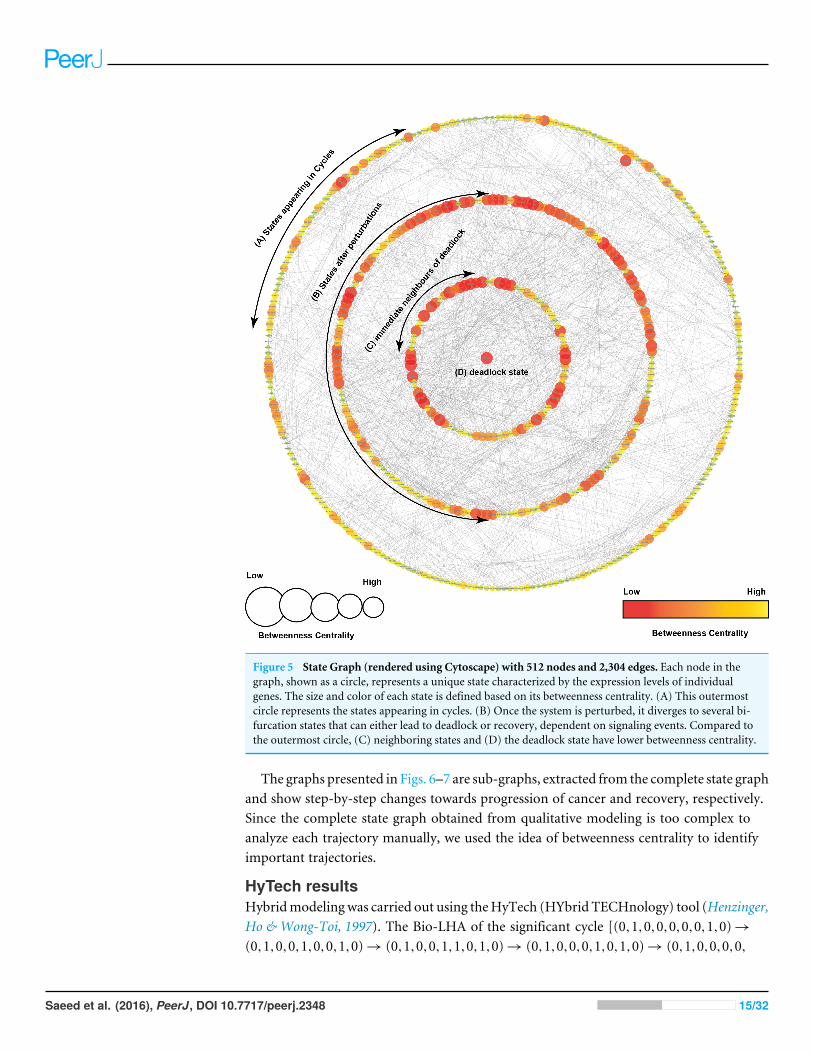
Figure 5 State Graph (rendered using Cytoscape) with 512 nodes and 2,304 edges. Each node in thegraph, shown as a circle, represents a unique state characterized by the expression levels of individualgenes. The size and color of each state is defined based on its betweenness centrality. (A) This outermostcircle represents the states appearing in cycles. (B) Once the system is perturbed, it diverges to several bi-furcation states that can either lead to deadlock or recovery, dependent on signaling events. Compared tothe outermost circle, (C) neighboring states and (D) the deadlock state have lower betweenness centrality.
The graphs presented in Figs. 6–7 are sub-graphs, extracted from the complete state graphand show step-by-step changes towards progression of cancer and recovery, respectively.Since the complete state graph obtained from qualitative modeling is too complex toanalyze each trajectory manually, we used the idea of betweenness centrality to identifyimportant trajectories.
HyTech resultsHybridmodelingwas carried out using theHyTech (HYbrid TECHnology) tool (Henzinger,Ho & Wong-Toi, 1997). The Bio-LHA of the significant cycle [(0,1,0,0,0,0,0,1,0)→(0,1,0,0,1,0,0,1,0)→ (0,1,0,0,1,1,0,1,0)→ (0,1,0,0,0,1,0,1,0)→ (0,1,0,0,0,0,
Saeed et al. (2016), PeerJ, DOI 10.7717/peerj.2348 15/32

LEGENDOrder of Qualitative States: NFKB,P21,FoXM1,PI3K,P53,MDM2,OGT,OGA,CMycStart State: 100000100 Deadlock State: 101111101
Less More
Betweenness Centratility
000110100
000100100
000000100
000010100
000111100
000101100
100000100
000100101
000110101
100110101 100111101 101111101
Figure 6 Subgraph isolated from the state transition graph (Fig. 5), highlighting tumor progressionfrom the start state (1,0,0,0,0,0,1,0,0) leading to the deadlock state (1,0,1,1,1,1,1,0,1). Each node in thegraph represents a unique state of the system characterized by qualitative expression of genes in the fol-lowing order: NF-κB, p21, FoxM1, PI3K, p53, MDM2, OGT, OGA, c-Myc. Activation of a particulargene/entity is indicated with ‘‘1’’, whereas ‘‘0’’ indicates that the expression level of a gene is below the ac-tivation threshold. Nodes are shaded based on the level of betweenness centrality. Nodes and trajectoriesassociated with tumor progression and recovery are denoted using red and green arrows, respectively.
Table 2 Invariance Kernel of the significant cycle. The invariance kernel dictates the delay constraintsthat are being followed in this cycle.
Qualitative cycle (0,1,0,0,0,0,0,1,0)→ (0,1,0,0,1,0,0,1,0)→ (0,1,0,0,1,1,0,1,0)→(0,1,0,0,0,1,0,1,0)→ (0,1,0,0,0,0,0,1,0)
Invariance kernel Conjunction of constraint I–IV:I. d+p53+
∣∣d−Mdm2
∣∣≤ d+Mdm2+∣∣d−p53∣∣
II. d+Mdm2+∣∣d−p53∣∣≤ 0
III.∣∣d−Mdm2
∣∣≤ d+Mdm2+∣∣d−p53∣∣
0,1,0)] defines invariants and clock rates for each qualitative state in the cycle (Fig. 8).The invariance kernel for the cycle (HyTech code in Supplemental Information 6) iscomposed of three conjuncted delay constraints, (Table 2). These delay constraints definenecessary and sufficient conditions in a way such that the resulting trajectories maintaincyclic stability (homeostasis). If these delay constraints are violated, the trajectories willdeviate from the significant cycle and may follow a path to the deadlock state. In Table 3,a pair-wise matrix represents an association between these delay constraints with the helpof logical relations (≤, <, >, ≥, =).
The delay constraints from the start state (1,0,0,0,0,0,1,0,0) to the deadlock state(1,0,1,1,1,1,1,0,1) are computed (HyTech code in Supplemental Information 7) andpresented in the form of a relation matrix in Table 4, which highlight important relationsbetween the production and degradation rates of important proteins. The degradationdelay of OGT is greater than the activation delays of MDM2, PI3K and p53, meaning thatduring progression towards deadlock state, depletion of OGT takes place at a much slowerrate compared to MDM2, PI3K and p53 (Table 4). Similarly, production delay of c-Mycremains higher than PI3K and p53-MDM2 circuitry, thus reinforcing the results of ourqualitative modeling which suggest that once c-Myc and OGT form a positive feedbackloop, the overall system eventually moves to the deadlock state.
Saeed et al. (2016), PeerJ, DOI 10.7717/peerj.2348 16/32
001011000
101011000
001000000
100011000
001010000 000000000
000001000
001001000 000011000
000010000
101110000
101111000
101100000
101110101
101100100
101111101
101110100
101111100
101010000
100000000
100000100
000000100
000000000
010001010
010000000
010011010
010000010 010010010
000000000
Less More
Betweenness Centratility
LEGENDOrder of Qualitative States: NFKB,P21,FoXM1,PI3K,P53,MDM2,OGT,OGA,CMycStart State: 100000100 Deadlock State: 101111101
A.
C.
B.
SCC-3
SCC-1
SCC-2
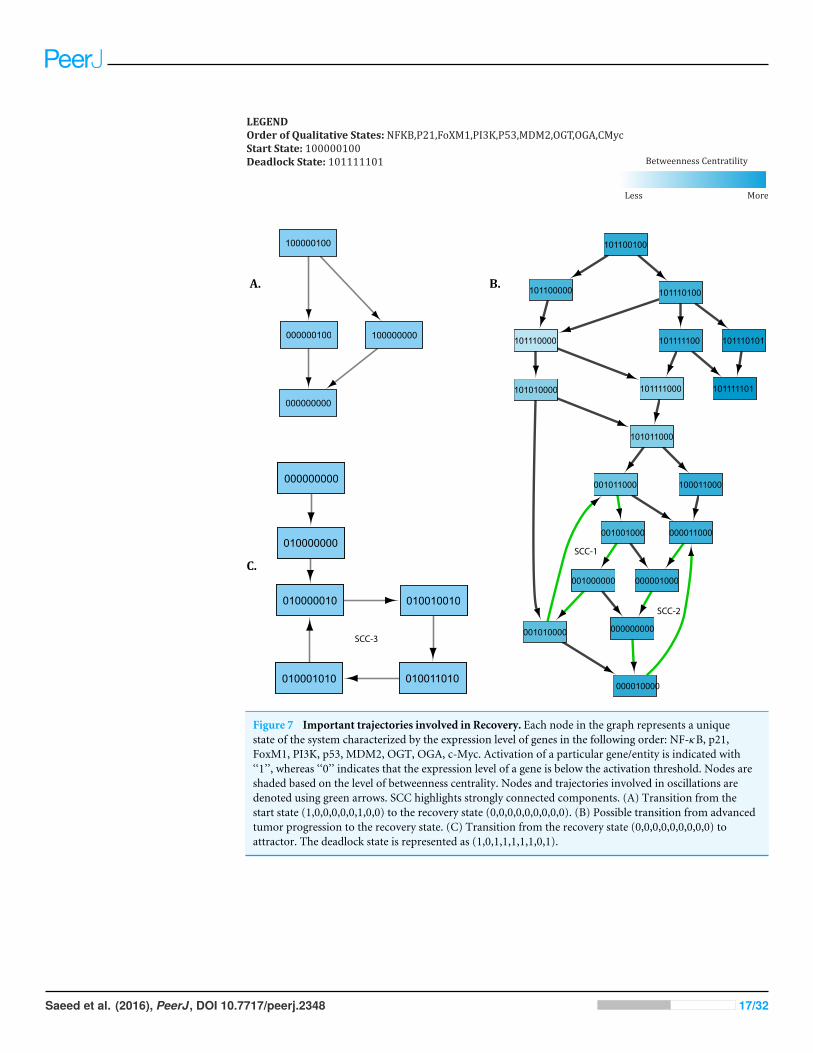
Figure 7 Important trajectories involved in Recovery. Each node in the graph represents a uniquestate of the system characterized by the expression level of genes in the following order: NF-κB, p21,FoxM1, PI3K, p53, MDM2, OGT, OGA, c-Myc. Activation of a particular gene/entity is indicated with‘‘1’’, whereas ‘‘0’’ indicates that the expression level of a gene is below the activation threshold. Nodes areshaded based on the level of betweenness centrality. Nodes and trajectories involved in oscillations aredenoted using green arrows. SCC highlights strongly connected components. (A) Transition from thestart state (1,0,0,0,0,0,1,0,0) to the recovery state (0,0,0,0,0,0,0,0,0). (B) Possible transition from advancedtumor progression to the recovery state. (C) Transition from the recovery state (0,0,0,0,0,0,0,0,0) toattractor. The deadlock state is represented as (1,0,1,1,1,1,1,0,1).
Saeed et al. (2016), PeerJ, DOI 10.7717/peerj.2348 17/32

Table 3 Relation matrix of the significant cycle which depicts binary relations between the states. Eachentry of the matrix represents whether a delay ‘a’ would be greater than, equal to, or less than a delay ‘b.’The matrix is read as drow∼ dcolumn where∼∈ {≤,<,>,≥,=}.
Relation matrix∣∣d−Mdm2
∣∣ ∣∣∣d−p53∣∣∣ d+Mdm2 d+p53∣∣d−Mdm2
∣∣ = =≥,≤ =≥,≤ =≥∣∣d−p53∣∣ – = ≥ ≥,≤
d+Mdm2 – – = >,<
d+p53 – – – =
(0,1,0,0,0,0,0,1,0) (0,1,0,0,1,0,0,1,0)
(0,1,0,0,1,1,0,1,0)(0,1,0,0,0,1,0,1,0)
hNFKB
hP53 < dP53+
= 0hP21 = 0hFOXM1= 0hPI3K = 0hP53 = 1
hMDM2 = 1hOGT = 0hOGA = 0hc-Myc = 0
<<
<<
<<
<<
hNFKB = 0hP21 = 0hFOXM1= 0hPI3K = 0hP53 = -1
hMDM2 = 1hOGT = 0hOGA = 0hc-Myc = 0
<<
<<
<<
<<
hNFKB = 0hP21 = 0hFOXM1= 0hPI3K = 0hP53 = 1
hMDM2 = -1hOGT = 0hOGA = 0hc-Myc = 0
<<
<<
<<
<<
hNFKB = 0hP21 = 0hFOXM1= 0hPI3K = 0hP53 = -1
hMDM2 = -1hOGT = 0hOGA = 0hc-Myc = 0
<<
<<
<<
<<
hMdm2 < dMdm2+
hP53 <dP53-hMdm2 <dMdm2
-
dP53+
Legendh :dh/dthx : Clock of x
d+= Delay of Activationd- = Delay of Inhibition
.
. .
. .
.
.
.
.
.
. .
. .
. .
. ..
.
.
.
.
.
. .
..
.
..
..
hP53 ==
hP53 0
dMdm2+hMdm2==
hMdm2 0
dP53-hP53 ==
hP53 0
dMdm2+hMdm2==
hMdm2 0
Figure 8 The parametric Bio Linear Hybrid Automaton (Bio-LHA) of the significant cycle(0,1,0,0,0,0,0,1,0)→ (0,1,0,0,1,0,0,1,0)→ (0,1,0,0,1,1,0,1,0)→ (0,1,0,0,0,1,0,1,0)→(0,1,0,0,0,0,0,1,0). The states are represented by a vector containing expression level of genes inthe order: NfκB, P21, FoXM1, Mdm2, OGT, OGA, C-Myc. The significant cycle is characterized bylow expression of OGT and oncogenes, and oscillatory behavior of the p53-Mdm2 circuit resulting inhomeostasis. Here, each location represents a qualitative state of the cycle with invariants (conjunctionof constraints) and clock rates. The transitions are labeled with guards and the clock resets of evolvingentities. The initial state (0,0,0,0,0,0,0,0,0) is represented by a small arrow shown in upper left corner.
Saeed et al. (2016), PeerJ, DOI 10.7717/peerj.2348 18/32

Table 4 Relation matrix computed from delay constraints that lead to the deadlock state (1,0,1,1,1,1,1,0,1) from starting state(1,0,0,0,0,0,0,1,0,0). Each entry of the matrix represents whether a delay ‘a’ would be greater than, equal to, or less than a delay ‘b.’ The matrixis read as drow∼ dcolumn where∼∈ {≤,<,>,≥,=}.
dnOGT dpCMYC dpFOXM dpP21 dpNFκB dnMDM2 dnP53 dpMDM2 dnNFκB dpPI3K dpP53
dnOGT = >= =<> =>< >=< > > > =<> > >
dpCMYC = <= <= =< > > > <=> > >
dpFOXM = =>< >=< > > > =>< > >
dpP21 = >=< > > > =<> > >
dpNFκB = > > > <=> > >
dnMDM2 = >= >= <=> >= >=
dnP53 = = <= = =
dpMDM2 = <= = =
dnNFκB = >= >=
dpPI3K = =
dpP53 =
DISCUSSIONPrevious studies have demonstrated a link between increased cellular O-GlcNAcylation(hyper-O-GlcNAcylation) and cancer progression in multiple tumor types (Caldwell et al.,2010; Fardini et al., 2013; Slawson, Copeland & Hart, 2010). For example, recent findingsin breast cancer have shown that breast tumor tissues and cell lines have increased mRNAexpression of OGT and decreased mRNA expression of mRNA as compared to the adjacentnormal (Krześlak et al., 2012a; Caldwell et al., 2010). Additional studies have observed thatreduction of OGT expression in prostate cancer cells inhibits metastatic tumor progressionto bone (Lynch et al., 2012). Similarly in lung and colon tumor tissues, OGT expressionwas elevated compared with surrounding normal tissue (Mi et al., 2011). Importantly,our present quantitative model validates the critical role of OGT in regulating cancerdevelopment and recovery in multiple tumor types.
Qualitative dynamicsThe qualitative model, rendered as a state transition graph (Fig. 5), highlights importantbehaviors in the form of trajectories to represent temporal evolution of the overall systemfrom one qualitative state to another. These behaviors mainly include cycles that representhomeostasis, stable states (deadlock), and several bifurcation states from where the systemcan evolve either in the direction of tumor invasion or recovery. Three bifurcation states[(1,0,1,1,0,0,1,0,0), (1,0,1,1,1,0,1,0,0), and (1,0,1,1,1,1,1,0,0)] were observed to lead toboth a deadlock state (1,0,1,1,1,1,1,0,1) and a typical reset state (0,0,0,0,0,0,0,0,0). Networkanalysis carried out using Cytoscape (Shannon et al., 2003) helped to identify importanttrajectories based on betweenness centrality and highlight step-by-step alterations thatsystematically lead to cancer metastasis from the starting state. Here, we discuss two casesthat focus on important trajectories of the qualitative model involved in tumor progressionand recovery.
Saeed et al. (2016), PeerJ, DOI 10.7717/peerj.2348 19/32

Case 1: cancer initiation and progressionUnder normal physiological conditions, proto-oncogenes play basic roles in signalingpathways that control cellular growth (Pall, 1981). Activation of a proto-oncogene into anoncogene, through gain-of-function mutations, increases the expression of these proteinsand leads to alterations in signaling pathways, increases glycolytic flux through theHBP, andelicits an inflammatory response (Ma, Vocadlo & Vosseller, 2013; Karin, 2009; Fardini et al.,2013). Important trajectories that originate from a starting state (1,0,0,0,0,0,1,0,0) showincreased expression of the pro-inflammatory NF-κB pathway and O-GlcNAc transferase(OGT) (Fig. 6). Supplemental Information 9 highlights changes in the expression level ofgenes along each transition that lead to the deadlock state. Enhanced OGT expression isconsidered an indicator of metabolic switch from oxidative phosphorylation to glycolysis,and can occur under oxidative stress. Cellular response to this stress has been shownto activate a p53 transcriptional response (Gambino et al., 2013), leading to a qualitativestate (1,0,0,0,1,0,1,0,0). The subsequent trajectories, mapped in Fig. 6, show that p53is over-expressed in several states that lead to a deadlock state, thereby reinforcing thegrowing evidence that suggests the divergent role of p53 in response to increased cellularmetabolism (Puzio-Kuter, 2011;Maddocks & Vousden, 2011).
Despite its original classification as a tumor suppressor gene, recent evidence is accruingto reveal p53 also carries oncogenic properties (Soussi & Wiman, 2015). The majority ofp53 germline and somatic alterations are missense mutations which synthesizes a stablemutant p53 protein that accumulates in the nucleus of tumor cells and can result inan oncogenic phenotype (Dittmer et al., 1993). Indeed, over-expression of p53 has beenreported in various breast cancer studies, and induced a metabolic shift toward glycolysis(Won et al., 2012). Similar findings have also been reported in other tumor types, includingcancers of the colon, cervix, and pancreas (Al-Khayal et al., 2016; Rajeshkumar et al., 2015;Hernández-Reséndiz et al., 2015; Kruiswijk, Labuschagne & Vousden, 2015).
In addition to accumulation of p53, significant increase in the expression of NF-κBhas been reported in different tumor types, including breast and prostate cancers (Aroraet al., 2014; Mak et al., 2015). Recent studies have shown the anti-apoptotic propertiesof hyper O-GlcNAcylation in tumor cells and the contribution of this post-translationalmodification for oncogenic activation of NF-κB in pancreatic cancers (Ma & Vosseller,2013). In corroboration with these studies, our qualitative model demonstrates a sustainedactivation of NF-κB, which contributes to increased glycolytic flux and tumorigenesis.
The qualitative model reveals activation of FoxM1 and PI3K in response to continuousactivation of OGT, thus leading to qualitative states (1,0,0,1,0,1,0,0) and (1,1,1,1,1,0,1,0,0).As expected, FoxM1 over-expression has been implicated in cancer. Although themechanism of FoxM1 and OGlcNAcylation is poorly characterized, sentinel studiessuggest that hyper O-GlcNAcylation of FoxM1 mediators in breast cancer prevent thedegradation of FoxM1, to promote transformation of cells in breast cancer (Caldwell et al.,2010). From the initial state, betweenness centrality of states decreases as systems get closerto the deadlock state (Fig. 6). This drop in betweenness centrality is indicative of fewerchances for transition to recovery, particularly once FoxM1 and PI3K are over-expressed.Importantly, these results highlight the critical role of c-Myc to reach the deadlock state
Saeed et al. (2016), PeerJ, DOI 10.7717/peerj.2348 20/32

in the qualitative model. Prior to the activation of c-Myc, several bifurcation states existfor possible transitions to a typical reset or recovery state (0,0,0,0,0,0,0,0,0). However,qualitative modeling demonstrates that activation of c-Myc promotes the stability ofhyper- O-GlcNAcylation. We observed that c-Myc activation forms a positive feedbackloop with OGT, which plays a critical role in uncontrolled proliferation of tumor cells.Our findings are consistent with current literature that hypoxia-inducible factor (HIF), atranscription factor that activates aerobic glycolysis under cellular stress, cooperates withc-Myc to flip the metabolic switch and fuel glycolysis (Semenza, 2007; Dang et al., 2008;Kroemer & Pouyssegur, 2008). Together these proteins also upregulate glucose transporters,glycolytic intermediates, and induce angiogenesis in the tumor microenvironment tomaintain glycolytic conditions (Kroemer & Pouyssegur, 2008).
Constitutive activation of c-Myc and p53 mutation contribute to uncontrolled cellularproliferation associated with upregulated glycolysis and metabolic re-programming intumors. Further, activation of NF-κB downregulates oxidative phosphorylation in varioustumor types (Markert, Levine & Vazquez, 2012). Together, our findings further characterizethe critical roles of these oncogenes and tumor suppressor genes in support cancerprogression through the regulation of biological networks.
Case 2: recovery from advanced tumor progressionIn our qualitative model, important trajectories involved in cancer recovery suggestthat the p53-Mdm2 circuit undergoes a series of cycles first to restore the system backto recovery state and subsequently, maintain homeostasis. These cycles are depicted asstrongly connected components (SCC) in Fig. 7 (SCC1, SCC2, and SCC3). SupplementalInformation 10 highlights change in expression level of genes along each transition thatlead to the recovery state. In Fig. 7, the initial state (1,0,1,1,0,0,1,0,0) is a bifurcation statecharacterized by high expression of oncogenes and increased glycolytic flux. The initial statemay lead to both recovery and deadlock states depending on genetic alterations regulatingthe expression of genes involved in signaling. The qualitative model shows that, in responseto oncogene activation and increased glycolytic flux, p53 remains constitutively activein several successor states. Increased expression of p53 mediates the down-regulation ofOGT by inhibiting c-Myc, thus leading to a state (1, 0, 1, 1, 0, 0, 0, 0, 0). Subsequently,down-regulation of PI3K is also triggered by p53- mediated inhibition through p21 andlow expression of OGT, resulting in a qualitative state (1, 0, 1, 0, 1, 1, 0, 0, 0). In subsequenttrajectories, the p53-Mdm2 circuit acts as a repair mechanism to systematically reduce theexpression of oncogenes through a series of oscillations.
• The first cycle (SCC-1) shows an oscillation of the p53-Mdm2 circuit, whilemaintainingincreased expression of FoxM1 throughout the cycle.• In the second cycle (SCC-2), the p53-Mdm2 circuit oscillates to down-regulate theexpression of FoxM1 until the system reaches to recovery state (0,0,0,0,0,0,0,0,0).
These findings are in agreement with previous experimental studies, which suggestthat p53 levels showed a series of pulses in response to DNA damage. Uri Alon, in 2000,first reported that the p53-Mdm2 circuit show dampened oscillations in irradiated breast
Saeed et al. (2016), PeerJ, DOI 10.7717/peerj.2348 21/32
cancer cells (Bar-Or et al., 2000). Later studies confirmed these results by showing thatthe p53-Mdm2 circuit undergoes a series of pulses at regular intervals (Lahav et al., 2004;Lahav, 2009). The results presented in our study illustrate the role of the p53-Mdm2circuit in a series of oscillations that lead to recovery state, consistent with previous studies(Poltz & Naumann, 2012; Abou-Jaoudé, Ouattara & Kaufman, 2009). A similar behavioris exhibited by our qualitative model in the form of two important cycles, shown asSCC-1 and SCC-2 (Fig. 7) before reaching a recovery state. However, this model does notprovide any information about the number of iterations or time spent within each cycle.Depending on the extent of DNA damage, two scenarios are possible: (1) the recovery state(0,0,0,0,0,0,0,0,0) may also serve as an unperturbed stable state where the p53 level remainslow; or (2) the system reaches a ‘limit cycle’/attractor (SCC-3) where it continues to oscillateindefinitely with constant time period and amplitude. In practice, the systems comprisedof negative feedback loops, like circadian rhythms, are fully capable of producing sustainedoscillations to maintain homeostasis.
Hybrid modelingCellular metabolism and intracellular signaling converge into a complex regulatorynetwork that is regulated by key interactions. Importantly, these interactions thatregulate these pathways vary in speed. While changes in gene expression occur at aslower rate, post-translational protein modifications tend to occur rapidly (Chubukov etal., 2014). In our study, the behavior of the p53-Mdm2 circuit is dependent on the timedelay between p53-dependent induction and Mdm2-controlled repression. The delayconstraints computed using HyTECH for the significant cycle [(0,1,0,0,0,0,0,1,0)→(0,1,0,0,1,0,0,1,0)→ (0,1,0,0,1,1,0,1,0)→ (0,1,0,0,0,1,0,1,0)→ (0,1,0,0,0,0,0,1,0)] with lowest betweenness centrality, serves as an important attractor. It representsnormal homeostasis characterized by low expression of oncogenes and p53-Mdm2oscillations. Therefore, it is important to know the necessary and sufficient conditionsthat limit the system to maintain a homeostatic behavior.
The first state observed in the cycle (0,0,0,0,0,0,0,0,0) represents an initial configurationof the system. This state also represents a typical reset state after recovery. Differenttrajectories have been outlined that lead to this state (Fig. 7). The results of qualitativemodeling (Fig. 7) show that once the system reaches the reset state, it enters intoan attractor (SCC3). This cycle [(0,1,0,0,0,0,0,1,0)→ (0,1,0,0,1,0,0,1,0)→(0,1,0,0,1,1,0,1,0)→ (0,1,0,0,0,1,0,1,0)→ (0,1,0,0,0,0,0,1,0)], characterized byp53-Mdm2 oscillatory behavior and low expression levels of OGT and oncogenic proteins,represents the normal homeostatic behavior of the overall system. Moreover, networkanalysis reveals that this cycle has the lowest betweenness centrality among all the cycles inthe qualitative model, which makes it an attractive cycle. Once the system enters into thiscycle (attractor), it tends to limit itself only within the cycle. Therefore, it is important tocompute delay constraints that enforce the system to maintain this cyclic behavior.
Table 2 presents the invariance kernel of this important cycle. It is composed offour conjuncted delay constraints, which remain true within the cycle. Apparently,(d−p53 ≥ d+Mdm2) is the most significant constraint which states that the degradation delay
Saeed et al. (2016), PeerJ, DOI 10.7717/peerj.2348 22/32

of p53 is greater than the production delay of Mdm2. That is, the rate of p53 synthesismust be greater than or equal to the production rate of Mdm2 for the system to maintainhomeostasis. Experimental studies corroborate that a long time delay between the increasein p53 and the increase in Mdm2 would lead to oscillatory behavior (Tyson, 2004; Ciliberto,Novák & Tyson, 2005). Additional work demonstrated that the amplitude of oscillations inthe p53-Mdm2 negative feedback loop are more variable than the period as a result of low-frequency noise in rates of protein production (Geva-Zatorsky et al., 2006). Fluctuationsin the behavior of protein circuits produces biological response variations even betweenindividual cells. In our study, we elucidated differences in the rate of cellular functions andidentified the requirements needed for a system to maintain homeostasis. Taken together,these results provide a deeper understanding of the modulation of biological networks thatplay critical roles in tumorigenesis.
CONCLUSIONHyper O-GlcNAcylation is known to upregulate key oncogenes and play an important rolein cancer metabolism and tumorigenesis. However, the precise mechanism of oncogenicactivation by O-GlcNAcylation resulting in enhanced cancer progression, has not yet beenclearly established. In this paper, we used a computational modeling approach to study thefunction of the Hexosamine Biosynthetic Pathway, which triggers hyper O-GlcNAcylation.Within the p53-Mdm2 circuit, we found that p53 synthesis must occur at a greater than orequal rate toMdm2 production in order to restore the system to a cancer recovery state andpreserve homeostasis. We analyzed different simulation trajectories, which showed thatenhanced expression of O-GlcNAc-transferase (OGT) consistently upregulates NF-κB,PI3K and FoxM1. Moreover, when OGT forms a positive feedback loop with c-Myc, theoverall system converges to a deadlock state from where recovery is not possible. Thesefindings suggest that OGT is acting as a critical mediator of various oncogenic and tumorsuppressor proteins implicated in tumor growth and development. We acknowledge thatour findings are derived from a qualitative approach and could be dependent on cellulardynamics and environment. However, these discoveries form the foundation and directionof future translational research studies to design a quantitative model with additionaltools and experimental verification for the development of molecular therapeutics. Takentogether, mechanism-based therapies that are designed to target hyper O-GlcNAcylationand OGT may hold clinical benefits in the treatment of cancer.
ADDITIONAL INFORMATION AND DECLARATIONS
FundingThe authors received no funding for this work.
Competing InterestsThe authors declare there are no competing interests.
Saeed et al. (2016), PeerJ, DOI 10.7717/peerj.2348 23/32

Author Contributions• Muhammad Tariq Saeed conceived and designed the experiments, performed theexperiments, analyzed the data, contributed reagents/materials/analysis tools, wrote thepaper, prepared figures and/or tables, reviewed drafts of the paper.• Jamil Ahmad conceived and designed the experiments, performed the experiments,analyzed the data, contributed reagents/materials/analysis tools, wrote the paper,reviewed drafts of the paper.• Shahzina Kanwal conceived and designed the experiments, analyzed the data, wrote thepaper, reviewed drafts of the paper.• Andreana N. Holowatyj analyzed the data, wrote the paper, reviewed drafts of the paper.• Iftikhar A. Sheikh analyzed the data, reviewed drafts of the paper, technical Support.• Rehan Zafar Paracha analyzed the data, prepared figures and/or tables, reviewed draftsof the paper.• Aamir Shafi analyzed the data, contributed reagents/materials/analysis tools, revieweddrafts of the paper, technical Support.• Amnah Siddiqa, Zurah Bibi and Mukaram Khan analyzed the data, prepared figuresand/or tables, reviewed drafts of the paper.• Amjad Ali conceived and designed the experiments, analyzed the data, contributedreagents/materials/analysis tools, wrote the paper, reviewed drafts of the paper.
Data AvailabilityThe following information was supplied regarding data availability:
The raw data has been supplied as a Supplementary File.
Supplemental InformationSupplemental information for this article can be found online at http://dx.doi.org/10.7717/peerj.2348#supplemental-information.
REFERENCESAbou-JaoudéW, Ouattara DA, KaufmanM. 2009. From structure to dynamics: fre-
quency tuning in the p53–mdm2 network: I. logical approach. Journal of TheoreticalBiology 258(4):561–577 DOI 10.1016/j.jtbi.2009.02.005.
Ahmad J. 2009.Modélisation hybride et analyse des dynamiques des réseaux de régula-tions biologiques en tenant compte des délais. PhD Thesis, Nantes.
Ahmad J, Bernot G, Comet J-P, Lime D, Roux O. 2007.Hybrid modelling and dynamicalanalysis of gene regulatory networks with delays. ComPlexUs 3(4):231–251.
Ahmad J, Niazi U, Mansoor S, Siddique U, Bibby J. 2012. Formal modeling and analysisof the MAL-associated biological regulatory network: insight into cerebral malaria.PLoS ONE 7(3):e33532 DOI 10.1371/journal.pone.0033532.
Aittokallio T, Schwikowski B. 2006. Graph-based methods for analysing networks in cellbiology. Briefings in Bioinformatics 7(3):243–255 DOI 10.1093/bib/bbl022.
Al-Khayal K, Abdulla M, Al-Obeed O, Al KattanW, Zubaidi A, Vaali-MohammedM-A, Alsheikh A, Ahmad R. 2016. Identification of the tp53-induced glycolysis and
Saeed et al. (2016), PeerJ, DOI 10.7717/peerj.2348 24/32
apoptosis regulator in various stages of colorectal cancer patients. Oncology Reports35(3):1281–1286 DOI 10.3892/or.2015.4494.
Alexandrov LB, Nik-Zainal S, Wedge DC, Aparicio SA, Behjati S, Biankin AV, BignellGR, Bolli N, Borg A, Børresen-Dale A-L, Boyault S, Burkhardt B, Butler AP,Caldas C, Davies HR, Desmedt C, Eils R, Eyfjörd JE, Foekens JA, Greaves M,Hosoda F, Hutter B, Ilicic T, Imbeaud S, Imielinski M, Jäger N, Jones DT, JonesD, Knappskog S, Kool M, Lakhani SR, López-Otìn C, Martin S, Munshi NC,Nakamura H, Northcott PA, Pajic M, Papaemmanuil E, Paradiso A, Pearson JV,Puente XS, Raine K, RamakrishnaM, Richardson AL, Richter J, Rosenstiel P,Schlesner M, Schumacher TN, Span PN, Teague JW, Totoki Y, Tutt AN, Valdés-Mas R, Van BuurenMM, Van’t Veer L, Vincent-Salomon A,Waddell N, Yates LR,Australian Pancreatic Cancer Genome Initiative, ICGC Breast Cancer Consor-tium, ICGCMMML-Seq Consortium, ICGC PedBrain, Zucman-Rossi J, FutrealPA, McDermott U, Lichter P, MeyersonM, Grimmond SM, Siebert R, Campo E,Shibata T, Pfister SM, Campbell PJ, StrattonMR. 2013. Signatures of mutationalprocesses in human cancer. Nature 500(7463):415–421 DOI 10.1038/nature12477.
Arora R, Yates C, Gary BD, McClellan S, TanM, Xi Y, Reed E, Piazza Ga, Owen LB,Dean-ColombW. 2014. Panepoxydone targets NF-kB and FOXM1 to inhibitproliferation, induce apoptosis and reverse epithelial to mesenchymal transition inbreast cancer. PLoS ONE 9(6):e98370 DOI 10.1371/journal.pone.0098370.
Aslam B, Ahmad J, Ali A, Zafar Paracha R, Tareen SHK, Niazi U, Saeed T. 2014.On the modelling and analysis of the regulatory network of dengue viruspathogenesis and clearance. Computational Biology and Chemistry 53:277–291DOI 10.1016/j.compbiolchem.2014.10.003.
Atkinson DE. 1965. Biological feedback control at the molecular level. Science150(3698):851–857 DOI 10.1126/science.150.3698.851.
Bar-Or RL, Maya R, Segel LA, Alon U, Levine AJ, OrenM. 2000. Generation of os-cillations by the p53-Mdm2 feedback loop: a theoretical and experimental study.Proceedings of the National Academy of Sciences of the United States of America97(21):11250–11255 DOI 10.1073/pnas.210171597.
Barabasi A-L, Oltvai ZN. 2004. Network biology: understanding the cell’s functionalorganization. Nature Reviews Genetics 5(2):101–113 DOI 10.1038/nrg1272.
Bernot G, Cassez F, Comet J-P, Delaplace F, Müller C, Roux O. 2007. Semantics ofbiological regulatory networks. Electronic Notes in Theoretical Computer Science180(3):3–14 DOI 10.1016/j.entcs.2004.01.038.
Bernot G, Comet J-P, Richard A, Guespin J. 2004. Application of formal methodsto biological regulatory networks: extending Thomas’ asynchronous logicalapproach with temporal logic. Journal of Theoretical Biology 229(3):339–347DOI 10.1016/j.jtbi.2004.04.003.
Bondy JA, Murty USR. 1976.Graph theory with applications. Vol. 290. London: Macmil-lan.
Cairns RA, Harris IS, Mak TW. 2011. Regulation of cancer cell metabolism. NatureReviews Cancer 11(2):85–95 DOI 10.1038/nrc2981.
Saeed et al. (2016), PeerJ, DOI 10.7717/peerj.2348 25/32
Caldwell S, Jackson S, Shahriari K, Lynch T, Sethi G,Walker S, Vosseller K, ReginatoM. 2010. Nutrient sensor O-GlcNAc transferase regulates breast cancer tumori-genesis through targeting of the oncogenic transcription factor FoxM1. Oncogene29(19):2831–2842 DOI 10.1038/onc.2010.41.
Chaouiya C, Naldi A, Thieffry D. 2012. Logical modelling of gene regulatory networkswith ginsim. Bacterial Molecular Networks: Methods and Protocols 804:463–479DOI 10.1007/978-1-61779-361-5_23.
Chubukov V, Gerosa L, Kochanowski K, Sauer U. 2014. Coordination of microbialmetabolism. Nature Reviews Microbiology 12(5):327–340 DOI 10.1038/nrmicro3238.
Ciliberto A, Novák B, Tyson JJ. 2005. Steady states and oscillations in the p53/Mdm2network. Cell Cycle 4(3):488–493 DOI 10.4161/cc.4.3.1548.
Cimatti A, Clarke E, Giunchiglia E, Giunchiglia F, Pistore M, Roveri M, Sebastiani R,Tacchella A. 2002. Nusmv 2: an opensource tool for symbolic model checking. In:Computer aided verification. Berlin Heidelberg: Springer, 359–364.
Clarke EM, Grumberg O, Peled D. 1999.Model checking. Cambridge: MIT press.Colotta F, Allavena P, Sica A, Garlanda C, Mantovani A. 2009. Cancer-related inflam-
mation, the seventh hallmark of cancer: links to genetic instability. Carcinogenesis30(7):1073–1081 DOI 10.1093/carcin/bgp127.
Cordon-Cardo C, Prives C. 1999. At the crossroads of inflammation and tumorigenesis.The Journal of Experimental Medicine 190(10):1367–1370DOI 10.1084/jem.190.10.1367.
Dang CV. 2012.MYC on the path to cancer. Cell 149(1):22–35DOI 10.1016/j.cell.2012.03.003.
Dang CV, Kim J-w, Gao P, Yustein J. 2008. The interplay between MYC and HIF incancer. Nature Reviews Cancer 8(1):51–56 DOI 10.1038/nrc2274.
DeBerardinis RJ, Mancuso A, Daikhin E, Nissim I, Yudkoff M,Wehrli S, ThompsonCB. 2007. Beyond aerobic glycolysis: transformed cells can engage in glutaminemetabolism that exceeds the requirement for protein and nucleotide synthesis.Proceedings of the National Academy of Sciences of the United States of America104(49):19345–19350 DOI 10.1073/pnas.0709747104.
DeBerardinis RJ, Sayed N, Ditsworth D, Thompson CB. 2008. Brick by brick:metabolism and tumor cell growth. Current Opinion in Genetics & Development18(1):54–61 DOI 10.1016/j.gde.2008.02.003.
De Jong H. 2002.Modeling and simulation of genetic regulatory systems: a literaturereview. Journal of Computational Biology 9(1):67–103DOI 10.1089/10665270252833208.
DeQueiroz RM, Carvalho E, DiasWB. 2014. O-GlcNAcylation: the sweet side of thecancer. Frontiers in Oncology 4(June):132 DOI 10.3389/fonc.2014.00132.
Disis ML. 2010. Immune regulation of cancer. Journal of Clinical Oncology 28(29)4531–4538 DOI 10.1200/JCO.2009.27.2146.
Dittmer D, Pati S, Zambetti G, Chu S, Teresky AK, MooreM, Finlay C, LevineAJ. 1993. Gain of function mutations in p53. Nature Genetics 4(1):42–46DOI 10.1038/ng0593-42.
Saeed et al. (2016), PeerJ, DOI 10.7717/peerj.2348 26/32

Dvorak HF. 1986. Tumors: wounds that do not heal: similarities between tumorstroma generation and wound healing. The New England Journal of Medicine315(26):1650–1659 DOI 10.1056/NEJM198612253152606.
Ernst P. 1999. Review article: the role of inflammation in the pathogenesis of gastriccancer. Alimentary Pharmacology & Therapeutics 13(s1):13–18DOI 10.1046/j.1365-2036.1999.00003.x.
Fardini Y, Dehennaut V, Lefebvre T, Issad T. 2013. O-GlcNAcylation: a new cancerhallmark? Frontiers in Endocrinology 4:99 DOI 10.3389/fendo.2013.00099.
Gambino V, DeMichele G, Venezia O, Migliaccio P, Dall’Olio V, Bernard L, Mi-nardi SP, Fazia MAD, Bartoli D, Servillo G, Alcalay M, Luzi L, Giorgio M,Scrable H, Pelicci PG, Migliaccio E. 2013. Oxidative stress activates a specific p53transcriptional response that regulates cellular senescence and aging. Aging Cell12(3):435–445 DOI 10.1111/acel.12060.
Gardner TS, Cantor CR, Collins JJ. 2000. Construction of a genetic toggle switch inEscherichia coli. Nature 403(6767):339–342 DOI 10.1038/35002131.
Gartel AL, Tyner AL. 1999. Transcriptional regulation of the p21 (WAF1/CIP1) gene.Experimental Cell Research 246(2):280–289 DOI 10.1006/excr.1998.4319.
Geva-Zatorsky N, Rosenfeld N, Itzkovitz S, Milo R, Sigal A, Dekel E, Yarnitzky T, LironY, Polak P, Lahav G, Alon U. 2006. Oscillations and variability in the p53 system.Molecular Systems Biology Epub ahead of print Jun 13 2006.
Gross D, Van den Heuvel A, BirnbaumM. 2008. The role of FoxO in the regulation ofmetabolism. Oncogene 27(16):2320–2336 DOI 10.1038/onc.2008.25.
Gu Y, MiW, Ge Y, Liu H, Fan Q, Han C, Yang J, Han F, Lu X, YuW. 2010. Glc-NAcylation plays an essential role in breast cancer metastasis. Cancer Research70(15):6344–6351 DOI 10.1158/0008-5472.CAN-09-1887.
Guttridge DC, Albanese C, Reuther JY, Pestell RG, Baldwin AS. 1999. NF-κB controlscell growth and differentiation through transcriptional regulation of cyclin D1.Molecular and Cellular Biology 19(8):5785–5799 DOI 10.1128/MCB.19.8.5785.
Hanahan D,Weinberg RA. 2000. The hallmarks of cancer. Cell 100(1):57–70DOI 10.1016/S0092-8674(00)81683-9.
Hanahan D,Weinberg RA. 2011.Hallmarks of cancer: the next generation. Cell144(5):646–674 DOI 10.1016/j.cell.2011.02.013.
Haq R, Shoag J, Andreu-Perez P, Yokoyama S, Edelman H, Rowe GC, Frederick DT,Hurley AD, Nellore A, Kung AL,Wargo JA, Song JS, Fisher DE, Arany Z,WidlundHR. 2013. Oncogenic BRAF regulates oxidative metabolism via PGC1α and MITF.Cancer Cell 23(3):302–315 DOI 10.1016/j.ccr.2013.02.003.
Hart GW, Housley MP, Slawson C. 2007. Cycling of O-linked β-N-acetylglucosamine onnucleocytoplasmic proteins. Nature 446(7139):1017–1022DOI 10.1038/nature05815.
Henzinger TA, Ho P-H,Wong-Toi H. 1997. HyTech: a model checker for hybridsystems. In: Computer aided verification. Berlin Heidelberg: Springer, 460–463.
Hernández-Reséndiz I, Román-Rosales A, García-Villa E, López-Macay A, PinedaE, Saavedra E, Gallardo-Pérez JC, Alvarez-Ríos E, Gariglio P, Moreno-Sánchez
Saeed et al. (2016), PeerJ, DOI 10.7717/peerj.2348 27/32

R, Rodríguez-Enríquez S. 2015. Dual regulation of energy metabolism by p53 inhuman cervix and breast cancer cells. Biochimica et Biophysica Acta (BBA)-MolecularCell Research 1853(12):3266–3278 DOI 10.1016/j.bbamcr.2015.09.033.
Hoesel B, Schmid JA. 2013. The complexity of NF-κB signaling in inflammation andcancer.Molecular Cancer 12(1):86 DOI 10.1186/1476-4598-12-86.
Hsu PP, Sabatini DM. 2008. Cancer cell metabolism: Warburg and beyond. Cell134(5):703–707 DOI 10.1016/j.cell.2008.08.021.
Issad T, KuoM. 2008. O-GlcNAc modification of transcription factors, glucose sens-ing and glucotoxicity. Trends in Endocrinology & Metabolism 19(10):380–389DOI 10.1016/j.tem.2008.09.001.
Itkonen HM,Minner S, Guldvik IJ, SandmannMJ, Tsourlakis MC, Berge V, SvindlandA, SchlommT,Mills IG. 2013. O-GlcNAc transferase integrates metabolic pathwaysto regulate the stability of c-MYC in human prostate cancer cells. Cancer Research73(16):5277–5287 DOI 10.1158/0008-5472.CAN-13-0549.
JangM, Kim SS, Lee J. 2013. Cancer cell metabolism: implications for therapeutic targets.Experimental & Molecular Medicine 45(10):e45 DOI 10.1038/emm.2013.85.
Jones PA, Baylin SB. 2007. The epigenomics of cancer. Cell 128(4):683–692DOI 10.1016/j.cell.2007.01.029.
KarinM. 2009. NF-kB as a critical link between inflammation and cancer. Cold SpringHarbor Perspectives in Biology 1(5):a000141.
Karlebach G, Shamir R. 2008.Modelling and analysis of gene regulatory networks.Nature Reviews Molecular Cell Biology 9(10):770–780 DOI 10.1038/nrm2503.
Kawauchi K, Araki K, Tobiume K, Tanaka N. 2008. p53 regulates glucose metabolismthrough an IKK-NF-κB pathway and inhibits cell transformation. Nature Cell Biology10(5):611–618 DOI 10.1038/ncb1724.
Kawauchi K, Araki K, Tobiume K, Tanaka N. 2009. Loss of p53 enhances catalyticactivity of IKKβ through O-linked β-N-acetyl glucosamine modification. Proceedingsof the National Academy of Sciences of the United States of America 106(9):3431–3436DOI 10.1073/pnas.0813210106.
Khalis Z, Comet J-P, Richard A, Bernot G. 2009. The SMBioNet method for discoveringmodels of gene regulatory networks. Genes, Genomes and Genomics 3(1):15–22.
Koschützki D, Schreiber F. 2008. Centrality analysis methods for biological networksand their application to gene regulatory networks. Gene Regulation and SystemsBiology 2:193.
Kroemer G, Pouyssegur J. 2008. Tumor cell metabolism: cancer’s achilles’ heel. CancerCell 13(6):472–482 DOI 10.1016/j.ccr.2008.05.005.
Kruiswijk F, Labuschagne CF, Vousden KH. 2015. p53 in survival, death and metabolichealth: a lifeguard with a licence to kill. Nature Reviews Molecular Cell Biology16(7):393–405 DOI 10.1038/nrm4007.
Krześlak A, Forma E, BernaciakM, Romanowicz H, Bryś M. 2012a. Gene expressionof O-GlcNAc cycling enzymes in human breast cancers. Clinical and ExperimentalMedicine 12(1):61–65 DOI 10.1007/s10238-011-0138-5.
Saeed et al. (2016), PeerJ, DOI 10.7717/peerj.2348 28/32

Krześlak A,Wójcik-Krowiranda K, Forma E, Bieńkiewicz A, Bryś M. 2012b. Expressionof genes encoding for enzymes associated with O-GlcNAcylation in endometrialcarcinomas: clinicopathologic correlations. Ginekologia Polska 83(1):22–26.
La Rosa F, Pierce JW, Sonenshein GE. 1994. Differential regulation of the c-myconcogene promoter by the NF-kappa B rel family of transcription factors.Molecularand Cellular Biology 14(2):1039–1044 DOI 10.1128/MCB.14.2.1039.
Lahav G. 2009. Oscillations by the p53-Mdm2 feedback loop. In: Cellular OscillatoryMechanisms. Berlin Heidelberg: Springer, 28–38.
Lahav G, Rosenfeld N, Sigal A, Geva-Zatorsky N, Levine AJ, Elowitz MB, Alon U.2004. Dynamics of the p53-Mdm2 feedback loop in individual cells. Nature Genetics36(2):147–150 DOI 10.1038/ng1293.
Lunt SY, Vander HeidenMG. 2011. Aerobic glycolysis: meeting the metabolic re-quirements of cell proliferation. Annual Review of Cell and Developmental Biology27:441–464 DOI 10.1146/annurev-cellbio-092910-154237.
Lynch TP, Ferrer CM, Jackson SR, Shahriari KS, Vosseller K, ReginatoMJ. 2012. Criti-cal role of O-Linked β-N-acetylglucosamine transferase in prostate cancer invasion,angiogenesis, and metastasis. Journal of Biological Chemistry 287(14):11070–11081DOI 10.1074/jbc.M111.302547.
Ma Z, Vocadlo DJ, Vosseller K. 2013.Hyper-O-GlcNAcylation is anti-apoptotic andmaintains constitutive NF-B activity in pancreatic cancer cells. Journal of BiologicalChemistry 288(21):15121–15130 DOI 10.1074/jbc.M113.470047.
Ma Z, Vosseller K. 2013. O-GlcNAc in cancer biology. Amino Acids 45(4):719–733DOI 10.1007/s00726-013-1543-8.
Maddocks ODK, Vousden KH. 2011.Metabolic regulation by p53. Journal of MolecularMedicine 89(3):237–245 DOI 10.1007/s00109-011-0735-5.
Major ML, Lepe R, Costa RH. 2004. Forkhead box M1B transcriptional activity requiresbinding of Cdk-cyclin complexes for phosphorylation-dependent recruitmentof p300/CBP coactivators.Molecular and Cellular Biology 24(7):2649–2661DOI 10.1128/MCB.24.7.2649-2661.2004.
Mak P, Li J, Samanta S, Mercurio AM. 2015. ERβ regulation of NF-κB activa-tion in prostate cancer is mediated by HIF-1. Oncotarget 6(37):40247–40254DOI 10.1128/MCB.24.7.2649-2661.2004.
Markert EK, Levine AJ, Vazquez A. 2012. Proliferation and tissue remodeling in cancer:the hallmarks revisited. Cell Death and Disease 3(10):e397 DOI 10.1038/cddis.2012.140.
Mason O, VerwoerdM. 2007. Graph theory and networks in biology. Systems Biology,IET 1(2):89–119 DOI 10.1049/iet-syb:20060038.
MiW, Gu Y, Han C, Liu H, Fan Q, Zhang X, Cong Q, YuW. 2011. O-GlcNAcylation is anovel regulator of lung and colon cancer malignancy. Biochimica et Biophysica Acta(BBA)-Molecular Basis of Disease 1812(4):514–519 DOI 10.1016/j.bbadis.2011.01.009.
Moretti M, Bennett J, Tornatore L, Thotakura AK, Franzoso G. 2012. Cancer: NF-κBregulates energy metabolism. International Journal of Biochemistry and Cell Biology44(12):2238–2243 DOI 10.1016/j.biocel.2012.08.002.
Saeed et al. (2016), PeerJ, DOI 10.7717/peerj.2348 29/32

Mullen AR,WheatonWW, Jin ES, Chen P-H, Sullivan LB, Cheng T, Yang Y, LinehanWM, Chandel NS, DeBerardinis RJ. 2012. Reductive carboxylation supportsgrowth in tumour cells with defective mitochondria. Nature 481(7381):385–388DOI 10.1038/nature10642.
Negrini S, Gorgoulis VG, Halazonetis TD. 2010. Genomic instability—an evolv-ing hallmark of cancer. Nature Reviews Molecular Cell Biology 11(3):220–228DOI 10.1038/nrm2858.
Pall ML. 1981. Gene-amplification model of carcinogenesis. Proceedings of the Na-tional Academy of Sciences of the United States of America 78(4):2465–2468DOI 10.1073/pnas.78.4.2465.
Pavlopoulos GA, Secrier M, Moschopoulos CN, Soldatos TG, Kossida S, Aerts J,Schneider R, Bagos PG. 2011. Using graph theory to analyze biological networks.BioData Mining 4(1):1–27 DOI 10.1186/1756-0381-4-10.
Perkins ND. 1997. Achieving transcriptional specificity with NF-κB. The InternationalJournal of Biochemistry & Cell Biology 29(12):1433–1448DOI 10.1016/S1357-2725(97)00088-5.
Plahte E, Mestl T, Omholt SW. 1995. Feedback loops, stability and multista-tionarity in dynamical systems. Journal of Biological Systems 3(02):409–413DOI 10.1142/S0218339095000381.
Poltz R, NaumannM. 2012. Dynamics of p53 and NF-κB regulation in response to DNAdamage and identification of target proteins suitable for therapeutic intervention.BMC Systems Biology 6(1):1 DOI 10.1186/1752-0509-6-125.
Potter VR. 1958. The biochemical approach to the cancer problem. In: Federationproceedings, Vol. 7, 691–697.
Puzio-Kuter AM. 2011. The role of p53 in metabolic regulation. Genes & Cancer2(4):385–391 DOI 10.1177/1947601911409738.
Rajeshkumar N, Dutta P, Yabuuchi S, DeWilde RF, Martinez GV, Le A, Kam-phorst JJ, Rabinowitz JD, Jain SK, HidalgoM, Dang CV, Gillies RJ, MaitraA. 2015. Therapeutic targeting of the Warburg effect in pancreatic cancerrelies on an absence of p53 function. Cancer Research 75(16):3355–3364DOI 10.1158/0008-5472.CAN-15-0108.
Richard A, Comet JP, Bernot G. 2006. Formal methods for modeling biologicalregulatory networks. In:Modern formal methods and applications. Amsterdam:Springer, 83–122.
RozanskiW, Krzeslak A, Forma E, Brys M, Blewniewski M,Wozniak P, Lipinski M.2012. Prediction of bladder cancer based on urinary content of MGEA5 and OGTmRNA level. Clinical Laboratory 58:579–583.
Saeed T, Ahmad J. 2014. A parallel approach for accelerated parameter identification ofgene regulatory networks. In: Proceedings of the 2nd international work conference onbioinformatics and biomedical engineering (IWBBIO), Spain.
Semenza GL. 2007.Hypoxia-inducible factor 1 (HIF-1) pathway. Science Signaling2007(407):cm8–cm8.
Saeed et al. (2016), PeerJ, DOI 10.7717/peerj.2348 30/32
Shannon P, Markiel A, Ozier O, Baliga NS,Wang JT, Ramage D, Amin N, SchwikowskiB, Ideker T. 2003. Cytoscape: a software environment for integrated modelsof biomolecular interaction networks. Genome Research 13(11):2498–2504DOI 10.1101/gr.1239303.
Singh JP, Zhang K,Wu J, Yang X. 2015. O-GlcNAc signaling in cancer metabolism andepigenetics. Cancer Letters 356(2):244–250 DOI 10.1016/j.canlet.2014.04.014.
Slawson C, Copeland R, Hart GW. 2010. O-GlcNAc signaling: a metabolic linkbetween diabetes and cancer? Trends in Biochemical Sciences 35(10):547–555DOI 10.1016/j.tibs.2010.04.005.
Snoussi EH, Thomas R. 1993. Logical identification of all steady states: the concept offeedback loop characteristic states. Bulletin of Mathematical Biology 55(5):973–991DOI 10.1007/BF02460695.
Sodi VL, Khaku S, Krutilina R, Schwab LP, Vocadlo DJ, Seagroves TN, ReginatoMJ. 2015.mTOR/MYC axis regulates O-GlcNAc transferase expression andO-GlcNAcylation in breast cancer.Molecular Cancer Research 13(5):923–933DOI 10.1158/1541-7786.MCR-14-0536.
Soesanto YA, Luo B, Jones D, Taylor R, Gabrielsen JS, Parker G, McClain DA. 2008.Regulation of akt signaling by O-GlcNAc in euglycemia. American Journal ofPhysiology-Endocrinology and Metabolism 295(4):E974–E980DOI 10.1152/ajpendo.90366.2008.
Soussi T, Wiman KG. 2015. TP53: an oncogene in disguise. Cell Death & Differentiation22(8):1239–1249 DOI 10.1038/cdd.2015.53.
Thieffry D, Thomas R. 1995. Dynamical behaviour of biological regulatory networks—ii. Immunity control in bacteriophage lambda. Bulletin of Mathematical Biology57(2):277–297 DOI 10.1007/BF02460619.
Thomas R. 1973. Boolean formalization of genetic control circuits. Journal of TheoreticalBiology 42(3):563–585 DOI 10.1016/0022-5193(73)90247-6.
Thomas R. 1978. Logical analysis of systems comprising feedback loops. Journal ofTheoretical Biology 73(4):631–656 DOI 10.1016/0022-5193(78)90127-3.
Thomas R. 1991. Regulatory networks seen as asynchronous automata: a logical descrip-tion. Journal of Theoretical Biology 153(1):1–23DOI 10.1016/S0022-5193(05)80350-9.
Torres C-R, Hart GW. 1984. Topography and polypeptide distribution of terminal N-acetylglucosamine residues on the surfaces of intact lymphocytes. Evidence for O-linked GlcNAc. Journal of Biological Chemistry 259(5):3308–3317.
Tyson JJ. 2004.Monitoring p53’s pulse. Nature Genetics 36(2):113–114DOI 10.1038/ng0204-113.
Vander HeidenMG, Cantley LC, Thompson CB. 2009. Understanding the Warburg ef-fect: the metabolic requirements of cell proliferation. Science 324(5930):1029–1033DOI 10.1126/science.1160809.
Walsh T, KingM-C. 2007. Ten genes for inherited breast cancer. Cancer Cell 11(2):103–105 DOI 10.1016/j.ccr.2007.01.010.
Saeed et al. (2016), PeerJ, DOI 10.7717/peerj.2348 31/32

Warburg O. 1910. The metabolism of tumours: investigations from the Kaiser Wilhelminstitute for biology. Translated by Dickens, F. Constable & Co Ltd., 1930, 56(out of print). Ref. Hoppe-Seyler’s Zeitschrift für Physiologische Chemie 66:305DOI 10.1515/bchm2.1910.66.4-6.305.
Warburg O. 1956. On the origin of cancer cells. Science 123(3191):309–314DOI 10.1126/science.123.3191.309.
Wasserman S. 1994. Social network analysis: methods and applications. Vol. 8. Cam-bridge: Cambridge University Press.
Weinhouse S, Warburg O, Burk D, Schade AL. 1956. On respiratory impairment incancer cells. Science 124(3215):267–272 DOI 10.1126/science.124.3215.267.
WonKY, Lim SJ, Kim GY, Kim YW, Han SA, Song JY, Lee DK. 2012. Regulatory roleof p53 in cancer metabolism via SCO2 and TIGAR in human breast cancer. HumanPathology 43(2):221–228 DOI 10.1016/j.humpath.2011.04.021.
World Health Organization. 2014.World cancer report 2014. Geneva: WHO.YangWH, Kim JE, NamHW, Ju JW, KimHS, Kim YS, Cho JW. 2006.Modification of
p53 with O-linked N-acetylglucosamine regulates p53 activity and stability. NatureCell Biology 8(10):1074–1083 DOI 10.1038/ncb1470.
Ying H, Kimmelman AC, Lyssiotis CA, Hua S, Chu GC, Fletcher-Sananikone E,Locasale JW, Son J, Zhang H, Coloff JL, Yan H,WangW, Chen S, Viale A, Zheng H,Paik JH, Lim C, Guimaraes AR, Martin ES, Chang J, Hezel AF, Perry SR, Hu J, GanB, Xiao Y, Asara JM,Weissleder R,Wang YA, Chin L, Cantley LC, DePinho RA.2012. Oncogenic Kras maintains pancreatic tumors through regulation of anabolicglucose metabolism. Cell 149(3):656–670 DOI 10.1016/j.cell.2012.01.058.
Zhu Q, Zhou L, Yang Z, Lai M, Xie H,Wu L, Xing C, Zhang F, Zheng S. 2012.O-GlcNAcylation plays a role in tumor recurrence of hepatocellular car-cinoma following liver transplantation.Medical Oncology 29(2):985–993DOI 10.1007/s12032-011-9912-1.
Saeed et al. (2016), PeerJ, DOI 10.7717/peerj.2348 32/32