forests of europe
TRANSCRIPT

St atist ical book s
Forestry in the EU and the world
2011 edition
A statistical portrait
Forestry in the EU and the worldA statistical portrait
The International Year of Forests 2011 is a UN initiative reinforcing the message that forests are vital to the survival and well-being of mankind. This Eurostat publication supports the UN initiative by statistically depicting forests in their various dimensions.
Forests have a variety of ecological functions, serving as habitats for plant and animal species, helping to protect water and soil resources, as well as contributing to the fight against climate change. On the other hand, forests are an important economic factor as suppliers of wood and other forest products.
Forests and other wooded land cover more than 40 % of the EU’s land area, and the EU is set apart from many other global regions insofar as it is one of the few regions of the world where forest area is currently expanding. This publication presents information for the EU and its Member States, as well as comparisons with countries that have considerable forest resources.
http://ec.europa.eu/eurostat
Forestry in the EU and the w
orld ■ A
statistical portrait
KS-31-11-137-EN-C
2011 edition9 7 8 9 2 7 9 1 9 9 8 8 2

HOW TO OBTAIN EU PUBLICATIONS Free publications: • via EU Bookshop (http://bookshop.europa.eu);
• at the European Union’s representations or delegations. You can obtain their contact details on the Internet (http://ec.europa.eu) or by sending a fax to +352 2929-42758.
Priced publications: • via EU Bookshop (http://bookshop.europa.eu).
Priced subscriptions (e.g. annual series of the Official Journal of the European Union and reports of cases before the Court of Justice of the European Union): • via one of the sales agents of the Publications Office of the European Union
(http://publications.europa.eu/others/agents/index_en.htm).

St atist ical book s
Forestry in the EU and the world
2011 edition
A statistical portrait

Europe Direct is a service to help you find answers to your questions about the European Union.
Freephone number (*):
00 800 6 7 8 9 10 11(*) Certain mobile telephone operators do not allow access to 00 800 numbers or these calls may be
billed.
More information on the European Union is available on the Internet (http://europa.eu).
Cataloguing data can be found at the end of this publication.
Luxembourg: Publications Office of the European Union, 2011
ISBN 978-92-79-19988-2doi:10.2785/13022 Cat. No KS-31-11-137-EN-C
Theme: Agriculture and fisheries Collection: Statistical books
© European Union, 2011Reproduction of content other than photos is authorised, provided that the source is acknowledged.
Photos: Cover photo (and page 4): Red-breasted flycatcher (Ficedula parva), a species that breeds in mature broadleaved or mixed forests in the temperate zones of Europe and across central Asia, wintering in India and Pakistan. The picture was taken at Almsee, Austria. (© Norbert Pühringer)Chapter 1: Broadleaved forest and mature apple trees in early autumn. (© Phovoir)Chapter 2: Poplar plantations are used to grow pulpwood and are common in the temperate zones of the EU. (© Phovoir)Chapter 3: Office building in Walferdange, Luxembourg, designed by architects Ballini Pitt & Partners. The entire structure and the cladding is made of European larch (Larix decidua), a coniferous species. The building was finished in 2000. (© Marilise Wolf-Crowther)Chapter 4: A stack of fuelwood logs. (© Phovoir)The reproduction of these photos is prohibited.
Printed in Belgium
Printed on recycled PaPer that has been awarded the eU ecolabel for graPhic PaPer (httP://ec.eUroPa.eU/ecolabel)

Foreword
Dear reader,
This publication presents our contribution to the International Year of Forests 2011.
Forests are an essential part of the natural environment. They have an impact on water resources by purifying water and influencing rainfall patterns, as well as protecting against extreme events such as floods, droughts and related phenomena, such as erosion. They act as a stabiliser for the Earth’s climate, absorbing carbon dioxide that would otherwise be in the atmosphere, storing carbon and producing oxygen.
Forests provide shelter to an extraordinarily wide range of animal and plant life, much of which remains to be discovered and understood. This diversity is responsible for the many different kinds of forest ecosystems, their productivity, their capacity to recycle biomass and all the other services that we depend on.
From an economic standpoint, forests provide food, medicinal and cosmetic resources, as well as genetic breeding stock and seeds for cultivation. Most visibly, forests provide wood and similar materials to be used for the manufacture of furniture, toys, instruments, containers and construction products, as a raw material for paper, and as a fuel. Wood is currently the most important renewable source of energy in the world. The management of forest resources and the harvesting and extraction of wood and other forest products provides employment in many rural areas.
Cultural, spiritual and aesthetic needs are supported by forests. Scenic landscapes and areas of outstanding natural beauty are often forested, attracting tourists and providing diverse opportunities for outdoor recreation. Furthermore, a range of long-established activities rely on forests, for instance the collection of berries and mushrooms, or hunting.
The data presented in this publication cover various aspects of forests, including the activities of forestry, logging and wood-based manufacturing, as well as trade in wood and wood products, and finally the use of wood as a renewable source of energy. I hope that the presentation of this broad range of data contributes to the global interest in forests generated during this year.
Pedro Díaz Muñoz
Director, Sectoral and regional statistics (Eurostat)

CREDITS
Editorial team Marilise Wolf-Crowther, Csaba Mozes, Rajmund Laczko
Production INFORMA sàrl ([email protected]): Giovanni Albertone, Simon Allen, Andrew Redpath
Data coverage, symbols and direct links to the database The data presented within this publication were extracted during February 2011. An italic font has been used in statistical tables to denote any data that may change in the future (estimates, provisional data and forecasts).The colon (:) is used to denote information that is not available. A dash (-) is used to denote information that is not applicable. A data code has been inserted under each table and graph as part of the source –this can be used to obtain direct access to the most recent data on Eurostat’s website at: http://epp.eurostat.ec.europa.eu/portal/page/portal/statistics/search_database
For more information Eurostat, the statistical office of the European Union,Bâtiment Joseph Bech,5 rue Alphonse WeickerL-2721 Luxembourghttp://ec.europa.eu/eurostatE-mail: [email protected]
All statements on policies within this publication are given for information purposes only. They do not constitute an official policy position of the European Commission and are not legally binding. To know more about such policies, please consult the European Commission’s website at: http://ec.europa.eu

Foreword 1
The International Year of Forests 2011 5
Forestry in Europe 5Forest objectives of the European Union 5Organisations working in the forestry domain in Europe 7
Forestry in the world 8
1. Forests 11Forest resources in the EU 12Forest resources in the world 16Forest products and services 20Forests and the environment 22
2. The economics of forestry and wood processing 29Forestry and logging in the EU 30Forestry and logging in the world 34Wood-based manufacturing in the EU 36Wood-based manufacturing in the world 42
3. Wood and wood products 45Production of wood products in the EU 46Trade in wood products in the EU 57Production of wood products in the world 78Trade in wood products in the world 80Waste and recycling of wood products in the EU 83Pulp and paper recovery in the world 87
4. Wood as a source of energy 91Wood consumption as a source of energy in the EU 92Production and trade of fuelwood in the world 99
Annexes 100List of wood and paper products 100Statistical symbols, abbreviations and acronyms 106Carbon conversion factors 107

5 Forestry in the EU and the world — a statistical portrait
The International Year of Forests 2011
The International Year of Forests 2011 is meant to celebrate both “forests for people” and “people for forests”. It offers an opportunity to raise public awareness of the significant contributions of forests around the world to life on our planet, to highlight the challenges facing many of the world’s forests and the people who depend on them, and to show what is being done to manage our forests sustainably. The year was officially launched at the ninth session of the United Nations Forum on Forests in New York on 2 February 2011.
The logo is designed to convey the theme of forests for people, depicting the central role that people play in the sustainable management, conservation and development of the world’s forests. The design reminds us of some of the multiple values of forests and the need for a 360-degree perspective: forests provide shelter to people and habitat to diverse communities of plants and animals; they are a source of food, medicine and clean water; and they play a vital role in maintaining a stable global climate and environment. All of these elements taken together reinforce the message that forests are vital to the survival and well-being of people everywhere, all 7 000 million inhabitants of the planet.
The International Year offers an opportunity to raise public awareness of the significant contributions of forests around the world, but also to highlight the challenges facing many of the world’s forests and the people who depend on them.
For more information: http://www.un.org/forests
Forestry in Europe
Forest objectives of the European Union
Some 56 % of the population in the 27 Member States of the European Union (EU) live in rural areas, which cover 91 % of the overall territory; as such, rural development is an important policy area. Farming and forestry remain crucial for land use and the management of natural resources in the EU’s rural areas, and as a basis for economic diversification in rural communities. While the EU has no separate policy on forestry, it funds many different measures for rural development that directly benefit forest owners.
Rural development policy is part of the EU’s common agricultural policy (CAP) which has been the main instrument for implementing forestry measures in recent years. In this context, financial support from the EU for forestry measures, not including direct funding by the Member States, amounted to EUR 4 800 million for the period 2000–2006 (almost 10 % of the rural development budget). It is estimated that spending on forest-related measures during the 2007-2013 period through the European Agricultural Fund for Rural Development will amount to between EUR 9 000 million and EUR 10 000 million.

6 Forestry in the EU and the world — a statistical portrait
In 2006 the EU underpinned its support for sustainable forest management and the multi-functional role of forests by adopting an EU Forest Action Plan. The plan is a framework for forest-related measures and is used to coordinate EU initiatives with the forest policies of the Member States. There are 18 key actions proposed to be implemented jointly with the Member States during the period 2007-2011. The plan focuses on four main objectives:
improving long-term competitiveness; ■improving and protecting the environment; ■contributing to quality of life; ■fostering coordination and communication. ■
The EU promotes sustainable forest management with the following objectives:
create and preserve jobs and otherwise contribute to rural livelihoods; ■protect the environment by preserving the soil, minimising erosion, purifying water, ■protecting aquifers, improving air quality, absorbing carbon, mitigating climate change, and preserving biodiversity;protect settlements, roads and other infrastructure from mudslides and avalanches; ■monitor the state of forests to meet environmental agreements; ■improve the competitiveness of wood-based manufacturing industries in the internal ■market;promote the use of wood and other forest products as environmentally friendly products; ■reduce poverty in developing countries by furthering forest law enforcement, fair trade ■conditions and halting deforestation and illegal logging.
For more information: http://ec.europa.eu/agriculture/fore/index_en.htm
Illegal logging is the harvesting of timber in contravention of the laws and regulations of the country of harvest. Illegal logging is a global problem with considerable negative economic, environmental and social impacts. In economic terms illegal logging results in lost revenues and other foregone benefits. In environmental terms it is associated with deforestation, climate change and a loss of biodiversity. In social terms it can be linked to conflicts over land and resources, the disempowerment of local and indigenous communities, corruption and armed conflicts.
In 2003, the EU established a Forest Law Enforcement, Governance and Trade (FLEGT) Action Plan, targeting key regions and countries which together contain nearly 60 % of the world’s forests and supply a large proportion of internationally traded timber. The FLEGT Action Plan covers both supply side and demand side measures to address illegal logging by helping producer countries implement their own laws.
In 2005 the FLEGT Regulation was adopted, allowing for the control of the entry of timber to the EU from countries entering into bilateral FLEGT Voluntary Partnership Agreements with the EU.
In October 2010 the European Parliament and the Council adopted a Regulation prohibiting illegally harvested timber products from being placed on the EU market – it will apply from March 2013. FLEGT timber will automatically be compliant with the Regulation, which has provisions to facilitate the traceability of wood products within the EU back to their first entry into the market, but not back to their forest of origin. It covers most wood products, including pulp and paper, and requires operators to have systems in place that assure that the timber is from

7 Forestry in the EU and the world — a statistical portrait
legal origin and that they have exercised ‘due diligence’ in checking suppliers. The legislation foresees that monitoring organisations will set up systems to assess risk; operators will likely find it useful to become members of these organisations. The Regulation is closely modelled on the US Lacey Act Amendment of 2008. It is hoped that together these acts will effectively reduce the use illegal timber in consumer countries and deforestation in producer countries. They are also expected to reduce illegal logging in certain Member States of the EU.
For more information: http://ec.europa.eu/environment/forests/illegal_logging.htm
Organisations working in the forestry domain in Europe
The EU collaborates with a range of organisations in the fields of forestry policy development and statistics. Eurostat contributes data on employment and the economics of forestry and wood-based manufacturing to these initiatives.
The Ministerial Conference on the Protection of Forests in Europe (MCPFE), also known as Forest Europe, is a pan-European policy process for the sustainable management of the continent’s forests. Forest Europe develops common strategies for its 46 member countries, which include all of the EU Member States, other European countries and Russia. Founded in 1990, the cooperation between countries has produced guidelines, indicators and criteria for sustainable forest management.
SuStainable foreSt management
‘Sustainable management means the stewardship and use of forests and forest lands in such a way, and at a rate, that maintains their biodiversity, productivity, regeneration capacity, vitality and their potential to fulfil, now and in the future, relevant ecological, economic and social functions, at local, national, and global levels, and that does not cause damage to other ecosystems.”
The Ministerial Conference for Protection of Forests in Europe, Helsinki 1993
Every five years, Forest Europe launches a comprehensive questionnaire survey on the State of Europe’s Forests (SoEF) among its members.
For more information: http://www.foresteurope.org
The UNECE/FAO (United Nations Economic Commission for Europe/Food and Agricultural Organization) Forestry and Timber Section has provided data and analyses for the forest sector in the UNECE region for more than 60 years, starting right after World War II.
UNECE/FAO is also a forum for policy discussions about issues that affect forestry. The section is unique in that it is a joint secretariat, servicing the UNECE Timber Committee and the FAO European Forestry Commission and working closely with other United Nations organisations and with interest groups. It operates to a mandate agreed by 56 countries, which include the EU Member States, other European countries, Canada, the United States and Russia. A large part of its work is devoted to helping its member countries build the capacity for managing their forests, marketing their products and reporting statistical data.
For more information: http://timber.unece.org/index.php

8 Forestry in the EU and the world — a statistical portrait
Forestry in the world
Given the global importance of forests, a range of international organisations have been founded in order to promote the role of forests and to assure their continued existence. Eurostat works together with the United Nations and its subsidiary bodies to harmonise and collate statistical data on production and trade in wood and wood products; a single joint questionnaire is used, with common definitions and formats. Data are exchanged, cross-checked and published by each organisation.
For more information: http://epp.eurostat.ec.europa.eu/portal/page/portal/forestry/introduction
Global forest objectives
In its resolution declaring 2011 as the International Year of Forests, the General Assembly of the United Nations reaffirmed its commitment to a statement of principles for a global consensus on the management, conservation and sustainable development of all types of forests, also known as the Forest Principles. These principles were one of five outcomes of the 1992 United Nations Conference on Environment and Development (UNCED) – the Earth summit in Rio de Janeiro, Brazil.
The Non-Legally Binding Instrument on All Types of Forests was adopted by the UN General Assembly in December 2007, effectively replacing the Forest Principles. The overall purpose of this instrument is to:
strengthen political commitment and action at all levels to implement effectively sustainable ■management of all types of forests and to achieve the shared global objectives on forests;enhance the contribution of forests to the achievement of the internationally agreed ■development goals, including the Millennium Development Goals, in particular with respect to poverty eradication and environmental sustainability;provide a framework for national action and international cooperation. ■
In October 2000, the Economic and Social Council of the United Nations established the United Nations Forum on Forests (UNFF), a subsidiary body whose main objective is to promote “… the management, conservation and sustainable development of all types of forests and to strengthen long-term political commitment to this end…”, based on the Rio Declaration, the Forest Principles, Chapter 11 of Agenda 21 (combating deforestation) and the outcome of the IPF/IFF Processes (respectively, the Intergovernmental Panel on Forests and the Intergovernmental Forum on Forests) and other key milestones of international forest policy. The Forum has universal membership, and is composed of all Member States of the United Nations and specialised agencies.
For more information: http://www.un.org/esa/forests/about.html
The Forestry Department of the Food and Agricultural Organization (FAO) of the United Nations helps 198 nations manage their forests in a sustainable way. The organisation’s approach balances social, economic and environmental objectives so that present generations can reap the benefits of the Earth’s forest resources while conserving them to meet the needs of future generations. The

9 Forestry in the EU and the world — a statistical portrait
united nationS global objectiveS on foreStS
Member States reaffirm the following shared global objectives on forests and their commitment to work globally, regionally and nationally to achieve progress towards their achievement by 2015:
Global objective 1 reverse the loss of forest cover worldwide through sustainable forest management, including protection, restoration, afforestation and reforestation, and increase efforts to prevent forest degradation;
Global objective 2 enhance forest-based economic, social and environmental benefits, including by improving the livelihoods of forest dependent people;
Global objective 3 increase significantly the area of protected forests worldwide and other areas of sustainably managed forests, as well as the proportion of forest products from sustainably managed forests;
Global objective 4 reverse the decline in official development assistance for sustainable forest management and mobilise significantly increased, new and additional financial resources from all sources for the implementation of sustainable forest management.
Department also carries out a five-yearly survey, the Global Forest Resources Assessment (Global FRA) – which covers similar topics to those included in the SoEF, but with a global perspective.
For more information: http://www.fao.org/forestry/en/
The International Tropical Timber Organization (ITTO) was established under the auspices of the United Nations in 1986. While the rate of deforestation in tropical forests was already alarming, tropical timber trade was seen as one of the keys to economic development and the ITTO tries to reconcile these two phenomena.
International trade in tropical wood and wood products is subject to International Tropical Timber Agreements (ITTA), the first of which was drafted in 1983 and revised in 1994 and 2006: at the time of writing the latest ITTA (2006) had not yet been ratified. The1994 agreement:
provides a framework for cooperation and consultation among countries producing and ■consuming tropical timber;seeks to increase and diversify international trade in tropical timber and improve ■conditions in the tropical timber market;promotes and supports research to improve forest management and ways of using wood; ■encourages the development of national policies to protect tropical forests and maintain ■an ecological balance.
The ITTO currently has 59 member countries, both producers and consumers of tropical wood. As soon as ITTA 2006 is ratified, all the new Member States that joined the EU between 2004 and 2007 will become members of the ITTO.
For more information: http://www.itto.int


Forests
Forests and other wooded land cover more than 40 % of the EU’s land area. Ecologically, the EU’s forests belong to many different biogeographical regions and have adapted to a variety of natural conditions, ranging from bogs to steppes and from lowland to alpine forests. Socioeconomically, the EU’s forests vary from small family holdings to state forests or large estates owned by companies, many as part of industrial wood supply chains. About 60 % of the wooded land in the EU is privately owned.
Expansion of the EU’s forest area exceeds the loss of forest land to infrastructure and urban uses. Several Member States have expanded their forest cover by plantation programmes on agricultural land which is no longer cultivated. This positive development sets the EU apart from many other global regions, where deforestation continues to reduce forest area.
Forests are key ecosystems that fulfil a number of roles. They have important environmental functions, serving as a habitat for a variety of plant and animal species or protecting water and soil. They also safeguard our infrastructure and settlements by preventing landslides or avalanches in mountainous regions, as well as providing catchments and filtering for water supplies.
Alongside their environmental benefits, forests provide resources, most notably wood. Non-wood products from plants, fungi and animals include food (fruit, nuts, mushrooms, truffles, honey, game meat); spices and herbs; animal fodder; fibres (plaiting materials, rattan, bamboo); cork; resin and oils; medicinal or cosmetic ingredients; seeds and genetic breeding stock. Forests provide a range of services, including grazing and forage for animals, water purification, and opportunities for tourism, recreation or hunting.
11 Forestry in the EU and the world — a statistical portrait

12 Forestry in the EU and the world — a statistical portrait
Forests
Forest resources in the EU
The land area of a country is made up of its total area excluding the area of rivers, lakes and reservoirs. Forests are defined by the FAO as land with a tree canopy cover of more than 10 % and an area of more than 0.5 hectares, comprising trees able to reach a minimum height of 5 metres at maturity in situ. Other wooded land is land of more than 0.5 hectares not classified as a forest. It has a canopy cover of 5 % to 10 %, comprising trees able to reach a height of 5 metres at maturity in situ. Alternatively, it has a canopy cover of more than 10 % comprising shrubs, bushes and trees. Neither forests nor other wooded land include land that is predominantly under agricultural or urban use. Within this chapter, the terms ‘wooded land’ or ‘wooded area’ are used to cover the sum of forests and other wooded land. Otherwise, the term ‘forest’ is used to specifically refer to the definition given above.
Forests available for wood supply are forests where no legal, economic, or environmental restrictions have a bearing on the supply of wood; it is here that large volumes of commercial wood are generally harvested.
Private ownership refers to land owned by individuals, families, communities, private co-operatives, corporations and other business entities, non-governmental organisations, nature conservation associations and other private institutions. Public ownership refers to land owned by the State, administrative units of the public administration or institutions or corporations owned by the public administration. Other ownership refers to land that is neither ‘public’ nor ‘private’. It includes land for which ownership is unknown, undefined or disputed.
Growing stock is the volume of all living trees and excludes smaller branches, twigs, foliage and roots. It is measured in cubic metres (m³) over bark and includes trees of more than a given size (in terms of diameter) at breast height. Increment is the gross increase in the volume of the growing stock less natural losses over the reference period. Fellings are the volume of all trees – living or dead – measured over bark that are felled during the reference year as well as natural losses (for example, trees felled by windstorms) that are harvested.
Within the EU, just over two fifths of the land area was classified as wooded land (in other words, as ‘forests’ or ‘other wooded land’), which was a similar proportion to that used for agricultural purposes; the total area of wooded land in the EU was 177.8 million hectares in 2010. The Member States with the largest proportions of wooded area were Finland and Sweden, where approximately three quarters of the land area was covered with forests or woods. These same two Member States recorded the highest areas of wooded land per inhabitant, approximately ten times the EU average; relatively high areas of wooded land per capita were also recorded in Estonia and Latvia. The least densely wooded Member States were Malta, the Netherlands, Ireland and the United Kingdom.
Sweden alone accounted for 17.6 % of all the wooded land in the EU in 2010, and the five largest wooded areas (in Sweden, Spain, Finland, France and Germany) collectively accounted for well over three fifths (62.4 %) of the wooded land in the EU. Focusing on the narrower concept of forests available for wood supply, Finland and Sweden each accounted for around 15 % of the EU total.
1

13 Forestry in the EU and the world — a statistical portrait
Forests 1
Between 2000 and 2010, wooded area in the EU increased through natural expansion and afforestation by a total of 3.5 million hectares, a rise of 2.0 %. Only four of the EU Member States recorded a fall in their areas of wooded land, with Denmark recording the largest reduction (-5.0 %) ahead of Portugal, Slovenia and Finland. In relative terms, the largest expansions in wooded area were recorded in Ireland (21.4 %), while Bulgaria and Latvia both recorded increases in excess of 10 %. In absolute terms, four Member States recorded an expansion in excess of 400 000 hectares, namely France, Bulgaria, Italy and Sweden, with the latter recording the highest increase (594 000 hectares).
Table 1.1: forest area in the eu, efta and candidate countries
Land area (1)
2008 2000 2010 2000 2010 (2) 2000 2010
EU-27 430 340 174 235 177 757 128 125 132 605 0.36 0.35EA-17 265 779 111 304 112 628 80 411 83 402 0.35 0.34Belgium 3 028 694 706 663 672 0.07 0.07Bulgaria 11 100 3 480 3 927 2 258 2 864 0.42 0.52Czech Republic 7 725 2 637 2 657 2 561 2 330 0.26 0.25Denmark 4 310 622 591 371 581 0.12 0.11Germany 35 711 11 076 11 076 10 985 10 568 0.13 0.14Estonia 4 343 2 337 2 350 2 103 2 013 1.70 1.75Ireland 6 839 650 789 597 : 0.17 0.18Greece 13 082 6 525 6 539 3 317 3 595 0.60 0.58Spain 50 599 27 452 27 747 10 480 14 915 0.69 0.60France 63 283 17 165 17 572 14 645 15 147 0.28 0.27Italy 29 511 10 439 10 916 8 446 8 086 0.18 0.18Cyprus 925 387 387 43 41 0.56 0.48Latvia 6 220 3 097 3 467 2 777 3 138 1.30 1.54Lithuania 6 268 2 103 2 240 1 756 1 875 0.60 0.67Luxembourg 259 88 88 87 86 0.20 0.18Hungary 9 303 1 866 2 029 1 622 1 726 0.18 0.20Malta 32 0 0 0 : 0.00 0.00Netherlands 3 376 360 365 290 295 0.02 0.02Austria 8 244 3 955 4 006 3 341 3 343 0.49 0.48Poland 31 269 9 059 9 337 8 342 8 532 0.23 0.24Portugal 9 212 3 667 3 611 2 009 1 822 0.36 0.34Romania 22 989 6 600 6 733 4 628 5 193 0.29 0.31Slovenia 2 014 1 283 1 274 1 130 1 175 0.65 0.62Slovakia 4 904 1 921 1 933 1 767 1 775 0.36 0.36Finland 30 390 23 305 23 269 20 508 19 869 4.51 4.35Sweden 41 034 30 653 31 247 21 076 20 554 3.46 3.35United Kingdom 24 315 2 813 2 901 2 323 2 411 0.05 0.05Iceland 10 025 142 116 34 29 0.51 0.37Liechtenstein 16 7 8 4 4 0.22 0.22Norway 30 547 12 000 12 768 6 519 6 419 2.68 2.63Switzerland 4 000 1 263 1 311 1 165 1 200 0.18 0.17Montenegro 1 382 744 744 386 386 1.21 1.18Croatia 5 659 2 300 2 474 1 749 1 741 0.51 0.56FYR of Macedonia 2 491 1 101 1 141 804 804 0.54 0.56Turkey 76 960 20 780 21 702 8 648 7 313 0.31 0.30
Forest and other wooded land
(ha/capita)
Forest and other wooded land
Forest available for wood supply
(1 000 ha)
(1) eu-27, ea-17 (estimated for this publication), Spain, cyprus, luxembourg, malta, Poland, liechtenstein and croatia, 2006 instead of 2008; bulgaria, italy, Portugal, Slovenia and turkey, 2007 instead of 2008; montenegro, 2010 instead of 2008.
(2) eu-27 and ea-17, excluding ireland and malta.
Source: Eurostat (demo_r_d3area, for_area and demo_pjan), Soef2011

14 Forestry in the EU and the world — a statistical portrait
Forests1
Table 1.2: forest ownership in the eu, efta and candidate countries
2000 2010 2000 2010Pub.
ownedPriv. & other
Pub. owned
Priv. & other
Belgium 290 301 377 377 1.1 0.0 0.4 0.0Bulgaria 3 041 3 408 334 519 36.8 18.4 1.1 4.5Czech Republic 2 023 2 041 614 616 1.8 0.2 0.1 0.0Denmark 138 139 348 448 0.1 10.0 0.1 2.6Germany 5 846 5 708 5 230 5 368 -13.8 13.8 -0.2 0.3Estonia 899 858 1 344 1 345 -4.1 0.1 -0.5 0.0Ireland 399 400 236 337 0.1 10.1 0.0 3.6Greece (1) 2 790 2 907 811 845 23.4 6.8 0.8 0.8Spain 4 988 5 336 12 000 12 838 34.8 83.7 0.7 0.7France 3 984 4 113 11 369 11 841 12.9 47.2 0.3 0.4Italy 2 811 3 073 5 558 6 076 26.2 51.8 0.9 0.9Cyprus 118 119 54 54 0.1 0.0 0.1 0.0Latvia 1 749 1 655 1 493 1 696 -9.4 20.3 -0.6 1.3Lithuania 1 562 1 366 458 784 -19.6 32.6 -1.3 5.5Luxembourg 41 41 46 46 0.0 0.0 0.0 0.0Hungary 1 155 1 178 753 861 2.4 10.9 0.2 1.4Malta 0 0 0 0 - - - -Netherlands 184 184 176 181 0.0 0.5 0.0 0.3Austria 928 858 2 332 2 482 -7.0 15.0 -0.8 0.6Poland 7 535 7 661 1 524 1 658 12.6 13.4 0.2 0.8Portugal (1) 54 54 3 366 3 382 0.1 3.2 0.1 0.1Romania (2) 6 010 4 398 356 2 097 -161.2 174.1 -3.1 19.4Slovenia 365 291 868 962 -7.4 9.4 -2.2 1.0Slovakia 1 006 980 915 958 -2.6 4.3 -0.3 0.5Finland 7 213 6 699 15 245 15 389 -51.4 14.4 -0.7 0.1Sweden (3) 7 522 7 664 20 990 20 941 28.4 -9.8 0.4 0.0United Kingdom 1 011 959 1 782 1 922 -5.2 14.0 -0.5 0.8Iceland 7 8 12 22 0.2 1.0 2.3 6.2Liechtenstein 6 6 1 1 0.0 0.0 0.0 0.0Norway 1 299 1 450 8 002 8 800 15.1 79.8 1.1 1.0Switzerland (3) 885 889 : : 0.8 : 0.1 :Montenegro 337 337 130 130 0.0 0.0 0.0 0.0Croatia 1 398 1 396 487 524 -0.2 3.7 0.0 0.7FYR of Macedonia (1) 864 881 94 94 3.4 0.0 0.4 0.0Turkey (1) 10 131 10 730 15 10 119.7 -1.0 1.2 -7.4
(% annual average)
Change 2000-2010
(1 000 ha/year)(1 000 ha)
Publicly owned Private and other
(1) 2005 instead of 2010, change from 2000 to 2005 instead of from 2000 to 2010.(2) excluding other ownership.(3) 2005 instead of 2000, change from 2005 to 2010 instead of from 2000 to 2010.
Source: Soef2011
Around 40 % of the forest area in the EU is publicly owned. Based on data for 24 EU Member States (incomplete data for Greece, Portugal and Sweden), the publicly owned forest area decreased by a total of 2.9 % between 2000 and 2010, whereas privately owned forest area increased by 8.6 %.
The publicly owned share of forest area decreased between 2000 and 2010 in ten Member States, most notably in Romania, Slovenia and Lithuania and to a lesser extent in Austria, Finland, Latvia, Estonia and the United Kingdom. Some of the decreases in the new Member States that joined the EU as of 2004 may be due to the restitution of land to former owners, while other countries sold their public forest assets.

15 Forestry in the EU and the world — a statistical portrait
Forests 1
Table 1.3: commercial wood volume (forest available for wood supply) in the eu, efta and candidate countries
Grow. stock
Incre-ment
Fellings
2000 2010 2000 2010 2000 2010
EU-27 19 394 21750 752 768.3 463 484.1 163.3 5.8 3.6EA-17 12 021 13033 468 464.9 286 278.7 155.1 5.5 3.3Belgium 142 164 5 5 4 4 244.4 7.9 5.7Bulgaria 321 435 14 15 4 8 151.9 5.1 2.7Czech Republic 678 738 20 23 16 18 316.6 9.9 7.7Denmark 56 112 5 6 2 2 192.7 10.0 4.1Germany 3 356 3 466 122 107 49 60 328.0 10.1 5.6Estonia 427 398 11 11 13 6 197.8 5.6 2.8Ireland 58 74 3 4 2 3 119.4 5.8 4.5Greece (1) 157 170 4 5 2 2 47.4 1.3 0.5Spain 617 784 29 46 18 17 52.6 3.1 1.1France 2 119 2 453 98 94 63 64 162.0 6.2 4.2Italy 1 153 1 285 32 33 11 13 159.0 4.0 1.6Cyprus 3 3 0 0 0 0 79.0 0.9 0.2Latvia 515 584 17 18 12 12 186.1 5.8 4.0Lithuania (2) 320 408 9 11 6 9 217.6 5.7 4.6Luxembourg (3) 13 0 1 1 0 0 299.1 7.5 2.9Hungary 291 259 12 11 7 7 150.1 6.4 4.0Malta 0 0 0 0 0 0 0.0 0.0 0.0Netherlands 49 56 2 2 1 2 189.8 7.6 5.3Austria 1 060 1 107 31 25 19 24 331.1 7.5 7.0Poland (3) 1 584 2 092 38 68 33 41 245.2 8.0 4.8Portugal (4) 210 154 13 19 11 14 84.5 10.5 7.9Romania 697 1 35 34 14 17 211.5 6.5 3.3Slovenia 305 390 7 9 3 3 331.9 7.8 2.9Slovakia 437 478 12 13 7 10 269.1 7.4 5.9Finland 1 916 2 024 79 91 67 59 101.9 4.6 3.0Sweden 2 643 2 651 91 96 74 81 129.0 4.7 3.9United Kingdom 267 340 21 21 9 11 141.0 8.6 4.4Iceland 2 0 1 : 0 : 0.0 : :Liechtenstein 1 1 0 : 0 0 349.8 : 7.2Norway 685 797 50 22 23 11 124.2 3.4 1.7Switzerland 429 415 5 6 4 6 345.8 5.2 5.1Montenegro 68 68 : : 1 1 175.4 : 1.3Croatia 333 371 : : 4 5 213.3 : 3.0FYR of Macedonia 66 66 : : : : 82.1 : :Turkey 1 198 1 085 87 : 30 : 148.3 : :
(m�/ha)2010
(million m� over bark)
Growing stock FellingsIncrement
(1) fellings, 2005 instead of 2010. (2) increment and fellings, 2005 instead of 2000. (3) increment, 2005 instead of 2010.(4) increment and fellings, 2005 instead of 2010.
Source: eurostat (for_vol), Soef2011
The growing stock provides information on available resources as well as the basis for estimating biomass and carbon stocks. Within the forest area available for wood supply, the growing stock in the EU reached an estimated 21 750 million m³ in 2010. The increment in the EU’s growing stock was in excess of 700 million m³ in 2010, around 1.6 times as high as the volume of fellings; the latter was in excess of 485 million m³, which was equivalent to 2.2 % of the growing stock. However, since only approximately 63 % of the increment is felled and forest area is increasing, the EU is using its wood supplies in a more than sustainable manner.

16 Forestry in the EU and the world — a statistical portrait
1 Forests
Forest resources in the world
Table 1.4: forest area in the world
World 13 010.5 4 033.1 1 144.7 31.0 100.0 -0.20 -0.12 -0.14Europe 2 292.6 1 016.5 110.1 44.3 25.2 0.09 0.07 0.09EU-27 418.6 156.9 20.9 37.5 3.9 0.50 0.35 0.32Russia 1 638.1 809.1 73.2 49.0 20.1 0.00 -0.01 0.01Africa 2 974.0 674.4 350.8 23.0 16.7 -0.56 -0.49 -0.50Asia 3 013.5 581.0 226.0 19.3 14.4 -0.11 0.47 0.27China 942.5 206.9 102.0 22.0 5.1 1.20 1.75 1.39India 297.3 68.4 3.3 23.0 1.7 0.22 0.70 0.21Indonesia 181.2 94.4 21.0 52.0 2.3 -1.75 -0.31 -0.71North & Central America 2 135.0 705.4 134.7 33.0 17.5 -0.04 -0.01 0.00Canada 909.4 310.1 92.0 34.0 7.7 0.00 0.00 0.00United States 916.2 304.0 14.9 33.0 7.5 0.13 0.13 0.13Oceania 849.1 191.4 143.5 23.0 4.7 -0.02 -0.17 -0.55Australia 768.2 149.3 135.4 19.0 3.7 0.03 -0.13 -0.61South America 1 746.3 864.4 179.7 49.0 21.4 -0.45 -0.49 -0.41Brazil 832.5 519.5 43.8 62.0 12.9 -0.51 -0.57 -0.42
(million ha) (%)2010
2005-2010
Forest share of:
1990-2000
2000-2005
(%)
Forest area:annual average changeForest
Landarea
Other wooded
landLand area
World total
Source: fao (global fra, 2010)
The FAO has undertaken an assessment of the world’s forests every five to ten years since 1946. The most recent of these global forest resource assessments was completed in 2010, and provides information for 233 countries. More information can be found at the following website: http://www.fao.org/forestry/fra/fra2010/en/.
A selection of results from the FAO’s 2010 assessment are presented in this publication, particularly (but not exclusively) in those sections that present the EU’s forests and forestry in a global context. It should be noted that the data published by the FAO include Cyprus and Turkey within Asia in accordance with the FAO’s standard regional breakdown; for the purposes of this publication the data for these two countries have been reallocated to Europe and so the European and Asian totals published here differ from those published by the FAO. There may also be a number of small differences in the data reported by Eurostat and the FAO. These may often be explained by minor revisions being applied to one or other of the data sets prior to the data extraction for this publication.
There were just over 4 000 million hectares of forest in the world in 2010, equivalent to approximately 31 % of the world’s land area. This share reached 37.5 % in the EU and 44.3 % in Europe as a whole, the latter boosted by the 49.0 % share recorded for Russia. Among the other regions presented in Table 1.4 the lowest forest share in the total land area was recorded in Asia and the highest in South America, the latter largely due to the 62.0 % share recorded for Brazil. The largest national forest share in the world total was recorded in Russia which alone had one fifth of the world’s forest area. With 12.9 % of the world’s total, Brazil had the second largest forest area, followed by Canada, the United States and China. These five countries together provided more than half of the world’s entire forest cover.

17 Forestry in the EU and the world — a statistical portrait
1Forests
Figure 1.1: forest and other wooded land area, 2010(% of world total)
0 4 8 12 16 20
EU-27RussiaBrazil
CanadaUnited States
ChinaAustralia
DR CongoSudan
IndonesiaArgentina
PeruMexico
ColombiaIndia
BoliviaAngola
EthiopiaZambia
VenezuelaMozambique
MyanmarBotswanaTanzania
South AfricaPapua New Guinea
Congo
Source: fao (global fra, 2010)
Figure 1.1 provides an analysis of the world share of the broader concept of forests and other wooded land. While the five largest countries were the same using this measure as they were for the narrower measure of forests, the share of the world total was several percentage points lower for Russia. By this measure, the Australian share of the world total was notably higher, 5.5 % compared with a 3.7 % share when restricted to forests alone.
The African share of the world total for other wooded land was particularly high, reaching 30.6 %, well above its 16.7 % share for forested land. This is reflected in the shares of forest and other wooded land shown in Figure 1.1, where ten African countries appear in the ranking.

18 Forestry in the EU and the world — a statistical portrait
1 Forests
Figure 1.2: forest ownership in the world, 2005(%)
0% 25% 50% 75% 100%
EU-27
BulgariaPoland
RomaniaGreece
Czech RepublicLatvia
GermanyUnited Kingdom
ItalyFinland
SpainFrance
SwedenAustria
Portugal
TurkeyNorway
RussiaCanada
IndonesiaIndiaBrazil
AustraliaChina
United States
Public ownership Private ownership Other
Source: fao (global fra, 2010)
In 2005, approximately 40 % of the forest area in the EU was publicly owned, a share that was lower than in Russia or in any of the non-European countries shown in Figure 1.2. Practically the entire forest area in Russia was publicly owned and around three quarters or more of all forest areas in Australia, Brazil, India, Indonesia and Canada were also publicly owned. The share of public ownership was slightly lower in China, at just over two thirds, while the 43 % share in the United States was similar to the EU average. Among the EU Member States there was a wide range in the extent of public ownership in 2005, ranging from 2 % in Portugal to 89 % in Bulgaria (and 100 % in the very small Maltese forest sector).

19 Forestry in the EU and the world — a statistical portrait
1Forests
Table 1.5: growing stock by volume and density (over bark) in the world, 2010
Coniferous Broadleaved(million m�) (m�/ha)
EU-27 23 964 153 62 38Russia 81 523 101 76 24China 14 684 71 47 53India 5 489 80 10 90Indonesia 11 343 120 : :Canada 32 983 106 77 23United States 47 088 155 73 27Brazil 126 221 243 0 100
DensityForest total
(%)
Growing stock analysis
Source: fao (global fra, 2010)
As part of the 2010 Global Forest Resources Assessment (Global FRA), 180 countries (representing 93.6 % of the world’s forests) reported the volume of growing stock in their forests, which summed to a total of 493 115 million m³; the FAO has estimated the volume of the world’s total growing stock at 527 203 million m³. Brazil alone accounted for close to one quarter of this total, and Russia and the United States combined for another quarter; the EU’s share was around 4.5 %.
The relatively high share for Brazil (compared with its share of the world’s forest area) was reflected in Brazil’s growing stock density, which averaged 243 m³ per hectare of forest in 2010, close to three and a half times the density recorded in China, and close to two and a half times the density for Russia. It is remarkable that growing stock density in Brazil was more than double that in Indonesia, given that both have mostly tropical forests. The United States and the EU both recorded average growing stock densities of just over 150 m³ per hectare. The values for individual countries (as shown in Table 1.3) show that growing stock densities well over 300 m³ per hectare were normal in forests available for wood supply in temperate EU or EFTA countries with an intensive cultivation regime (for example, Liechtenstein, Switzerland, Slovenia, Austria, Germany and the Czech Republic). Coniferous species are used, which can be cultivated at much higher densities than broadleaved species.
The composition of forests varies greatly. Brazilian forests were exclusively broadleaved and Indian forests were also dominated by broadleaved species. In contrast, around three quarters of the growing stock in Russia, Canada and the United States was coniferous, while the composition of forests in China, and to a lesser extent the EU, was more evenly balanced between these two types. According to an FAO analysis (based on results for 117 countries), coniferous species accounted for 61 % of the global volume of growing stock; this is judged by the FAO to be an underestimate of the actual situation.

20 Forestry in the EU and the world — a statistical portrait
1 Forests
Forest products and services
The most common and visible type of resource extracted from forests is wood. The harvesting of wood can be done without compromising other forest functions if it is done in a sustainable manner, in other words, without compacting soil, causing soil erosion, or disturbing the reproductive cycle of plants or animals.
Figure 1.3 provides an overview of the use of wood from all wood sources (not just forests) in the EU. It should be noted that some of the wood resources used for energy come directly from forests (and similar primary sources) and the remainder from production residues that may result from industrial wood processing, including black liquor from paper production.
Forests offer other economic benefits, notably concerning opportunities for recreational and cultural activities, such as tourism, sports or hunting. As part of the work to develop environmental accounts, attempts have been made to assess the economic value of the recreational services of forests; for example, the market output of these services in France was valued at EUR 56 million in 2008. The extent to which forests provide social services can also be seen to some extent from the analysis of the designated function of forests, presented later in Table 1.7.
Besides wood, forests provide many other goods, referred to as non-wood forest products. These notably include foods, such as fruit, nuts, mushrooms, truffles, honey, game/bush meat, snails, as well as animal fodder. Among the products harvested from forests within the EU are regional specialities such as cork and sweet chestnuts in the Mediterranean countries. Many products are harvested or gathered in an informal manner, which makes their measurement and the extent of their use difficult to ascertain.
Table 1.6 and Figure 1.4 provide an overview of the valuation for some of these products as part of the 2010 Global FRA. The value of non-wood forest products was higher than the value of industrial roundwood in Russia and China, while among the EU Member States the same was true in Italy and Portugal.
Figure 1.3: Wood resources use in the eu-27, 2010(% share of total volume in m³)
Pulp industry
17%
Other material
uses 2%
Processed solid
wood fuel 3%
Panel & plywood industry
12%
Sawmill industry
24%
Energy use 42%
Source: euwood, 2010

21 Forestry in the EU and the world — a statistical portrait
1Forests
Table 1.6: non-wood products in selected eu, efta and candidate countries, 2005 (1)
FoodOrna-
mental plants
Hides, skins and
trophies
Wild honey and
beeswax
Bush meat
(ratio) (units)Bulgaria 0.03 : : : : :Czech Republic 0.19 40 960 : 216 570 0 9 578Denmark : : 71 000 : : :Germany 0.22 : : : : 34 000Estonia : : 2 000 37 500 : 913Spain 0.56 12 018 : 3 040 39 114 21 723France : : : : 6 300 :Italy 1.57 79 155 : : : :Cyprus : : : : 811 :Latvia : : : 37 800 : 1 500Lithuania 0.09 3 800 3 000 30 000 : 1 250Netherlands : : 6 000 : : 362Austria 0.12 : : : : :Poland : 15 088 843 : : 10 456Portugal 1.10 : : : : :Slovenia 0.11 550 1 200 20 000 2 300 1 000Slovakia 0.04 1 155 255 22 470 : 1 688Finland 0.05 47 000 309 355 000 : 9 279Sweden 0.04 35 860 14 177 200 : 16 790United Kingdom 0.30 162 162 545 : 183 3 500Iceland : : 92 0 0 0Norway : 462 : : 550 1 700Switzerland : 19 000 5 517 33 110 : 7 586Croatia 0.01 400 : : : :Turkey 0.00 9 979 152 : : :
Value of non-wood products / industrial
roundwood
Plant products Animal products
(tonnes) (tonnes)
(1) no information available for those member States that are not presented.
Source: fao (global fra, 2005 and 2010)
Figure 1.4: value of non-wood products from forests in relation to the value of industrial roundwood from forests in the world, 2005(ratio)
0.0 0.5 1.0 1.5 2.0
RussiaChinaBrazil
AustraliaEU (1)
United StatesIndia
Canada
(1) average based on information for bulgaria, the czech republic, germany, Spain, italy, lithuania, austria, Portugal, Slovakia, Slovenia, finland, Sweden and the united Kingdom.
Source: fao (global fra, 2010)
Some non-wood products are in such demand that they are also planted and harvested for industrial use, such as bamboo and rattan. According to the FAO, China had 5 712 million hectares – or 18 % – of the world’s bamboo forest area in 2010. Although bamboo species are technically non-wood plants belonging to the grass family, bamboo forests are included under the FAO definition of forests and these areas are included in the statistics presented (for example, Table 1.4)

22 Forestry in the EU and the world — a statistical portrait
1 Forests
Forests and the environment
Natural forest types and their ecosystems are diverse across the EU, including, for example, boreal, alpine and Mediterranean. While natural forests are adapted to the prevalent climatic and soil conditions, there are also plantations in many parts of the EU where trees have been planted for commercial purposes.
Not all forest and other wooded land is available for wood supply, and this reflects the multi-functional aspect of forests: as well as providing economic resources, forests are key ecosystems. They fulfil important environmental functions, serving as a habitat for a variety of plant and animal species, as well as protecting water and soil. Furthermore, forests are a central part of the carbon cycle, transforming carbon dioxide from the atmosphere into carbon stored in biomass (cellulose and lignin, both above and below ground) and oxygen; this cycle impacts on the climate. As such, forests are generally considered to help attenuate the build-up of carbon dioxide in the atmosphere and so contribute towards efforts to mitigate climate change. Forests and other vegetation may also have an impact on more localised climates, for example on wind or air temperature.
In the EU around 20.4 million hectares (equivalent to 13.0 % of the total area) of forest were in protected areas in 2010, for example in national parks, where often the trees and the habitat they provide are protected. The Member States with the largest protected forest areas were Italy, Germany and Spain. Table 1.7 shows that protected forests make up a large share of the land area protected under the Habitats Directive in several countries.
An overview of the primary designated function of forests is presented in Table 1.7: it should be noted that most forests have many functions (the table indicates the primary function only) and may serve particular functions without being designated as such. Depending on the country, there can often be a large overlap between protected forests and forests with specific protective functions. For example, in Belgium the area of forests designated for the conservation of biodiversity was identical to the size of the protected area. Across the EU as a whole just under one tenth of all forest area was primarily designated for the protection of soil and water, and just over one tenth for the conservation of biodiversity. Around 2 % of the EU’s forest area was specifically foreseen for social services, a share that was particularly high in Slovakia and Poland, where it exceeded 10 %.
The largest primary designated function of forests was production (notably for the harvesting of wood, but also non-wood products) which was the stated function of more than half of the forest area in the EU in 2010, a total of 88.6 million hectares. By far the largest forest areas designated for production were located in Sweden and Finland, each around 20 million hectares.
Around 20 % of the EU’s forest area is foreseen for multiple uses. This proportion was close to three quarters in the Netherlands and in Germany, and was also over half in Luxembourg, Slovakia, the United Kingdom and Belgium.

23 Forestry in the EU and the world — a statistical portrait
1Forests
Table 1.7: function and designation in the eu, efta and candidate countries, 2010(1 000 ha)
Habitats Directive
ProductionProtective of soil and
water
Conser-vation of
bio-diversity
Social services
Multiple use
Protected land
areas for biodiversity
EU (1) 20 356 88 586 13 880 17 443 2 904 30 993 58 609EA (1) 14 283 49 213 8 048 12 082 913 24 396 37 238Belgium 209 0 99 209 : 370 307Bulgaria 313 2 864 469 22 253 319 3 284Czech Republic 740 1 994 252 333 78 0 785Denmark 40 299 0 40 0 146 317Germany 2 754 0 0 2 897 0 8 179 3 457Estonia 213 1 472 258 208 0 279 757Ireland 58 317 : 83 1 : 755Greece 164 3 595 0 164 0 0 2 147Spain 2 499 3 716 3 583 2 100 399 8 375 12 351France 313 11 904 245 202 57 3 546 4 672Italy 3 265 4 073 1 791 3 265 20 0 4 306Cyprus 95 41 0 3 13 49 75Latvia 610 2 658 128 498 70 0 729Lithuania 433 1 523 209 198 66 164 908Luxembourg : 28 0 0 0 59 40Hungary 424 1 289 290 424 26 0 1 397Malta 0 0 0 0 0 0 4Netherlands 83 4 0 90 0 271 349Austria 659 2 323 1 420 108 35 0 898Poland 187 3 768 1 901 434 1 004 58 3 440Portugal 700 2 026 234 171 0 1 025 1 601Romania 1 746 3 169 2 543 317 374 0 3 148Slovenia 241 387 76 575 75 140 636Slovakia 1 104 129 342 81 236 1 145 574Finland 1 925 19 197 0 1 925 77 958 4 309Sweden 1 435 20 901 35 2 950 0 4 317 5 696United Kingdom 145 908 5 145 120 1 593 1 666Iceland 0 6 4 0 6 13 :Liechtenstein 4 2 3 1 1 0 :Norway 167 6 042 2 762 167 0 1 094 :Switzerland 90 492 10 90 64 0 :Montenegro 13 348 52 27 0 0 :Croatia 54 1 581 82 54 38 165 :FYR of Macedonia : 804 0 0 0 0 :Turkey 269 7 896 1 900 859 4 675 :
Primary designated function (selection)
Protected area
(1) Sum of available data for the member States
Source: fao (global fra, 2010), eurostat (env_bio1)

24 Forestry in the EU and the world — a statistical portrait
1 Forests
Figure 1.5: Proportion of trees on selected plots with moderate to complete defoliation in the eu, 2009 (1)(%)
0 10 20 30 40 50 60
Czech RepublicCyprus (2)
ItalySlovenia
FranceSlovakia
GermanyUnited Kingdom (3)
GreecePortugal (4)
BulgariaBelgium
Netherlands (5)RomaniaHungary
SpainLithuania
PolandSweden (2)Austria (5)
LatviaIreland (2)
FinlandEstonia
Denmark
(1) luxembourg and malta, not available. (2) only conifers assessed. (3) 2007. (4) 2005. (5) 5006.
Source: european commission, directorate-general for agriculture and rural development
Forests face a number of threats, such as windstorms, droughts, fires, pests and diseases, as well as air pollution. Climate change (for example, global warming), changes in rainfall patterns and the frequency and intensity of extreme weather conditions may potentially impact on forest areas in many ways.
Measurement of some of these threats and their impact can pose methodological difficulties. Figure 1.5 shows the proportion of trees in the moderate, severe or dead classes of defoliation. The information collected on defoliation in the EU is based on the monitoring of fixed plots, where the health of the same trees is recorded each year. If a tree dies, it remains in the sample even though its condition cannot change and it will again be recorded as dead in future years. As no randomly selected sample is used, it may be that the overall health of forests is improving, but this will not be picked up by constantly observing the same forest plots. The results are therefore not representative for the forests of each country, but only for the selected monitoring plots.
Current forest areas may be lost through: desertification; the incidence of forest fires may be affected by changes in the frequency and severity of droughts; areas affected by diseases and pests may die off; the geographical areas suitable for the cultivation of particular tree species may shift as a result of changes in climatic and soil conditions.

25 Forestry in the EU and the world — a statistical portrait
1Forests
Figure 1.6: area burnt in forest fires in the eu, efta and candidate countries, annual average, 2006 to 2008 (1)(1 000 ha)
0 20 40 60 80 100 120
ItalySpain
GreecePortugalBulgaria
FrancePoland
SwedenCyprus
HungaryEstonia
LatviaRomania
FinlandSlovenia
LithuaniaGermanySlovakia
Czech Republic (2)Austria (3)Croatia (3)
TurkeySwitzerland
(1) belgium, denmark, ireland, luxembourg, the netherlands and the united Kingdom, not available.(2) average 2004 to 2006.(3) average 2005 to 2007.
Source: eurostat (for_fire)
Like windstorms, forest fires are regarded as severe threats to forests in the EU, wreaking widespread damage in a short period of time. Figure 1.6 shows the annual average forest area lost during the period 2006 to 2008: an average is shown as data for individual years can be strongly influenced by a small number of very large fires. Note that for reporting these data, many countries do not use the FAO definition of forests as given on page 12.
By far the largest forest areas lost to fires in the EU were in the southern Member States: the Mediterranean countries of Italy, Spain, Greece and France, as well as in Portugal and Bulgaria; large areas were also lost to fires in Croatia and Turkey.
Relative to the overall forest area, Greece’s forests were most severely hit by fires during the period from 2006 to 2008, as an average of 2.3 % of the forest area burnt each year, considerably higher than the 1.5 % proportion recorded for Cyprus and close to double the proportions recorded for Italy and Portugal (1.2 %); for comparison, the proportion in Croatia was 1.8 %. Although the areas burnt in Spain, France and Turkey were large, due to their considerable absolute forest areas, the proportions of forest area affected were below 1 %, approximately 0.5 % in Spain and 0.1 % in both France and Turkey.

26 Forestry in the EU and the world — a statistical portrait
1 Forests
Table 1.8: carbon stock in living forest biomass in the eu, efta and candidate countries
1990 2000 2005 2010 2005 2010
EU-27 : : 9 341 9 819 19.0 19.6EA-17 : : 5 418 5 680 16.8 17.2Belgium 50 61 63 64 6.0 5.9Bulgaria 127 161 182 202 23.5 26.7Czech Republic 287 322 339 356 33.2 33.9Denmark 22 26 36 37 6.7 6.7Germany 981 1 193 1 283 1 405 15.6 17.2Estonia : 168 167 165 123.9 123.1Ireland 16 18 20 23 4.9 5.1Greece 67 73 76 79 6.9 7.0Spain 289 396 400 422 9.3 9.2France 965 1 049 1 165 1 208 18.6 18.7Italy 375 467 512 558 8.8 9.2Cyprus 3 3 3 3 4.0 3.7Latvia 193 234 244 272 105.8 121.0Lithuania 134 146 151 153 44.1 46.0Luxembourg 7 9 9 9 19.5 17.9Hungary 117 130 136 142 13.5 14.2Malta 0 0 0 0 0.0 0.0Netherlands 21 24 26 28 1.6 1.7Austria 339 375 399 393 48.7 46.9Poland 691 807 887 968 23.2 25.4Portugal : : 102 102 9.7 9.6Romania 600 599 601 618 27.7 28.8Slovenia 116 141 159 178 79.6 87.0Slovakia 163 190 202 211 37.5 38.9Finland 721 802 832 832 158.9 155.5Sweden 1 178 1 183 1 219 1 255 135.3 134.4United Kingdom 120 119 128 136 2.1 2.2Iceland 0 0 0 0 - -Liechtenstein 0 1 1 1 - -Norway 280 323 360 395 78.2 81.3Switzerland 126 136 139 143 18.7 18.4Montenegro 33 33 33 33 53.0 52.1Croatia 190 221 237 253 53.3 57.2FYR of Macedonia 60 62 60 60 29.5 29.2Turkey 686 743 782 822 10.9 11.3
Carbon stock per inhabitant
(tonne carbon/capita)(million tonnes carbon)
Carbon stock in living forest biomass
Source: fao (global fra, 2010)
The role of forests in the carbon cycle and their importance as carbon sinks within the broader debate about climate change has already been noted. Forests also release carbon naturally through decomposition and forest fires; carbon dioxide is also released when wood that has been harvested is broken down, for example through combustion. Whether forests are overall carbon sources, neutral or sinks can be seen from the development of the carbon stock. Forest biomass in the EU contained 9 800 million tonnes of carbon in 2010, an increase of 5.1 % compared with 2005. A longer analysis from 1990 to 2010 (excluding Estonia and Portugal) shows an increase in carbon stock of 26.0 %.

27 Forestry in the EU and the world — a statistical portrait
1Forests
Figure 1.7: indicator for common birds in the eu (1)(1990=100)
70
80
90
100
110
1990 1992 1994 1996 1998 2000 2002 2004 2006 2008
All common species (136 species)Common farmland species (36 species)Common forest species (29 species)
(1) moving eu aggregate reflects the composition of the eu in each reference year: 1990-1994, eu-12; 1995-2004, eu-15; 2005-2006, eu-25; 2007-2008, eu-27.
Source: eurostat (env_bio2)
Alongside their productive and climatic functions, forests provide habitats for an enormous range of species. The extent to which a forest’s ecosystem contributes to the conservation of biodiversity varies, depending, for example, on environmental conditions and management methods. One set of indicators used to evaluate biodiversity is based on population trends of common breeding birds — these are shown in Figure 1.7. Forest birds depend on forest ecosystems for nesting or feeding and this indicator covers 29 species. Likewise, farmland birds depend on agricultural land; this indicator covers 36 species. The index for all common birds was recently extended to cover 136 species. Between 1990 and 2000 there was a general downward trend in the abundance of both common farmland and common forest species of birds, as measured by these indices. Across the EU there was a relatively rapid reduction (-25 %) in numbers of common forest birds. However, in recent years forest bird numbers recovered somewhat, with the index (1990=100) rising from a relative low of 75 in 2000 to reach 86 by 2008. The index for all common bird species was relatively stable since 1995, some 10 % below its 1990 level, and stood at 92 in 2008.


The economics of forestry and wood processing
Forestry and downstream manufacturing activities provide employment to millions of people within the EU and generate wealth, particularly in rural areas. The statistical classification of economic activities used to classify these activities is NACE. Forestry data presented here is still based on NACE Rev. 1, while that for downstream manufacturing activities is based on NACE Rev. 2.
Forestry, logging and related service activities covers the production of standing timber, as well as the extraction and gathering of wild growing forest materials. Timber aside, forestry produces products that require little processing, such as wood for fuel. Forestry and logging includes:
growing of standing timber: planting, replanting, transplanting, thinning and conserving ■of forests and timber tracts;growing of coppice and pulpwood on wooded land; ■operation of forest tree nurseries; ■logging: felling of timber and production of wood in the rough such as pit-props, split ■poles, pickets or fuelwood;forestry service activities: forestry inventories, timber evaluation, fire protection; ■logging service activities: transport of logs within the forest. ■
Downstream manufacturing activities mainly concern the processing of wood, paper or recovered wood and paper. Three activities are presented in this publication under the heading of wood-based manufacturing – with products that are a mixture of intermediate goods used for example in construction, and consumer goods such as newspapers. Information is also presented in some cases for furniture manufacturing, which uses a wide range of materials, not exclusively wood. For this reason furniture is not included in the wood-based manufacturing aggregate.
29 Forestry in the EU and the world — a statistical portrait

30 Forestry in the EU and the world — a statistical portrait
The economics of forestry and wood processing
Forestry and logging in the EU
The most common primary designated function of forests within the EU is production, essentially of wood but also of non-wood forest products. A common measure of the magnitude of the extraction of wood from forests is roundwood removals: this comprises all quantities of roundwood removed from the forest or other felling sites and stripped of the bark (under bark). Not all the wood felled is immediately removed, making removals lower than the fellings presented in Table 1.3, which in addition are measured including the bark.
2
Figure 2.1: roundwood removals under bark in the eu, efta and candidate countries, 2009(million m³)
0 25 50 75
SwedenGermany
FranceFinlandPolandAustria
Czech RepublicSpain
RomaniaLatvia
PortugalSlovakia
United KingdomItaly
LithuaniaHungary
EstoniaBulgariaBelgiumSlovenia
DenmarkIrelandGreece
NetherlandsLuxembourg
CyprusMalta
TurkeyNorway
SwitzerlandCroatia
FYR of Macedonia Montenegro
Liechtenstein
Coniferous Non-coniferous
Source: eurostat (for_remov)
31 Forestry in the EU and the world — a statistical portrait
The economics of forestry and wood processing 2
Roundwood can be subdivided into two main botanical types, namely coniferous (mostly, but not exclusively softwood) and non-coniferous (broadleaved; mostly, but not exclusively hardwood) species. More detailed information on roundwood production is presented in Chapter 3.
Figure 2.1 provides a snapshot of roundwood removals. The total level of removals in the EU in 2009 was 392 million m³ under bark, of which just over two thirds (67.9 %) was from coniferous species. The largest volumes of wood removals were recorded in Sweden, Germany, France, Finland and Poland, which together accounted for close to two thirds of the EU total. France had by far the highest level of roundwood removals from non-coniferous species, alone accounting for one quarter of the EU total, double the next highest share which was recorded for Germany. Coniferous species provided the wood for more than half of the removals in 17 EU Member States, with the share exceeding 90 % in Ireland, the United Kingdom, the Czech Republic and Sweden. In contrast, around two thirds or more of all removals came from non-coniferous species in Hungary, Italy, Bulgaria and Greece.
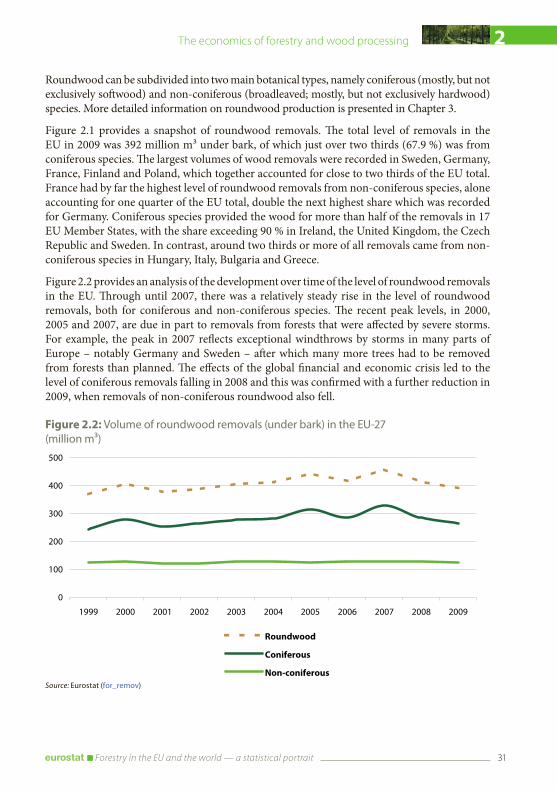
Figure 2.2 provides an analysis of the development over time of the level of roundwood removals in the EU. Through until 2007, there was a relatively steady rise in the level of roundwood removals, both for coniferous and non-coniferous species. The recent peak levels, in 2000, 2005 and 2007, are due in part to removals from forests that were affected by severe storms. For example, the peak in 2007 reflects exceptional windthrows by storms in many parts of Europe – notably Germany and Sweden – after which many more trees had to be removed from forests than planned. The effects of the global financial and economic crisis led to the level of coniferous removals falling in 2008 and this was confirmed with a further reduction in 2009, when removals of non-coniferous roundwood also fell.
Figure 2.2: volume of roundwood removals (under bark) in the eu-27(million m³)
0
100
200
300
400
500
1999 2000 2001 2002 2003 2004 2005 2006 2007 2008 2009
Roundwood
Coniferous
Non-coniferousSource: eurostat (for_remov)

32 Forestry in the EU and the world — a statistical portrait
The economics of forestry and wood processing2
Table 2.1: forest and logging economic indicators in the eu and efta
2005 2008 2005 2008 2005 2008 2005 2008
Belgium : : : : : : : :Bulgaria 199 309 58 97 11 20 23 38Czech Republic 1 424 1 884 499 596 63 129 198 237Denmark : : : : : : : :Germany 4 141 5 566 1 738 2 262 168 231 158 206Estonia : : : : : : : :Ireland : : : : : : : :Greece 71 78 54 58 4 15 16 17Spain (2) 1 582 1 684 787 757 : : 75 72France 5 531 5 583 2 968 2 812 472 570 201 191Italy 456 : 365 : 83 : 41 :Cyprus 2 4 2 2 2 2 37 56Latvia : : : : : : : :Lithuania 172 : 102 : 10 : 55 :Luxembourg : : : : : : : :Hungary 339 407 132 193 24 33 79 115Malta : : : : : : : :Netherlands 133 : 46 : 10 : 156 :Austria 2 048 2 551 1 037 1 227 156 243 309 366Poland 1 991 3 947 1 110 1 486 137 168 132 177Portugal 895 954 666 669 98 90 332 333Romania 531 1 075 314 555 : 30 76 134Slovenia 185 266 120 184 : : 104 159Slovakia 624 679 259 279 33 42 148 159Finland 3 235 4 516 2 422 3 216 388 444 121 161Sweden (2) : 7 529 : 3 156 : 677 : 149United Kingdom 741 796 303 373 18 52 128 157Norway : 1 144 : 690 : 71 : 106Switzerland 505 579 187 276 83 89 158 232
(EUR million) (EUR/ha)
Value added / forest area
available forwood supply (1)
Grossoutput
Gross value
added
Gross fixed capital
formation
(1) data for the area is 2005.(2) 2007 instead of 2008.
Source: eurostat (for_ieeaf_cp and for_area)
Indicators relating to the economic significance of the forestry and logging sector are presented in Tables 2.1 and 2.2; these are based on integrated environmental and economic accounting for forests which are compatible with national accounts concepts.
National accounts estimate that the value added at basic prices of the forestry and logging activity in the EU was EUR 21 000 million in 2008, an increase (in current prices) of 35 % over 2005. Based on the data available from the integrated accounts, only Spain and France recorded a small fall in their value added between 2005 and 2008, while value added increased by at least 50 % in Romania, Bulgaria, and Slovenia.
Combining the value added data with information on the commercial forest area shows a particularly high value added generated per hectare in Austria and Portugal, in both cases in excess of EUR 300 per hectare, around 20 times as high as the average value added per hectare in Greece.

33 Forestry in the EU and the world — a statistical portrait
The economics of forestry and wood processing 2
Table 2.2: forestry and logging, employment in the eu and efta
2005 2008 2005 2008 2005 2008 2005 2008
Belgium : : : : : : : :Bulgaria 10.3 13.9 4.0 5.4 0.6 0.4 5.6 7.0Czech Republic 27.4 25.7 10.9 10.2 0.6 0.6 18.2 23.2Denmark : : : : : : : :Germany 47.4 42.9 4.3 3.9 1.2 1.3 36.6 52.7Estonia : : : : : : : :Ireland : : : : : : : :Greece 4.7 5.5 1.4 1.6 0.3 0.2 11.4 10.5Spain : : : : : : : :France 30.8 29.4 2.1 2.0 1.7 1.8 96.4 95.6Italy : : : : : : : :Cyprus 0.1 0.1 2.8 3.0 0.2 0.2 13.1 18.5Latvia : : : : : : : :Lithuania : : : : : : : :Luxembourg : : : : : : : :Hungary 8.7 8.8 5.2 5.2 0.6 0.6 15.2 22.0Malta : : : : : : : :Netherlands 1.6 : 5.3 : 0.7 : 29.5 :Austria 18.3 20.4 5.5 6.1 1.2 1.1 56.5 60.3Poland 36.8 39.0 4.4 4.6 0.9 0.9 30.2 38.1Portugal 12.0 12.0 6.0 6.0 0.8 0.8 55.3 55.6Romania : 34.7 : 8.4 : 0.4 : 16.0Slovenia 6.0 6.2 5.2 5.3 0.5 0.5 20.0 29.8Slovakia 13.4 12.2 7.7 6.9 0.7 0.8 19.4 22.9Finland 20.0 22.0 1.0 1.1 2.5 2.3 121.1 146.2Sweden : : : : : : : :United Kingdom 12.0 12.0 5.1 5.1 0.7 0.7 25.2 31.1Norway 7.1 : 1.1 : 1.5 : : :Switzerland 7.2 7.1 6.1 6.0 0.7 0.7 25.9 38.9
(1 000 AWU)(1)
Apparent labour
productivity
(AWU/1 000 ha)
(1 000 m� removals/AWU)
(EUR 1 000 gross value added/AWU)
Employment
Employment / forest area
available for wood supply (2)
(1) annual work units.(2) data for the area is 2005.
Source: eurostat (for_awu, for_area, for_remov and for_ieeaf_cp)
The employment data presented in Table 2.2 are in annual work units (AWU). This means that the data are not simple head counts of persons employed, but are based on the labour input equivalent to the work performed by one person occupied on a full-time basis, working the annual average number of hours considered to be typical for the activity in the reporting country. For example, Eurostat recommends the use of 1 800 hours per year, but in Swiss forestry statistics, 2 400 hours per year are considered normal, because forestry work is mainly done by farmers in their own forests, regularly working much longer than 40 hours per week. Due to the fact that persons engaged in forestry work often have other activities, this conversion aims to provide a more realistic measure of the volume of work input in order to be able to calculate apparent labour productivity. Among those Member States with data available for 2008, the level of productivity (value added per annual work unit) ranged from EUR 146 200 in Finland to EUR 7 000 in Bulgaria. Some of the reasons for differences in productivity may include the level of mechanisation used, or the difficulties encountered when working in mountainous areas.

34 Forestry in the EU and the world — a statistical portrait
2 The economics of forestry and wood processing
Forestry and logging in the world
According to the FAO, the annual global quantity of roundwood removals (average between 2003 and 2007) was 3 400 million m³; this figure is considered to be an underestimate as informally and illegally removed wood is not usually recorded. The split between fuelwood and industrial roundwood was approximately equal.
The United States recorded the largest roundwood removals in the world, at 532 million m³, compared with the 480 million m³ over bark in the EU: note that these data from the FAO are provided over bark in contrast to the data in Figures 2.1 and 2.2 which are compiled under bark. India recorded the next largest production quantity (307 million m³), followed by Brazil, Canada and Russia. The split between industrial roundwood and fuelwood varied considerably: the share for industrial roundwood was around 15 % in both India and Indonesia, nearer to 50 % in Brazil and China, 73 % in Russia and 80 % in the EU, while it reached 90 % in the United States and 99 % in Canada. It should be noted, however, that the relative importance of fuelwood is likely to be under-reported in the UNECE region, as it is often part of the informal economy.
Table 2.3: average annual roundwood removals in the world
Industrial roundwood
Fuel-wood
1998-2002 2003-2007 1998-2002 2003-2007
EU-27 (2) 350 035 382 433 85 294 98 017 : :EA-17 207 352 218 357 66 259 70 074 : :Czech Republic 14 836 16 786 1 023 1 487 681 17Germany 47 265 58 788 12 497 16 548 2 073 191Spain 14 828 15 827 2 045 1 760 733 23France 38 028 33 295 31 251 29 099 1 499 1 090Latvia 12 288 13 129 2 194 3 230 : :Austria 12 019 15 488 3 316 4 414 987 238Poland 29 598 35 572 3 382 4 635 1 012 53Portugal 10 958 12 578 732 732 307 12Finland 55 721 55 152 5 112 5 933 2 107 70Sweden 64 729 75 539 6 726 10 826 2 348 219Norway 8 854 8 877 1 450 1 582 315 42Turkey 11 514 11 905 11 116 9 722 797 203Russia 104 546 134 870 47 770 50 905 2 291 187China 55 502 63 882 75 948 63 676 3 314 :India 41 173 45 957 245 837 260 752 5 006 5 680Indonesia 17 792 14 428 101 098 86 396 : :Canada 212 012 214 057 3 292 3 251 10 748 :United States 495 740 481 006 51 779 51 101 18 093 250Australia 23 035 26 672 5 547 : 1 005 :Brazil 92 102 117 048 120 552 122 573 2 049 1 008
ValueQuantity
(EUR million) (1)
Industrial roundwood
Fuel-wood
(1 000 m� over bark)2003-2007
(1) converted from uSd at the average annual rate from 2003 to 2007 (uSd 1.24906 = 1 eur).(2) excluding romania.
Source: fao (global fra, 2010)

35 Forestry in the EU and the world — a statistical portrait
2The economics of forestry and wood processing
Figure 2.3: employment in the primary production of forest goods and the management of protected areas in the world, 2005 (1)(1 000 full-time equivalent units)
0 30 60 90 120 150 180 210
BulgariaRomania
Germany (2)Poland (2)
ItalyHungary
SpainLatvia
France (2)SlovakiaFinland
Czech Republic (2)Sweden (2)
Austria (2)Lithuania
United KingdomPortugal (2)Slovenia (2)
EstoniaDenmarkBelgium
TurkeyCroatia (2)
NorwaySwitzerland (2)
FYR of Macedonia United States
BrazilCanada (2)Indonesia
Australia (2)
(1) note that different scales have been used for the two parts of the figure; ireland, greece, luxembourg, malta and the netherlands, not available; cyprus and iceland, not significant.
(2) only covers employment in primary production of goods.
Source: fao (global fra, 2010)
0 1 000 2 000 3 000 4 000 5 000 6 000 7 000
IndiaChinaRussia
The FAO estimates that around ten million people were employed in the primary production of forest goods as well as in the management of protected areas in 2005, although it reported that in general this figure may be an underestimate, as a large part of forestry employment is outside the formal sector. The FAO also noted that the high reported figures for India may not have been converted into full-time equivalent units.

36 Forestry in the EU and the world — a statistical portrait
2 The economics of forestry and wood processing
Wood-based manufacturing in the EU
Forests provide the renewable raw materials for wood-based manufacturing. Downstream from the forestry and logging activities there were 328 300 wood-based manufacturing (NACE Rev. 2 Divisions 16 and 17 and Group 18.1) enterprises in the EU in 2008, equivalent to 15.5 % of all manufacturing enterprises; together they employed almost 2.8 million persons (8.4 % of manufacturing employment). Wood-based manufacturing in the EU generated EUR 114 100 million of value added from EUR 413 300 million of turnover in 2008, 6.8 % and 5.8 % of the manufacturing total respectively.
Across the EU, wood and wood products manufacturing was the largest of the three subsectors in terms of its number of enterprises and number of persons employed, but had the smallest share
Table 2.4: Key indicators for wood-based manufacturing and furniture manufacturing in the eu-27, 2008
Number of enterprises
TurnoverValue added at factor cost
Number of persons
employed(units) (1 000)
Manufacturing 2 123 104 7 136 428 1 669 537 32 961Wood-based manufacturing 328 327 413 250 114 103 2 771Wood & wood products 180 941 131 406 34 919 1 157Sawmilling & planing of wood 35 155 35 852 7 206 273Products of wood, cork, straw & plaiting materials
145 785 95 554 27 713 884
Veneer sheets & wood-based panels 4 420 25 275 5 400 120Assembled parquet floors 1 245 2 703 744 21Other builders' carpentry & joinery 98 521 45 243 15 158 508Wooden containers 9 952 11 364 3 174 95Other wood products; articles of cork, straw & plaiting materials
31 647 10 969 3 238 139
Paper & paper products 20 688 180 000 40 674 706Pulp, paper & paperboard 2 342 80 000 15 635 206
Pulp 185 : 1 564 16Paper & paperboard 2 158 71 735 14 071 190
Articles of paper & paperboard 18 346 96 329 25 039 500Corrugated paper & paperboard; paper & paperboard containers
7 815 47 729 13 216 273
Household & sanitary goods; toilet requisites
1 390 24 871 5 225 81
Paper stationery 4 290 10 092 2 738 67Wallpaper 100 : 300 6Other paper & paperboard articles : : : 73
Printing & related services 126 698 101 844 38 510 908Printing of newspapers 1 000 4 988 2 075 31Other printing 78 043 80 366 29 213 682Pre-press & pre-media services 38 415 11 819 5 014 130Binding & related services : 4 670 2 206 65
Furniture 130 000 115 178 35 046 1 200Office & shop furniture 17 424 28 536 8 717 222Kitchen furniture 15 943 16 962 5 262 135Mattresses 2 000 5 976 1 569 :Other furniture 91 734 63 704 19 498 789
(EUR million)
Source: eurostat (sbs_na_ind_r2)

37 Forestry in the EU and the world — a statistical portrait
2The economics of forestry and wood processing
Table 2.5: output of wood-based manufacturing activities in the eu and candidate countries, 2008(eur million)
Wood & wood
products
Paper & paper
products
Printing & related services
Wood & wood
products
Paper & paper
products
Printing & related services
EU-27 131 406 180 000 101 844 34 919 40 674 38 510EA-17 92 376 139 757 : 24 132 : :Belgium 3 763 6 083 3 636 934 1 275 1 250Bulgaria 436 392 277 92 70 90Czech Republic 3 846 2 435 : 1 000 605 :Denmark 2 195 1 394 1 536 726 439 622Germany 22 090 39 724 21 506 5 646 9 441 8 083Estonia 1 141 190 188 248 41 65Ireland 1 005 571 633 259 185 296Greece : : : : : :Spain 10 074 13 290 8 795 2 950 3 443 3 713France 13 148 20 427 12 447 3 573 4 308 4 279Italy 17 387 21 531 14 134 4 771 4 350 4 540Cyprus 224 68 121 89 26 53Latvia 1 259 99 179 301 31 72Lithuania 820 191 171 201 55 61Luxembourg 174 : : 41 : :Hungary 1 140 1 283 1 087 252 320 284Malta : : : : : :Netherlands 3 352 6 070 5 382 1 017 1 482 1 921Austria 7 374 6 206 2 326 2 031 1 601 998Poland 7 411 5 448 2 804 1 987 1 586 928Portugal 3 531 2 593 1 276 764 676 540Romania 2 332 708 807 569 : 293Slovenia 743 818 466 215 179 147Slovakia 824 1 383 391 151 270 115Finland 6 649 15 010 1 672 1 185 2 842 664Sweden 9 408 14 631 2 858 1 928 3 446 1 016United Kingdom 10 184 13 663 16 375 3 729 3 422 7 501Croatia 713 : 564 192 : 199
Turnover Value added at factor cost
Source: eurostat (sbs_na_ind_r2)
of the whole sector’s value added. Paper and paper products manufacturing generated a little over one third of the sector’s value added with around one quarter (25.5 %) of its employment, but had by far the smallest number of enterprises (20 688, or 6.3 % of the total) and was therefore characterised by relatively large enterprises, both in terms of employment and output. Printing and related services had the smallest turnover share (24.6 %) of the three wood-based manufacturing subsectors but from this generated one third (33.7 %) of the sector’s value added.
Germany contributed 20.3 % of the EU’s value added in the whole sector in 2008, with the United Kingdom (12.8 %), Italy (12.0 %) and France (10.7 %) accounting for the next largest shares. The Baltic Member States were relatively specialised in wood and wood products manufacturing (compared with the total output of their sectors). Finland, Sweden and Slovakia were most specialised in the manufacture of paper and paper products. The United Kingdom was the only Member State where printing and related services accounted for more than half of the added value generated in wood-based manufacturing.

38 Forestry in the EU and the world — a statistical portrait
2 The economics of forestry and wood processing
Table 2.6: employment and productivity of wood-based manufacturing activities in the eu and candidate countries, 2008
Wood & wood
products
Paper & paper
products
Printing & related services
Wood & wood
products
Paper & paper
products
Printing & related services
EU-27 1 156.8 706.0 907.9 110.2 147.5 131.0EA-17 651.0 : : 93.2 : :Belgium 14.0 15.2 21.1 157.7 156.9 123.8Bulgaria 19.1 11.1 10.0 180.4 180.2 225.2Czech Republic 66.1 22.0 : 133.3 185.6 :Denmark 12.5 6.9 10.0 116.8 117.1 122.9Germany 135.0 143.5 169.5 129.3 143.2 127.4Estonia 17.1 1.7 3.0 134.2 166.4 160.6Ireland 5.8 3.4 5.3 121.8 114.0 134.5Greece : : : : : :Spain 90.6 53.8 88.3 125.0 165.2 134.1France : : : 28.5 126.0 117.3Italy 155.3 76.8 111.3 109.3 143.2 116.3Cyprus 3.4 0.7 1.5 126.0 167.8 158.9Latvia 25.7 1.6 4.4 169.4 197.2 192.8Lithuania 27.5 3.3 4.4 107.7 168.8 156.6Luxembourg 0.6 : : 153.3 : :Hungary 22.0 12.1 18.8 151.7 182.5 145.4Malta : : : : : :Netherlands 21.4 19.8 42.1 123.4 150.4 114.1Austria 36.3 18.5 14.9 150.5 162.7 141.9Poland 138.0 49.1 47.1 172.3 254.3 176.3Portugal 40.4 11.8 21.1 143.9 227.3 151.6Romania 74.4 : 20.6 210.2 : 225.5Slovenia 11.2 6.6 5.6 124.6 136.1 139.2Slovakia 15.7 8.1 6.2 116.2 244.9 158.5Finland 28.8 31.7 12.5 113.6 153.8 135.7Sweden 41.3 47.5 20.6 110.9 121.5 106.7United Kingdom 79.2 64.1 146.4 172.9 146.4 155.3Croatia 19.8 : 10.3 126.4 : 151.1
Number of persons employed Wage-adjusted labour productivity
(1 000) (%)
Source: eurostat (sbs_na_ind_r2)
Table 2.6 shows the wage-adjusted labour productivity ratio for wood-based manufacturing activities: this ratio is defined as value added divided by personnel costs expressed as a percentage, adjusted by the ratio of paid employees to the total number of persons employed, to take account of the fact that all persons employed contribute to value added, whereas only the costs of paid employees are included in personnel costs.
Among the EU’s wood-based manufacturing subsectors in 2008 this ratio ranged from 110.2 % for wood and wood products manufacturing to 147.5 % for the manufacture of paper and paper products, either side of the manufacturing average (119.6 %). Particularly high ratios (in excess of 200 %) were recorded for paper and paper products manufacturing in Poland, Slovakia and Portugal, while high ratios were also recorded in Romania for wood and wood products manufacturing and Bulgaria and Romania for printing and related services.
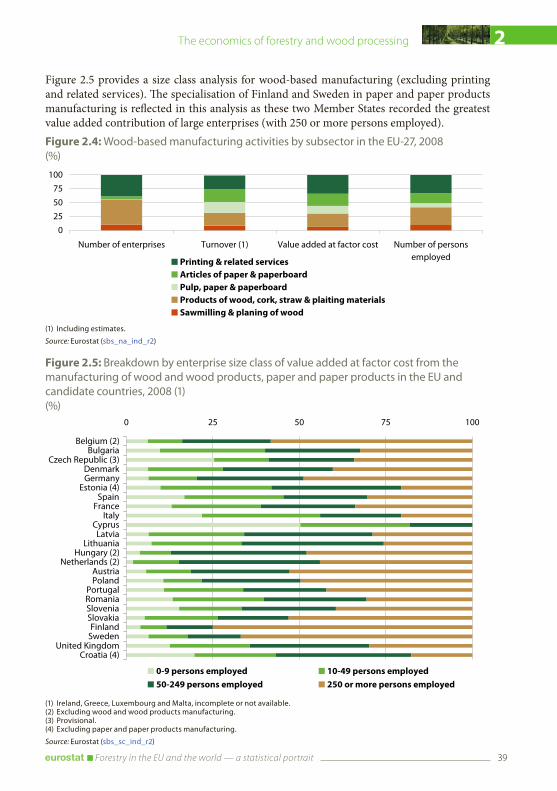
39 Forestry in the EU and the world — a statistical portrait
2The economics of forestry and wood processing
Figure 2.4: Wood-based manufacturing activities by subsector in the eu-27, 2008(%)
0255075
100
Number of enterprises Turnover (1) Value added at factor cost Number of personsemployedPrinting & related services
Articles of paper & paperboardPulp, paper & paperboardProducts of wood, cork, straw & plaiting materialsSawmilling & planing of wood
(1) including estimates.
Source: eurostat (sbs_na_ind_r2)
Figure 2.5: breakdown by enterprise size class of value added at factor cost from the manufacturing of wood and wood products, paper and paper products in the eu and candidate countries, 2008 (1)(%)
0 25 50 75 100
Belgium (2)Bulgaria
Czech Republic (3)DenmarkGermany
Estonia (4)Spain
FranceItaly
CyprusLatvia
LithuaniaHungary (2)
Netherlands (2)AustriaPoland
PortugalRomaniaSloveniaSlovakiaFinland
SwedenUnited Kingdom
Croatia (4)
0-9 persons employed 10-49 persons employed50-249 persons employed 250 or more persons employed
(1) ireland, greece, luxembourg and malta, incomplete or not available.(2) excluding wood and wood products manufacturing.(3) Provisional.(4) excluding paper and paper products manufacturing.
Source: eurostat (sbs_sc_ind_r2)
Figure 2.5 provides a size class analysis for wood-based manufacturing (excluding printing and related services). The specialisation of Finland and Sweden in paper and paper products manufacturing is reflected in this analysis as these two Member States recorded the greatest value added contribution of large enterprises (with 250 or more persons employed).

40 Forestry in the EU and the world — a statistical portrait
2 The economics of forestry and wood processing
Figure 2.6: volume of production index for the eu-27, trend series (1)(2005=100)
80
85
90
95
100
105
110
115
120
2000 2001 2002 2003 2004 2005 2006 2007 2008 2009 2010
ManufacturingWood & wood productsPaper & paper productsPrinting & related services
(1) estimates.
Source: eurostat (sts_inpr_m)
Figure 2.7: domestic output price index for the eu-27, gross series (1)(2005=100)
80
85
90
95
100
105
110
115
120
2000 2001 2002 2003 2004 2005 2006 2007 2008 2009 2010
ManufacturingWood & wood productsPaper & paper productsPrinting & related services
(1) estimates.
Source: eurostat (sts_inppd_m)
Figure 2.6 illustrates clearly the impact of the recent financial and economic crisis on wood-based manufacturing output. The volume index of production for wood and wood products manufacturing in the EU fell 25.2 % from a high at the end of 2006 to a low in April 2009 since when output stabilised and started to increase again. A similar development can be seen for paper and paper products manufacturing, although the fall started approximately one year later, was less severe (-14.9 % overall), and the subsequent recovery has so far been stronger. The development in output for printing and related services was quite different over many years, as the expansion prior

41 Forestry in the EU and the world — a statistical portrait
2The economics of forestry and wood processing
Table 2.7: domestic output price index in the eu, efta and candidate countries, gross series (2005=100)
2007 2008 2009 2010 2007 2008 2009 2010EU-27 111.3 112.2 110.1 113.0 106.6 108.8 104.5 108.9EA-17 110.6 111.2 107.9 110.1 107.2 109.1 103.3 107.9Belgium 121.4 116.4 99.4 102.0 103.1 104.6 94.7 98.7Bulgaria 112.0 125.5 122.5 115.7 107.4 116.4 117.2 121.1Czech Republic 107.4 103.4 100.3 103.0 101.9 101.4 95.9 97.8Denmark 112.4 118.3 116.0 120.5 102.3 105.6 103.7 104.8Germany 114.7 111.8 106.9 112.2 105.6 107.5 102.7 105.6Estonia : : : : : : : :Ireland 110.9 112.8 115.9 118.6 101.4 102.5 98.9 97.9Greece 109.8 115.3 117.0 118.6 105.5 114.4 114.7 115.9Spain 108.8 112.9 111.6 111.0 106.6 109.4 105.7 109.6France 109.4 111.2 107.1 108.2 108.7 110.6 102.5 105.4Italy 107.6 108.6 107.7 108.9 109.8 111.0 106.6 112.5Cyprus : : : : : : : :Latvia : : : : : : : :Lithuania 115.2 118.0 108.6 111.7 101.3 107.1 102.9 101.9Luxembourg : : : : : : : :Hungary 115.5 119.7 117.6 114.4 104.0 107.4 109.5 110.3Malta : : : : : : : :Netherlands 112.2 115.6 112.2 110.3 107.2 107.1 101.2 105.6Austria 109.1 109.1 109.7 : 105.4 107.3 103.3 :Poland 105.9 105.5 101.2 103.4 101.2 101.1 96.8 98.0Portugal 101.9 103.5 101.1 100.7 103.7 106.2 99.2 111.8Romania 118.0 130.7 133.9 133.7 108.9 127.5 133.7 136.2Slovenia 108.9 113.7 116.7 117.2 108.4 112.9 113.3 119.3Slovakia : : : : : : : :Finland 113.6 114.5 109.2 113.5 107.1 109.3 98.9 118.7Sweden 120.7 117.8 119.6 128.3 108.3 111.2 111.6 115.5United Kingdom 111.5 116.3 118.9 125.0 104.6 107.9 109.6 114.6Norway 116.9 120.7 119.6 123.5 102.6 105.3 111.5 118.6Switzerland 104.9 109.9 110.1 109.5 109.6 115.2 109.2 108.5Croatia 102.5 105.0 105.1 105.5 99.0 104.0 103.9 109.7Turkey 111.4 115.6 117.8 117.2 117.3 116.1 120.6 131.1
Wood & wood products Paper & paper products
Source: eurostat (sts_inppd_a)
to the crisis had been less apparent. The decline in the output of printing and related services during the recession was at a slower pace and the overall fall between November 2007 and December 2010 was 13.7 %; at the time of writing there has not yet been a sustained recovery in this activity’s output in the EU.
A similar analysis can be made for the development of output prices across these wood-based manufacturing activities. Output prices for wood and wood products manufacturing had accelerated during 2005, 2006 and the first half of 2007, stabilised at the end of 2007 and early in 2008, fell until the middle of 2009, and then returned to their long-term upward trend. The development of the index for paper and paper products manufacturing was similar, with less growth prior to the crisis, a larger fall in prices during the crisis, and stronger price increases during the recovery. Output prices for printing and related services were stable for many years leading up to the crisis, and started a gentle, sustained and still on-going fall in the middle of 2007.

42 Forestry in the EU and the world — a statistical portrait
2 The economics of forestry and wood processing
Wood-based manufacturing in the world
The data (other than for the EU) presented in Tables 2.8 to 2.10 are from the Indstat4 database of the United Nations Industrial Development Organization (UNIDO). The data is available using the ISIC Rev.3 industrial classification which is consistent with NACE Rev. 1.1: the wood-based manufacturing activities in NACE Rev. 1.1 include Divisions 20 and 21 and Group 22.2. The Indstat4 data for output and value added have been converted from United States dollars to euro using annual average exchange rates of the appropriate reference years. For the purposes of comparison, the EU data is shown for 2007, which is the last reference year for which NACE Rev. 1.1 data is available: note that 2008 data based on the NACE Rev. 2 classification is presented earlier in this chapter.
The value added of wood-based manufacturing activities in 2006 was EUR 148 000 million in the United States, close to 20 % more than in the EU in 2007. A geographic aggregate for wood-based manufacturing value added, constructed using data for the remaining countries shown in Table 2.9, resulted in a total for value added that was approximately two thirds that recorded for the United States, although it should be noted that the data relate to various reference years and the measure of value added is based on a variety of valuation methods.
The first processing (sawmilling and planing) of wood accounted for 8 % of EU wood-based manufacturing value added in 2007. In comparison, Russia and Canada, and to a lesser extent Australia, generated a higher proportion of their value added from this first processing stage, over 10 % in all three cases – reaching 21 % in Russia. The share of this stage was particularly low in China (2 %) and India (less than 1 %), suggesting that such activities may to a large extent be vertically integrated with upstream logging and the availability of natural resources, or with other downstream manufacturing activities. Among the countries presented in the table, the least specialised (in value added terms) in the manufacture of wood products were India and Brazil, while the most specialised were Indonesia and Russia where this activity contributed 28 % and 30 % respectively of wood-based manufacturing value added.
The manufacture of paper and paper products in India, Indonesia, Brazil and China, contributed three fifths or more of wood-based manufacturing value added. This was approximately double the equivalent share in the EU, Australia and Russia. In Canada and the United States paper and paper products manufacturing contributed around two fifths of wood-based manufacturing value added.
Printing and related services generated around one third of wood-based manufacturing value added in Australia, the United States and the EU. In the remaining countries shown in Table 2.9 the relative importance of printing and related services ranged between 14 % and 22 %, except in Indonesia where the share was just 3 %, again possibly indicating an activity that was to some extent vertically integrated (possibly with publishing).
A similar analysis shows that the contribution of paper and paper products manufacturing to the wood-based manufacturing total was lower in employment terms than in value added terms in all of the countries shown; this underlines the relatively high apparent labour productivity of paper and paper products manufacturing. This characteristic was most notable in Indonesia, where the share of paper and paper products manufacturing in wood-based manufacturing was 65 % in terms of value added, but just 28 % in terms of employment.

43 Forestry in the EU and the world — a statistical portrait
2The economics of forestry and wood processing
Table 2.8: output at producer prices of wood-based manufacturing activities in the world(eur million)
YearSawmilling and planing
of wood
Products of wood, cork
& straw
Paper & paper
products
Printing & related services
EU-27 2007 39 642 95 841 166 000 105 150Russia (1) 2007 3 752 5 489 8 395 3 493China 2007 3 091 34 183 96 271 19 801India 2005 135 762 4 536 1 260Indonesia 2006 402 2 920 6 257 287Canada 2003 11 733 7 833 21 058 7 264United States (2) 2006 25 615 63 907 135 681 79 395Australia (2) 2006 2 225 3 917 5 664 5 317Brazil (3) 2007 2 247 3 854 16 250 3 162
(1) output at basic prices.(2) valuation not defined.(3) output at factor cost.
Source: eurostat (sbs_na_2a_dade) and unido (indstat)
Table 2.9: value added at factor cost of wood-based manufacturing activities in the world(million national currency)
YearSawmilling and planing
of wood
Products of wood, cork
& straw
Paper & paper
products
Printing & related services
EU-27 2007 9 894 31 112 42 000 41 538Russia (1) 2007 1 523 2 177 2 311 1 227China (2) 2007 960 10 061 26 474 6 464India (2) 2005 7 153 983 321Indonesia 2006 121 1 150 2 671 142Canada (3) 2003 3 868 3 687 8 220 4 238United States (3) 2006 7 848 27 539 64 193 48 088Australia (1) 2006 907 1 434 1 954 2 255Brazil 2007 1 134 1 692 7 579 1 758
(1) value added at basic prices.(2) value added at producer prices.(3) valuation not defined.
Source: eurostat (sbs_na_2a_dade) and unido (indstat)
Table 2.10: employees in wood-based manufacturing activities in the world(1 000)
YearSawmilling and planing
of wood
Products of wood, cork
& straw
Paper & paper
products
Printing & related services
EU-27 2007 246.5 753.6 682.8 807.2Russia 2007 131.5 209.0 131.5 122.9China 2007 104.8 1 146.9 2 085.7 712.3India (1) 2005 10.1 46.3 177.7 77.4Indonesia 2006 47.8 250.5 126.3 21.6Canada 2003 72.2 54.9 92.2 76.0United States 2006 104.0 432.1 414.0 620.3Australia (1) 2005 15.5 37.6 24.9 54.4Brazil (1) 2007 97.2 127.8 168.4 97.3
(1) Persons employed.
Source: eurostat (sbs_na_2a_dade) and unido (indstat)


Wood and wood products
Among the wide range of forest products, wood is the one that is most in demand worldwide. The production and trade of wood and wood products is the focus of this chapter. Production begins with the logging of roundwood, the skidding of logs to a road and the stripping off of their bark.
There are two categories of roundwood: industrial roundwood and fuelwood. Industrial roundwood commodities include logs, pulpwood and other industrial wood (the final use determines the commodity). Logs are usually large-diameter, good-quality timber used for the production of sawnwood (including railway sleepers) and veneer sheets. Pulpwood is generally lower-quality timber that is used for the manufacture of pulp, particle board and fibreboard. Other industrial roundwood includes timber for the manufacture of poles, piling, posts or fencing.
Fuelwood is wood of generally lower quality (from trunks and branches of trees), to be used as fuel for cooking, heating and energy production and includes wood used to produce charcoal; Chapter 4 of this publication looks in more detail at the use of wood as a source of energy.
For lower-quality wood, it is common to find a relatively high degree of substitution between different uses. For example, different kinds of processing residues, chips and particles are used either directly as a fuel or for making pulp, particle board, or pellets, briquettes and other solid fuel, such that there is very little waste.
Further downstream, a range of manufacturing processes take these basic and primary wood products and transform them into a range of wood and paper products, many of which are consumer goods – for example, furniture, brushes and brooms, newspapers, or household and sanitary papers.
45 Forestry in the EU and the world — a statistical portrait
A detailed explanation of the different wood and paper products that are covered within this chapter is provided in an annex that begins on page 100. These definitions are taken from the Joint Forest Sector Questionnaire, which is the basis for a data collection exercise conducted by the FAO, ITTO, UNECE and Eurostat.

46 Forestry in the EU and the world — a statistical portrait
3 Wood and wood products
Production of wood products in the EU
The opening two tables in this chapter provide an overview through the use of supply balances for wood products. These traditionally show the extent to which a country or a market is self-sufficient in a particular commodity, by taking domestic production and adjusting this by the trade balance (exports minus imports). The information presented is expressed in terms of tonnes of carbon; this is done through the application of conversion factors for each product (see page 107). These conversions allow the different wood and paper products to be compared with each other, even though the original data in quantity terms was collected using a variety of measures (tonnes, square metres or cubic metres).
Information on the carbon content of each wood and paper product can be used when developing models that identify the level and rate of carbon emissions over its lifetime. The carbon stored in long-lived wood products such as sawnwood used in construction or in panels used in finishing buildings or making furniture may, in future, become part of national carbon accounting.
Table 3.1: Supply balance for wood products in the eu-27, 2008 (1)(1 000 tonnes of carbon)
Production Exports ImportsRoundwood 93 404 857 4 121
Industrial roundwood 75 116 836 3 897Fuelwood 18 289 21 224
Wood charcoal 154 13 250Wood chips and particles 12 373 242 913Wood residues including pellets 9 571 138 776Sawnwood 22 345 3 187 2 161Wood-based panels 13 952 1 701 1 752
Veneer sheets 337 54 277Plywood 875 134 1 000Particle board, OSB and others 9 298 831 186Fibreboard 3 442 682 242
Wood pulp 19 930 1 003 4 200Mechanical 5 487 63 134Semi-chemical 656 53 83Chemical 13 322 826 3 722Dissolving grades 290 60 261
Other pulp 12 859 41 46Pulp from fibres other than wood 662 13 38Recovered fibre pulp 12 197 28 7
Recovered paper 26 577 5 556 603Paper and paperboard 48 940 9 861 5 422
Graphic papers 22 878 5 863 3 081Sanitary and household papers 3 313 368 102Packaging materials 20 600 3 415 2 145Other paper and paperboard n.e.s. 2 150 216 94
(1) converted to tonnes of carbon using iPcc coefficients (see page 107); eu-27 exports and imports relate to extra-eu trade; excludes confidential information and those member States for which data are not available.
Source: eurostat (for_basic, for_swpan and for_pp)

47 Forestry in the EU and the world — a statistical portrait
3Wood and wood products
Table 3.2: Supply balance for wood products in the eu and efta (1)(million tonnes of carbon)
Produc-tion
Exports ImportsProduc-tion
Exports ImportsProduc-tion
Exports Imports
EU-27 274.38 23.02 24.01 294.78 23.11 23.28 274.67 22.71 19.99Belgium 4.08 4.86 4.97 4.04 5.06 6.04 4.09 5.10 5.70Bulgaria 1.91 0.40 0.28 2.23 0.60 0.58 2.00 0.35 0.53Czech Republic 7.17 2.32 1.32 7.55 2.46 1.30 6.66 2.30 1.30Denmark 1.35 0.90 3.94 1.34 0.96 2.95 1.41 0.95 2.84Germany 44.39 13.88 12.62 55.66 17.18 15.67 47.98 17.52 15.37Estonia 2.51 1.08 0.73 2.21 0.94 0.68 2.18 0.87 0.39Ireland 1.48 0.61 0.64 1.52 0.61 0.64 1.25 0.56 0.52Greece 0.88 0.66 1.57 0.92 0.73 1.27 0.87 0.51 7.03Spain 16.69 2.51 5.67 16.06 2.85 6.34 16.08 3.14 4.78France 42.81 6.56 7.10 43.48 6.57 7.38 41.75 6.11 6.87Italy 11.94 2.50 8.87 11.85 2.77 8.90 11.35 2.77 7.98Cyprus 0.01 0.01 0.11 0.02 0.01 0.11 0.02 0.01 0.10Latvia 5.21 2.33 0.51 4.69 2.18 0.67 4.09 1.89 0.32Lithuania 2.35 0.61 0.46 2.46 0.74 0.59 2.18 0.59 0.65Luxembourg 0.67 0.71 0.60 0.25 0.36 0.69 0.30 0.40 0.31Hungary 2.06 0.69 0.93 2.04 0.73 0.98 1.88 0.52 0.77Malta 0.00 0.00 0.03 0.00 0.00 0.03 0.00 0.00 0.03Netherlands 3.55 3.89 5.16 3.36 3.98 5.28 3.20 3.83 5.28Austria 14.55 4.97 4.82 15.65 5.55 4.76 15.37 5.29 4.38Poland 13.72 1.83 2.46 15.45 1.91 2.82 14.67 1.94 2.92Portugal 5.78 1.88 0.64 5.81 2.11 0.88 5.54 1.99 0.89Romania 5.05 0.92 0.43 5.57 0.91 0.54 5.22 0.80 0.47Slovenia 1.67 0.70 0.66 1.80 0.91 0.82 1.59 1.12 0.94Slovakia 3.62 1.19 0.50 4.02 1.23 0.62 4.37 1.22 0.69Finland 32.29 10.32 4.55 33.81 10.11 4.27 30.11 9.04 4.68Sweden 36.06 11.25 3.61 40.08 11.08 3.76 38.01 10.77 4.04United Kingdom 12.61 2.97 7.50 12.90 3.38 7.77 12.48 3.42 6.87Iceland 0.01 0.01 0.05 0.01 0.01 0.06 0.00 0.01 0.07Liechtenstein 0.01 0.00 0.00 0.01 0.00 0.00 0.01 0.00 0.00Norway 5.43 1.77 1.41 5.45 1.73 1.57 5.26 1.71 1.38Switzerland 4.00 1.75 1.33 4.13 1.59 1.45 3.92 1.35 1.28
2006 2007 2008
(1) converted to tonnes of carbon using iPcc coefficients (see page 107); eu-27 exports and imports relate to extra-eu trade, while trade data for individual countries relates to total trade.
Source: eurostat (for_basic, for_swpan and for_pp)
Table 3.1 confirms that the EU tends to import a relatively high proportion of raw wood materials at the start of the production chain (roundwood, sawnwood and pulp), while it is a net exporter of downstream semi-finished and finished wood and paper products (particle board, fibreboard, graphic papers, or packaging materials).
The bulk of the 274.7 million tonnes of carbon contained in wood and paper products made in the EU in 2008 remained within the EU. Some 8.3 % of the total was exported, while imports amounted to only 7.3 % of apparent consumption. While the EU was close to being self-sufficient in wood and paper products in overall terms, there were a range of products for which much higher import penetration ratios were recorded (for example, veneer sheets, plywood, chemical and dissolving grades of wood pulp).

48 Forestry in the EU and the world — a statistical portrait
3 Wood and wood products
The production of roundwood in the EU reached an all-time high in 2007, peaking at 458.3 million m³ (see Figures 2.2 and 3.1); the harvest in 2007 was particularly high as a result of additional removals attributable to the large number of trees damaged in storms.
The global financial and economic crisis had a severe effect on wood-based manufactured products. With a downturn in industrial activity and a depressed construction sector, many wood and paper product markets slumped in 2008 and 2009. This, in turn, led to a lack of demand for raw wood materials which resulted in the output of roundwood falling to 391.9 million m³ (under bark) by 2009.
The production of roundwood in the EU in 2009 was, in the main, composed of industrial roundwood (accounting for 78.9 % of the total), while the production of fuelwood covered the remaining 21.1 %.
There was an 11.3 % reduction in EU industrial roundwood production between 2007 and 2008, which was followed by a further contraction of 7.3 % in 2009. As a result, industrial roundwood production stood in 2009 at 309.3 million m³, the lowest figure recorded since 1999.
Industrial roundwood production fell by more than 10 % between 2008 and 2009 in Spain, Italy, Lithuania, Hungary and the Netherlands and by more than 20 % in Luxembourg, Austria and Finland. However, the largest reductions were recorded in Bulgaria (-34.2 %) and Cyprus (-53.1 %); note that together these two Member States accounted for no more than 0.7 % of the EU’s total industrial roundwood production in 2009. Latvia, Ireland, France, Germany and Denmark were exceptions to the general downward trend, each reporting an increase in industrial roundwood production between 2008 and 2009.
The production of fuelwood continued to rise within the EU during the financial and economic crisis. Among the possible reasons for this are: the increased importance given to these products by governments wishing to encourage the use of energy from renewable
Figure 3.1: Production of roundwood and fuelwood in the eu-27 (1)(million m³)
0
100
200
300
400
1999 2000 2001 2002 2003 2004 2005 2006 2007 2008 2009
Industrial roundwood
Fuelwood
(1) estimates, 1999-2001, 2005-2007 and 2009.
Source: eurostat (for_basic)

49 Forestry in the EU and the world — a statistical portrait
3Wood and wood products
Table 3.3: Production of roundwood, fuelwood and other basic wood products in the eu, efta and candidate countries, 2009(1 000 m³)
TotalConifer-
ousNon-conif.
EU-27 391 923 309 334 241 867 67 467 82 590 47 533 38 790 7 828EA-17 226 430 170 611 125 699 44 912 55 819 23 694 23 148 3 930Belgium 4 395 3 670 2 800 870 725 475 425 0 Bulgaria 4 599 2 224 1 077 1 147 2 375 47 53 6Czech Republic 16 187 14 307 13 487 820 1 880 1 380 1 140 0 Denmark 2 812 1 706 1 299 407 1 106 168 0 0 Germany 56 634 48 073 37 050 11 023 8 561 3 127 828 1 460Estonia 4 860 3 708 2 498 1 211 1 152 1 700 800 488Ireland 2 349 2 262 2 259 3 87 516 167 8Greece 1 261 507 361 146 754 3 11 0 Spain 13 980 11 900 5 349 6 551 2 080 1 747 2 231 242France 54 108 28 643 20 708 7 935 25 465 4 799 7 000 554Italy 7 581 2 600 1 369 1 232 4 981 420 200 0 Cyprus 10 6 5 1 4 2 0 0 Latvia 10 409 8 673 6 412 2 261 1 736 2 847 890 671Lithuania 5 460 3 677 2 123 1 554 1 783 835 683 278Luxembourg 274 257 113 144 17 555 853 14Hungary 5 244 2 365 579 1 786 2 879 58 89 0 Malta 0 0 0 0 0 0 0 0 Netherlands 1 016 726 489 237 290 107 728 185Austria 16 727 12 144 11 344 800 4 584 3 505 2 362 222Poland 34 629 30 475 23 420 7 055 4 154 929 5 500 585Portugal 9 564 8 964 3 419 5 545 600 198 1 507 402Romania 12 557 8 587 4 228 4 359 3 969 410 1 732 200Slovenia 2 930 1 948 1 468 479 983 118 236 6Slovakia 9 087 8 501 5 924 2 577 586 620 809 90Finland 41 653 36 701 30 543 6 158 4 952 5 803 4 990 260Sweden 65 100 59 200 56 150 3 050 5 900 15 500 5 000 1 982United Kingdom 8 497 7 509 7 392 116 988 1 665 555 175Liechtenstein 25 10 9 1 15 15 0 0 Norway 8 884 6 631 6 528 103 2 253 0 141 50Switzerland 4 577 3 252 2 857 395 1 325 0 0 0 Montenegro 364 208 177 31 156 0 0 :Croatia 4 242 3 380 607 2 773 862 179 245 :FYR of Macedonia 639 109 45 64 530 : 0 :Turkey 19 430 14 382 8 806 5 576 5 048 850 850 :
Pellets
Roundwood Wood chips
& particles
Wood residues & pellets
Industrial roundwoodTotal
Fuel-wood
Total
Source: eurostat (for_basic)
sources such as biomass; consumers looking to use alternative fuels when faced with price increases for fossil fuels; consumers choosing renewable energy sources for environmental reasons. Production of fuelwood in the EU rose to 82.6 million m³ in 2009.
The production of wood pellets in the EU grew at a phenomenal rate, rising 41.3 % between 2008 and 2009; almost half of the EU’s production was concentrated within Germany and Sweden in 2009.

50 Forestry in the EU and the world — a statistical portrait
3 Wood and wood products
The biggest demand for sawnwood and wood-based panels stems from construction (including wooden flooring) and furniture markets, while lower grades of sawnwood are more often used for packaging (for example, as pallets).
Given both the construction sector and the furniture market were depressed as a result of the global financial and economic crisis, it is perhaps not surprising to find that EU production of sawnwood peaked in 2007 at 115.4 million m³, before falling by 13.9 % in 2008 and an additional 8.3 % in 2009. The production of wood-based panels (comprising particle board, fibreboard, plywood and veneer sheets) reached 69.4 million m³ in 2007, before retracting by 10.7 % in 2008 and by a further 8.8 % in 2009.
Among the various types of wood-based panels manufactured within the EU, the highest level of production was for particle board (37.6 million m³ in 2009); this is a composite material often referred to as chipboard and made from wood particles, chips, shavings or sawdust that is generally combined with resin before being pressed and extruded. EU production of particle board was more than twice the level of the output recorded for fibreboard – such as hardboard, medium-density fibreboard (MDF) and softboard (also known as insulating board) – where production stood at 14.6 million m³ in 2009. The level of EU production of plywood and of veneer sheets was considerably lower, at 3.0 million m³ and 1.4 million m³ respectively.
Since the most recent peaks in production (in either 2006 or 2007), the production of the various different types of wood-based panels in the EU fell consistently through to 2009. The largest overall contraction (-53.0 % between 2006 and 2009) was recorded for hardboard (a sub-category of fibreboard), while the production of plywood fell by 35.0 % between 2007 and 2009. The smallest reduction in output was recorded for oriented strandboard (OSB ; a sub-category of particle board made of larger shavings), with an overall decline of 5.8 % between 2007 and 2009.
Figure 3.2: Production of wood-based panels in the eu-27 (1)(1 000 m³)
0
10 000
20 000
30 000
40 000
50 000
1999 2000 2001 2002 2003 2004 2005 2006 2007 2008 2009
Particle boardFibreboardPlywoodVeneer sheets
(1) estimates.
Source: eurostat (for_swpan)

51 Forestry in the EU and the world — a statistical portrait
3Wood and wood products
Table 3.4: Production of sawnwood and wood-based panels, sheets and boards in the eu, efta and candidate countries, 2009(1 000 m³)
Total OSB TotalHard-board
MDF
EU-27 91 031 56 557 1 383 2 957 37 635 3 934 14 582 1 967 11 278EA-17 55 753 38 317 1 026 2 148 24 796 2 074 10 346 1 519 8 149Belgium 1 255 2 113 25 13 1 850 225 225 0 225Bulgaria 447 799 17 48 651 200 83 71 12Czech Republic 4 636 1 681 16 149 1 436 508 80 0 80Denmark 320 446 83 13 343 18 7 2 5Germany 20 674 14 813 393 176 9 311 1 100 4 933 1 033 3 800Estonia 1 150 260 40 60 130 0 30 0 0Ireland 774 713 0 0 329 274 384 2 342Greece 106 994 0 18 910 0 66 4 59Spain 2 072 3 116 91 222 1 778 8 1 025 50 800France 7 886 4 959 54 265 3 680 300 960 120 770Italy 1 220 4 154 317 337 2 700 0 800 0 800Cyprus 5 2 0 1 0 0 0 0 0Latvia 2 500 643 7 154 482 332 0 0 0Lithuania 1 011 611 51 15 480 0 65 44 0Luxembourg 129 394 0 0 167 167 227 46 181Hungary 102 284 12 2 113 0 158 113 45Malta 0 0 0 0 0 0 0 0 0Netherlands 210 46 0 0 0 0 46 0 0Austria 8 455 3 013 0 163 2 100 0 750 100 650Poland 3 594 7 699 76 315 4 704 462 2 603 195 1 790Portugal 1 093 1 385 30 23 848 0 484 124 326Romania 3 598 2 247 57 48 1 673 0 470 0 470Slovenia 397 427 37 75 117 0 197 0 196Slovakia 2 254 863 3 15 705 0 140 0 0Finland 8 072 1 066 36 780 170 0 80 40 0Sweden 16 200 800 38 65 587 340 110 23 67United Kingdom 2 871 3 030 0 0 2 370 0 660 0 660Liechtenstein 4 0 0 0 0 0 0 0 0Norway 1 850 436 0 0 267 0 169 50 0Switzerland 1 481 937 5 8 409 0 515 0 221Montenegro 50 0 0 0 0 0 0 0 0Croatia 653 143 19 0 124 0 0 0 0FYR of Macedonia 2 0 0 0 0 0 0 0 0Turkey 5 853 5 482 82 100 2 350 30 2 950 626 2 290
Total
Wood-based panelsSawn-wood total
FibreboardParticle boardVeneer sheets
Ply-wood
Source: eurostat (for_swpan)
Germany was the largest producer of both sawnwood and wood-based panels among the Member States in 2009, accounting for 22.7 % and 26.2 % of the respective EU totals. For sawnwood, Sweden (17.8 %) was the only other Member State to record a double-digit share of total EU output, while Poland (13.6 %) was the only other Member State to record a share in excess of 10 % for wood-based panels.

52 Forestry in the EU and the world — a statistical portrait
3 Wood and wood products
The raw materials used in the production of woodpulp can also be used as fuel. As it is likely that there will be a considerable expansion in the use of wood as a fuel in the coming years (as each country implements its national renewable energy action plan), pulp mills may expect to face added competition for their raw material inputs. Pulp may also be derived from other sources – principally, from fibres other than wood or from recovered fibres (labelled here as ‘other pulp’).
The production of woodpulp closely follows the pattern of demand for paper. Having seen output peak at 41.5 million tonnes in 2006 and remain very close to this level in 2007, EU pulp manufacturing activity faced a period of weak demand during 2008 and 2009 when production fell 3.6 % and 12.1 % respectively. Woodpulp production fell to 35.0 million tonnes in 2009, marking its lowest level since 1996 (32.7 million tonnes).
The overall figures for woodpulp production may be studied in more detail through the different processes that are commonly used to break down the fibres within wood. The largest reductions in EU output in 2009 were recorded for mechanical woodpulp (-18.2 %) and semi-chemical woodpulp (-11.9 %), while the production of chemical woodpulp fell by 9.9 %. The relatively low level of output recorded for dissolving grades woodpulp (0.6 million tonnes in 2009) saw its production rise by 1.9 % on 2008; this type of woodpulp is only used in the specialised production of synthetic cellulose fibres such as viscose/rayon and cellulose acetates.
Sweden and Finland are the primary pulp producers within Europe. In 2009 they accounted for 33.3 % and 24.9 % of the EU’s production of woodpulp; none of the remaining Member States accounted for more than 7.3 % (Germany) of the total, while Portugal (6.2 %) and Austria (5.2 %) were relatively specialised in the production of woodpulp.
Figure 3.3: Production of pulp in the eu-27 (1)(million tonnes)
0
5
10
15
20
25
30
1999 2000 2001 2002 2003 2004 2005 2006 2007 2008 2009
Chemical woodpulp Other pulp (2)Mechanical woodpulpSemi-chemical woodpulpDissolving grades woodpulp (3)
(1) estimates.(2) 1999-2000 and 2002-2005, not available.(3) 1999-2000, not available.
Source: eurostat (for_pp)

53 Forestry in the EU and the world — a statistical portrait
3Wood and wood products
Table 3.5: Production of pulp in the eu, efta and candidate countries, 2009(1 000 tonnes)
Total Mechanical Semi-
chemical Chemical
Dissolving grades
EU-27 35 018 9 247 1 171 24 009 591 25 160EA-17 21 163 5 583 666 14 518 397 21 429Belgium 990 180 0 810 0 4Bulgaria 137 0 7 130 0 0Czech Republic 698 46 0 652 0 4Denmark 5 5 0 0 0 89Germany 2 547 1 060 0 1 487 0 12 928Estonia 200 140 0 60 0 0Ireland 0 0 0 0 0 0Greece 0 0 0 0 0 0Spain 1 746 90 0 1 624 31 5 750France 1 641 433 96 1 025 86 83Italy 376 260 117 0 0 213Cyprus 0 0 0 0 0 0Latvia 0 0 0 0 0 0Lithuania 0 0 0 0 0 0Luxembourg 0 0 0 0 0 0Hungary 0 0 0 0 0 18Malta 0 0 0 0 0 0Netherlands 72 72 0 0 0 0Austria 1 817 303 0 1 235 280 2 002Poland 1 060 20 214 826 0 105Portugal 2 182 0 0 2 182 0 354Romania 15 0 5 10 0 0Slovenia 172 164 8 0 0 94Slovakia 689 0 112 576 0 0Finland 8 732 2 881 333 5 518 0 1Sweden 11 668 3 322 279 7 873 194 270United Kingdom 271 271 0 0 0 3 246Liechtenstein 0 0 0 0 0 0Norway 1 822 1 072 0 600 150 0Switzerland 132 132 0 0 0 700Montenegro 0 : 0 : 0 0Croatia 84 47 37 0 0 0FYR of Macedonia 0 0 0 0 0 0Turkey 56 0 56 0 0 53
WoodpulpOther pulp
Source: eurostat (for_pp)
The situation was quite different in relation to the production of other pulp, although output was again quite highly concentrated within relatively few Member States. Just over half (51.4 %) of the EU’s production of other pulp was accounted for by Germany, while Spain (22.9 %), the United Kingdom (12.9 %) and Austria (8.0 %) were the only other Member States to report shares in excess of 1.4 % (Portugal).

54 Forestry in the EU and the world — a statistical portrait
3 Wood and wood products
The production of paper and paperboard is closely linked to the general macro-economic situation, for example, the demand for packaging materials and print advertising from a wide range of industrial and service sector clients.
Overall production of paper and paperboard grew at a steady pace within the EU to peak in 2006 at 101.5 million tonnes and remained almost unchanged in 2007. However, with the onset of the financial and economic crisis, there was a 3.5 % decline in production in 2008, and this development accelerated in 2009 with a further loss of 10.0 %. By 2009 production had decreased to 88.1 million tonnes – a level not seen since 2001.
Paper and paperboard can be broken down into four main sub-categories. Among these, the highest level of EU production (in quantity terms) was recorded for graphic papers (composed of newsprint, printing and writing papers, see Table 3.6) and for packaging materials (case materials, carton, wrapping papers, see Table 3.7), at 39.3 million tonnes and 38.7 million tonnes respectively in 2009. The output of sanitary and household papers (6.4 million tonnes) and that of other paper and paperboard (3.7 million tonnes) was considerably lower. The downturn in EU production of graphic papers (-14.1 %) was particularly marked between 2008 and 2009, with output falling 2.3 times as fast as the decline recorded for packaging materials.
Germany was the largest producer of paper and paperboard in 2009, accounting for 23.7 % of the EU’s output. Looking in more detail, the vast majority of the EU’s production of newsprint was centred in Sweden, Germany, the United Kingdom and France, while the production of printing and writing papers was concentrated in Germany and Finland. Among the diverse range of packaging materials produced within the EU, Germany and France were specialised in the production of case materials, Germany, Finland and Sweden in the production of cartonboard, and Sweden in the production of wrapping papers.
Figure 3.4: Production of paper and paperboard in the eu-27 (1)(million tonnes)
0
10
20
30
40
50
1999 2000 2001 2002 2003 2004 2005 2006 2007 2008 2009
Graphic papersPackaging materialsSanitary and household papersOther paper and paperboard n.e.s.
(1) estimates.
Source: eurostat (for_pp)

55 Forestry in the EU and the world — a statistical portrait
3Wood and wood products
Table 3.6: Production of paper and paperboard; graphic papers; sanitary and household papers in the eu, efta and candidate countries, 2009(1 000 tonnes)
TotalUncoated
mech-anical
Uncoated wood-
free Coated
EU-27 88 134 39 320 8 440 30 880 6 717 8 518 15 645 6 431EA-17 67 071 30 906 4 685 26 221 5 302 6 500 14 419 4 941Belgium 1 990 1 450 250 1 200 150 50 1 000 100Bulgaria 318 3 0 3 0 3 0 23Czech Republic 932 220 53 167 48 111 8 20Denmark 419 158 2 156 1 151 4 0Germany 20 902 9 291 2 126 7 165 1 754 1 624 3 787 1 368Estonia 62 0 0 0 0 0 0 0Ireland 45 0 0 0 0 0 0 0Greece 522 0 0 0 0 0 0 68Spain 5 700 1 678 323 1 355 764 0 591 696France 8 332 3 290 873 2 417 124 900 1 393 733Italy 8 404 2 846 211 2 635 96 495 2 044 1 319Cyprus 0 0 0 0 0 0 0 0Latvia 45 1 0 1 0 1 0 0Lithuania 86 0 0 0 0 0 0 15Luxembourg 12 0 0 0 0 0 0 11Hungary 461 19 0 19 1 18 0 6Malta 0 0 0 0 0 0 0 0Netherlands 2 609 926 273 653 15 208 430 120Austria 4 606 2 548 299 2 248 678 449 1 122 126Poland 3 275 1 075 166 908 177 705 26 333Portugal 1 634 1 088 0 1 088 0 1 088 0 76Romania 238 41 25 16 0 16 0 20Slovenia 732 393 119 274 0 80 194 41Slovakia 921 539 0 539 0 539 0 139Finland 10 602 6 856 210 6 646 1 721 1 067 3 858 143Sweden 10 996 5 289 2 405 2 884 1 187 793 904 338United Kingdom 4 293 1 609 1 104 505 1 220 284 736Liechtenstein 0 0 0 0 0 0 0 0Norway 1 577 1 173 436 737 583 42 112 17Switzerland 1 524 935 244 691 94 123 474 66Montenegro 227 0 0 : 0 0 0 227Croatia 526 228 2 226 226 0 0 2FYR of Macedonia 20 0 0 0 0 0 0 0Turkey 4 442 461 0 461 188 188 86 897
Graphic papersPrinting & writing papers
Sanitary & house-
hold papers
Paper & paper-board total
News-print
Total
Source: eurostat (for_pp)

56 Forestry in the EU and the world — a statistical portrait
3 Wood and wood products
Table 3.7: Production of paper and paperboard; packaging materials; other paper and paperboard in the eu, efta and candidate countries, 2009(1 000 tonnes)
TotalCase
materialsCarton-board
Wrapping papers
Other papers for packaging
EU-27 88 134 38 712 22 406 8 626 4 104 3 577 3 670EA-17 67 071 28 014 17 077 5 377 2 266 3 294 3 211Belgium 1 990 370 250 100 10 10 70Bulgaria 318 292 74 28 190 0 0Czech Republic 932 652 278 33 292 49 40Denmark 419 260 211 41 6 3 1Germany 20 902 8 979 6 154 1 580 216 1 029 1 264Estonia 62 62 0 0 60 2 0Ireland 45 45 45 0 0 0 0Greece 522 453 152 3 148 150 0Spain 5 700 2 658 2 144 282 78 154 669France 8 332 3 898 3 014 403 216 265 410Italy 8 404 3 877 2 169 578 419 711 361Cyprus 0 0 0 0 0 0 0Latvia 45 41 31 2 3 5 3Lithuania 86 71 71 0 0 0 0Luxembourg 12 0 0 0 0 0 1Hungary 461 436 349 0 85 2 0Malta 0 0 0 0 0 0 0Netherlands 2 609 1 563 760 103 51 649 0Austria 4 606 1 798 1 046 487 251 14 134Poland 3 275 1 822 1 139 485 188 10 46Portugal 1 634 466 388 33 15 31 4Romania 238 170 58 0 26 87 7Slovenia 732 296 0 189 77 30 3Slovakia 921 242 218 0 24 0 0Finland 10 602 3 307 737 1 619 701 250 296Sweden 10 996 5 252 1 892 2 376 984 0 117United Kingdom 4 293 1 702 1 227 283 64 128 246Liechtenstein 0 0 0 0 0 0 0Norway 1 577 327 275 0 25 27 60Switzerland 1 524 400 269 87 13 31 124Montenegro 227 0 0 0 0 0 0Croatia 526 280 145 109 20 6 16FYR of Macedonia 20 20 10 0 10 0 0Turkey 4 442 2 799 834 308 0 1657 285
Other paper & paper-board
Packaging materialsPaper & paper-
board total
Source: eurostat (for_pp)

57 Forestry in the EU and the world — a statistical portrait
3Wood and wood products
Trade in wood products in the EU
Figure 3.5: extra-eu and intra-eu trade of wood-based products for the eu-27 (1)(eur million)
0
25 000
50 000
75 000
100 000
1999 2000 2001 2002 2003 2004 2005 2006 2007 2008 2009
Intra-EU dispatches Extra-EU exports Extra-EU imports
(1) Wood-based products defined as the sum of Sitc divisions 24, 25, 63 and 64.
Source: eurostat (dS-018995)
Table 3.8: extra-eu and intra-eu trade of wood-based products for the eu-27, 2009 (1)
1999 2009 1999 2009Intra-EU dispatchesWood-based products 62 692 73 858 126 446 133 268
Cork and wood 8 353 9 069 47 734 45 675Pulp and waste paper 3 898 4 861 14 526 18 318Cork and wood manufactures (excluding furniture) 10 485 13 404 16 290 16 162Paper, paperboard and articles thereof 39 956 46 524 47 897 53 113
Extra-EU exportsWood-based products 18 078 26 145 28 929 50 339
Cork and wood 2 631 3 245 8 796 11 549Pulp and waste paper 806 2 090 5 158 15 756Cork and wood manufactures (excluding furniture) 2 925 4 505 2 681 5 703Paper, paperboard and articles thereof 11 717 16 305 12 294 17 331
Extra-EU importsWood-based products 18 374 18 291 47 255 42 485
Cork and wood 5 240 4 075 27 022 20 790Pulp and waste paper 3 906 3 486 9 236 9 351Cork and wood manufactures (excluding furniture) 3 485 4 080 3 719 4 531Paper, paperboard and articles thereof 5 744 6 649 7 278 7 813
Value(EUR million)
Quantity(1 000 tonnes)
(1) Wood-based products defined as the sum of Sitc divisions 24, 25, 63 and 64.
Source: eurostat (dS-018995)
The statistics in this section are based on the Standard International Trade Classification (SITC), which does not distinguish between furniture made of wood and that made of other materials; as such, furniture is excluded from the analysis. ‘Dispatches’ and ‘arrivals’ are terms used for trade between the EU Member States (intra-EU trade). Dispatches are used, as Eurostat considers these more reliable for a number of reasons, including: the application of thresholds; late or non-response by certain businesses; statistical confidentiality; misapplication of the rules and delays; different methods for calculating transactions. Tables 3.9 to 3.16 present data for extra-EU trade, which treats the EU as a single market.
The value of intra-EU dispatches of wood-based products between Member States was EUR 73 858 million in 2009; this was 2.8 times as high as the value of extra-EU exports. The EU recorded an extra-EU trade surplus of EUR 7 854 million for wood-based products in 2009.

58 Forestry in the EU and the world — a statistical portrait
3 Wood and wood products
Figure 3.6a: top ten trading partners, exports from the eu-27 (1)(% share of eu-27 exports, based on export values)
Cork and wood0 5 10 15 20 25 30 35 40 45 50 55
JapanEgypt
NorwaySwitzerland
AlgeriaMorocco
Saudi ArabiaChina
United StatesTunisiaOthers
2009
1999
(1) cork and wood, Sitc division 24; pulp and waste paper, Sitc division 25; the figure is based on the top ten partners for 2009.
Source: eurostat (dS-018995)
Pulp and waste paper0 5 10 15 20 25 30 35 40 45 50 55
ChinaIndia
IndonesiaSwitzerland
TurkeySouth Korea
United StatesThailand
TaiwanJapan
Others
2009
1999
The quantity of extra-EU exports of wood-based products rose by 74.0 % between 1999 and 2009. By far the most important product group was that of paper and paperboard and articles thereof, which recorded exports of 17.3 million tonnes, or EUR 16 305 million in 2009.
The EU’s exports of wood-based products varied considerably as a function of the product category. China, Switzerland and the United States were the only countries to consistently feature among the EU’s ten most important markets for exports across the four main categories of wood-based products – as covered by Figure 3.6. As such, wood-based products did not diverge from overall trade patterns, as China, Switzerland and the United States were the three most important destination markets for EU exports of all goods.
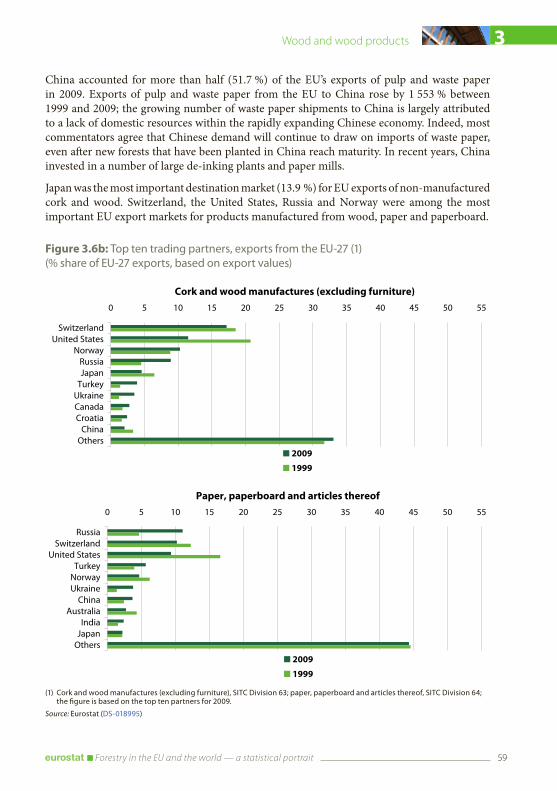
59 Forestry in the EU and the world — a statistical portrait
3Wood and wood products
Figure 3.6b: top ten trading partners, exports from the eu-27 (1)(% share of eu-27 exports, based on export values)
Cork and wood manufactures (excluding furniture)0 5 10 15 20 25 30 35 40 45 50 55
SwitzerlandUnited States
NorwayRussiaJapan
TurkeyUkraineCanadaCroatia
ChinaOthers
2009
1999
(1) cork and wood manufactures (excluding furniture), Sitc division 63; paper, paperboard and articles thereof, Sitc division 64; the figure is based on the top ten partners for 2009.
Source: eurostat (dS-018995)
Paper, paperboard and articles thereof0 5 10 15 20 25 30 35 40 45 50 55
RussiaSwitzerland
United StatesTurkeyNorwayUkraineChina
AustraliaIndiaJapanOthers
2009
1999
China accounted for more than half (51.7 %) of the EU’s exports of pulp and waste paper in 2009. Exports of pulp and waste paper from the EU to China rose by 1 553 % between 1999 and 2009; the growing number of waste paper shipments to China is largely attributed to a lack of domestic resources within the rapidly expanding Chinese economy. Indeed, most commentators agree that Chinese demand will continue to draw on imports of waste paper, even after new forests that have been planted in China reach maturity. In recent years, China invested in a number of large de-inking plants and paper mills.
Japan was the most important destination market (13.9 %) for EU exports of non-manufactured cork and wood. Switzerland, the United States, Russia and Norway were among the most important EU export markets for products manufactured from wood, paper and paperboard.

60 Forestry in the EU and the world — a statistical portrait
3 Wood and wood products
Figure 3.7a: top ten trading partners, imports into the eu-27 (1)(% share of eu-27 imports, based on import values)
Cork and wood0 5 10 15 20 25 30 35
RussiaUnited States
CanadaChinaBrazil
UkraineMalaysia
CameroonCroatia
IndonesiaOthers
2009
1999
(1) cork and wood, Sitc division 24; pulp and waste paper, Sitc division 25; the figure is based on the top ten partners for 2009.(2) uruguay, not available for 1999.
Source: eurostat (dS-018995)
Pulp and waste paper (2)0 5 10 15 20 25 30 35
BrazilUnited States
ChileCanadaNorway
UruguayRussia
South AfricaSwitzerlandPhilippines
Others
2009
1999
Extra-EU imports of wood-based products were valued at EUR 18 291 million and 42.5 million tonnes in 2009. The largest share, in value terms, was accounted for by articles of paper and paperboard (36.4 %), while the remaining three categories in Table 3.8 each had shares of between 19 % and 22 %.
The most important partners for EU imports of non-manufactured wood-based materials (cork and wood, pulp and waste paper) included the United States, Canada, Brazil and Russia. Outside of these main trading partners, there were a number of countries that were relatively specialised in supplying cork and wood or pulp and waste paper – for example, Indonesia, Malaysia, the Philippines, Chile and Cameroon, the latter having signed a FLEGT Voluntary Partnership Agreement with the aim of exporting only legal timber.

61 Forestry in the EU and the world — a statistical portrait
3Wood and wood products
Figure 3.7b: top ten trading partners, imports into the eu-27 (1)(% share of eu-27 imports, based on import values)
Cork and wood manufactures (excluding furniture)0 5 10 15 20 25 30 35
ChinaBrazil
RussiaSwitzerlandIndonesia
United StatesMalaysiaNorwayUkraineGabonOthers
2009
1999
(1) cork and wood manufactures (excluding furniture), Sitc division 63; paper, paperboard and articles thereof, Sitc division 64; the figure is based on the top ten partners for 2009.
Source: eurostat (dS-018995)
Paper, paperboard and articles thereof0 5 10 15 20 25 30 35
SwitzerlandChina
United StatesNorway
RussiaCanadaTurkey
BrazilIndonesia
South AfricaOthers
2009
1999
As of May 2011, eight tropical countries have signed or are about to sign a FLEGT agreement. The imports of wood and articles of wood from these countries made up 36 % in quantity and 35 % in value of all tropical wood imports (Chapter 44 of the Combined Nomenclature) to the EU in 2010.
There was a rapid expansion (142.6 %) in the value of EU imports of pulp and waste paper from Brazil between 1999 and 2009. A similar pattern was observed with respect to imports from China of downstream manufactured articles. China accounted for 34.6 % of the EU’s imports of articles of cork and wood, and 17.1 % of the EU’s imports of articles made from paper and paperboard. Between 1999 and 2009, the former grew overall (in value terms) by 265.7 %, while imports from China of articles made from paper and paperboard grew by 334.4 %.
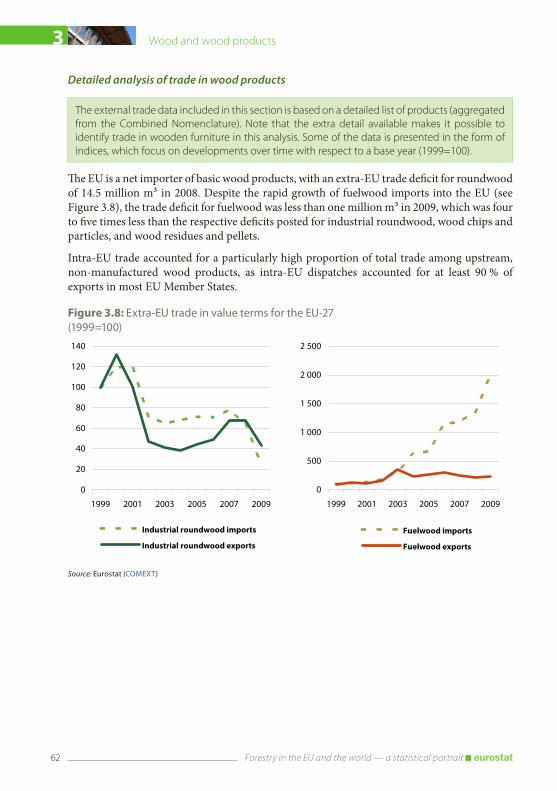
62 Forestry in the EU and the world — a statistical portrait
3 Wood and wood products
Figure 3.8: extra-eu trade in value terms for the eu-27(1999=100)
0
20
40
60
80
100
120
140
1999 2001 2003 2005 2007 2009
Industrial roundwood imports
Industrial roundwood exports
Source: eurostat (comeXt)
0
500
1 000
1 500
2 000
2 500
1999 2001 2003 2005 2007 2009
Fuelwood imports
Fuelwood exports
Detailed analysis of trade in wood products
The external trade data included in this section is based on a detailed list of products (aggregated from the Combined Nomenclature). Note that the extra detail available makes it possible to identify trade in wooden furniture in this analysis. Some of the data is presented in the form of indices, which focus on developments over time with respect to a base year (1999=100).
The EU is a net importer of basic wood products, with an extra-EU trade deficit for roundwood of 14.5 million m³ in 2008. Despite the rapid growth of fuelwood imports into the EU (see Figure 3.8), the trade deficit for fuelwood was less than one million m³ in 2009, which was four to five times less than the respective deficits posted for industrial roundwood, wood chips and particles, and wood residues and pellets.
Intra-EU trade accounted for a particularly high proportion of total trade among upstream, non-manufactured wood products, as intra-EU dispatches accounted for at least 90 % of exports in most EU Member States.

63 Forestry in the EU and the world — a statistical portrait
3Wood and wood products
Table 3.9: exports of roundwood and other basic wood products for the eu, efta and candidate countries, 2009(1 000 m³)
Total TropicalEU-27 (1) 3 807 2 996 1 861 1 135 58 92 787 219Belgium 719 700 441 259 17 18 281 579Bulgaria 278 205 92 113 : 73 48 26Czech Republic 4 191 4 074 3 822 147 0 117 496 463Denmark 1 075 1 021 480 541 39 53 143 32Germany 4 336 4 205 3 121 1 084 8 131 4 466 505Estonia 1 275 1 080 581 499 0 195 230 583Ireland 285 281 271 10 0 5 11 45Greece 115 113 111 1 0 2 0 17Spain 868 807 208 599 1 61 18 177France 4 513 4 023 2 718 1 305 3 490 409 1 004Italy 27 27 18 8 2 1 3 10Cyprus 0 0 0 0 0 0 0 0Latvia 3 546 2 500 1 333 1 167 0 1 045 1 675 762Lithuania 778 673 399 274 0 105 69 457Luxembourg 298 298 261 37 0 0 176 184Hungary 1 019 799 384 415 0 220 77 61Malta 0 0 0 0 0 0 0 0Netherlands 440 388 323 65 0 52 168 400Austria 805 729 648 80 0 77 200 649Poland 1 089 971 899 72 0 118 90 557Portugal 617 602 20 582 2 14 47 575Romania 198 141 42 99 0 57 26 196Slovenia 767 507 306 201 0 260 178 336Slovakia 2 686 2 538 2 116 422 0 147 90 153Finland 539 534 505 29 0 6 309 143Sweden 1 212 1 177 1 165 12 0 35 325 214United Kingdom 410 345 341 4 0 65 186 73Iceland (2) 0 0 0 0 0 0 0 0Liechtenstein 8 7 6 1 0 1 0 0Norway 873 868 843 25 2 5 104 392Switzerland 979 954 575 379 0 25 402 720Croatia 752 440 17 423 0 312 124 336FYR of Macedonia 1 1 0 1 0 0 0 0Turkey 2 2 1 1 0 0 0 1
Wood chips
& particles
Wood residues & pellets
Roundwood
Non-coniferousIndustrial roundwood
TotalTotal
Conifer-ous
Fuel-wood
(1) extra-eu trade: roundwood, non-coniferous tropical roundwood and fuelwood, 2008.(2) 2008.
Source: eurostat (for_basic)

64 Forestry in the EU and the world — a statistical portrait
3 Wood and wood products
Table 3.10: imports of roundwood and other basic wood products for the eu, efta and candidate countries, 2009(1 000 m³)
Total TropicalEU-27 (1) 18 313 8 116 3 956 4 160 732 994 4 713 4 656Belgium 3 099 3 031 1 424 1 606 27 68 475 3 729Bulgaria 45 42 11 30 : 3 1 2Czech Republic 1 575 1 553 1 758 137 14 22 158 86Denmark 517 291 157 134 2 226 438 1 298Germany 7 477 7 199 6 831 368 35 278 1 399 1 861Estonia 285 264 167 97 0 21 28 94Ireland 194 192 167 25 0 2 22 12Greece 1 334 1 136 941 194 13 198 3 6Spain 1 871 1 868 865 1 003 31 3 542 38France 1 486 1 453 1 085 369 161 32 378 604Italy 3 657 2 703 1 337 1 366 47 954 1 146 1 417Cyprus 1 0 0 0 0 1 0 3Latvia 127 120 51 69 0 6 8 19Lithuania 208 163 97 67 0 44 225 212Luxembourg 718 703 584 119 2 14 519 46Hungary 305 218 152 67 0 86 74 96Malta 0 0 0 0 0 0 0 18Netherlands 261 229 207 22 7 32 298 1 772Austria 8 600 8 036 6 924 1 112 0 564 1 173 792Poland 1 889 1 874 751 1 123 1 15 130 275Portugal 473 473 103 369 37 0 653 37Romania 395 380 365 16 0 14 1 3Slovenia 261 163 59 105 3 98 125 318Slovakia 565 506 204 302 16 59 2 16Finland 4 650 3 761 1 962 1 799 0 888 2 820 624Sweden 4 712 4 175 2 020 2 155 1 537 1 500 1 587United Kingdom 318 303 236 68 8 15 278 108Iceland (2) 2 1 1 0 0 0 4 2Liechtenstein 0 0 0 0 0 0 0 0Norway 1 050 933 929 4 1 117 974 251Switzerland 313 300 266 34 1 12 392 195Croatia 11 7 6 1 0 4 2 95FYR of Macedonia 125 83 16 67 0 42 0 0Turkey 983 922 794 128 60 61 2 468 1
Roundwood Wood chips
& particles
Wood residues & pellets
TotalIndustrial roundwood
Fuel-woodTotal
Conifer-ous
Non-coniferous
(1) extra-eu trade: roundwood, non-coniferous tropical roundwood and fuelwood, 2008.(2) 2008.
Source: eurostat (for_basic)

65 Forestry in the EU and the world — a statistical portrait
3Wood and wood products
Table 3.11: intra-eu dispatches of roundwood for the eu(1 000 m³)
Belgium 1 172 1 150 22 92.3 478 460 18 66.5Bulgaria 141 115 27 62.3 178 121 57 63.9Czech Republic 2 508 2 336 172 89.6 4 189 4 072 117 100.0Denmark 143 142 1 49.3 838 785 53 78.0Germany 3 578 3 532 46 77.8 3 633 3 507 127 83.8Estonia 3 132 3 058 74 78.0 1 193 1 025 168 93.6Ireland 176 176 1 100.0 285 280 5 99.9Greece 232 3 229 99.9 115 112 2 99.9Spain 323 260 63 83.4 817 760 57 94.1France 2 859 2 859 : 92.4 3 973 3 490 483 88.0Italy 5 5 0 34.8 20 20 0 72.9Cyprus 0 0 0 : 0 0 0 :Latvia 3 614 2 844 770 96.3 3 506 2 468 1 038 98.9Lithuania 223 222 2 23.8 775 671 104 99.6Luxembourg 290 290 0 99.5 298 298 0 100.0Hungary 1 186 937 249 89.1 1 018 798 220 99.9Malta : : 0 : 0 0 0 :Netherlands 287 259 28 98.6 434 382 52 98.5Austria 999 985 11 94.8 767 691 76 95.3Poland 154 130 24 39.4 1 078 964 114 99.0Portugal 555 541 14 99.6 550 536 14 89.2Romania 600 599 1 99.4 96 38 57 48.2Slovenia 170 111 59 72.6 751 491 260 98.0Slovakia 884 852 32 71.8 2 683 2 536 147 99.9Finland 526 519 7 68.5 424 424 0 78.5Sweden 96 93 3 7.2 508 501 6 41.9United Kingdom 162 30 133 97.6 377 312 65 91.9
Roundwood, 2009Roundwood, 1999Intra-EU share of
total exports
(%)
Intra-EU share of
total exports
(%)
TotalFuel-wood
Industrial round-wood
Fuel-wood
TotalIndustrial
round-wood
Source: eurostat (for_basic)

66 Forestry in the EU and the world — a statistical portrait
3 Wood and wood products
Figure 3.9: extra-eu trade in value terms for the eu-27(1999=100)
20
40
60
80
100
120
140
160
1999 2001 2003 2005 2007 2009
Sawnwood exports
Sawnwood imports
Source: eurostat (comeXt)
20
40
60
80
100
120
140
160
1999 2001 2003 2005 2007 2009
Wood-based panels exports
Wood-based panels imports
EU external trade for sawnwood and wood-based panels saw exports grow steadily up to 2007 before tailing off in the face of the global financial and economic crisis, while imports remained below their 1999 level for practically the whole of the period under consideration.
As a result, the EU’s trade balance for sawnwood switched from a considerable deficit in 1999 to a modest trade surplus by 2009. A deficit was also recorded at the start of the period for wood-based panels (between 1999 and 2001), before relatively small surpluses were recorded thereafter (punctuated by a deficit in 2007 that was driven by a rapid increase in wood-based panel imports that year).
The EU recorded a trade surplus for the majority of sawnwood and wood-based panel products in 2009. This was particularly true for sawnwood, particle board and fibreboard, whereas trade deficits were recorded for veneer sheets, and in particular, plywood.
Sweden was the largest exporter of sawnwood (12.3 million m³ in 2009) among the EU Member States; Germany, Austria and Finland were the next largest exporters. Germany and Austria were also among the leading exporters of wood-based panels, and were joined by Spain and Belgium.
Intra-EU trade generally accounted for the majority of the wood-based panel exports made by each of the Member States in 2009. Extra-EU trade relations were rather limited and the EU’s main trading partners tended to be found around the perimeter of the EU (for example, Turkey or the Ukraine). In turn, the EU Member States with the lowest shares of intra-EU trade in total exports tended to be those on the periphery (for example, Greece, Romania and Slovenia).

67 Forestry in the EU and the world — a statistical portrait
3Wood and wood products
Table 3.12: exports of sawnwood and panels for the eu, efta and candidate countries, 2009(1 000 m³)
Total OSB TotalHard-board
MDF
EU-27 (1) 14 262 7 353 181 476 3 650 726 3 047 755 2 090Belgium 1 639 2 078 19 379 1 210 175 470 95 370Bulgaria 195 721 11 24 577 133 110 82 28Czech Republic 1 871 941 25 93 717 324 106 7 57Denmark 928 186 23 89 54 1 20 5 7Germany 9 810 6 496 109 256 4 063 577 2 069 786 1 202Estonia 598 196 19 39 104 0 35 2 2Ireland 564 580 0 1 186 169 393 9 384Greece 229 620 111 34 423 2 53 1 51Spain 111 2 082 39 122 760 4 1 160 45 973France 815 1 972 14 174 1 244 115 540 145 344Italy 194 798 30 148 279 29 341 10 312Cyprus 0 0 0 0 0 0 0 0 0Latvia 1 613 664 5 165 491 335 3 1 1Lithuania 429 217 54 7 93 8 63 24 8Luxembourg 84 449 0 1 211 211 237 53 184Hungary 161 339 20 25 186 3 108 26 82Malta 0 0 0 0 0 0 0 0 0Netherlands 292 301 6 49 151 6 95 2 90Austria 5 799 2 569 23 278 1 701 7 567 67 496Poland 417 1 898 18 117 567 237 1 197 286 434Portugal 235 707 25 40 279 1 364 13 301Romania 2 259 1 100 35 40 545 55 479 78 395Slovenia 1 069 293 20 78 92 1 103 8 94Slovakia 405 477 4 14 324 2 134 0 68Finland 5 109 818 44 683 49 0 43 33 2Sweden 12 271 282 30 48 70 1 134 13 116United Kingdom 203 451 3 66 246 139 136 18 112Iceland (2) 1 0 0 0 0 0 0 0 0Liechtenstein 0 0 0 0 0 0 0 0 0Norway 463 187 0 1 141 0 45 6 24Switzerland 469 6 2 2 : 0 : : :Montenegro 52 1 0 0 1 0 0 0 0Croatia 447 117 14 5 96 1 2 1 0FYR of Macedonia 19 3 0 0 2 1 0 0 0Turkey 39 783 18 21 254 5 491 23 456
Wood-based panelsSawn-wood total
TotalVeneer sheets
Ply-wood
Particle board Fibreboard
(1) extra-eu trade.(2) 2008.
Source: eurostat (for_swpan)

68 Forestry in the EU and the world — a statistical portrait
3 Wood and wood products
Table 3.13: imports of sawnwood and panels for the eu, efta and candidate countries, 2009(1 000 m³)
Total OSB TotalHard-board
MDF
EU-27 (1) 8 034 5 924 886 3 553 868 48 617 151 341Belgium 2 315 1 545 28 530 390 105 597 160 425Bulgaria 24 503 47 69 268 23 118 18 94Czech Republic 614 609 23 58 252 48 276 121 126Denmark 1 248 1 560 360 487 401 33 313 30 212Germany 5 649 4 599 156 1 038 2 900 280 506 161 270Estonia 499 130 3 51 31 15 46 30 12Ireland 232 181 9 64 60 5 49 7 42Greece 21 061 9 026 3 095 3 285 2 515 1 263 131 15 97Spain 1 509 874 63 64 308 3 440 54 364France 3 143 2 043 79 416 657 64 892 155 611Italy 5 567 2 298 191 417 550 152 1 140 99 771Cyprus 63 96 2 6 68 12 20 2 16Latvia 113 123 52 33 27 3 11 3 6Lithuania 209 372 15 21 202 44 134 35 59Luxembourg 1 238 538 18 51 430 395 38 7 7Hungary 524 402 9 40 271 53 83 40 37Malta 16 32 0 8 12 0 11 2 6Netherlands 2 575 1 495 34 457 573 48 431 68 284Austria 1 776 699 42 116 402 127 140 32 89Poland 651 1 494 33 120 979 237 363 156 202Portugal 129 629 30 76 125 3 398 24 358Romania 50 631 11 13 311 98 296 80 196Slovenia 1 013 230 10 18 153 10 49 15 30Slovakia 75 435 15 47 231 35 141 17 66Finland 521 333 21 91 61 3 160 33 101Sweden 357 867 16 144 439 75 268 101 130United Kingdom 5 240 2 500 16 1 164 632 198 688 103 560Iceland (2) 86 17 0 6 7 5 3 1 3Liechtenstein 0 0 0 0 0 0 0 0 0Norway 911 308 4 51 86 50 167 19 140Switzerland 436 323 5 53 : 65 : : :Montenegro 4 27 0 2 16 1 9 0 5Croatia 258 230 6 22 146 27 56 21 0FYR of Macedonia 218 81 0 2 60 4 19 8 4Turkey 457 690 22 128 244 154 297 125 172
Sawn-wood total
Wood-based panels
TotalVeneer sheets
Ply-wood
Particle board Fibreboard
(1) extra-eu trade.(2) 2008.
Source: eurostat (for_swpan)

69 Forestry in the EU and the world — a statistical portrait
3Wood and wood products
Table 3.14: intra-eu dispatches of sawnwood and wood-based panels for the eu
Sawn-wood
Wood-based panels
Sawn-wood
Wood-based panels
Sawn-wood
Wood-based panels
Sawn-wood
Wood-based panels
Belgium 983 2 448 98.4 89.7 1 471 1 886 89.8 90.8Bulgaria 127 110 46.0 64.9 133 178 68.3 24.7Czech Republic 1 329 291 86.1 46.7 1 385 733 74.0 77.9Denmark 131 160 74.9 77.3 752 83 81.1 44.8Germany 1 969 1 875 82.6 62.1 8 012 5 008 81.7 77.1Estonia 687 288 76.4 75.5 441 155 73.7 79.1Ireland 234 465 99.9 90.1 563 542 100.0 93.5Greece : 25 : : 101 157 44.1 25.3Spain 28 206 35.7 25.1 78 1 411 70.1 67.8France 1 064 2 094 85.3 90.4 536 1 865 65.8 94.6Italy 62 468 29.4 53.5 86 409 44.5 51.2Cyprus 8 : 97.6 : 0 0 : :Latvia 2 582 153 91.6 60.0 1 206 501 74.8 75.5Lithuania 640 47 89.0 33.9 385 149 89.6 68.9Luxembourg 50 95 99.9 67.7 83 448 99.4 99.8Hungary 265 56 87.5 23.1 151 224 93.4 66.2Malta : : : : 0 0 : :Netherlands 376 268 88.1 93.1 281 284 96.3 94.3Austria 4 473 1 274 75.9 75.3 4 896 1 938 84.4 75.5Poland 865 : 84.0 : 407 1 239 97.6 65.3Portugal 296 615 87.5 91.6 200 465 85.1 65.8Romania 1 911 80 99.7 80.2 233 430 10.3 39.1Slovenia : : : : 102 172 9.6 58.7Slovakia 352 100 33.2 57.1 392 352 96.7 73.8Finland 5 513 1 089 66.5 85.4 2 489 685 48.7 83.7Sweden 8 283 285 74.7 58.5 8 465 169 69.0 60.1United Kingdom 147 367 96.5 95.8 190 395 93.7 87.5
1999 2009
(1 000 m�) (1 000 m�)Intra-EU trade, share of totalexports (%)
Intra-EU trade,share of totalexports (%)
Source: eurostat (for_swpan)

70 Forestry in the EU and the world — a statistical portrait
3 Wood and wood products
Figure 3.10: extra-eu trade in value terms for the eu-27(1999=100)
50
75
100
125
150
175
200
1999 2001 2003 2005 2007 2009
Woodpulp exports
Woodpulp imports
Source: eurostat (comeXt)
50
75
100
125
150
175
200
1999 2001 2003 2005 2007 2009
Paper and paperboard exports
Paper and paperboard imports
The development of EU external trade in pulp, paper and paperboard followed the general economic cycle, with a peak in 2000/2001, followed by two or three years of relatively depressed activity, renewed growth through to 2007 and then a downward movement associated with the global financial and economic crisis. Demand for pulp and paper products tends to be cyclical, being linked to advertising/marketing activity and to the demand for packaging materials.
The EU ran a trade deficit for woodpulp and a trade surplus for paper and paperboard throughout the last decade. The deficit for woodpulp fluctuated with overall economic activity, widening during periods of economic growth and contracting when economic growth slowed; it stood at 6.4 million tonnes in 2008. The EU trade surplus for paper and paperboard also fluctuated with global economic fortunes, with an increase in the surplus during times of economic growth; the trade balance for paper and paperboard stood at 7.4 million tonnes in 2009. The surplus for paper and paperboard products was largely due to printing and writing papers and packaging materials.
Sweden, Finland, Portugal and Germany were the leading exporters of woodpulp among the EU Member States in 2009, with each of these countries reporting in excess of one million tonnes of exports (to intra- and extra-EU partners). Germany had the highest quantity of exports for paper and paperboard in 2009, at 12.3 million tonnes, while Sweden and Finland each exported in excess of 9 million tonnes of paper and paperboard.
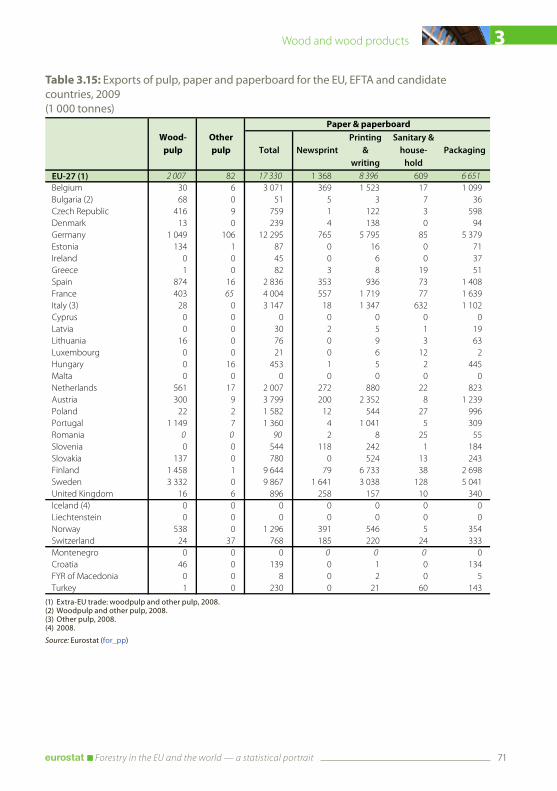
71 Forestry in the EU and the world — a statistical portrait
3Wood and wood products
Table 3.15: exports of pulp, paper and paperboard for the eu, efta and candidate countries, 2009(1 000 tonnes)
EU-27 (1) 2 007 82 17 330 1 368 8 396 609 6 651Belgium 30 6 3 071 369 1 523 17 1 099Bulgaria (2) 68 0 51 5 3 7 36Czech Republic 416 9 759 1 122 3 598Denmark 13 0 239 4 138 0 94Germany 1 049 106 12 295 765 5 795 85 5 379Estonia 134 1 87 0 16 0 71Ireland 0 0 45 0 6 0 37Greece 1 0 82 3 8 19 51Spain 874 16 2 836 353 936 73 1 408France 403 65 4 004 557 1 719 77 1 639Italy (3) 28 0 3 147 18 1 347 632 1 102Cyprus 0 0 0 0 0 0 0Latvia 0 0 30 2 5 1 19Lithuania 16 0 76 0 9 3 63Luxembourg 0 0 21 0 6 12 2Hungary 0 16 453 1 5 2 445Malta 0 0 0 0 0 0 0Netherlands 561 17 2 007 272 880 22 823Austria 300 9 3 799 200 2 352 8 1 239Poland 22 2 1 582 12 544 27 996Portugal 1 149 7 1 360 4 1 041 5 309Romania 0 0 90 2 8 25 55Slovenia 0 0 544 118 242 1 184Slovakia 137 0 780 0 524 13 243Finland 1 458 1 9 644 79 6 733 38 2 698Sweden 3 332 0 9 867 1 641 3 038 128 5 041United Kingdom 16 6 896 258 157 10 340Iceland (4) 0 0 0 0 0 0 0Liechtenstein 0 0 0 0 0 0 0Norway 538 0 1 296 391 546 5 354Switzerland 24 37 768 185 220 24 333Montenegro 0 0 0 0 0 0 0Croatia 46 0 139 0 1 0 134FYR of Macedonia 0 0 8 0 2 0 5Turkey 1 0 230 0 21 60 143
Paper & paperboardWood-
pulpOtherpulp Packaging
Sanitary & house-
hold
Printing &
writing NewsprintTotal
(1) extra-eu trade: woodpulp and other pulp, 2008.(2) Woodpulp and other pulp, 2008.(3) other pulp, 2008.(4) 2008.
Source: eurostat (for_pp)

72 Forestry in the EU and the world — a statistical portrait
3 Wood and wood products
Table 3.16: imports of pulp, paper and paperboard for the eu, efta and candidate countries, 2009(1 000 tonnes)
EU-27 (1) 8 400 : 9 904 1 874 3 525 226 4 151Belgium 783 9 3 710 250 1 680 34 1 695Bulgaria (2) 14 0 256 46 78 15 115Czech Republic 172 3 1 206 113 447 12 627Denmark 66 8 981 219 337 2 414Germany 4 543 46 9 742 1 020 4 416 173 3 960Estonia 0 0 120 8 70 3 36Ireland 32 0 379 83 110 25 138Greece 132 1 722 118 306 27 266Spain 923 3 3 878 281 1 345 67 2 108France 1 259 55 5 033 375 2 729 105 1 788Italy (3) 3 001 7 4 578 490 1 740 68 2 216Cyprus 0 0 67 11 26 9 20Latvia 0 0 109 13 38 2 56Lithuania 19 0 148 12 62 0 71Luxembourg 0 0 168 12 87 1 66Hungary 91 1 697 99 256 60 279Malta 0 0 24 3 14 2 5Netherlands 921 76 2 923 313 1 252 27 1 264Austria 609 21 1 145 109 510 13 496Poland 648 13 2 714 98 969 51 1 579Portugal 92 0 804 90 239 32 436Romania 67 4 468 69 193 13 184Slovenia 222 0 225 9 114 2 99Slovakia 156 0 372 27 172 9 148Finland 351 2 408 76 87 4 238Sweden 365 10 866 34 346 4 473United Kingdom 912 28 7 018 1 208 3 358 338 1 963Iceland (4) 4 45 33 8 14 1 9Liechtenstein 0 0 0 0 0 0 0Norway 58 1 432 73 217 2 135Switzerland 445 9 875 119 422 7 320Montenegro 0 0 7 3 2 0 1Croatia (3) 0 1 236 51 107 4 68FYR of Macedonia (3) 1 0 62 6 18 3 29Turkey (3) 618 2 2 170 549 541 9 1 031
Wood-pulp
Otherpulp
Paper & paperboard
TotalSanitary &
house-hold
NewsprintPrinting
& writing
Packaging
(1) extra-eu trade: woodpulp, 2008.(2) Woodpulp and other pulp, 2008.(3) other pulp, 2008.(4) 2008.
Source: eurostat (for_pp)

73 Forestry in the EU and the world — a statistical portrait
3Wood and wood products
Table 3.17: intra-eu dispatches of woodpulp, paper and paperboard for the eu(1 000 m³)
Wood-pulp
Paper &paper-board
Wood-pulp
Paper &paper-board
Wood-pulp
Paper &paper-board
Wood-pulp
Paper &paper-board
Belgium 437 2 071 95.4 90.6 14 2 332 47.4 75.9Bulgaria 39 2 65.9 5.9 : 16 : 31.7Czech Republic 155 176 60.1 37.8 359 638 86.2 84.1Denmark 1 209 100.0 82.3 13 224 99.2 93.8Germany 214 5 426 64.7 67.8 754 9 686 71.9 78.8Estonia 0 16 : 31.1 76 33 57.1 37.3Ireland 1 62 68.0 93.7 0 44 100.0 97.4Greece 1 8 94.9 18.4 0 51 25.4 62.6Spain 585 901 90.4 70.4 779 1 995 89.1 70.3France 323 3 774 84.1 81.6 330 3 308 82.0 82.6Italy 6 1 141 33.3 55.5 4 929 12.9 29.5Cyprus 0 1 : 45.2 0 0 : 100.0Latvia : : : : 0 25 100.0 84.4Lithuania 4 : 98.5 : 16 30 100.0 39.8Luxembourg 0 21 : 84.1 0 19 : 94.8Hungary 0 138 100.0 59.2 0 373 : 82.5Malta 0 : : : 0 0 : 100.0Netherlands 341 2 135 96.9 82.6 387 1 386 69.0 69.0Austria 260 2 314 67.4 71.0 270 2 833 90.0 74.6Poland 35 319 87.3 50.2 21 1 201 97.5 75.9Portugal 984 620 85.9 90.6 860 933 74.9 68.6Romania 9 65 92.5 78.5 0 78 : 86.6Slovenia 40 55 73.8 14.8 0 312 80.0 57.3Slovakia 90 : 70.9 : 122 682 88.6 87.4Finland 1 546 7 796 82.1 69.6 905 5 276 62.1 54.7Sweden 2 307 6 835 77.7 77.6 2 514 7 429 75.5 75.3United Kingdom 5 1 372 17.5 77.1 13 601 79.7 67.1
1999 2009
(1 000 tonnes)Intra-EU trade,share of totalexports (%)
(1 000 tonnes)Intra-EU trade, share of totalexports (%)
Source: eurostat (for_swpan)

74 Forestry in the EU and the world — a statistical portrait
3 Wood and wood products
Table 3.18: exports of secondary wood products for the eu, efta and candidate countries, 2009(eur million)
TotalFurther
processed sawnwood
Wrapping& packing
equip.
Domestic/decorative
use
Builder's joinery & carpentry
FurniturePre-
fabricated buildings
Belgium 1 178 55 105 51 116 729 71Bulgaria 91 6 8 2 4 69 1Czech Republic 691 61 120 13 148 271 33Denmark 1 534 16 18 12 393 1 053 9Germany 5 271 177 169 71 763 3 691 112Estonia 456 35 21 4 137 154 91Ireland 45 0 5 1 13 24 2Greece 35 0 3 1 5 23 0Spain 843 47 69 23 117 526 5France 1 561 39 304 41 115 989 8Italy 3 300 116 70 57 294 2 645 19Cyprus 5 0 0 0 1 3 0Latvia 323 24 53 2 97 116 11Lithuania 593 12 40 6 95 387 37Luxembourg 23 5 7 0 4 6 0Hungary 421 14 35 0 112 237 12Malta 5 0 0 0 1 4 0Netherlands 732 39 60 37 94 389 45Austria 1 564 97 30 13 840 498 38Poland 3 851 134 199 47 486 2 664 29Portugal 402 13 24 1 81 278 2Romania 755 17 20 17 52 564 24Slovenia 306 7 7 4 61 183 15Slovakia 648 25 32 5 109 452 5Finland 421 33 10 1 179 72 121Sweden 134 5 3 2 26 86 8United Kingdom 457 18 23 18 52 311 15Iceland (1) : 0 0 : 0 0 :Norway 259 3 3 1 71 171 5Switzerland 289 5 7 21 58 167 17Croatia 179 29 5 0 26 86 0FYR of Macedonia 17 0 1 0 1 14 0Turkey 629 16 20 3 70 370 1
Secondary wood products
(1) 2008.
Source: eurostat (for_secwp)
Tables 3.18 to 3.21 cover external trade for a number of downstream, secondary wood and paper products. The main secondary wood products (in value terms) include wooden furniture and builder’s joinery and carpentry, while the highest levels of trade among secondary paper products were recorded for printed articles, household and sanitary paper, and packaging cartons and boxes.

75 Forestry in the EU and the world — a statistical portrait
3Wood and wood products
Table 3.19: imports of secondary wood products for the eu, efta and candidate countries, 2009(eur million)
TotalFurther
processed sawnwood
Wrapping& packing
equip.
Domestic/decorative
use
Builder's joinery & carpentry
FurniturePre-
fabricated buildings
Belgium 1 777 92 129 58 197 1 182 15Bulgaria 95 5 6 1 14 64 0Czech Republic 507 46 26 12 80 314 7Denmark 969 20 37 21 288 530 11Germany 5 060 166 256 188 530 3 327 85Estonia 56 5 6 2 12 27 1Ireland 302 16 12 21 68 177 5Greece 429 24 15 14 40 315 4Spain 1 181 53 70 65 175 725 10France 4 116 162 199 116 379 2 878 81Italy 1 314 170 90 58 405 414 38Cyprus 106 2 0 2 11 85 1Latvia 85 3 5 2 20 52 1Lithuania 71 7 6 2 17 35 1Luxembourg 229 10 9 3 53 138 8Hungary 214 14 23 6 35 118 2Malta 38 0 1 1 2 33 0Netherlands 1 641 108 77 63 185 1 068 22Austria 1 512 64 66 28 217 1 007 31Poland 457 39 34 15 80 255 2Portugal 256 12 12 6 41 178 6Romania 224 17 16 4 56 118 1Slovenia 141 11 9 1 27 79 0Slovakia 230 17 25 3 39 134 3Finland 336 14 11 11 45 218 25Sweden 85 2 2 3 15 58 1United Kingdom 3 691 152 100 113 486 2 602 38Iceland (1) : 3 1 : 1 1 :Norway 1 051 48 31 17 255 544 115Switzerland 1 791 65 53 58 372 1 118 161Croatia 105 14 9 3 43 16 4FYR of Macedonia 25 4 1 0 4 15 0Turkey 213 6 3 9 24 144 0
Secondary wood products
(1) 2008.
Source: eurostat (for_secwp)
Poland and Italy recorded by far the largest trade surpluses for secondary wood products in 2009, at EUR 3 394 million and EUR 1 986 million respectively. Indeed, the Italian surplus was 3.5 times as high as the next largest surplus that was recorded in Denmark. In each of these three Member States (Poland, Italy and Denmark), wooden furniture accounted for the vast majority of the trade surplus. At the other end of the range, France (EUR -2 554 million) and the United Kingdom (EUR -3 234 million) recorded the largest trade deficits, largely as a result of considerable imports of wooden furniture.

76 Forestry in the EU and the world — a statistical portrait
3 Wood and wood products
Table 3.20: exports of secondary paper products for the eu, efta and candidate countries, 2009(eur million)
TotalCompo-
site papers & board
Special coated papers
Carbon & copying papers
House-hold &
sanitary papers
Pack-aging
cartons & boxes
Printedarticles
Other
Belgium 2 759 3 206 35 681 474 1 028 511Bulgaria 41 0 0 0 7 15 10 6Czech Republic 1 510 1 26 1 363 201 900 620Denmark 690 0 46 0 154 182 213 92Germany 10 844 63 1 190 35 2 055 2 106 3 965 2 099Estonia 97 0 1 0 6 6 56 19Ireland 184 0 0 0 5 43 123 56Greece 171 0 7 0 27 19 100 27Spain 2 020 16 286 41 357 304 760 157France 3 544 17 454 4 694 415 1 537 502Italy 3 647 15 124 2 816 744 1 222 615Cyprus 10 0 0 0 3 1 5 0Latvia 74 0 8 0 4 20 37 6Lithuania 158 0 5 0 18 39 47 12Luxembourg 343 0 286 0 1 2 42 13Hungary 442 0 10 0 241 83 108 48Malta 98 0 0 0 0 0 97 90Netherlands 2 884 250 75 12 668 552 967 487Austria 1 238 1 59 0 142 484 414 303Poland 1 984 1 224 2 807 307 480 180Portugal 268 2 17 0 62 88 55 15Romania 92 1 1 0 20 21 30 21Slovenia 259 0 23 1 75 30 109 59Slovakia 552 0 2 1 299 47 167 68Finland 602 25 152 0 105 22 171 72Sweden 109 2 5 0 53 22 23 13United Kingdom 4 257 13 289 6 367 296 2 719 404Iceland (1) 2 0 0 0 0 1 0 0Norway 122 0 1 0 9 24 50 23Switzerland 1 570 18 103 0 116 216 513 603Croatia 62 0 11 0 1 29 47 14FYR of Macedonia 5 0 0 0 1 4 3 2Turkey 143 0 3 0 64 45 15 8
Secondary paper products
(1) 2008.
Source: eurostat (for_secpp)
Germany was the leading exporter (EUR 10 844 million) of secondary paper products among the EU Member States, and also recorded the highest trade surplus (EUR 6 104 million) for these products in 2009. There was also a relatively high trade surplus in Italy (EUR 2 202 million). Trade deficits for secondary paper products were registered in 12 of the Member States, with the largest being recorded in France (EUR -1 649 million).

77 Forestry in the EU and the world — a statistical portrait
3Wood and wood products
Table 3.21: imports of secondary paper products for the eu, efta and candidate countries, 2009(eur million)
TotalCompo-
site papers & board
Special coated papers
Carbon & copying papers
House-hold &
sanitary papers
Pack-aging
cartons & boxes
Printedarticles
Other
Belgium 2 502 40 158 5 513 503 917 266Bulgaria 158 1 15 0 44 30 29 12Czech Republic 1 208 8 62 1 272 202 651 440Denmark 1 051 5 113 5 234 184 398 221Germany 4 740 47 412 6 1 046 791 1 750 790Estonia 91 1 4 0 32 17 22 11Ireland 732 1 3 3 108 140 394 77Greece 606 3 37 4 225 92 173 55Spain 1 766 13 207 15 383 339 555 147France 5 193 16 408 14 1 052 1 122 1 861 718Italy 1 445 15 147 21 250 246 545 221Cyprus 93 0 2 0 24 9 46 6Latvia 123 2 12 0 47 23 37 10Lithuania 190 1 15 1 49 49 21 10Luxembourg 266 0 67 0 34 32 104 19Hungary 459 3 27 6 153 123 141 63Malta 44 0 1 0 12 8 18 6Netherlands 2 116 7 110 10 339 524 724 319Austria 1 681 5 94 2 252 245 848 262Poland 1 100 17 156 6 236 284 215 96Portugal 553 4 42 3 214 57 163 39Romania 490 1 25 2 106 125 135 65Slovenia 190 1 15 1 61 38 48 25Slovakia 386 3 21 2 86 109 104 35Finland 459 4 44 1 97 80 179 53Sweden 83 1 7 0 27 14 29 12United Kingdom 4 091 37 269 30 671 588 1 808 633Iceland (1) 50 0 2 0 13 14 15 4Norway 919 5 23 1 273 120 378 173Switzerland 2 768 8 93 2 305 366 1 282 712Croatia 188 2 15 1 120 26 59 26FYR of Macedonia 40 0 3 0 18 13 8 4Turkey 160 2 54 4 17 22 58 31
Secondary paper products
(1) 2008.
Source: eurostat (for_secpp)

78 Forestry in the EU and the world — a statistical portrait
3 Wood and wood products
Production of wood products in the world
Global roundwood production was 3 275 million m³ in 2009, which was 2.0 % less than a decade before. There was a 7.7 % reduction in the world’s industrial roundwood production between 1999 and 2009, while the output of fuelwood increased by 3.0 % over the same period.
Asia accounted for the highest share (30.3 %) of the world’s roundwood production in 2009, although its share was 0.7 points lower than in 1999. The relative importance of roundwood production in Africa and South America grew during the last decade.
The world’s sawnwood production totalled 362 million m³ in 2009, which was 6.7 % lower than a decade before. Europe accounted for more than one third (35.2 %) of global output in 2009, while production in China and India doubled between 1999 and 2009 (albeit from relatively low levels).
The emergence of China as a global producer was more evident when studying the production of wood-based panels, as China’s share of the world’s output reached 36.3 % in 2009, some 27.7 points higher than a decade before; production (in volume terms) growing more than six-fold during the period under consideration.
Northern and Central America produced more than half (51.5 %) of the world’s woodpulp in 1999; however, this region’s share of global production fell to 40.2 % by 2009. In contrast, the relative contributions of Brazil and China doubled, such that they produced 8.4 % and 4.4 % of the world’s woodpulp by 2009.
Table 3.22: Production of roundwood and fuelwood in the world(million m³)
Conifer-ous
Non-conif.
1999 2009 1999 2009 2009 2009 1999 2009World 3 341.3 3 275.1 1 543.9 1 424.4 852.3 572.1 1 797.5 1 850.7Europe 574.1 615.4 435.9 469.0 358.7 110.3 138.1 146.5
EU-27 374.9 392.9 301.2 309.7 242.5 67.2 73.8 83.2 Russia 143.6 151.4 94.6 112.9 85.3 27.6 49.0 38.5
Africa 596.4 674.1 68.0 71.6 11.5 60.1 528.4 602.4 Asia 1 034.4 991.3 227.5 225.6 82.2 143.4 806.9 765.6
China 331.8 285.5 100.0 93.1 59.6 33.5 231.8 192.4 India 296.6 331.7 19.2 23.2 2.9 20.3 277.4 308.5 Indonesia 130.2 98.7 39.8 36.4 0.2 36.1 90.4 62.3
North & Central America 755.3 548.0 626.6 420.5 287.5 133.1 128.7 127.5 Canada 193.9 107.3 191.0 105.1 88.2 16.9 2.9 2.2 United States 469.3 344.8 423.3 304.4 192.5 111.9 46.0 40.4
Oceania 55.6 61.0 42.9 50.3 33.3 17.0 12.7 10.7 Australia 27.7 30.1 20.8 25.3 13.0 12.3 6.8 4.8
South America 325.6 385.4 142.9 187.4 79.2 108.2 182.6 198.0 Brazil 231.6 264.1 100.4 122.2 45.6 76.6 131.2 142.0
RoundwoodIndustrial roundwood
FuelwoodTotal Total
Source: faoStat (http://faostat.fao.org/site/626/default.aspx#ancor)

79 Forestry in the EU and the world — a statistical portrait
3Wood and wood products
Table 3.23: Production of sawnwood and panels in the world(million m³)
1999 2009 1999 2009 1999 2009World 388.5 362.4 171.4 259.9 30.7 75.5Europe 127.9 127.4 57.4 75.9 11.7 20.4
EU-27 94.1 92.2 48.6 57.2 10.1 14.7Russia 19.1 19.0 4.1 8.6 0.8 1.6
Africa 7.4 8.3 2.2 2.7 0.2 0.2Asia 66.5 83.3 39.9 122.3 7.0 40.4
China 16.6 32.8 14.7 94.5 3.9 34.5India 8.4 14.8 0.3 2.6 0.1 0.1Indonesia 6.6 4.3 8.2 4.3 0.4 0.4
North & Central America 147.6 99.2 61.0 40.8 8.8 7.9Canada 50.4 32.8 14.6 11.0 1.7 1.3United States 92.6 62.0 45.8 29.1 7.0 6.4
Oceania 7.6 8.6 3.1 3.7 1.2 1.3Australia 3.7 4.7 1.6 1.8 0.5 0.7
South America 31.5 35.7 7.8 14.5 1.7 5.3Brazil 20.5 25.0 5.2 8.3 1.0 2.9
Sawnwood
FibreboardTotal
Wood-based panelsTotal
Source: faoStat (http://faostat.fao.org/site/626/default.aspx#ancor)
Table 3.24: Production of pulp, paper and paperboard in the world(million tonnes)
1999 2009 1999 2009 1999 2009 1999 2009World 177.7 174.1 163.6 162.3 314.6 376.8 38.1 32.7Europe 43.9 44.6 44.1 45.2 96.0 106.9 12.7 11.4
EU-27 35.7 35.9 35.9 35.2 85.0 89.4 9.8 8.6Russia 5.0 6.6 5.1 6.8 4.5 7.4 1.6 2.0
Africa 2.4 2.3 2.7 2.7 2.9 3.9 0.4 0.3Asia 34.9 38.8 19.7 25.9 89.5 156.5 7.6 12.0
China 17.2 17.6 3.6 7.1 33.3 90.2 1.1 4.9India 2.5 4.0 1.6 2.3 3.8 7.6 0.5 0.8Indonesia 1.7 4.9 1.6 5.2 7.0 11.5 0.5 0.6
North & Central America 83.4 64.4 84.2 65.3 113.1 90.5 16.0 7.6Canada 25.2 17.1 25.4 17.2 20.3 12.8 9.2 4.4United States 57.6 47.0 58.4 47.7 88.7 72.1 6.5 3.0
Oceania 2.3 2.7 2.3 2.7 3.4 4.2 0.8 0.7Australia 0.9 1.2 0.9 1.2 2.6 3.3 0.4 0.4
South America 10.7 21.3 10.5 20.6 9.7 14.8 0.6 0.6Brazil 7.1 13.6 7.1 13.7 6.3 9.4 0.2 0.1
Pulp for paper Paper & paperboardNewsprintTotal Woodpulp Total
Source: faoStat (http://faostat.fao.org/site/626/default.aspx#ancor)
Global paper and paperboard production reached 376.8 million tonnes in 2009, which was almost 20 % higher than in 1999. Over the last decade, Asia moved from having the third highest (28.5 %) share of the world’s output to occupy the position of global leader (41.5 % of output in 2009), this was largely a result of China overtaking the United States as the largest paper and paperboard producer in the world.

80 Forestry in the EU and the world — a statistical portrait
3 Wood and wood products
Trade in wood products in the world
Table 3.25: exports of roundwood, fuelwood and other basic wood products in the world, 2009(1 000 m³)
Total ConiferousNon-conif.
World 101 585 95 507 63 471 32 036 6 078 39 877Europe 62 493 56 780 43 142 13 638 5 713 14 099
EU-27 Member States 32 008 28 648 20 704 7 944 3 360 9 683Russia 22 289 21 700 18 300 3 400 589 3 470
Africa 2 710 2 693 48 2 645 17 3 183Asia 6 063 6 036 404 5 632 27 4 211
China 100 98 7 91 2 10India 10 8 8 1 1 0Indonesia 12 10 10 0 2 608
North & Central America 12 820 12 512 9 973 2 538 308 5 328Canada 2 761 2 692 2 443 249 69 709United States 9 742 9 511 7 410 2 101 231 4 558
Oceania 13 074 13 062 9 741 3 321 13 6 808Australia 1 152 1 141 971 170 11 6 495
South America 4 425 4 425 163 4 262 0 6 248Brazil 101 101 92 9 0 1 570
Wood chips &
particles
RoundwodIndustrial roundwood
FuelwoodTotal
Source: faoStat (http://faostat.fao.org/site/626/default.aspx#ancor)
Table 3.26: imports of roundwood, fuelwood and other basic wood products in the world, 2009(1 000 m³)
Total ConiferousNon-conif.
World 96 353 91 558 64 895 26 663 4 795 44 033Europe 47 768 43 225 29 526 13 698 4 544 16 955
EU-27 Member States 44 863 40 578 27 278 13 300 4 285 12 844Russia 60 60 60 0 0 1
Africa 767 761 315 446 7 5Asia 41 744 41 702 30 964 10 738 42 24 378
China 28 657 28 653 20 424 8 229 4 4 966India 1 836 1 823 1 167 656 13 20Indonesia 53 42 2 40 12 8
North & Central America 6 002 5 801 4 070 1 731 201 2 504Canada 4 647 4 555 3 109 1 446 92 2 377United States 1 019 914 666 248 105 91
Oceania 17 14 7 7 2 22Australia 2 1 0 1 0 21
South America 54 54 12 42 0 168Brazil 27 27 1 26 0 0
RoundwodWood
chips & particles
TotalIndustrial roundwood
Fuelwood
Source: faoStat (http://faostat.fao.org/site/626/default.aspx#ancor)
External trade data for the EU in this section is based upon world trade flows and is labelled ‘EU-27 Member States’; it covers the sum of total exports/imports and includes trade between the Member States. This data is comparable to that presented for the continents: for example, North and Central American trade data includes exports and imports between Canada and the United States.

81 Forestry in the EU and the world — a statistical portrait
3Wood and wood products
Table 3.27: exports of sawnwood and panels in the world, 2009(1 000 m³)
TotalVeneersheets
Ply-wood
Particleboard
Fibre-board
World 102 889 64 237 2 382 19 950 22 057 19 848Europe 67 572 31 921 811 4 598 16 091 10 420
EU-27 Member States 46 482 26 682 570 2 998 14 216 8 898Russia 16 200 2 433 113 1 334 575 411
Africa 1 710 490 161 265 28 36Asia 4 379 19 718 510 11 866 1 855 5 487
China 662 8 512 122 5 441 127 2 823India 17 47 21 11 2 13Indonesia 51 2 982 50 2 205 17 710
North & Central America 22 673 6 434 608 677 3 686 1 463Canada 19 001 4 649 403 305 3 266 675United States 3 498 1 706 195 350 377 784
Oceania 2 270 1 133 216 100 99 717Australia 325 344 91 37 15 201
South America 4 286 4 542 76 2 444 298 1 724Brazil 1 394 1 799 33 1 496 59 211
Wood-based panelsTotal
Sawnwood
Source: faoStat (http://faostat.fao.org/site/626/default.aspx#ancor)
Table 3.28: imports of sawnwood and panels in the world, 2009(1 000 m³)
TotalVeneersheets
Ply-wood
Particleboard
Fibre-board
World 94 254 61 716 3 111 17 683 21 641 19 282Europe 39 337 30 463 1 452 6 118 13 330 9 563
EU-27 Member States 36 239 25 998 1 385 5 595 11 278 7 740Russia 16 853 15 53 445 340
Africa 7 210 1 276 50 642 205 379Asia 25 654 17 782 1 126 6 837 4 171 5 649
China 11 006 2 628 194 825 699 910India 63 229 20 25 90 94Indonesia 211 530 20 57 272 181
North & Central America 21 155 10 852 436 3 775 3 553 3 088Canada 1 683 2 179 164 904 335 776United States 15 428 7 141 185 2 441 3 071 1 444
Oceania 650 397 19 211 43 124Australia 531 331 15 179 31 106
South America 248 947 28 100 339 479Brazil 100 231 10 4 40 177
Sawnwood
TotalWood-based panels
Source: faoStat (http://faostat.fao.org/site/626/default.aspx#ancor)
At the upstream end of the wood-based products chain, external trade largely reflects natural resource endowments. As such, Russia imported almost no roundwood in 2009 but exported 22.3 million m³ to other countries. In contrast, China exported almost no roundwood, but imported 28.7 million m³.

82 Forestry in the EU and the world — a statistical portrait
3 Wood and wood products
Table 3.29: exports of pulp, paper and paperboard in the world(million tonnes)
1999 2009 1999 2009 1999 2009 1999 2009World 37.10 46.24 35.72 44.31 92.84 105.22 18.50 12.89Europe 11.30 13.19 11.00 12.77 54.81 63.48 7.67 6.66
EU-27 Member States 9.15 10.86 9.04 10.61 49.23 57.94 5.55 4.66Russia 1.39 1.72 1.35 1.71 2.00 2.72 1.13 1.42
Africa 1.11 0.99 0.63 0.47 0.60 1.17 0.15 0.06Asia 1.69 3.16 1.69 3.11 12.16 14.81 1.26 1.36
China 0.04 0.05 0.04 0.09 3.44 4.90 0.03 0.21India 0.00 0.00 0.00 0.00 0.09 0.33 0.00 0.01Indonesia 1.20 2.73 1.18 2.62 2.92 3.57 0.30 0.18
North & Central America 17.15 13.87 16.66 13.28 23.32 21.37 9.00 4.50Canada 11.65 7.02 11.45 6.76 14.40 9.53 8.26 3.94United States 5.50 6.82 5.21 6.50 8.64 11.28 0.70 0.54
Oceania 0.63 0.90 0.63 0.90 0.84 1.36 0.24 0.07Australia 0.00 0.02 0.00 0.02 0.39 0.79 0.01 0.01
South America 5.21 14.13 5.12 13.78 1.11 3.03 0.19 0.24Brazil 3.11 8.59 3.01 8.24 0.53 1.92 0.02 0.00
Pulp for paper Paper and paperboardWoodpulp TotalTotal Newsprint
Source: faoStat, extracted december 2010 (http://faostat.fao.org/site/626/default.aspx#ancor)
Table 3.30: imports of pulp, paper and paperbaord in the world(million tonnes)
1999 2009 1999 2009 1999 2009 1999 2009World 36.70 46.75 35.39 44.69 96.87 102.60 18.69 13.34Europe 16.91 17.09 16.36 16.66 49.12 55.16 7.03 6.24
EU-27 Member States 15.70 15.33 15.25 14.88 45.73 48.85 6.39 5.20Russia 0.06 0.04 0.04 0.06 0.31 1.09 0.00 0.00
Africa 0.26 0.44 0.25 0.48 2.42 3.79 0.29 0.48Asia 11.54 21.91 10.84 20.37 19.73 19.71 3.11 2.66
China 3.99 14.42 3.74 13.55 10.95 5.01 1.07 0.54India 0.25 0.66 0.19 0.49 0.77 1.28 0.50 0.74Indonesia 0.96 1.13 0.76 0.79 0.14 0.40 0.00 0.00
North & Central America 6.91 6.07 6.84 5.96 21.10 18.34 7.22 2.99Canada 0.26 0.13 0.26 0.16 2.48 2.65 0.04 0.06United States 6.07 4.58 6.04 4.49 15.73 10.45 6.80 2.40
Oceania 0.30 0.30 0.30 0.30 1.65 1.75 0.28 0.19Australia 0.28 0.27 0.29 0.28 1.31 1.31 0.28 0.18
South America 0.79 0.94 0.79 0.93 2.86 3.85 0.76 0.78Brazil 0.34 0.38 0.34 0.37 0.72 1.01 0.38 0.37
Woodpulp Total NewsprintPulp for paper Paper and paperboard
Total
Source: faoStat, extracted december 2010 (http://faostat.fao.org/site/626/default.aspx#ancor)
A similar pattern was observed for sawnwood, as Canada and Russia had considerable trade surpluses of 17.3 million m³ and 16.2 million m³ respectively, while the United States and China recorded trade deficits of 11.9 million m³ and 10.3 million m³. China recorded the largest trade deficit concerning pulp for paper in 2009 (14.4 million tonnes), with relatively high trade surpluses for Brazil and Canada. The EU-27 Member States were the largest exporters of paper and paperboard in 2009 (just over 60 % of the world total); they also recorded the highest trade surplus for paper and paperboard (9.1 million tonnes). China, Indonesia and Malaysia were among the most important exporters of bamboo and cane furniture.

83 Forestry in the EU and the world — a statistical portrait
3Wood and wood products
Waste and recycling of wood products in the EU
Environmental statistics provide information on the quantity of wood waste and paper and cardboard waste that was treated within Europe (see Table 3.31). Almost 25 million tonnes of wood waste were treated in the EU in 2008, while the figure for paper and cardboard was 13.3 million tonnes higher. Waste treatment operations distinguish between five different treatment types: recovery, energy recovery, incineration, disposal on land, and land treatment/release into water; more information on the use of wood waste as an energy source is provided in Chapter 4.
Table 3.31: Waste treatment in the eu, efta and candidate countries(1 000 tonnes)
2004 2006 2008 2004 2006 2008EU-27 30 910 36 180 24 970 37 550 34 920 38 260Belgium 989 440 565 1 581 630 574Bulgaria 0 0 19 169 125 196Czech Republic 226 120 113 152 201 246Denmark 721 862 891 677 788 782Germany 2 221 2 502 2 642 6 054 5 922 5 908Estonia 180 398 319 0 6 35Ireland 155 180 159 118 26 6Greece 24 63 88 263 425 440Spain 279 573 1 737 2 217 3 346 5 060France 4 261 3 727 4 583 7 550 6 050 5 659Italy 4 248 4 378 1 790 3 335 4 143 4 450Cyprus 0 2 2 6 29 23Latvia 2 0 0 15 18 19Lithuania 17 34 60 68 141 146Luxembourg 70 172 69 0 0 18Hungary 183 174 135 287 344 354Malta 1 1 0 2 3 3Netherlands 944 644 1 422 2 670 2 656 2 268Austria 2 935 2 282 3 565 1 156 1 425 1 401Poland 930 419 2 194 1 157 212 1 326Portugal 1 109 681 981 345 781 303Romania 80 109 761 344 335 325Slovenia 75 150 165 349 373 380Slovakia 126 421 151 45 108 102Finland 3 472 4 122 115 424 734 468Sweden 4 948 10 916 178 1 677 1 846 2 339United Kingdom 2 715 2 747 2 272 6 891 4 174 5 430Norway 384 348 418 531 670 683Croatia 35 : 19 4 : 7FYR of Macedonia : : 0 : : 16Turkey 78 0 117 417 23 1 040
Wood waste Paper & cardboard waste
Source: eurostat (env_wastrt)

84 Forestry in the EU and the world — a statistical portrait
3 Wood and wood products
Table 3.32: Waste generated by wood and paper manufacturing and by households in the eu, efta and candidate countries, 2008(% share of waste from all nace activities and households)
Total waste
Wood waste
Paper & card-board waste
Total waste
Wood waste
Paper & card-board waste
Total waste
Wood waste
Paper & card-board waste
EU-27 1.1 39.0 0.1 1.2 13.5 16.9 8.4 4.8 29.8Belgium 0.9 23.3 0.1 1.4 3.8 9.5 9.2 15.0 18.9Bulgaria 0.1 60.0 0.0 0.1 16.5 20.8 1.0 0.0 0.0Czech Republic 0.7 54.6 0.1 1.1 0.9 18.7 12.5 4.1 19.3Denmark 0.2 1.1 0.4 1.3 0.0 17.4 16.6 26.5 12.4Germany 0.8 20.9 0.1 1.1 2.4 16.1 9.5 7.0 61.4Estonia 5.4 79.9 0.1 0.6 4.1 12.5 2.2 0.3 6.6Ireland 0.0 52.9 0.9 1.8 4.1 19.9 7.1 0.0 0.0Greece 0.1 9.7 0.0 0.2 0.2 10.8 5.8 0.0 0.0Spain 0.2 12.0 0.2 1.4 2.3 19.9 16.4 6.3 23.2France 1.4 54.2 0.1 0.8 4.4 20.5 8.5 0.0 18.1Italy 0.8 33.1 0.2 1.2 3.7 19.3 18.1 19.8 56.9Cyprus 0.4 38.2 0.0 0.7 0.3 6.3 23.5 0.0 74.2Latvia 4.3 66.2 1.5 0.7 0.1 57.6 40.5 0.0 0.0Lithuania 1.5 40.5 0.3 0.6 6.4 14.9 19.9 1.2 45.3Luxembourg 0.4 40.8 0.1 0.2 0.7 16.5 2.9 5.9 14.3Hungary 1.3 73.3 0.0 0.9 0.2 19.3 17.0 0.4 20.7Malta 0.0 0.0 0.0 0.4 0.0 0.0 11.3 0.0 23.4Netherlands 0.3 10.0 0.1 0.9 1.3 18.6 9.5 14.8 42.6Austria 7.8 69.4 0.1 1.5 5.8 11.3 6.8 2.6 46.2Poland 1.5 55.6 0.3 0.9 14.7 17.0 4.9 0.0 6.0Portugal 1.9 27.3 0.1 2.3 5.9 9.0 14.1 0.0 0.0Romania 0.7 73.0 0.1 0.1 2.4 9.1 4.5 7.2 40.2Slovenia 5.4 53.7 0.1 3.4 5.4 41.0 14.2 2.0 16.9Slovakia 2.2 38.3 0.0 5.0 44.2 15.5 15.5 0.2 20.5Finland 7.4 47.4 0.1 5.5 23.7 20.1 2.0 0.5 28.2Sweden 0.3 3.7 0.1 7.8 85.9 64.5 5.1 0.5 22.6United Kingdom 0.5 29.2 0.1 0.7 0.8 8.7 9.4 12.6 14.1Liechtenstein 0.0 0.0 0.0 0.3 0.0 14.3 0.0 0.0 0.0Norway 3.9 32.6 0.1 3.1 15.1 2.1 22.7 16.5 42.4Croatia 3.5 70.7 0.0 0.9 0.4 19.7 0.0 0.0 0.0FYR of Macedonia 0.1 63.7 0.1 0.2 0.2 5.9 : 0.0 0.0Turkey 0.1 9.4 0.1 0.2 8.2 8.3 43.9 8.9 76.9
Wood manufacturing Paper manufacturing Households
Source: eurostat (env_wasgen)
The same source of information provides a breakdown of the origin of waste streams – as presented in Table 3.32 – with details of the waste created by wood manufacturers, paper manufacturers and households. As may be expected, the highest share of wood waste in the EU was produced by wood manufacturers in 2008 (some 39.0 % of all wood waste), while paper manufacturers accounted for 13.5 % of the total and households for 4.8 %. Households accounted for the highest share of waste paper and cardboard, some 29.8 % of the total generated in the EU in 2008. Both wood manufacturing and paper manufacturing accounted for only a tiny fraction of the total waste generated by all activities, while households accounted for 8.4 %.

85 Forestry in the EU and the world — a statistical portrait
3Wood and wood products
Table 3.33: material recycling of packaging waste in the eu and efta, 2008(1 000 tonnes)
Domestic Dispatches Domestic Dispatches Domestic DispatchesEU-27 (1) 49 121 11 587 5 089 : 25 221 8 278Belgium 1 333 439 114 8 575 222Bulgaria 152 0 3 0 74 0Czech Republic 649 325 31 0 351 227Denmark 539 371 36 : 311 259Germany 11 172 2 392 710 90 6 046 1 860Estonia 89 47 0 : 45 30Ireland 634 1 85 0 318 0Greece 460 62 20 0 324 54Spain 4 729 496 450 : 2 602 496France 7 071 1 643 500 : 3 712 1 432Italy 7 255 728 1 443 : 3 323 656Cyprus 30 24 2 : 16 16Latvia 123 60 18 0 55 39Lithuania 170 48 26 0 75 13Luxembourg 61 61 2 2 29 29Hungary 510 58 51 0 316 23Malta (2) 5 2 0 0 1 0Netherlands 2 012 578 192 160 1 040 338Austria 801 42 14 0 430 0Poland 1 787 1 125 262 126 826 506Portugal 1 076 253 77 : 630 253Romania 392 30 18 : 217 7Slovenia (3) 100 26 3 0 53 0Slovakia 155 34 3 0 69 33Finland 394 39 43 0 238 0Sweden 825 115 50 0 482 111United Kingdom 6 598 2 588 939 0 3 061 1 675Liechtenstein 17 17 0 0 2 2Norway 372 0 7 : 244 :
All packaging
Wooden packaging
Paper & cardboard packaging
(1) Sum of data for the 27 member States, including values for 2007 (see other footnotes for more details).(2) 2007.(3) all packaging, 2007.
Source: eurostat (env_waspac)
Looking in more detail at the recycling of packaging (see Table 3.33), some 5.1 million tonnes of wooden packaging and 25.2 million tonnes of paper and cardboard packaging were recycled in the EU Member State where the waste was produced in 2008; an increasing share of paper and cardboard packaging was dispatched to other Member States for recovery. Quantities treated in other countries count towards national recycling targets as long as the EU’s standards are respected.

86 Forestry in the EU and the world — a statistical portrait
3 Wood and wood products
Table 3.34: Production of recovered pulp and paper in the eu, efta and candidate countries(1 000 tonnes)
2007 2008 2009 2007 2008 2009EU-27 24 699 24 393 22 987 53 641 53 154 50 101Belgium 3 2 2 1 011 1 018 1 018Bulgaria 0 0 0 80 21 27Czech Republic 0 0 0 468 428 428Denmark 89 89 89 592 592 654Germany 13 167 12 928 12 928 15 822 15 493 14 776Estonia 0 0 0 55 58 58Ireland 0 0 0 454 448 471Greece 0 0 0 191 196 353Spain 4 969 5 046 4 000 4 922 4 999 4 625France 1 1 1 5 947 5 677 4 998Italy 0 0 0 5 580 5 329 4 752Cyprus 0 0 0 23 26 29Latvia 0 0 0 80 80 80Lithuania 117 119 0 89 98 72Luxembourg 0 0 0 118 125 77Hungary 0 0 0 407 387 390Malta 0 0 0 1 5 5Netherlands 0 0 0 2 307 2 233 2 002Austria 2 127 2 050 2 002 1 514 1 400 1 552Poland 0 0 0 1 567 1 600 1 730Portugal 349 328 354 729 704 774Romania 0 0 0 295 331 300Slovenia 160 160 94 180 183 198Slovakia 0 0 0 257 208 168Finland 0 0 1 737 724 544Sweden 276 276 270 1 598 2 022 1 864United Kingdom 3 440 3 394 3 246 8 617 8 768 8 155Iceland 0 : : 20 : :Liechtenstein 0 0 0 0 0 0Norway 0 0 0 462 469 477Switzerland 777 764 700 1 324 1 353 1 317Montenegro 0 0 0 : 0 0Croatia 0 0 0 0 0 0FYR of Macedonia 1 3 0 7 2 2Turkey 0 0 0 1 016 1 016 1 016
Recovered fibre pulp Recovered paper
Source: eurostat (for_pp)
The production of recovered pulp fibre and recovered paper in the EU was 23.0 million tonnes and 50.1 million tonnes respectively in 2009. Germany alone accounted for more than half (56.2 %) of the recovered fibre pulp in 2009 and the addition of Spain and the United Kingdom led to a cumulative share for these three Member States of 87.8 %. The production of recovered paper was somewhat more diversified across the Member States, although Germany remained the leading producer (29.5 % of the EU total). Together with the United Kingdom, France, Italy and Spain, these five Member States together accounted for 74.5 % of the EU total.
The two largest producers of recovered fibre pulp in the world are China and the EU. Whereas China relies on imports of recovered paper to feed its recovered fibre pulp mills, the EU is a net exporter of recovered paper. European enterprises have also been engaged in exporting to China much of the technology for processing recovered fibre pulp, in the form of de-inking and pulping plants.

87 Forestry in the EU and the world — a statistical portrait
3Wood and wood products
Pulp and paper recovery in the world
The Confederation of European Paper Industries (CEPI) provides information in relation to recovered paper for European countries – see Table 3.35. The recovered paper utilisation rate refers to the percentage of recovered paper utilisation compared with total paper production.
The majority of the EU Member States achieved a recovered paper utilisation rate of more than 50 % in 2009. Most recovered paper came from one of two streams – either old newspapers and magazines, or corrugated and solid paper containers and sacks.
Information is available for a number of other countries, where recovered paper utilisation rates were also frequently above the threshold of 50 %. The composition of recovered paper in the rest of the world was generally less based on the recovery of old newspapers and magazines. Instead, corrugated and solid paper containers and sacks often accounted for more than half of the total volume of recovered paper.
Table 3.35: recovered paper in the world, 2009 (1)
Old newspapers,
magazinesetc
Corrugated, solid
containers &kraft sacks
Wood-freeprinting &
writing paper& other high-
grade qualities
Mixedgrades
Belgium 61 53 35 0 11Germany 71 29 34 12 24Spain 81 22 52 8 19France 60 25 53 10 12Italy 57 14 48 10 28Netherlands 77 17 35 8 40Austria 50 32 38 12 17Poland 38 18 68 7 8Sweden 17 54 29 8 10United Kingdom 89 39 36 18 7Australia 60 11 49 13 26Brazil 41 5 64 14 18Chile 44 2 64 25 10Colombia 70 6 66 28 1Israel 67 11 59 27 3Japan 65 31 44 12 13Malaysia 110 20 70 5 5Mexico 100 10 60 28 2Norway 26 51 39 8 2Russia 18 13 50 14 23South Africa 43 10 56 24 9Switzerland 56 46 27 11 16United States 37 13 60 13 14
Recovered paper
utilisation rate(%)
Composition of recovered paper (% share of total recovered paper)
(1) the ten eu member States with the highest volume of recovered paper are shown.
Source: fao and cePi (http://www.fao.org/forestry/industries/9531/en/)

88 Forestry in the EU and the world — a statistical portrait
3 Wood and wood products
Table 3.36: Production and trade in recovered pulp and paper in the world, 2009(million tonnes)
Produc-tion
Exports ImportsProduc-
tionExports Imports
World 77.39 0.25 0.38 181.59 55.75 54.93Europe 26.38 0.15 0.29 55.79 25.61 13.77
EU-27 Member States 24.03 0.11 0.24 50.25 24.33 13.14Russia 1.65 0.00 0.00 2.30 0.22 0.00
Africa 0.00 0.01 0.00 1.61 0.09 0.08Asia 46.06 0.01 0.07 65.70 7.11 35.76
China 44.40 0.00 0.02 25.55 1.09 28.19India 1.20 0.00 0.00 0.85 0.00 2.16Indonesia : : 0.01 3.93 0.02 2.08
North & Central America 2.94 0.08 0.02 48.56 21.28 4.89Canada 0.02 0.00 0.00 3.20 1.70 1.32United States 0.03 0.08 0.00 42.15 19.07 0.30
Oceania 1.99 0.00 0.00 3.46 1.59 0.01Australia 1.99 0.00 0.00 3.20 1.34 0.00
South America 0.02 0.00 0.00 6.48 0.07 0.42Brazil : : : 3.90 0.00 0.01
Recovered fibre pulp Recovered paper
Source: faoStat (http://faostat.fao.org/site/626/default.aspx#ancor)


Wood as a source of energy
Wood has been used for centuries as a source of heat or for cooking in domestic environments. It was also used at the outset of the industrial revolution as a primary source of energy, until it was supplanted by coal.
Today, fuelwood, wood pellets and wood chips are often used for space heating and power generation within the developed world. In contrast, many developing countries continue to rely almost exclusively on fuelwood as a source of energy for domestic cooking and heating, for the generation of electricity, and across various manufacturing activities (for example, within food processing for baking, brewing, smoking or curing).
Security of supply and sustainability are two major issues concerning energy supply and demand that fit within the broader context of externalities linked to the production of energy – greenhouse gas emissions, air pollution and waste. The use of wood as a fuel is largely carbon neutral if wood resources are cultivated in a sustainable way. Although carbon dioxide is released into the atmosphere when wood is burnt, this is converted into carbon and oxygen as trees grow, and hence the cycle of tree growth and wood burning is often referred to as being carbon neutral. The inefficient burning of wood may however result in smoke and fine particles being emitted into the atmosphere (which has the potential to lead to negative health impacts).
Energy is also required for the processing and/or the transportation of wood that is used for energy supply. Technological developments have led to biomass feedstocks being processed in advance of their transportation (for example, as wood pellets) so they become more dense. Furthermore, such transformations generally make the resulting products more practical for transportation and more convenient when used by the consumer.
91 Forestry in the EU and the world — a statistical portrait

92 Forestry in the EU and the world — a statistical portrait
4 Wood as a source of energy
Wood consumption as a source of energy in the EU
Renewable sources of energy include wind, solar, hydro-electric and tidal power, geothermal energy and biomass (including wood). Their use reduces dependence on fossil fuel markets, is generally carbon neutral and often diversifies energy supply. As noted above, burning biomass returns to the atmosphere the carbon dioxide that was absorbed as plants/trees grew – there is no net release of carbon dioxide if the cycle of growth, harvest and combustion is sustained.
In April 2009, the European Parliament and Council adopted a Directive (2009/28/EC) on the promotion of the use of energy from renewable sources, while the Europe 2020 strategy (approved in June 2010) confirmed an EU target such that 20 % of energy should come from renewable sources by 2020 (see Table 4.1). The Directive set mandatory national targets for the overall share of energy from renewable sources and for the share of transportation fuels from renewable sources. It also established sustainability criteria for liquid biofuels derived from agricultural crops (such as sugar cane or maize), in order to dissuade producers from clearing forest land in order to grow biofuel crops. In February 2010, the European Commission published a paper (COM(2010)11) on sustainability requirements for the use of biomass in electricity, heating and cooling, promoting the sustainable production and use of biomass, as well as an internal market in biomass trade.
4
Table 4.1: renewable energy targets for the eu-27
2010 2020All renewables 12 % indicative 20 % binding
Biofuels 5.75 % 10 %Green electricity 21 %
Biomass 150 million toe 195 million toeWood biomass 27 million toe 35 million toeRoundwood equivalent 108-149 million m³ 140-194 million m³
Source: european commission
Table 4.2: Sources and users of wood as an energy source in the eu and efta, 2007 (1)(1 000 m³)
Direct IndirectRecov-
eredPower &
heatIndustrial
Private households
Czech Republic 5 036 2 903 : 538 2 270 5 131Germany 13 023 10 231 7 017 15 364 1 696 13 211France 34 787 4 979 1 500 514 3 825 36 927Lithuania 1 484 1 724 : 775 422 2 012Netherlands 313 1 387 263 1 400 150 412Austria 6 929 7 025 488 2 051 3 855 8 538Slovenia 1 591 596 26 28 531 1 655Finland 6 803 25 808 303 8 594 18 596 5 724Sweden 6 923 31 760 694 10 995 19 458 8 923United Kingdom 580 532 450 708 235 620Norway 3 128 2 387 258 595 2 011 3 167Switzerland 1 935 1 250 600 2 268 224 1 293
Wood used as an energy source Users of wood as an energy source
(1) no information available for other member States.
Source: joint Wood energy enquiry (jWee)

93 Forestry in the EU and the world — a statistical portrait
4Wood as a source of energy 4
Wood for use as an energy source (a fuel) comes not only from tree felling, but also from selective thinning of managed forests and other forestry practices (direct sources). Wood for energy use may also be derived as a by-product from downstream processing in wood-based manufacturing, for example, as off-cuts, trimmings, sawdust, shavings, wood chips or black liquor (indirect sources). End-of-life wood and paper products may also be used as a source of energy (recovered wood).
Information collected by the Joint Wood Energy Enquiry (JWEE) shows that direct sources accounted for some 84.3 % of total wood used as an energy source in France in 2007 (see Table 4.2), which was in stark contrast to the relatively high proportion of wood used for energy coming from indirect sources in both Sweden (80.7 %) and Finland (78.4 %). The share of recovered wood rose to above one fifth of the total in Germany (23.2 %) and the United Kingdom (28.8 %), likely reflecting new landfill legislation that encourages wood waste to be used or traded, as well as the promotion of biomass energy production.
Private households were generally the main users of wood as a source of energy, accounting for almost half (47.5 %) of the wood used for energy purposes in 2007 across the ten Member States for which data are presented in Table 4.2; these figures for households are likely to be under-reported. Nevertheless, private households in France accounted for almost 90 % of the wood used for energy in 2007. These data come from household surveys that include detailed questions, highlighting the potential benefits that could be gained by carrying out similar surveys in other countries.
Wood and paper manufacturing enterprises supply much of their own energy needs and this was reflected in Finland and Sweden where industrial users accounted for around half of all the wood used for energy in 2007. The third main use of wood as an energy source is for power and heat generation; the share of this category rose to upwards of 50 % of the total wood used as an energy source in Germany and the Netherlands, and also in Switzerland.
Figure 4.1: increase in gross inland consumption of energy from renewables since 1990 in the eu-27(1990=100, based on tonnes of oil equivalents)
80
100
120
140
160
180
200
220
240
1990 1995 2000 2005 2008
Biomass and wasteRenewable energyWood and wood wasteTotal energy
Source: eurostat (nrg_100a and nrg_1071a)

94 Forestry in the EU and the world — a statistical portrait
4 Wood as a source of energy4
Figure 4.2: gross inland consumption of renewable energy sources in the eu-27, 2008(% share of tonnes of oil equivalents)
Wood & wood waste47.0%
Other biomass and waste
22.7%
Hydro power18.6%
Wind energy
6.7%
Solar energy
1.1%
Geothermal energy
3.8%
Source: eurostat (nrg_1071a and nrg_1072a)
Renewable energy sources accounted for 8.4 % of the EU’s gross inland consumption of energy in 2008; this share was four percentage points higher than in 1990 (4.4 %). There was a rapid expansion in the use of renewable energy (from a relatively low starting point) between 1990 and 2008 and nowhere was this pattern more apparent than for biomass and waste (up 139 %) – see Figure 4.1.
EU gross inland energy consumption of wood and wood waste was 71.0 million tonnes of oil equivalents in 2008. Wood and wood waste was the leading renewable energy resource in the EU in 2008, accounting for almost half (47.0 %) of all gross inland energy consumption from renewable energy sources (see Figure 4.2) and for just over two thirds (67.5 %) of the total for biomass and waste, the remainder being split between municipal solid waste (14.1 %), biofuels (11.2 %) and biogas (7.2 %).

95 Forestry in the EU and the world — a statistical portrait
4Wood as a source of energy 4
Figure 4.3: Share of wood and wood waste in total renewable energy in the eu, efta and candidate countries, 2008 (1)(% of gross inland consumption of renewable energy)
0
25
50
75
100
EU-2
7EA
-17
Esto
nia
Lith
uani
aPo
land
Finl
and
Latv
iaCz
ech
Repu
blic
Hun
gary
Bulg
aria
Rom
ania
Port
ugal
Belg
ium
Slov
enia
Gre
ece
Den
mar
kSw
eden
Aus
tria
Slov
akia
Fran
ceSp
ain
Ger
man
yIre
land
Net
herla
nds
Uni
ted
King
dom
Italy
Cypr
usLu
xem
bour
gTu
rkey
Croa
tiaSw
itzer
land
Nor
way
(1) malta, not available.
Source: eurostat (nrg_1071a)
Wood and wood waste accounted for as much as 23.9 % of gross inland energy consumption in Latvia in 2008, with relatively high shares also recorded in Finland (20.2 %) and Sweden (16.6 %); Austria, Portugal and Estonia were the only other EU Member States to record double-digit shares. Wood and wood waste was the principal source of renewable energy consumed in the majority of EU Member States (see Figure 4.3), its relative importance ranging from a high of 97.4 % in Estonia to just 13.2 % in Luxembourg (Malta, not available).
Biomass energy may be directly stored and drawn upon for use at any time, unlike many other renewable energy sources such as wave, solar or wind power that need to be consumed directly or converted in order to be stored. Aside from its conversion into heat through combustion, biomass energy sources may also be transferred into electricity, gas, or liquid fuel. Biomass is increasingly used in complex installations, for example, the production of combined heat and power (CHP) or co-combustion technologies for power generation (together with coal), whereby existing power stations may be converted at relatively low cost to run partly on biomass.

96 Forestry in the EU and the world — a statistical portrait
4 Wood as a source of energy
Figure 4.4: net electricity generation from biomass-fired power stations in the eu, efta and candidate countries, 2008 (1)(% share of total net electricity generation in gigawatt hours)
0
3
6
9
12
15
EU-2
7EA
-17
Finl
and
Den
mar
kSw
eden
Aus
tria
Net
herla
nds
Hun
gary
Belg
ium
Port
ugal
Ger
man
yLu
xem
bour
gU
nite
d Ki
ngdo
mIta
lyPo
land
Slov
akia
Czec
h Re
publ
icSl
oven
iaSp
ain
Fran
ceLa
tvia
Irela
ndLi
thua
nia
Esto
nia
Gre
ece
Cypr
usRo
man
iaBu
lgar
iaSw
itzer
land
Nor
way
Croa
tiaTu
rkey
(1) malta, not available.
Source: eurostat (nrg_105a)
Within the EU, energy from biomass has become increasingly important in recent years, as policymakers seek to ensure diverse and secure energy supplies while at the same time considering the impact of energy policy on climate change. The introduction within the EU of national targets for 2020 concerning the share of renewable energy in gross inland energy consumption, will likely have a significant impact on the forest sector, given that wood and wood waste is currently the largest source of renewable energy in the EU. Indeed, the use of biomass from both forests and agriculture is forecast to increase sharply in the coming decades. As such, investment in using wood as a source of energy across the EU is on-going, with each Member State following its own national biomass action plan.
Net electricity generation from biomass-fired power stations accounted for 3.2 % of the EU’s electricity generation in 2008 (see Figure 4.4). While the relative importance of biomass-fired power stations was generally still quite low – the majority of the Member States reported net electricity generation from biomass accounting for less than 3 % of total electricity generated – double-digit shares were recorded in Finland (13.5 %) and Denmark (10.7 %).

97 Forestry in the EU and the world — a statistical portrait
4Wood as a source of energy
Figure 4.5: breakdown of gross final energy consumption of wood and wood wastes in the eu-27, 2008(% share of tonnes of oil equivalents)
Households61.3%
Other industry14.6%
Other sectors0.3%
Paper manufacturing
and printing19.8%
Agriculture2.9%
Services1.2%
Source: eurostat (nrg_1071a and nrg_1072a)
Figure 4.6: Purchases of energy products as a share of gross value added at factor cost, eu average, 2008 (1)(%, based on values in eur million)
0 10 20 30 40 50 60
Pulp, paper & paperboard (17.1)
Sawmilling & planing of wood (16.1)
Articles of paper & paperboard (17.2)
Manufacturing (C)
Products of wood & cork (16.2)
Printing & service activities related to printing (18.1)
(1) based on the information available for each nace activity (nace code given in parenthesis); the calculation is made using a list of different member States depending upon the activity under consideration, Poland and Slovenia are never available, czech republic, provisional.
Source: eurostat (sbs_na_ind_r2)
Figure 4.5 shows that households accounted for the largest share (61.3 %) of the EU’s final energy consumption of wood and wood wastes in 2008, some 32.3 million tonnes of oil equivalents. The other main use of energy derived from wood and wood waste was within industrial activities – in particular, for paper manufacturing and printing.
Figure 4.6 presents structural business statistics (at the NACE Rev. 2 group level) relating to the purchases of energy products that are made by different industrial activities (expressing these as a share of total value added at factor cost); this ratio summarises the energy-intensiveness of each wood-based manufacturing activity.
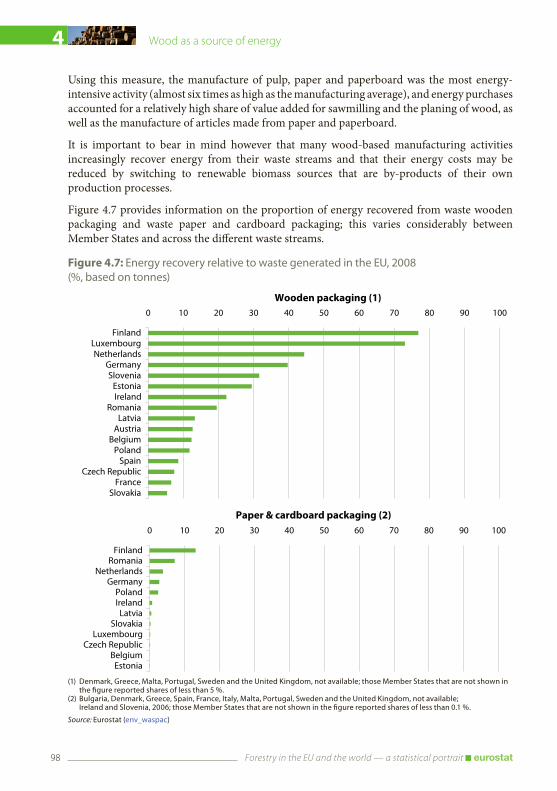
98 Forestry in the EU and the world — a statistical portrait
4 Wood as a source of energy
Figure 4.7: energy recovery relative to waste generated in the eu, 2008(%, based on tonnes)
Wooden packaging (1)0 10 20 30 40 50 60 70 80 90 100
FinlandLuxembourgNetherlands
GermanySlovenia
Estonia Ireland
RomaniaLatvia
AustriaBelgium
PolandSpain
Czech RepublicFrance
Slovakia
(1) denmark, greece, malta, Portugal, Sweden and the united Kingdom, not available; those member States that are not shown in the figure reported shares of less than 5 %.
(2) bulgaria, denmark, greece, Spain, france, italy, malta, Portugal, Sweden and the united Kingdom, not available; ireland and Slovenia, 2006; those member States that are not shown in the figure reported shares of less than 0.1 %.
Source: eurostat (env_waspac)
Paper & cardboard packaging (2)0 10 20 30 40 50 60 70 80 90 100
FinlandRomania
NetherlandsGermany
PolandIrelandLatvia
Slovakia Luxembourg
Czech RepublicBelgiumEstonia
Using this measure, the manufacture of pulp, paper and paperboard was the most energy-intensive activity (almost six times as high as the manufacturing average), and energy purchases accounted for a relatively high share of value added for sawmilling and the planing of wood, as well as the manufacture of articles made from paper and paperboard.
It is important to bear in mind however that many wood-based manufacturing activities increasingly recover energy from their waste streams and that their energy costs may be reduced by switching to renewable biomass sources that are by-products of their own production processes.
Figure 4.7 provides information on the proportion of energy recovered from waste wooden packaging and waste paper and cardboard packaging; this varies considerably between Member States and across the different waste streams.

99 Forestry in the EU and the world — a statistical portrait
4Wood as a source of energy
Production and trade of fuelwood in the world
Although fuelwood accounts for a relatively low share of the world’s total energy supply, it constitutes the major source of energy in many developing countries. The FAO estimates that developing countries consumed around three quarters of the world’s fuelwood in 2009.
More than half (56.5 %) of the world’s total roundwood production in 2009 was accounted for by fuelwood; the share of fuelwood in removals was considerably higher in Africa (89.4 %) and Asia (77.2 %), falling to 23.8 % in Europe. Asia accounted for 40.3 % of the world’s total output of fuelwood in 2009 (see Tables 3.22 and 4.3), while the addition of Africa and South America resulted in this proportion more than doubling to 84.2 %. In contrast, Europe produced 8.1 % of the world’s fuelwood in 2009, a somewhat higher share than that recorded for North and Central America (6.9 %), where the majority of fuelwood production was outside of Canada and the United States.
A high proportion of global fuelwood production is from broad-leaved (non-coniferous) species (88.6 % in 2009); these accounted for almost the totality of fuelwood production in Africa, India and Indonesia. In contrast, the production of coniferous fuelwood was more important (but remained less than 50 % of the fuelwood total) in the EU, Russia and China.
External trade of fuelwood is of minor significance when compared with overall global production: less than 1 % of the world’s fuelwood production was exported in 2009. In the EU (where there is considerable amount of trade between the Member States), extra-EU exports accounted for no more than 3.9 % of total fuelwood production, while the share of imports was somewhat higher, at 5.1 %.
Table 4.3: Production and external trade of fuelwood in the world
Coni-ferous
Non-coni-
ferous1999 2009 2009 2009 1999 2009 1999 2009
World 1 815 1 860 211 1 648 3 444 6 114 1 761 4 864Europe 138 150 47 102 3 185 5 771 1 568 4 615
EU-27 Member States 74 86 25 62 2 411 3 399 1 269 4 415Russia 49 39 15 23 680 589 0 105
Africa 521 616 14 602 11 7 4 7Asia 833 750 96 654 26 26 25 40
China 232 196 79 117 9 2 3 14India 277 308 9 299 0 1 10 13Indonesia 90 65 0 65 5 1 0 0
North & Central America 129 128 34 93 220 308 161 201Canada 3 2 0 2 35 69 44 92United States 46 40 8 33 177 231 115 105
Oceania 13 16 0 16 1 2 2 2Australia 7 8 0 8 0 0 0 0
South America 183 201 20 181 2 0 0 0Brazil 131 141 14 127 0 0 0 0
(million m�) (1 000 m�)
Exports of fuelwood
Imports of fuelwood
Fuelwood production
Total
Source: faoStat (http://faostat.fao.org/site/626/default.aspx#ancor)

100 Forestry in the EU and the world — a statistical portrait
Annexes
Annexes
List of wood and paper products
1 ROUNDWOOD All roundwood harvested and removed. It comprises all wood removed from forests
and from trees outside the forest, including wood recovered from natural, felling and logging losses. It includes all wood removed with or without bark, including wood removed in its round form, or split, roughly squared or in other form (for example, branches, roots, stumps and burls). It is an aggregate comprising fuelwood, including wood for charcoal and industrial roundwood (wood in the rough).
1.1 FUELWOOD (INCLUDING WOOD FOR CHARCOAL) Roundwood that will be used as fuel for purposes such as cooking, heating or power
production. It also includes wood chips to be used for fuel that are made directly (in other words, in the forest) from roundwood. It excludes wood charcoal.
1.2 INDUSTRIAL ROUNDWOOD (WOOD IN THE ROUGH) All roundwood except fuelwood.
1.2.1 SAWLOGS AND VENEER LOGS Roundwood that will be sawn (or chipped) lengthways for the manufacture of
sawnwood or railway sleepers (ties) or used for the production of veneer (mainly by peeling or slicing).
1.2.2 PULPWOOD, ROUND AND SPLIT Roundwood that will be used for the production of pulp, particle board or fibreboard.
1.2.3 OTHER INDUSTRIAL ROUNDWOOD Industrial roundwood (wood in the rough) other than sawlogs, veneer logs and/or
pulpwood. It includes roundwood that will be used for poles, piling, posts, fencing, pitprops, tanning, distillation and match blocks, etc.
2 WOOD CHARCOAL Wood carbonised by partial combustion or the application of heat from external
sources. It includes charcoal used as a fuel or for other uses, for example, as a reduction agent in metallurgy or as an absorption or filtration medium.
3 CHIPS AND PARTICLES Wood that has been reduced to small pieces and is suitable for pulping, for particle
board and/or fibreboard production, for use as a fuel, or for other purposes.
4 WOOD RESIDUES The volume of roundwood that is left over after the production of wood products
in the wood processing industry (in other words, processing residues) and that has not been reduced to chips or particles. It includes sawmill rejects, slabs, edgings and trimmings, veneer log cores, veneer rejects, sawdust, residues from carpentry and joinery production and agglomerated products such as logs, briquettes, pellets or similar forms.

101 Forestry in the EU and the world — a statistical portrait
Annexes
5 SAWNWOOD Wood that has been produced from both domestic and imported roundwood, either
by sawing lengthways or by a profile-chipping process and that exceeds 6 mm in thickness. It includes planks, beams, joists, boards, rafters, scantlings, laths, boxboards and lumber, etc., in the following forms: unplaned, planed, end-jointed, etc. It excludes sleepers, wooden flooring, mouldings (sawnwood continuously shaped along any of its edges or faces, like tongued, grooved, rebated, v-jointed, beaded, moulded, rounded or the like).
6 WOOD-BASED PANELS An aggregate comprising veneer sheets, plywood, particle board, and fibreboard.
6.1 VENEER SHEETS Thin sheets of wood of uniform thickness, not exceeding 6 mm, rotary cut (in other
words, peeled), sliced or sawn. It includes wood used for the manufacture of laminated construction material, furniture, veneer containers, etc.
6.2 PLYWOOD A panel consisting of an assembly of veneer sheets bonded together with the direction
of the grain in alternate plies generally at right angles. The veneer sheets are usually placed symmetrically on both sides of a central ply or core that may itself be made from a veneer sheet or another material. It includes veneer plywood (plywood manufactured by bonding together more than two veneer sheets, where the grain of alternate veneer sheets is crossed, generally at right angles); core plywood or blockboard (plywood with a solid core (in other words, the central layer, generally thicker than the other plies) that consists of narrow boards, blocks or strips of wood placed side by side, which may or may not be glued together); cellular board (plywood with a core of cellular construction); and composite plywood (plywood with the core or certain layers made of material other than solid wood or veneers). It excludes laminated construction materials (for example, glulam), where the grain of the veneer sheets generally runs in the same direction.
6.3 PARTICLE BOARD, ORIENTED STRANDBOARD (OSB) AND SIMILAR BOARD A panel manufactured from small pieces of wood or other ligno-cellulosic materials
(for example, chips, flakes, splinters, strands, shreds, shives, etc.) bonded together by the use of an organic binder together with one or more of the following agents: heat, pressure, humidity, a catalyst, etc. The particle board category is an aggregate category. It includes oriented strandboard (OSB), waferboard and flaxboard. It excludes wood wool and other particle boards bonded together with inorganic binders.
6.3.1 ORIENTED STRANDBOARD (OSB) A structural board in which layers of narrow wafers are layered alternately at right
angles in order to give the board greater elasto-mechanical properties. The wafers, which resemble small pieces of veneer, are coated with, for example, waterproof phenolic resin glue, interleaved together in mats and then bonded together under heat and pressure. The resulting product is a solid, uniform building panel having high strength and water resistance. It excludes waferboard.
102 Forestry in the EU and the world — a statistical portrait
Annexes
6.4 FIBREBOARD A panel manufactured from fibres of wood or other ligno-cellulosic materials with the
primary bond deriving from the felting of the fibres and their inherent adhesive properties (although bonding materials and/or additives may be added in the manufacturing process). It includes fibreboard panels that are flat-pressed and moulded fibreboard products. It is an aggregate comprising hardboard, medium-density fibreboard (MDF) and other fibreboard.
6.4.1 HARDBOARD Wet-process fibreboard of a density exceeding 0.8 g/cm3. It excludes similar products
made from pieces of wood, wood flour or other ligno-cellulosic material where additional binders are required to make the panel; and panels made of gypsum or other mineral material.
6.4.2 MEDIUM-DENSITY FIBREBOARD (MDF) Dry-process fibreboard. When density exceeds 0.8 g/cm3, it may also be referred to as
high-density fibreboard (HDF).
6.4.3 OTHER FIBREBOARD Wet-process fibreboard of a density not exceeding 0.8 g/cm3. This includes medium
board and softboard (also known as insulating board).
7 WOOD PULP Fibrous material prepared from pulpwood, wood chips, particles or residues by
mechanical and/or chemical process for further manufacture into paper, paperboard, fibreboard or other cellulose products. It is an aggregate comprising mechanical wood pulp; semi-chemical wood pulp; chemical wood pulp; and dissolving wood pulp.
7.1 MECHANICAL WOOD PULP Wood pulp obtained by grinding or milling pulpwood or residues into fibres, or
through refining chips or particles. Also called groundwood pulp and refiner pulp, it may be bleached or unbleached. It includes chemi-mechanical and thermo-mechanical pulp. It excludes exploded and defibrillated pulp.
7.2 SEMI-CHEMICAL WOOD PULP Wood pulp obtained by subjecting pulpwood, wood chips, particles or residues to
a series of mechanical and chemical treatments, none of which alone is sufficient to make the fibres separate readily. It may be bleached or unbleached. It includes chemi-groundwood pulp, chemi-mechanical wood pulp, etc. (named in the order and importance of the treatment during the manufacturing process).
7.3 CHEMICAL WOOD PULP Wood pulp obtained by subjecting pulpwood, wood chips, particles or residues to a
series of chemical treatments. It includes sulphate (kraft) wood pulp; soda wood pulp and sulphite wood pulp. It may be bleached, semi-bleached or unbleached. It excludes dissolving grades of wood pulp. It comprises unbleached sulphite pulp; bleached sulphite pulp; unbleached sulphate pulp; and bleached sulphate pulp.
103 Forestry in the EU and the world — a statistical portrait
Annexes
7.4 DISSOLVING GRADES Chemical pulp (sulphate, soda or sulphite) made from wood of special quality, with
a very high alpha-cellulose content (usually 90 % or over). This type of pulp is always bleached and is readily adaptable for uses other than papermaking. It is used principally as a source of cellulose in the manufacture of products such as synthetic fibres, cellulose plastic materials, lacquers and explosives.
8 OTHER PULP Pulp manufactured from waste paper or from fibrous vegetable materials other than
wood and used for the manufacture of paper, paperboard and fibreboard. It is an aggregate comprising pulp from fibres other than wood and recovered fibre pulp.
8.1 PULP FROM FIBRES OTHER THAN WOOD Pulp manufactured from fibrous vegetable materials other than wood and used for
the manufacture of paper, paperboard and fibreboard. It excludes pulp made from recovered paper. It includes pulp made from: straw; bamboo; bagasse; esparto; other reeds or grasses; cotton fibres; flax; hemp; rags; and other textile wastes.
8.2 RECOVERED FIBRE PULP Pulp manufactured from recovered paper or paperboard and used for the manufacture
of paper, paperboard and fibreboard. It excludes pulp made from straw; bamboo; bagasse; esparto; other reeds or grasses; cotton fibres; flax; hemp; rags; and other textile wastes.
9 RECOVERED PAPER Waste and scraps of paper or paperboard that have been collected for re-use or trade. It
includes paper and paperboard that has been used for its original purpose and residues from paper and paperboard production.
10 PAPER AND PAPERBOARD This is an aggregate category. It covers the sum of graphic papers; sanitary and household
papers; packaging materials and other paper and paperboard. It excludes manufactured paper products such as boxes, cartons, books and magazines, etc.
10.1 GRAPHIC PAPERS This is an aggregate category. It covers the sum of newsprint; uncoated mechanical;
uncoated woodfree and coated papers. Products in this category are generally manufactured in strips or rolls of a width exceeding 15 cm or in rectangular sheets with one side exceeding 36 cm and the other exceeding 15 cm in the unfolded state. It excludes manufactured paper products such as books and magazines, etc.
10.1.1 NEWSPRINT Paper mainly used for printing newspapers. It is made largely from mechanical pulp
and/or recovered paper, with or without a small amount of filler. Products in this category are generally manufactured in strips or rolls of a width exceeding 36 cm or in rectangular sheets with one side exceeding 36 cm and the other exceeding 15 cm in the unfolded state. Weights usually range from 40 to 52 g/m2 but can be as high as 65 g/m2. Newsprint is machine finished or slightly calendered, white or slightly coloured and is used in reels for letterpress, offset or flexo printing.

104 Forestry in the EU and the world — a statistical portrait
Annexes
10.1.2 UNCOATED MECHANICAL Paper suitable for printing or other graphic purposes where less than 90 % of the fibre
furnish consists of chemical pulp fibres. This grade is also known as groundwood or wood-containing paper and magazine paper, such as heavily filled supercalendered paper for consumer magazines printed by the rotogravure and offset methods. It excludes wallpaper bases.
10.1.3 UNCOATED WOODFREE Paper suitable for printing or other graphic purposes, where at least 90 % of the fibre
furnish consists of chemical pulp fibres. Uncoated woodfree paper can be made from a variety or furnishes, with variable levels of mineral filler and a range of finishing processes such as sizing, calendering, machine glazing and watermarking. This grade includes most office papers, such as business forms, copier, computer, stationery and book papers. Pigmented and size press coated papers (coating less than 5 g per side) are covered by this heading. It excludes wallpaper bases.
10.1.4 COATED PAPERS All paper suitable for printing or other graphic purposes and coated on one or both
sides with carbon or minerals such as china clay (kaolin), calcium carbonate, etc. Coating may be by a variety of methods, both on-machine and off-machine, and may be supplemented by supercalendering. It includes raw carbon and self-copy paper in rolls or sheets. It excludes other copying and transfer papers.
10.2 SANITARY AND HOUSEHOLD PAPERS This covers a wide range of tissue and other hygienic papers for use in households
or commercial and industrial premises. Products in this category are generally manufactured in strips or rolls of a width exceeding 36 cm or in rectangular sheets with one side exceeding 36 cm and the other exceeding 15 cm in the unfolded state. Examples are toilet paper and facial tissues, kitchen towels, hand towels and industrial wipes. Some tissue is also used in the manufacture of baby napkins, sanitary towels, etc. The parent reel stock is made from virgin pulp or recovered fibre or mixtures of these.
10.3 PACKAGING MATERIALS Paper or paperboard mainly used for wrapping and packaging purposes. Products in
this category are generally manufactured in strips or rolls of a width exceeding 36 cm or in rectangular sheets with one side exceeding 36 cm and the other exceeding 15 cm in the unfolded state. It excludes unbleached kraft paper and paperboard that are not sack kraft paper or kraftliner and weighing more than 150 g/m² but less than 225 g/m²; felt paper and paperboard; tracing papers; not further processed uncoated paper weighing 225 g/m² or more.
10.3.1 CASE MATERIALS Papers and boards mainly used in the manufacture of corrugated board. They are made
from any combination of virgin and recovered fibres and can be bleached, unbleached or mottled. It includes kraftliner, testliner, semi-chemical fluting, and waste-based fluting (Wellenstoff).
105 Forestry in the EU and the world — a statistical portrait
Annexes
10.3.2 CARTONBOARD Sometimes referred to as folding boxboard, it may be single- or multi-ply, coated or
uncoated. It is made from virgin and/or recovered fibres, and has good folding properties, stiffness and scoring ability. It is mainly used in cartons for consumer products such as frozen food and for liquid containers. It includes paper and paperboard covered or coated with plastics (excluding adhesives) and coated multi-ply.
10.3.3 WRAPPING PAPERS Wrappings (up to 150 g/m2): papers whose main use is wrapping or packaging made
from any combination of virgin or recovered fibres, bleached or unbleached. They may be subject to various finishing and/or marking processes. It includes sack kraft, other wrapping krafts, sulphite and greaseproof papers as well as coated paper and paperboard not uniformly bleached throughout the mass, except multi-ply. It excludes tracing papers.
10.3.4 OTHER PAPERS MAINLY FOR PACKAGING This category embraces all papers and boards mainly for packaging purposes other
than those listed above. Most are produced from recovered fibres, for example, greyboards, and go for conversion, which in some cases may be for end-uses other than packaging.
10.4 OTHER PAPER AND PAPERBOARD N.E.S. Other papers and boards for industrial and special purposes. It includes cigarette papers
and stock of filter papers, as well as gypsum liners and special papers for insulating, roofing, and other specific applications or treatments; wallpaper base; unbleached kraft paper and paperboard that are not sack kraft paper or kraftliner and weighing more than 150 g/m² but less than 225 g/m²; felt paper and paperboard; tracing papers; not further processed uncoated paper weighing 225 g/m² or more; and raw copying and transfer papers, in rolls or sheets except carbon or self-copy paper. It excludes all composite, not coated, paper and paper board of flat layers stuck together; coated paper and paperboard not uniformly bleached throughout the mass; and paper and paperboard covered or coated with plastics (excluding adhesives).

106 Forestry in the EU and the world — a statistical portrait
Annexes
Statistical symbols, abbreviations and acronyms
AWU annual work unitsCEPI confederation of European paper industries CHP combined heat and powerCIF cost, insurance and freightDR Democratic Republic (of Congo)EA euro areaEA-17 euro area of 17 Member States including Belgium, Germany, Estonia, Ireland,
Greece, Spain, France, Italy, Cyprus, Luxembourg, Malta, the Netherlands, Austria, Portugal, Slovenia, Slovakia and Finland; note that unless otherwise stated, the euro area (EA) aggregate in this publication refers to 17 countries, as if all 17 of these had been part of the euro area in periods prior to 1 January 2011.
equip. equipmentEU European UnionEU-27 European Union of 27 Member States including Belgium, Bulgaria, the Czech
Republic, Denmark, Germany, Estonia, Ireland, Greece, Spain, France, Italy, Cyprus, Latvia, Lithuania, Luxembourg, Hungary, Malta, the Netherlands, Austria, Poland, Portugal, Romania, Slovenia, Slovakia, Finland, Sweden and the United Kingdom; note that unless otherwise stated, the EU aggregate in this publication refers to 27 countries, as if all 27 of these had been part of the EU in periods prior to 1 January 007
FLEGT Forest Law Enforcement Governance and TradeFAO Food and Agriculture Organization (of the United Nations)FOB free on boardFRA Forest Resources AssessmentFYR (1) former Yugoslav Republic (of Macedonia)grow. growingIPCC Intergovernmental Panel on Climate ChangeISIC International Standard Industrial ClassificationITTO International Tropical Timber OrganizationJWEE Joint Wood Energy EnquiryMCPFE Ministerial Conference on the Protection of Forests in Europe MDF medium-density fibreboardNACE statistical classification of economic activities in the European Communityn.e.s. not elsewhere specifiedOSB oriented strand board
(1) the name of the former Yugoslav republic of macedonia is shown in tables as fYr of macedonia – this does not prejudge in any way the definitive nomenclature for this country, which is to be agreed following the conclusion of negotiations currently taking place on this subject at the united nations.

107 Forestry in the EU and the world — a statistical portrait
Annexes
priv. privately (owned)pub. publicly (owned)Rev. RevisionSITC Standard International Trade ClassificationSoEF2011 State of Europe’s Forests 2011toe tonnes of oil equivalentsUN United NationsUNCED United Nations Conference on Environment and DevelopmentUNECE United Nations Economic Commission for EuropeUNFCCC United Nations Framework Convention on Climate Change UNIDO United Nations Industrial Development Organization
Carbon conversion factors
The following table provides default factors used to convert from various product units (cubic metres, tonnes, etc.) into a single harmonised unit of carbon – for example, as used when calculating supply balances (see the start of Chapter 3).
default factors to convert from product units to carbon
Charcoal
Average for
wood panels
Paper &paperboard,
pulp, recovered fibre,
recoveredpaper
Temperate species
Tropical species
0.45 oven-dry
tonne m-³
0.59 oven-dry
tonne m-³
2. Carbon fraction(tonnes carbon per oven-dry tonne of wood material)
0.5 0.5 0.85 0.468 0.5
3. Carbon factor(tonnes carbon per m³ of product or per air-dry tonne of product)(row 1) x (row 2)
A = 0.225
tonne C m-³
A = 0.295
tonne C m-³
B = 0.765 tonne C
(air-dry tonne)-1
C = 0.294
tonne C m-³
D = 0.450 tonne C
(air-dry tonne)-1
Roundwood,industrial roundwood,
sawnwood, other industrial roundwood,
pulpwood, chips, particles, fuelwood, wood residues
1. Density (oven-dry tonnes per m³ of solid wood product or oven-dry per air-dry tonne of pulp or paper product)
0.9 oven-dry tonne
(air-dry tonne)-1
0.9 oven-dry tonne
(air-dry tonne)-1
0.628 oven-dry
tonne m-³
Source: iPcc guidelines, 2006


European Commission
Forestry in the EU and the world — A statistical portrait
Luxembourg: Publications Office of the European Union, 2011
2011 — 107 pp. — 14.8 x 21 cm
Theme: Agriculture and fisheries Collection: Statistical books
ISBN 978-92-79-19988-2doi:10.2785/13022 Cat. No KS-31-11-137-EN-C

HOW TO OBTAIN EU PUBLICATIONS Free publications: • via EU Bookshop (http://bookshop.europa.eu);
• at the European Union’s representations or delegations. You can obtain their contact details on the Internet (http://ec.europa.eu) or by sending a fax to +352 2929-42758.
Priced publications: • via EU Bookshop (http://bookshop.europa.eu).
Priced subscriptions (e.g. annual series of the Official Journal of the European Union and reports of cases before the Court of Justice of the European Union): • via one of the sales agents of the Publications Office of the European Union
(http://publications.europa.eu/others/agents/index_en.htm).

St atist ical book s
Forestry in the EU and the world
2011 edition
A statistical portrait
Forestry in the EU and the worldA statistical portrait
The International Year of Forests 2011 is a UN initiative reinforcing the message that forests are vital to the survival and well-being of mankind. This Eurostat publication supports the UN initiative by statistically depicting forests in their various dimensions.
Forests have a variety of ecological functions, serving as habitats for plant and animal species, helping to protect water and soil resources, as well as contributing to the fight against climate change. On the other hand, forests are an important economic factor as suppliers of wood and other forest products.
Forests and other wooded land cover more than 40 % of the EU’s land area, and the EU is set apart from many other global regions insofar as it is one of the few regions of the world where forest area is currently expanding. This publication presents information for the EU and its Member States, as well as comparisons with countries that have considerable forest resources.
http://ec.europa.eu/eurostat
Forestry in the EU and the w
orld ■ A
statistical portrait
KS-31-11-137-EN-C
2011 edition9 7 8 9 2 7 9 1 9 9 8 8 2