forestry department - us forest service department food and agriculture organization of the united...
TRANSCRIPT

Forestry Department Food and Agriculture Organization of the United Nations
Fire Management Working Papers
Global Forest Resources Assessment 2005 – Report on fires in the
North American Region
by R. Martínez, B.J. Stocks
and D. Truesdale
March 2006
Forest Resources Development Service Forest Resources Division Forestry Department
Working Paper FM/15/EFAO, Rome, Italy
Disclaimer The Fire Management Working Papers report on issues addressed in the work programme of FAO. These working papers do not reflect any official position of FAO. Please refer to the FAO website (www.fao.org/forestry) for official information. The purpose of these papers is to provide early information on on-going activities and programmes, and to stimulate discussion. Comments and feedback are welcome. For further information please contact: Mr. Petteri Vuorinen, Forestry Officer (Forest Fire Management) Mr. Peter Holmgren, Chief Forest Resources Development Service Forest Resources Division, Forestry Department FAO Viale delle Terme di Caracalla I-00100 Rome, Italy e-mail: [email protected] [email protected] or: FAO Publications and Information Coordinator: [email protected] For quotation:
FAO (2006). Global Forest Resources Assessment 2005 – Report on fires in the North American Region. Fire Management Working Paper 15. www.fao.org/forestry/site/fire-alerts/en
© FAO 2006
iii
FOREWORD
Fires impact upon livelihoods, ecosystems and landscapes. Despite incomplete and inconsistent data, it is estimated that 350 million hectares burn each year; however, the nature of fires determines whether their social, cultural, environmental and economic impacts are negative or positive. Up to 90 percent of wildland fires are caused by human activities primarily through uncontrolled use of fire for clearing forest and woodland for agriculture, maintaining grasslands for livestock management, extraction of non-wood forest products, industrial development, resettlement, hunting and arson - thus any proactive fire management needs to adopt integrated, inter-sectoral, multi-stakeholder and holistic approaches. The situation varies markedly in different regions of the world. As a supplement and complement to the Global Forest Resources Assessment, 2005, this working paper is one of a series of twelve prepared by regional and country contributing authors to provide a greater depth of data and information on fire incidence, impact, and management issues relating to the twelve UN-ISDR Regional Wildland Fire Networks around the world. The working paper series assesses the fire situation in each wildland fire region, including the area extent, number and types of fires and their causes. The positive and negative social, economic and environmental impacts are outlined. Prediction, preparedness and prevention as key elements in reduction of the negative impacts of fire, rapid response to extinguish fire incidents and restoration following fires are addressed. The working paper series also addresses institutional capacity and capability in wildland fire management, including the roles and responsibilities of different stakeholder groups for prevention and suppression, particularly the unique role of community-based fire management. From these working papers, a FAO Forestry Paper on Fire Management will synthesize the highlights from each region, but also provide a global summary of important lessons that can be used in fire management in the future. These papers are a valuable resource in the process to prepare the Fire Management Code, the Global Strategy to Enhance International Cooperation in Implementing the Fire Management Code and associated capacity building.

iv
ACKNOWLEDGEMENTS
This working paper is the product of a global team of dedicated people willingly giving of their time and specialist expertise within each of the twelve UN-ISDR Regional Wildland Fire Networks. R. Martínez, B.J. Stocks and D. Truesdale, as the authors, obtained key information and data for this working paper from Canada, Mexico and the United States of America. We wish to acknowledge the dedicated work of Johann G. Goldammer, Global Fire Monitoring Center (GFMC), for contributing materials and for reviewing this working paper. We also wish to thank Michèle Millanès for the excellent editing and formatting undertaken. To all persons who contributed to this working paper, we express our grateful thanks.

v
TABLE OF CONTENTS 1. BACKGROUND......................................................................................................................................... 1
2. INTRODUCTION ...................................................................................................................................... 1
3. CANADA..................................................................................................................................................... 2 3.1 Introduction................................................................................................................................... 2 3.2 The Evolution of Twentieth Century Canadian Forest Fire Management ........................... 3 3.3 Fire Management Jurisdictions in Canada .............................................................................. 4 3.4 Extent and Impact of Forest Fires in Canada.......................................................................... 5 3.5 Emerging Forest Fire Issues in Canada................................................................................... 8
4. MEXICO ................................................................................................................................................... 10 4.1 Introduction................................................................................................................................. 10 4.2 Ecosystems and Fire Regimes................................................................................................ 10 4.3 Fire Statistics.............................................................................................................................. 11 4.4 Fire Detection and Fire Behaviour .......................................................................................... 13 4.5 Fire Effects and Damages........................................................................................................ 13 4.6 Prescribed Burning .................................................................................................................... 14 4.7 Fire Management Capabilities ................................................................................................. 15 4.8 Roles and Responsibilities ....................................................................................................... 16 4.9 National Level Training Courses ............................................................................................. 17
5. UNITED STATES OF AMERICA (USA).............................................................................................. 18 5.1 Introduction................................................................................................................................. 18 5.2 Fire Statistics.............................................................................................................................. 18 5.3 The National Fire Plan .............................................................................................................. 21 5.4 Fuel Management and Prescribed Burning ........................................................................... 23 5.5 Fire management roles and capabilities ................................................................................ 24 5.6 Collaboration .............................................................................................................................. 25 5.7 Community Involvement ........................................................................................................... 25 Annex 1: Wildland Fire Statistics .......................................................................................................... 27 Annex 2: Fuel Treatment Statistics ...................................................................................................... 30

1
1. Background Following the release of the Global Forest Resources Assessment 2000 (FRA 2000) report in 2001, the global FRA process has entered its next reporting cycle. Recommendations from the Kotka IV Expert Consultation in July 2002 on directions of global FRA’s were confirmed by FAO’s Committee on Forestry (COFO) in 2003. It included to embark on an update of the global FRA for the year 2005 (FRA 2005) and to increasingly involve countries directly in the assessment and reporting, in particular to submit national reports on the status and trends of a range of forestry parameters. More information about FRA 2005 is available at www.fao.org/forestry/fra. FRA 2005 also includes thematic studies, including e.g. forest fire, forests and water, and mangroves. The thematic study on forest fire is built on regional reviews of forest fire management. The current report is a contribution and makes a review of the North American region. This Working Paper FM/15/E has been written by R. Martínez, B.J. Stocks and D. Truesdale and does not reflect any official position of FAO. 2. Introduction This report provides an overview of the fire management situation in the region. The report explains the variety of measures each country is implementing to address a complex and challenging situation. The report focuses on wildland fire and fire suppression, but also highlights other related issues of forest and ecosystem health and the need for a regular occurrence of fire for ecosystem sustainability. The North American (NA) region forms the North American Regional Wildland Fire Network and includes Canada, Mexico, and the United States of America (USA). Mexico is also a member of the Mesoamerican Region and actively participates in both networks. The three countries represent a wide range of ecosystems, climate, topography, and fire occurrence. Forests cover a significant part of this region. From the boreal forests in northern Canada and Alaska to the tropical rain forests in southern Mexico, the region provides a vast array of fire management challenges. The three countries are members of the North American Forest Commission. The Fire Management Working Group was established over 40 years ago and continues to be active. The Working Group meets annually to plan exchanges, training, study tours and other cooperative activities. The Working Group is also the primary sponsor for the International Wildland Fire Conferences held in Boston, USA; Vancouver, Canada; Sydney, Australia; the 4th meeting is planned to be held in Madrid, Spain in 2007. The borders between Canada and the USA and between Mexico and the USA are covered by international agreements that authorize the exchange of fire fighters and provide for assistance on fires that cross international boundaries. There are national level agreements and also local agreements between adjoining jurisdictions to address local needs. As a result, fire suppression resources in any of the three member countries are available to respond to neighbouring jurisdictions as long as the terms of the agreements are met. The countries are able to work together on fire suppression because they each have adopted the Incident Command System (ICS). ICS is a management system used to organize and plan the tactical and strategic response to wildland fires. By using the same system, personnel from other jurisdictions are able to blend into the responding organization and work together. Websites are listed throughout the report, some are the sources of the data and some contain additional background information. The reader is encouraged to review them.

2
3. Canada 3.1 Introduction Canada is a large country that is highly dependent on its extensive forest land base for both economic purposes and a broad range of societal values. The evolution of forest management in Canada, particularly over the past century, has been accompanied by a parallel growth in the development of forest fire management programmes designed to protect forests from unwanted fire. This report traces the development of the varied fire management programmes in Canada, along with the trends in fire causes, occurrence and area burned since the advent of modern fire management practices. The report also focuses on what is unique about Canadian forests and the fire management practices that are adapted to accommodate this uniqueness. Consideration of the natural and essential role of fire in many ecosystems in Canada is central to understanding the extent and impacts of fires in this country. Such awareness is also key to understanding the philosophy of fire management practices in Canada. Canada has a land base of 910 million ha, of which 402 million ha are forests or other wooded land, and with an unevenly distributed population of approximately 31 million people, located mostly close to the border with the United States and some distance from Canada's primary forests. Canada is a forest nation, with forests being intimately linked to the country's cultural, economic and social development over the past one to two centuries. More than 93% of the forest land in Canada is publicly owned, the vast majority being owned and managed by provincial and territorial governments, with a small proportion (e.g. national parks and First Nations lands) under federal responsibility. The remaining forest land (7%) is privately owned. A large percentage of Canadian forests, particularly in the far northern regions of the country, are only marginally productive and do not form a part of the country's commercial forest lands. There is continuing public debate over the management of Canada's forests. Governments search for a balance among preservation of environmental quality, enhancement of economic wealth, and development of social benefits. However, the importance of Canadian forests from an economic standpoint is beyond question, with the Can$74 billion forest industry directly employing 376 300 people across the country in 2003, while contributing Can$30 billion to Canada's positive trade balance and Can$34 billion to Canada’s Gross Domestic Product. The economic and recreational importance of this resource, along with the need to protect life and property, are the primary reasons Canada has developed one of the world's most sophisticated forest fire management programs. Forest fires have been a dominant disturbance regime in Canadian forests since the last Ice Age around 10 000 years ago. Fire is natural and essential across much of Canada’s forested landscape, and along with insects, disease, wind, and natural regeneration, helped to shape the character of Canadian forests before the country was settled. Fire is particularly significant in Canada’s vast boreal forest region, where primary boreal species such as pine, spruce, birch, and aspen have adapted to fire to the point where it is essential to their existence, and adequate species regeneration requires the high-intensity crown fires natural to this region. Periodic lower-intensity fires are also required to maintain surface fire regimes in other forest regions of Canada. Fire organizes the physical and biological attributes of the boreal biome, shaping landscape diversity and influencing energy flows and biogeochemical cycles, particularly the carbon cycle. Canadian forests are therefore strongly connected to the fire regime, and are dependent on the frequency, extent, and severity of forest fires. In Canada, and across the circumpolar boreal zone, maintenance of natural forests, and the processes that support their existence, is crucial to maintaining a balanced global terrestrial biosphere. However, Canada is a forest nation, with the industrial use of forests being intimately linked to the country’s cultural, economic and social development. Forest industry expansion across Canada over the past century has resulted in the forest sector becoming the largest contributor to Canada’s positive trade balance. Forest recreation is also an expanding Canadian activity. Clearly, such extensive utilization of the forest requires adequate protection from fire. Reconciling the natural role of fire in ecosystem maintenance with the need to protect life, property, and valuable products derived from the forest is a complex challenge.

3
This report summarizes fire statistics for Canada over much of the past century, and places this fire activity within the broader context of forest and fire management in a country where forest fires are both natural and essential to forest ecosystem maintenance and health. This requires balancing both fire suppression and fire maintenance, a difficult and constantly challenging undertaking. Although Canadian fire management agencies are among the most efficient in the world, they face new and emerging challenges in the near future, and these are explored as well. 3.2 The Evolution of Twentieth Century Canadian Forest Fire Management Before European settlement of the country, the character of Canada's forests was shaped primarily by natural forces such as fire, insects, disease, wind, and natural regeneration. Initially, fire was used extensively by settlers to convert forested areas into farmland for agricultural or livestock production. The advent of modern forest management in Canada, based on European forestry practices in which the value of fire exclusion was seen as self-evident, in combination with numerous disastrous wildfires in the late 1800s and early 1900s, resulted in the development and implementation of a fire exclusion policy in this country by the early 1900s. Throughout the 1800s, as Canadian settlements expanded westward, numerous devastating wildfires, often associated with land clearing, caused extensive loss of life and property. Some prominent examples include the Miramichi Fire of 1812 in New Brunswick and the Lac St-Jean Fire of 1870 in Quebec. This trend continued into the early 1900s, with major fires in northeastern Ontario, east-central Alberta, and central British Columbia that resulted in the burning of complete towns with substantial loss of life. This, along with the need to protect an expanding forest industry, which contributed significantly to the economic well-being of Canada, prompted the development of fire control organizations across the country. Use of Canadian forests, for both industrial and recreational purposes, has increased dramatically in the past century. Along with the increased access and utilization has come a concurrent increase in forest fire incidence and the fire suppression capability mobilized to address this problem. Organized fire suppression became more successful, but significant wildfire years were common. During periods of extreme fire weather, Canadian forests continued to sustain the large, high-intensity wildfires to which they had become adapted over millennia. During the 1970s there was a growing realization in Canada that total fire exclusion was neither economically feasible nor ecologically desirable. The pursuit of this goal had entailed considerable social and economic costs and, despite constantly increasing expenditures, there was no corresponding decrease in the number and impact of forest fires. This was coupled with an increasing awareness of the important and natural role of fire in maintaining forest health, productivity, and biodiversity, particularly in the boreal and temperate forest regions of Canada. These changes led to the evolution of a new fire management strategy in which consideration is given to the ecological role of fire, the economics of fire suppression, and the priority of values-at-risk. At the top end of the priority scale an ever-increasing number of wildland-urban interface (WUI) areas, and high-value forest industry and recreational sites receive vigorous protection. On the other hand, fire is often allowed to operate naturally in lower priority areas such as wilderness parks or remote forested areas of limited economic value where fire is a natural and necessary shaper of forest ecosystems. This policy of "modified suppression" is in effect in the northern regions of the provinces of Quebec, Ontario, Manitoba, and Saskatchewan, as well as most parts of the Northwest and Yukon Territories To understand the evolution and present state of fire management in Canada, it is necessary to first understand the environment within which it functions. Although Canada shares many characteristics with other countries in the arctic and north temperate zones, a particular combination of circumstances makes Canada somewhat unique from a wildland fire perspective. Dominant attributes of the sociological, geographic, and fire environments include:
• a low population density, except for southern Canada, • both high- and low-value resource areas, • a well-developed technological infrastructure, • vast areas to manage, coupled with limited resources, • long, often roadless, distances to be patrolled and traversed, • numerous lakes and rivers (east); fewer lakes and rivers (west), • significant numbers of human and natural ignition sources,

4
• boreal forests with a tendency towards stand-replacing crown fires, and • occasional periods of extreme fire weather.
From a fire management perspective, most of these attributes could be classed as liabilities. Only the technological infrastructure and good distribution of water sources (in the east) could be viewed as assets. Collectively, these attributes provide the context for the evolution of Canadian fire management. 3.3 Fire Management Jurisdictions in Canada In Canada, responsibility for forest management, and therefore fire management rests with each of 13 autonomous provinces and territories, as the bulk of forested land in Canada is public, and owned by the provinces/territories. The federal government, after turning over responsibility for forest protection in western Canada to provincial agencies in the 1930s, is responsible for fire management on federal lands (National Parks and First Nations reserves, Department of National Defense). In National Parks an emphasis is placed on maintaining ecological integrity by reintroducing periodic landscape-scale fire through prescribed burning and wildfire monitoring. In addition, 80% of aboriginal communities are located in forested areas and these communities negotiate agreements for protection. While provincial governments in Canada have the primary responsibility for forest fire management, the federal government has a primary responsibility for the health and safety of Canadians, and is also the “insurer” of last resort in providing disaster assistance. A number of federal agencies are involved in some aspect of wildland fire. Fire suppression costs are constantly rising in Canada, due to a number of factors, including changes in fire weather, the use of more costly equipment, the expansion of fire protection zones northward to match growing forest operations, and increased costs associated with protection of an expanding wildland-urban interface. Annual suppression costs, not including public and industrial losses, are highly variable annually, but are averaging Can$500 million (Figure 1) and can be as much as Can$1 billion in an extreme fire season. The provinces of British Columbia, Ontario, Alberta and Quebec generally account for approx. 80% of total Canadian fire management expenditures.
Figure 1: Protection expenditures (xCan$1 000) in Canada (1990-2001) by province and territory.
Source: Canadian Council of Forest Ministers 2004.
$0
$100,000
$200,000
$300,000
$400,000
$500,000
$600,000
$700,000
$800,000
$900,000
$1,000,000
1990 1991 1992 1993 1994 1995 1996 1997 1998 1999 2000 2001
Alta.B.C.Sask.Que.Ont.N.B.Nfld.YukonN.S.P.E.I.Man.N.W.T.

5
The nationally decentralized provincial fire management systems work quite efficiently in low and moderate seasons; by when fire activity becomes extreme, provinces rely on one another to supplement suppression resources. After a series of major fire seasons in the early 1980s, the Canadian Committee of Resource and Environment Ministers created the Canadian Interagency Forest Fire Centre (CIFFC) in 1981. Located in Winnipeg, CIFFC is a cooperative venture established to share information and fire management resources among its federal, provincial, and territorial member agencies. Over the past two decades, CIFFC has made a major contribution to fire management in Canada by conducting information and resource exchanges (including personnel, equipment and aircraft), establishing national standards for equipment and personnel, negotiating a pre-arranged cost recovery system, formulating working groups to address common interagency issues, and serving as a contact point for international requests and cooperation. Agencies have increasingly recognized that there are considerable economic efficiencies to be gained (estimated to be millions of dollars annually) in risk management by sharing resources through CIFFC and these practices have become an important part of the fire management business. Over the past 80 years, Canadian fire management agencies have grown in size and sophistication to address expanding responsibilities in protecting Canadian forests from unwanted fires. Operational fire managers and fire scientists in Canada have worked closely together to develop highly sophisticated systems to predict the occurrence, behaviour, and impact of forest fires in various ecosystems across the country. Two key objectives in successfully controlling fires are early detection and initial attack when fires are small. This involves prediction of the most likely locations where fires will start (both lightning and human-caused fires), and the implementation of enhanced detection (primarily aircraft patrols) in those areas. When fires are detected, initial attack forces are deployed by land or helicopter, and are often supported by aircraft dropping water, foam, or fire retardant chemicals. 3.4 Extent and Impact of Forest Fires in Canada Canadian fire management agencies have been largely successful in controlling a major percentage of the fires that occur in high-value areas of the country. However, extreme fire danger conditions, often coupled with multiple fire starts, occasionally overwhelm fire suppression resources, and large areas burn. Forest fire statistics have been archived since 1920 in Canada. Prior to the advent of satellite coverage in the early 1970s, it is believed that many fires in remote regions were not detected or monitored, such that the record for this period is somewhat incomplete. Bearing this in mind, the annual number of recorded fires in Canada (Figure 2) has increased rather steadily from around 6 000 fires in the 1930-1960 period, to an average of around 9 000 fires during the 1970-2000 period, most likely the result of a growing population and expanded forest use, along with an increased detection capability. From Figure 1, it is also evident that the area burned by Canadian forest fires fluctuates greatly from year to year, from under 0.5 million hectares to more than 7 million hectares in extreme years. In comparison to the 1950s and 1960s, average annual area burned has been increasing over the past three decades (Figure 3). Major fire years occurred in 1980, 1981, 1989, 1994, 1995, and 1998. During the 2000-2004 period, unofficial statistics indicate annual averages of 7 321 fires and 1 689 424 hectares burned. Although variable between regions of the country, lightning is responsible for an average of 35% of Canadian fires, yet lightning fires account for 85% of the total area burned. This is due to the fact that lightning fires occur randomly, often in significant numbers, over large areas, presenting access problems not usually associated with human-caused fires. As a result, lightning fires often grow larger, as detection and subsequent initial attack is often more delayed. Lightning fires dominate in the northern remote regions of Canada where population levels are low. Recreational activities, forest industry operations, and homeowners living in or near the forest, are primarily responsible for accidental human-caused fires occurrence, which dominates in the intensively protected forest regions of Canada.

6
Figure 2: Annual number of fires and area burned in Canada 1920-2004 (post-2000 statistics are not yet official).
Canadian Forest Fire Activity
0
5000
10000
15000
20000
25000
30000
1920s 1930s 1940s 1950s 1960s 1970s 1980s 1990s
Area Burned (sq km) Number of Fires
Figure 3: Annual number of fires and area burned in Canada, averaged by decades (1920s through 1990s).
The sophisticated fire suppression systems in place across Canada are largely successful, in that the vast majority of fires (approx. 97%) are contained at an early stage (<200 hectares). However, the approx. 3% of fires that exceed 200 hectares in size, account for around 97% of the total area burned. Over the past four decades, an average of approx. 2 million hectares burned annually in Canada, with close to 50% of this area burning in remote “modified suppression” zones, primarily in the northern regions of west-central Canada. The contribution of these fires to the total area burned in

7
Canada can be seen in Figure 4, which shows the distribution of 1959-1997 large fires (>200 hectares in size) across Canada.
Figure 4: Distribution of fires >200 ha (black polygons) during the 1980-2001 period. Clearly, the largest areas burned occurred in west-central Canada, in a band running from northwestern Ontario through northern Manitoba and Saskatchewan into the Northwest Territories, regions containing large areas where extreme fire weather and lightning activity are common, values-at-risk to not warrant aggressive fire suppression, and fires most often burn naturally. Most forested regions of southern Canada sustained fewer large fires as a result of intensive protection, although large fires are still a factor in these areas. Fires in excess of 100 000 hectares are not uncommon in Canada, and fires exceeding 1 million hectares have been recorded. The difference in fire dynamics between the intensively protected regions of Canada and those areas where “modified” suppression is practiced and fires for the most part burn naturally is evident from Figure 5. Although the number of fires occurring in “modified” zones is much smaller than in the intensively protected regions, the area burned is larger, primarily due to the policy of letting fires burn naturally where possible. Fires in “modified” suppression zones are generally only attacked when they threaten communities, and even then, usually only in a “defensive” mode.

8
Figure 5: Area burned and number of fires in Canada by protection response (full or modified) for the 1990-2003 period.
Source: Canadian Council of Forest Ministers 2004 3.5 Emerging Forest Fire Issues in Canada Public awareness of forest issues in Canada, including fire management practices, has been growing quickly in recent years, partly due to the success of public awareness programmes and expanded media coverage. This is particularly true with First Nations peoples, forest land owners, and ex-urbanites moving to the Wildland Urban Interface (WUI). All expect to be consulted before new policies are initiated, and involved in this process. In addition, they expect that the protection and defense of their immediate values is the responsibility of the government. This growing emphasis on a civil society, with a greater public role/responsibility in resource management decision-making, requires fire management agencies to emphasize the inclusion of all stakeholders in policy development. It also requires an informed public that understands that not all fires are bad and that fire suppression effectiveness has limits. Across Canada the growing emphasis on public safety has made wildland fire an issue for all levels of government (federal, provincial/territorial, and municipal), and they are now working more closely together to maximize effectiveness. The successful suppression of fire in many regions of Canada has led to a shift to older age classes or forests in later successional stages, particularly in forests normally maintained by periodic surface fires. This could lead to significant changes in wildfire potential and resultant fire regimes, as increasing fuel accumulation levels would result in fires of higher intensity, increasing control difficulties and escaped fires. Fire exclusion in many ecosystems creates an environment favourable to the development of major insect infestations over large areas (e.g. the Mountain Pine Beetle in western Canada, and the Eastern Spruce Budworm in eastern Canada), which in turn is often followed by large fires fuelled by excessive dead woody material. Canadian forests are now exposed to increasing and competing demands on the land-base. Forest industry is under pressure to continually increase wood supply to meet market demands while accessible Canadian forests are almost fully committed, and international competition is increasing. There is growing pressure from environmental groups and the public in general to set aside and protect more forest areas for recreational activities, biodiversity conservation etc. Aboriginal groups also require expanded access to forest lands for traditional pursuits, including the growing Non-Timber Forest Products (NTFP) industry.
0
2,000
4,000
6,000
8,000
10,000
12,000
19901991
19921993
19941995
19961997
19981999
20002001
20022003
Year
Num
ber o
f Fire
s
Full Modified
0
1,000,000
2,000,000
3,000,000
4,000,000
5,000,000
6,000,000
7,000,000
8,000,000
19901991
19921993
19941995
19961997
19981999
20002001
20022003
Year
Area
Bur
ned
(ha)
Full Modif ied

9
In recent years there has been large increase in the number of homes and communities constructed adjacent to and among forests and other flammable vegetation. Living close to the forest has become desirable to many ex-urbanites and expensive communities are growing in the WUI. These homeowners have little knowledge of wildfires or the need to protect their homes. In addition, very few of these communities have building codes that require residents to build wildland fire-resistant homes and/or manage fuels on their property. The threat of WUI wildfires became common knowledge to all Canadians in the summer of 2003, when continued extreme fire danger conditions and multiple ignitions in the interior of British Columbia overwhelmed suppression capabilities, and fires destroyed homes in a number of communities. A total of 334 homes and 10 businesses were destroyed and over 45 000 people evacuated, and total economic impact to the province of British Columbia will measure in the hundreds of millions of Canadian dollars. A number of provincial/territorial fire management agencies, along with municipal governments are attempting to institute hazard mitigation programmes within and around these communities, but this is a formidable task given the rate of WUI expansion and increasing wildfire threats. These programmes should consider the biophysical aspects (e.g. fuel reduction/modification) along with the social aspects (e.g. public awareness/involvement) of hazard mitigation. In addition, communities in northern Canada, which are primarily aboriginal or associated with resource-extraction industries, currently require better protection against fire impacts through hazard mitigation. These communities depend on the forest around them for their livelihood, so that even fires that do not impact a town-site directly can significantly affect the future of that community. Evacuations of many northern communities occur almost annually to guard against direct or indirect (health effects) impacts from fire. It is a generally accepted conclusion among scientists and a growing percentage of the public that climate change is a reality, and that impacts across Canada will be profound, and largely unavoidable, over the next century. Research to date indicates that both the incidence and severity of forest fires will increase dramatically. The result will be larger areas burned, shorter fire-return intervals, a shift to a lower forest age-class distribution, and a net loss of terrestrial carbon to the atmosphere, likely resulting in a positive feedback wherein more fire leads to greater atmospheric carbon which leads to greater warming and more fire. Any trend towards increased fire activity and impacts will put extreme pressure on Canadian fire management agencies, and they will be unlikely to maintain their current level of control over fire impacts. Recent studies indicate substantial costs would be required to attempt to keep escaped fires at current levels, and escaped fires increasing significantly using current resource strength under a changing climate. It appears that fire suppression as practiced today will not be economically sustainable in the future, as we will not be able to meet current targets in terms of area burned and escaped fires. This will have direct effects on wood supply and the competitiveness of forest industry, along with approximately 300 forest industry-dependent communities in Canada. It may also have an impact on Canada’s commitment to carbon sequestration and emissions reduction under the Kyoto Protocol, particularly with increased carbon loss through more severe forest fires and the new exposure of carbon-rich peatlands to future fire. Forest fire suppression is an increasingly costly business relying on a large investment in very expensive equipment (e.g., airtankers, helicopters) and infrastructure. For suppression activities to remain safe and efficient, aging equipment and infrastructure must be replaced as it reaches the end of its expected lifetime. For example, 50% of the Canadian airtanker fleet (45 aircraft) is 30 years of age or older with less than 10 years of remaining economic life expectancy. However, over the past decade or more fire management agencies, like all other government organizations, have been subject to frequent budget reductions and spending constraints. Furthermore, over the past decade, fire management costs have increased and, particularly when WUI fires occur, are becoming more variable and unpredictable on an inter-annual basis. Naturally, as with equipment and infrastructure, the fire management workforce is aging as well. The demographics of fire management in Canada are changing, and government budgetary restraints have reduced hiring and training activities. Nearly 50% of the current permanent fire management staff in Canada is due to retire in the next 10 years. While on the surface this problem would appear to be adequately addressed through increased hiring, the training path to developing highly qualified fire managers is lengthy (taking a good part of a career), and previous budgetary restraints and the ensuing delays in training have greatly reduced the number of personnel on the training track. As a result, in some jurisdictions there is a lack of qualified personnel to replace retiring fire managers.

10
These emerging issues, combined with the growing realization that fire management in Canada has reached its physical and economic limits and that diminishing marginal returns can be expected from increased expenditures, raises the possibility that fire management in Canada is at a crossroads. This realization has prompted initial efforts on the development of a new Canadian Wildland Fire Strategy designed so that all levels of government (federal, provincial/territorial, and municipal), along with citizens and corporations, will share the risks of wildland fires in the 21st Century. As we move forward in the 21st century it is extremely unlikely that the rapidly increasing complexity of wildland fire management that has been experienced over the past two decades will subside. These pressures will continue to escalate, and innovative policies and practices that address both the root causes and the symptomatic problems of wildland fire must be developed and implemented in a timely manner across all regions and jurisdictions of Canada. 4. Mexico 4.1 Introduction The purpose of this report is to provide an overview of forest fires in Mexico. This report focuses on the fire situation from 2000-2005. The report addresses the key topics of ecosystems and fire regimes, fire statistics, fire effects and damages, prescribed burning, fire management capabilities, and roles and responsibilities using data from the National Forest Commission (CONAFOR). Mexico has many fire-dependent ecosystems. These ecosystems are maintained by the periodic occurrence of fire. This is true for the temperate forest (Mexico has more than 100 species of pine), grasslands, palm groves, shrubs, mixed chaparral and several oak or hardwood forests. Without fire, the species that thrive in these ecosystems are replaced by others that are not fire-dependent. This results in a reduction of biodiversity. Mexico also is rich in ecosystems that do not require fire. Some are fire sensitive, and for the ecosystem to thrive, fire must be excluded. Examples of these areas include the high, medium and low tropical forests, forests of fir, and others. In the ecosystems maintained by the fire, problems result from the lack of fire as much as the excess of fire. Changes in both the frequency (fires occurring too frequently), and the intensity (catastrophic fires, caused by many years of fuel accumulation) degrades these ecosystems. In Mexico, losses to structures and other infrastructure have not become a serious problem. While there are population centers within the forest areas that could be impacted by fires, they are usually surrounded by farming zones or the fuel loads have been reduced enough so that fires do not burn very intensely, if at all. The principal negative impacts from fires are to natural resources and forest industry. Mexico has many issues that complicate its wildland fire management programme. There is a lack of public understanding regarding complexities of the wildfire problem. Many communities use fire for forestry, farming, or livestock purposes but others see fire as a problem to be totally eliminated from the forests. This translates into a lack of understanding by the public of the full range of issues of forest and fire management. There is also a need to develop an effective programme of fuel management and prescribed burning for fire prevention. This might include legislative changes to assure the protection and conservation of protected areas and to recognize that fire is an important tool in the sustainable management of forests. 4.2 Ecosystems and Fire Regimes Mexico lacks an adequate body of fire research on the various fire regimes in each ecosystem type and the responses to fire occurrence and intensity at various levels. Based on current estimates, Table 1 describes the major ecosystems in Mexico, the extent, and if the ecosystem is generally

11
characterized as fire maintained, fire sensitive, or fire tolerant. The major cause of fire in that ecosystem is also noted. The average fire size for all ecosystems from 1998 to 2005 is 33 hectares.
Table 1. Fire regimes by ecosystem type
Ecosystem Type
Name/
Designation
Total Area of
Ecosystem in the Country (x 1 000ha)
Ecosystem Sensitivity
Fire
Origin/ Cause
Forest and Other Wooded Land Temperate
natural forest and forest plantations
30 400 Fire Maintained
Human and Natural
Forest: Intensively managed and/or protected (major ecological or economic assets at risk)
Tropical forest 26 400 Fire Sensitive
Human
Shrubland: Intensively managed and/or protected (major ecological or economic assets at risk)
Shrub and Bush 58 500 Fire Tolerant
Human and Natural
Peat / Swamp / Wetland Includes halophyte and
hydrophyte vegetation Swamp forest 4 200 Fire
Sensitive Human
Forestry, Conservation Ecosystem Type:
Disturbed forest areas
Disturbed forest areas
22 200 Fire Sensitive
Human
All Area Total 141 700 4.3 Fire Statistics An analysis of fire occurrence from 1970 to 2005 indicates that the number of fires has tended to increase over time. This is widely assumed to the result of the population increases in forested areas and a change in the climatic conditions. At the same time, the burned area trend is decreasing, likely the result of the more effective suppression efforts. Table 2 shows the annual fire workload in Mexico including a breakdown of area burned by Forest, Other Wooded Land, and Other Land. Table 3 provides a distribution of the monthly average. April and May are the months with the largest number of fires and the greatest area burned.
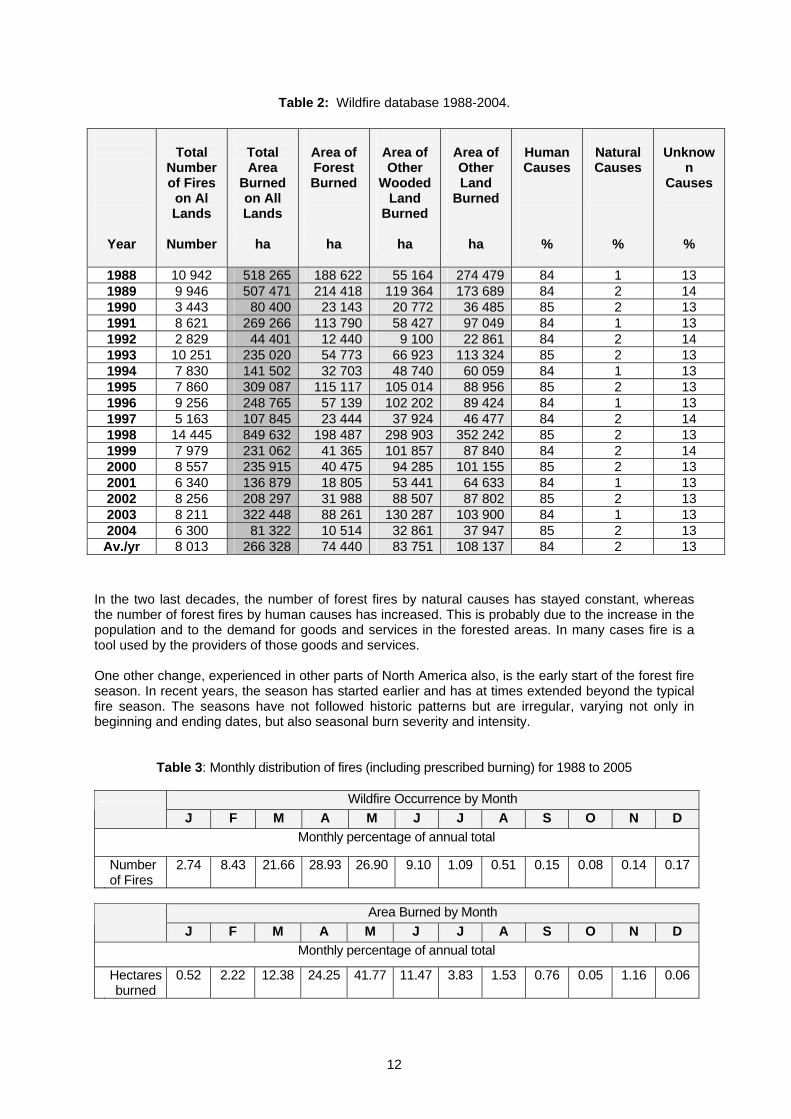
12
Table 2: Wildfire database 1988-2004.
Year
Total
Number of Fires
on Al Lands
Number
Total Area
Burned on All Lands
ha
Area of Forest Burned
ha
Area of Other
Wooded Land
Burned
ha
Area of Other Land
Burned
ha
Human Causes
%
Natural Causes
%
Unknow
n Causes
%
1988 10 942 518 265 188 622 55 164 274 479 84 1 13 1989 9 946 507 471 214 418 119 364 173 689 84 2 14 1990 3 443 80 400 23 143 20 772 36 485 85 2 13 1991 8 621 269 266 113 790 58 427 97 049 84 1 13 1992 2 829 44 401 12 440 9 100 22 861 84 2 14 1993 10 251 235 020 54 773 66 923 113 324 85 2 13 1994 7 830 141 502 32 703 48 740 60 059 84 1 13 1995 7 860 309 087 115 117 105 014 88 956 85 2 13 1996 9 256 248 765 57 139 102 202 89 424 84 1 13 1997 5 163 107 845 23 444 37 924 46 477 84 2 14 1998 14 445 849 632 198 487 298 903 352 242 85 2 13 1999 7 979 231 062 41 365 101 857 87 840 84 2 14 2000 8 557 235 915 40 475 94 285 101 155 85 2 13 2001 6 340 136 879 18 805 53 441 64 633 84 1 13 2002 8 256 208 297 31 988 88 507 87 802 85 2 13 2003 8 211 322 448 88 261 130 287 103 900 84 1 13 2004 6 300 81 322 10 514 32 861 37 947 85 2 13 Av./yr 8 013 266 328 74 440 83 751 108 137 84 2 13
In the two last decades, the number of forest fires by natural causes has stayed constant, whereas the number of forest fires by human causes has increased. This is probably due to the increase in the population and to the demand for goods and services in the forested areas. In many cases fire is a tool used by the providers of those goods and services. One other change, experienced in other parts of North America also, is the early start of the forest fire season. In recent years, the season has started earlier and has at times extended beyond the typical fire season. The seasons have not followed historic patterns but are irregular, varying not only in beginning and ending dates, but also seasonal burn severity and intensity.
Table 3: Monthly distribution of fires (including prescribed burning) for 1988 to 2005
Wildfire Occurrence by Month J F M A M J J A S O N D
Monthly percentage of annual total
Number of Fires
2.74 8.43 21.66 28.93 26.90 9.10 1.09 0.51 0.15 0.08 0.14 0.17
Area Burned by Month
J F M A M J J A S O N D Monthly percentage of annual total
Hectares burned
0.52 2.22 12.38 24.25 41.77 11.47 3.83 1.53 0.76 0.05 1.16 0.06

13
4.4 Fire Detection and Fire Behaviour The following list summarizes the various systems in use in Mexico for the detection of wildland fires and other systems and programmes used to predict fire danger and calculate potential spread rates. Much of the information is available on the internet. Several agencies in Mexico cooperate in gathering the information and providing it to the public and fire fighters. Wildland Fire Information System /Mexico Natural Resources Canada, Canadian Forest Service - The Secretariat of Environment and Natural Resources (Secretaría del Medio Ambiente y Recursos Naturales, SEMARNAT-CONAFOR). http://fms.nofc.cfs.nrcan.gc.ca/mexico/index.html National Weather Information System National Commission of Water (CNA) - National Weather Service http://smn.cna.gob.mx/productos/productos.html Forecast Weather Service Weather Center of Federal Electricity Commission - Comisión Federal de Electricidad (CFE). http://www.cfe.gob.mx/www2/meteorologico/notameteorologico.asp?seccion=meteorologico&seccion_id=2076&seccion_nombre=Bolet%EDn+vespertino Weather condition, forecasts, and climate outlook Institute of Global Environment and Society (IGES) http://www.iges.org/pix/prec3.html Fire Rate of Spread. Heat point detection using remote sensing National Commission of Knowledge and Use of Biodiversity (CONABIO). http://www.conabio.gob.mx/mapaservidor/incendios/modis/tablas2005/junio/nocturnas/terra/paso2/t1.050630.0505.html Daily Report of Monitored Heat Points and Meteorological Conditions National Forest Commission (CONAFOR) - Forest Fire Management Office - National Forest Fire Control Center (CENCIF). Detection and Monitoring of Forest Fires National Commission of Water (CNA) - National Weather Service http://smn.cna.gob.mx/monitoreo/incendios/incendios.html Detection of Forest Fires National Commission of Water (CNA) - National Weather Service and National Oceanic and Atmospheric Administration (NOAA). http://www.firedetect.noaa.gov/website/MexicoFire/viewer.htm Programme For Heat Point Detection Using Remote Sensing Techniques Commission of Knowledge and Use of Biodiversity (CONABIO). http://www.conabio.gob.mx/conocimiento/puntos_calor/doctos/puntos_calor.html 4.5 Fire Effects and Damages Population increases generate a greater demand for farming land and with more agriculture, the use of the fire is more frequent and the fire risk is increased. The use of fire in farming activities cause a higher recurrence of fires (excessive fire), and has changed the natural fire cycle. Damage in many ecosystems is very significant in terms of alteration of the fire regimes across Mexico. According to older members of the rural population, the natural fire frequency was between 50 and 200 years but fire frequency in the last decades has increased to between 5 to 8 years. This situation is particularly significant to the tropical forest ecosystems where fires were almost unknown.

14
In fire- dependent ecosystems, fire suppression has excluded fire and lengthened the interval between fires. Without fire, a buildup of fuels can result in higher burn intensities and damages to vegetation, soil, and riparian areas. The impact on habitat and biodiversity has not received adequate scientific study. The impact is considered significant, due to the fragmentation of the forest, to the introduction of invasive species that alter the spread rate of fires, and to the loss of forest resources. One of the topics not well studied is the relationship between fire’s impact on fragile soils and increases in floods. It has been noted that the lack of vegetation following forest fires, has been associated with flooding in the lower parts of the watershed. Fires that occur during the dry season in the upper elevations of the watershed combine with abundant rains to impact communities and the infrastructure by depositing soil and other material in community water sources. An evaluation of the forest fires in the 2003 fire season by a Mexico University looked at economic and other impacts. The fires of 2003 resulted in losses of US$337.03 million in wood, US$6.57 million in firewood materials, and US$39.17 million of reforestation costs in the affected forest areas. This does not consider losses in biodiversity, erosion, scenic beauty and recreation, production of oxygen, and regulation of the hydrologic cycle. This evaluation also estimated the economic impact in protected natural areas of temperate, tropical and semi-arid forest. A survey found that 50% of the visitors to natural areas would not visit after a fire. These visitors paid US$2.5 million for access to protected natural areas in 2003. Based on that data, they estimated that following the fires, US$1.2 million of potential revenue was lost. 4.6 Prescribed Burning In Mexico, the objective for prescribed burning is to reduce fuel loading and lower the number and impact of uncontrolled forest fires. The present fire policy for wildfire is to use suppression actions and limit the area burned. The practice of allowing forest fires to burn within a prescription is not permitted. Average annual area burned for fuel reduction from 1993 through 2005 was 41 107 hectares. Within forest areas, prescribed burns are a prevention tool for fuel reduction. In areas under commercial forest production prescribed burning is used for forest management as well as fuel reduction reducing the damages from forest fires. Other prevention and silvicultural practices are used in conjunction with prescribed burning such as opening and maintenance of fire breaks, pruning and thinning, use of firewood, and others. In some protected natural areas, firebreaks are constructed but prescribed burning is not allowed. Management of the natural resources in protected areas not in commercial forests are subject to a stricter rules that do not permit prescribed burning. Cattle dealers use fire in areas of natural grass to improve the grass for the cattle and the wildlife. The use of fire in Mexican agriculture is a traditional and cultural practice. For this reason fire is a critical practice at the present time and it continues to be an important tool used over extensive areas. These types of prescribed burns are conducted using traditional knowledge and methods, but without modern, technical planning.

15
Table 4: Prescribed Burning 1993-2005
Year 1993 1994 1995 1996 1997 1998 1999 Hectares Burned
66 556 63 251 53 580 61 606 51 094 91 412 90 596
Year 2000 2001 2002 2003 2004 2005 Hectares Burned
24 931 14 203 5 606 6 023 3 982 1 549
4.7 Fire Management Capabilities Agencies and organizations at all levels of government assist in the fire suppression effort. They employ a range of resource types including hand crews or brigades, engines, and helicopters. These resources respond to fires for initial attack and extended attack using both direct and indirect suppression techniques. Fire suppression is managed using the Incident Command System (ICS). The National Forest Commission (CONAFOR) has the following resources:
• 7 to 15 helicopters. • 1 874 firefighters organized into 152 professional brigades. In 2005, they were used for 50
337 person-days. • 11 Engines equipped for forest fire suppression.
The 152 brigades have official patrol routes for the detection of fires. There are 79 observation towers in important areas of the forest, as well as the detection by civil aeronautics (airlines and commercial pilots) and the general population using toll free phone numbers. The Governments of the states of México, Michoacán, Chiapas, Jalisco, Guerrero, Morelos, Colima, Baja California, Oaxaca, Coahuila, Nuevo León, Yucatán, Campeche, Zacatecas, Puebla and Federal District have the following resources:
• 5 731 firefighters organized into 338 brigades for the use of the states and municipalities. In 2005 they were used for 83 614 person-days.
Many ejidos (communal lands), community organization and organized groups of forest producers train and equip volunteers to respond to fires in their areas. These brigades provided 96 125 person-days in 2005. The Secretariat of the National Defense uses elements of the Mexican Army and Armed Forces for fire suppression. In 2005 there were used for 23 004 person-days. The Incident Command System was introduced in Mexico three years ago. It is the method used by CONAFOR for the management of fires and started with a systematic approach of training key technical personnel in the priority areas for protection against forest fires. Nevertheless there is a delay in the adoption of ICS on the part of the other agencies at the three levels of government. CONAFOR has a Training Center in Guzman City (Jalisco) that is used for teaching national level courses. This Center is equipped with classrooms, auditorium, dormitories, and dining room for 60 students. Courses are held at regional level in other training facilities. See Annex 2 for a listing of the national level training provided in Mexico. Every year, CONAFOR prepares a national fire management plan titled The National Programme of Protection against Forest Fires. This plan contains analysis, objectives, strategies and actions with goals for the country. This Programme is prepared with data and the planned activities for the 32 programmes of the CONAFOR representative in each state of the country.

16
In the second half of 2005, a national level process started for the development of a National Strategic Programme of Protection against Forest Fires and Fire Management. The goal of the programme is to develop and meet the objectives for protection and conservation of all forested areas in the country. This programme will be on the long term and will contain the objectives and actions to initiate and encourage the participation of all levels of government, states and municipalities, the social and private sectors, and NGO's. 4.8 Roles and Responsibilities Mexico has a Group for Interagency Coordination that supports the National Programme of Protection against Forest Fires. The 12 Secretaries of State in the federal government participate. This Group provides support for fire management activities and assures that resources are coordinated for the prevention, detection and suppression of fires. CONAFOR leads this inter-ministerial working group for forest fires suppression in Mexico. CONAFOR coordinates all efforts in forest fire protection for the national, regional and state level. Current legislation in Mexico assigns responsibility for the prevention, detection and the suppression of forest fires to the landowner, as well as to the authorities of the three levels of government (local, state and Federal) based on jurisdiction and the complexity of the problem. This is a new legislation and it has not yet been applied completely throughout the country. For that reason the main responsibility for fire suppression is still maintained by the federal government with the participation of some of the state governments. With private funds and contributions of governments of developed countries, NGOs are promoting the concept that fire management includes the recognition of the role of fire in the ecosystems. These organizations, with local participation, are initiating pilot projects that demonstrate an alternative to fire suppression in order to solve the forest fire problem and to manage natural resources, and provide resources to the population. Some of these pilot projects included: fire management planning at region and estate level, the use of prescribed burns, and include workshops and training on fire management. This new approach to the problem, although recent, is already showing levels of acceptance by the scientific community and in some communities. Several universities in Mexico are participating in research related to wildland fire. These are the Universidad Nacional Autónoma de México, Instituto de Ecología; Universidad de Guadalajara, Universidad Autónoma de Chapingo, Universidad Autónoma Agraria Antonio Narro; Instituto Nacional de Investigaciones Forestales y Agropecuarias. Ten researchers associated with these universities are working on a variety of subjects related to prescribed burns, vegetation succession, fuel models (photo series), fire behaviour models and fire effects, and dendro-chronology. There is a lack of funding for scientific research on forest fires and fire management, and a need to strengthen coordination between the research groups and operational agencies. International cooperation is an important part of the Mexican programme. Mexico participates, with Canada and USA, in the Fire Management Working Group of the North American Forest Commission. The Group holds annual meetings and develops a programme with technical assistance, training, technology transfer, and operating plans for suppression of wildfires in zones covered under border agreements. The Working Group forms the North American Network, part of the Global Wildland Fire Network. Mexico is also an active participant in the Central American Forest Fire Network with their southern neighbours. Mexico participated in the Summit of the Mechanism of Dialogue and Agreement of Tuxtla, where the Heads of State of the Central American countries and Mexico agreed to reinforce cooperation in forest fire suppression. During severe fire seasons, the USA has provided Mexico with technical assistance, equipment and tools, and specialized resources for infra-red photography and photo interpretation. This assistance was important during the fire emergencies of 1998 in the Chimalapas zone (States of Oaxaca and Chiapas). The 1998 fires experience generated a series of training and technical projects from USA to Mexico. The

17
introduction of the Incident Command System began by training more than 100 Mexican technicians in the use of this system in 2000 and 2001. Mexico sent personnel twice to the USA during forest fire emergencies. Mexico provides Guatemala with technical support for initial attack of forest fires in the common border zones, and occasionally dispatches Armed Forces or private helicopters for initial attack. With a strong base of support from Canadian colleagues in the Forest Service of the Ministry of Natural Resources of Canada, Mexico continues to operate the Information System of Forest Fires. This system designs and produces 13 maps daily reports of: temperature, wind speed, relative humidity, precipitation, light fuel moisture, soil moisture. They also provide indices of ignition, drought, consumption, fire danger, intensity and rate of spread, and fuel consumption. This system is very useful for decision support at the operation level. In the last phase of implementation, field samples will be taken to adjust the fuel models. 4.9 National Level Training Courses As from 1989, Mexico began a comprehensive training programme for all levels of fire management. Listed below are the courses sponsored by the national agencies for the benefit of national and local fire agencies. The courses are in Spanish. Many of the S and I courses listed below are also available in English from the National Interagency Fire Center in Boise, Idaho, USA. 1
Training Course
Duration
Language
Remarks
International or National Course for the Protection against Forest Fires (Combination of different Courses: S-130, S-131, S-190, and Others.)
2 weeks (98 hours)
Spanish Presented every year from 1989 to 2005 (programmed to continue). Wide range of subjects in forest fire management, including training new instructors.
Incident Command System Basic Level (I-200)
3 days Spanish 105 Mexican technicians trained in 1999 and 2000.
Incident Command System. Intermediate Level (I-300)
3 days Spanish 105 Mexican technicians trained in 1999 and 2000.
Intermediate Wildland Fire Behaviour (S-290)
3 days Spanish Two courses trained 80 technicians in 2004 and 2005.
Introduction to Wildland Fire Behaviour Calculations (S-390)
4 days Spanish Two courses trained 80 technicians in 2004 and 2005.
Interagency Helicopter Training (S-217 )
5 days Spanish Four courses trained 80 technicians.
Engine Use for Wildfire Attack. (Combination of different Courses: S-231, S-214 and others).
7 days Spanish Four courses trained 110 fire fighters in 2003.
Use of Rappel Helicopter for Wildfire Attack
7 days Spanish 20 trained. 2003 (certification); 2004 and 2005 (Recertification). Combination of different Courses: Attack Initial with Helicopter (IHOG) and Rappel for Helicopter IHRG (Interagency Helicopter Rappel Guide).
Firefighter Training Basic Course 3 days Spanish 400 to 500 of this course annually to voluntary brigades in communities, military personnel and other agencies of the three levels of government.
Firefighter Training (S-130)
4 days Spanish (In process of revision and adaptation)
The translation is complete for the first revision of the course. Will be tested soon.
1 www.nifc.gov

18
5. United States of America (USA) 5.1 Introduction The purpose of this report is to provide an overview of wildland fire management in the USA. The USA is part of the North American region with Canada and Mexico. The three countries make up the North American Regional Wildland Fire Network. The report covers 2000 to 2005, with some exceptions noted in the text or charts. The agencies included in this report protect and manage Federal, State, and local jurisdictions. The term Federal Agencies refers to the five land management agencies in the Department of the Interior: the Bureau of Indian Affairs (BIA), the Bureau of Land Management (BLM), the Fish and Wildlife Service (FWS), and the National Park Service (NPS); and in the Department of Agriculture, the Forest Service (FS). Together the Federal Agencies protect over 350 million acres. These five agencies, along with the State Forestry Departments and other agencies, work together in Boise, Idaho to coordinate the national mobilization of resources to wildland fires and other emergencies. In 2001 a renewed programme for the protection of communities and resources began. The Federal Agencies and the States worked in partnership to create and implement the National Fire Plan. This was also the beginning of a major effort to establish common performance indicators, and common data standards for the Federal Agencies. Common reporting of data provides a consistent national view of the fire management programme. However, the changes to the new data also means that data collected and published prior to 2001 (and for some of the fuel treatment and landscape restoration data, prior to 2004) will not be exactly comparable to some of the data presented here. The reader is advised to go to the data sources for further explanation if needed. The data for this report comes from several sources. The information on the fire season, including specific examples on individual fires, daily staffing, and other operational information is available from the National Interagency Fire Center (NIFC) in Boise, Idaho. 2 The Department of the Interior, Office of Wildland Fire Coordination and the Department of Agriculture, Forest Service, Fire and Aviation Management staff collect data for the National Fire Plan (NFP) 3and the Healthy Forest Initiative (HFI). 4 Other sources are identified in the report and, if available, a web site is included. Fire occurrence data and burned area are recorded on a calendar year basis (1 January to 31 December). Federally-funded programmes collect and publish project accomplishment data on a fiscal year basis (1 October to 30 September). Some of the charts only provide data through 2004 and the range is noted on each table. Data and information are presented that best illustrate the key points in this report and are not intended as a comprehensive look at all data for all years. Area is recorded in acres (1.0 acre equals 0.4047 hectare). 5.2 Fire Statistics The 5-year period covered by this report was one of the most severe series of fire seasons in the USA since statistics have been recorded. During these years, four states recorded their largest fire: Arizona, Colorado, New Mexico, and Oregon, and perhaps California. Over 7 million acres were burned in 2000, 2002, and 2004. The initial statistics for 2005 indicate that over 8.6 million acres were burned, a figure more than twice the 10-year average. In 2002, NIFC reported that 2 381 structures were burned in wildland fires. The majority of fires in the USA are human caused. However, the causes vary by region, with lightning being a major cause of fires on Federal lands in the west and human-caused fires more common in the east. Lightning storms are commonly accompanied with heavy rain in the east. The summer storms in the west tend to be “dry”, meaning that the precipitation evaporates before reaching the ground, or the amount of precipitation is not adequate to extinguish the fires started by the lightning strikes. 2 www.nifc.gov 3 www.nfp.gov 4 www.healthyforests.gov
19
The severity of, and impact from, wildland fire have been increasing for several years. There is significant year-to-year variability in both the numbers of fires and total acres burned, but the overall trend is an increase in acres burned. The variability in the number of acres burned is well illustrated in the 2000-2004 time period with three years recording some of the highest burned area on record and alternate years with less than an average number of acres burned. The 2000 fire season was significant in several ways. By many measures, it was the worst fire season in 50 years with over 8 million acres burned and 861 structures lost. It was the first time that firefighters from Australia and New Zealand were sent to assist the USA. On the day of peak activity, 29 August, NIFC recorded that 28 462 people were assigned to fire fighting duties. The following resources were assigned: 667 crews of 20 persons, 1 249 engines, 226 helicopters, and 42 airtankers. There were 84 individual fires over 100 acres burning with a total for that day of 1 643 000 acres on fire in 16 states. It also marked the beginning of the National Fire Plan (NFP), officially initiated and funded in 2001. The NFP is an interagency programme with a goal of protecting communities and resources and restoring ecosystems. The fire season that followed, 2001, was normal by most measurements. Only 3.6 million acres burned and the number of fires recorded was also below average, although 731 structures were burned. In September, when planes were flown into the Twin Towers in New York and the Pentagon outside Washington, DC, wildland fire incident management teams, operating under the Incident Command System (ICS), were mobilized to assist local emergency management agencies responding to this disaster. Over a nine-week period, four Type I Teams were assigned to New York and the Pentagon, and 268 fire personnel assisted with planning and logistics for these incidences. This was not the first time that ICS was used by wildland firefighting teams to assist with non-fire incidents, and it would not be the last. The 2002 season was again a heavy workload for the agencies. NIFC reported that 28 000 fire personnel were assigned to fires in July. This is considered the maximum number of trained and qualified personnel available for off unit mobilization, and a request was sent to Canada, Mexico, Australia, and New Zealand for assistance. The military was also tasked to deploy an Army battalion. This added about 600 military personnel and 950 fire fighters from the other countries to the effort. Year 2003 was another average year, burned acres were about average and the number of fires was below the average, but August was a difficult month for firefighters in 11 western states. By the end of the month, an army battalion had been deployed and about 50 management personnel from Australia and New Zealand were on the fire lines. The most critical period occurred later in the year when approximately 750 000 acres burned in southern California in and around Los Angeles and San Diego. The fires destroyed 3 640 homes, 33 commercial buildings, and 1 140 other structures. Year 2004 was the most severe fire season on record for the state of Alaska. The more than 6 million acres that burned broke the record for the state set in 1957. The other event that caused concern was the in-flight structural breakup of an airtanker. This accident began a series of investigations and caused the Federal Agencies to cancel the contract for large airtankers. The airtanker fleet had many aircraft converted from military use and some were almost over 30 years old. The Agencies worked with the contractors to develop new inspection procedures and completed stress testing on the planes before returning them to service. Year 2004 was also a bad hurricane season and 18 wildland fire Incident Management Teams assisted Federal and State emergency management agencies in relief efforts. This was repeated in 2005 when Hurricanes Rita and Katrina came ashore along the Gulf Coast. Table 1 shows the total numbers of fires and area burned by year for the Federal Agencies and the State and local jurisdictions. Complete information is in Annex 1.

20
Table 1: Number of fires and area burned
Fire Statistics All Jurisdictions - Calendar Years 2000-2004 State/
Year BLM BIA FWS NPS FS Private Totals
Fires 3 288 5 964 548 771 9 788 103 971 124 330 2000 Acres 1 331 380 461 386 389 862 225 920 2 108 792 3 701 504 8 218 844
Fires 3 312 4 958 397 841 9 236 84 362 103 106 2001 Acres 755 459 195 242 64 561 210 834 538 557 1 713 589 3 478 242
Fires 2 402 6 260 481 680 7 485 74 812 92 120 2002 Acres 997 135 1 084 483 497 556 213 901 1 571 488 2 703 021 7 067 584
Fires 2 919 5 826 494 738 8 902 64 318 83 197 2003 Acres 337 257 437 334 160 219 371 175 171 286 2 655 179 4 132 450
Fires 2 721 5 267 520 685 7 120 65 973 82 286 2004 Acres 1 262 258 74 711 1 843 234 517 357 451 893 3 087 910 7 237 363
Wildland fire use is a term used by the Federal Agencies to indicate wildland fires that are managed not only to save fire suppression costs, but are also managed for the benefit of other resources. Many areas in the USA have fire-dependent ecosystems where a regular occurrence of fire is needed to maintain ecosystem health. Wildland fire use does not mean just ignoring fires or letting them burn under any condition. Fire management plans are prepared that clearly designate area, burning conditions, expected benefits, and the resources that are required. Only natural ignitions, i.e. lightning caused fires, are managed. All human caused fires are suppressed. Most states have arson laws that make starting a fire a crime and the person responsible is subject to cost recovery actions to reimburse the agency for the cost of suppressing the fire. Table 2 shows the total, by State, for each of the Federal Agencies from 2001 through 2004. Except for the 5 705 acres recorded in Florida, all of the wildland fire use is in the western states. State agencies and local jurisdictions are generally restricted by law or statute to suppress fires and do not have the authorization to manage wildland fires.
Table 2: 2001-2004 Wildland Fire Use Acre Summary (Federal Agencies)
State BIA BLM FS FWS NPS Grand Total Alaska 0 836 567 0 573 006 124 464 1 534 037 Arizona 0 0 5 933 0 18 832 24 765 California 0 0 33 994 0 43 974 77 968 Colorado 0 4 716 26 058 0 926 31 700 Florida 20 0 0 24 5 661 5 705 Idaho 0 466 78 783 0 0 79 249 Montana 0 0 76 250 0 34 76 284 Nevada 0 16 500 1 0 1 435 17 936 New Mexico 0 0 193 264 0 117 193 381 Oklahoma 0 0 925 4 0 929 Oregon 0 0 500 26 0 526 Utah 0 2 600 26 285 0 364 29 249 Washington 0 0 788 0 3 915 4 703 Wyoming 0 0 7 241 0 8 745 15 986
Grand Total 20 860 849 450 022 573 060 208 467 2 092 418
21
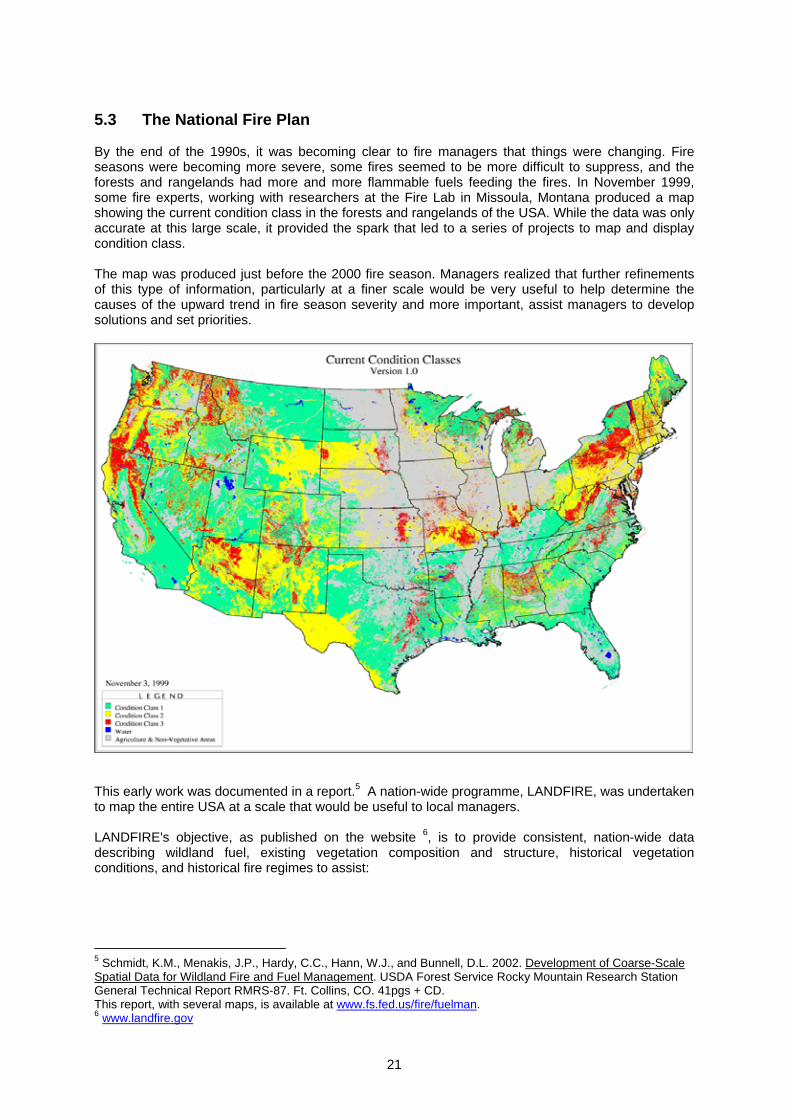
5.3 The National Fire Plan By the end of the 1990s, it was becoming clear to fire managers that things were changing. Fire seasons were becoming more severe, some fires seemed to be more difficult to suppress, and the forests and rangelands had more and more flammable fuels feeding the fires. In November 1999, some fire experts, working with researchers at the Fire Lab in Missoula, Montana produced a map showing the current condition class in the forests and rangelands of the USA. While the data was only accurate at this large scale, it provided the spark that led to a series of projects to map and display condition class. The map was produced just before the 2000 fire season. Managers realized that further refinements of this type of information, particularly at a finer scale would be very useful to help determine the causes of the upward trend in fire season severity and more important, assist managers to develop solutions and set priorities.
This early work was documented in a report.5 A nation-wide programme, LANDFIRE, was undertaken to map the entire USA at a scale that would be useful to local managers. LANDFIRE's objective, as published on the website 6, is to provide consistent, nation-wide data describing wildland fuel, existing vegetation composition and structure, historical vegetation conditions, and historical fire regimes to assist:
5 Schmidt, K.M., Menakis, J.P., Hardy, C.C., Hann, W.J., and Bunnell, D.L. 2002. Development of Coarse-Scale Spatial Data for Wildland Fire and Fuel Management. USDA Forest Service Rocky Mountain Research Station General Technical Report RMRS-87. Ft. Collins, CO. 41pgs + CD. This report, with several maps, is available at www.fs.fed.us/fire/fuelman. 6 www.landfire.gov

22
• Identification of areas at risk due to accumulation of hazardous fuel; • Prioritization of hazardous fuel reduction projects; • Improvement of coordination between agencies with regard to fire and other resource
management; • Modelling real-time fire behaviour to support tactical decisions to ensure sufficient
wildland firefighting capacity and safety; • Modelling potential fire behaviour and effects to strategically plan projects for hazardous
fuel reduction and the restoration of ecosystem integrity on fire-adapted landscapes. One of the most valuable aspects of the NFP was the recognition and support for a wide range of programmes that are needed in order to reduce the threat of fire and to restore ecosystems. Many times the emphasis is only on the prevention, initial attack, and suppression while fuel treatment and restoration activities are not included. The NFP set up a broad definition of what should be included in the programmes of the Federal Agencies. Other programmes, such as treatments for insects and diseases, grazing and timber management activities, may also reduce fuel loading or provided for fire protection. The reporting system set up for the NFP collects data on treatment activities for insect and disease programme that reduce the risk from fire. Activities to treat forested areas infested with mountain pine beetle (Dendroctonus ponderosae), southern pine beetle (Dendroctonus frontalis), gypsy moth (Lymantria dispar), and white pine blister rust (Cronartium ribicola) are some examples. In 2003, 781 790 acres were treated for pest infestation and the treatments also met other NFP objectives. In addition to the acres reported in this programme, many States and private land owners do additional work. Another programme within the NFP is the emergency stabilization and rehabilitation projects. These projects are completed following severe fires to stabilize the area and prevent erosion, stop invasion by unwanted species, and restore ecosystems. Table 3 shows the total number of projects and acres for the Federal Agencies from 2001 through 2004.
Table 3: Emergency Stabilization and Rehabilitation Projects Federal Agencies 2001-2004
Agency Projects Acres
BIA 149 1 129 007 BLM 1 133 5 678 798 FWS 70 122 838 NPS 100 82 350 FS 2 767 3 671 361
Total 4 219 10 684 354 Research is also an important component of the NFP, and research on a wide array of fire management subjects has been underway for many years. The research labs and stations of the FS and the USA Geological Survey (USGS) have been working with partners in government and universities to study important issues and provide answers to managers and fire fighters. In 1998, the Federal Agencies and the USGS formed a partnership called the Joint Fire Sciences Program (JFSP). This goal of this partnership is to provide scientific information and support for wildland fuel and fire management programmes. Funding for the JFSP was increased with the implementation of the NFP. A governing board was established to manage the JFSP. Some of the areas of research are air quality, fire behaviour and effects, social and economic topics, and monitoring and evaluation. A complete list of the topic areas, the projects and the primary researcher is available on the JFSP web site. 7
7 htpp://jfsp.nifc.gov.

23
5.4 Fuel Management and Prescribed Burning Fuel management activities are a critical component of wildland fire protection in the USA. Prescribed burning is viewed by many as a prevention activity. It can be a very effective measure to reduce the risk of fire to communities and protected areas. Fuel management activities, including the use of prescribed fire, are much more than just a prevention tool, but are used to restore and sustain ecosystems and enhance resources. Under of the National Fire Plan, prescribed fire and other activities that reduce the build-up of fuel received greater emphasis in the Federal programmes and the agencies began to collect accomplishment data on a wider range of activities. Table 4 from the NIFC website shows the number of prescribed fire acres accomplished by the Federal Agencies prior to the NFP.
Table 4: Prescribed Fire Acres Treated, 1995 to 2000.
Acres Treated by Prescribed Fire
Agency 1995 1996 1997 1998 1999 2000
FS 570 300 617 163 1 097 658 1 489 293 1 379 960 728 237
BIA 21 000 16 000 37 000 48 287 83 875 3 353
BLM 56 000 50 000 72 500 200 223 308 000 125 600
NPS 62 000 52 000 70 000 86 126 135 441 19 072
FWS 209 000 180 000 324 000 285 758 300 508 201 052
Total 918 300 915 163 1 601 158 1 889 564 2 240 105 1 077 314
During this period, the agencies carried out many other types of fuel treatment not reported in Table 4. Mechanical treatments such as using bulldozers and other heavy machinery to pile or move forest fuel has been used for decades. For most jurisdictions, this type of treatment focused on cleaning up debris created by other management activities such as logging and harvesting actions. Limbs, branches, and unutilized material were often piled and burned to reduce the threat of a severe fire and to prepare the site for reforestation. In addition to hazard reduction, mechanical treatment is needed to prepare some sites prior to the using fire. In fire-dependent ecosystems, such as the Ponderosa pine type in the western USA, a large build up of natural fuels cannot be burned with a low intensity fire, the type of fire needed in this fire-dependent ecosystem. Mechanical treatments are used to reduce the amount of fuel prior to using prescribed fire. This is a two-step process that restores this ecosystem but also provides fire prevention benefits to the resources and communities within, or adjacent to, the forests. Table 5 shows the total fuel treatment, both mechanical and prescribed fire, for the Federal Agencies from 2001 through 2005. The data is broken into Wildland Urban Interface Acres and Other Acres. Wildland Urban Interface Acres are those that are in, or adjacent to, communities or are an area critical to communities such as municipal watersheds. The Other Acres are those treated outside of the defined interface and are generally for resource protection or restoration.

24
Table 5: Fuel Treatment Summary 2001 through 2005
Federal Agencies
Wildland Urban Interface Acres Other Acres Total
Agency Prescribed Fire Mechanical Other Prescribed
Fire Mechanical Other Acres Treated
BIA 55 233 119 858 17 158 348 103 124 789 12 974 678 115 BLM 228 830 446 900 160 119 564 505 391 530 210 085 2 001 969 FWS 452 565 76 480 14 893 1 245 476 20 499 56 066 1 865 979 NPS 97 338 30 345 1 350 457 709 11 283 38 107 636 132
FS 4 190 563 643 899 20 611 2 004 067 293 588 1 799 7 54 527
Total 5 024 529 1 317 482 214 131 4 619 860 841 689 319 031 12 336 722 Annual statistics for the individual years 2001-2005 are included in Annex 2 5.5 Fire management roles and capabilities Fire protection responsibilities in the USA depend on the ownership patterns and any protection agreements between agencies or owners. Federal, State, municipal, county, and local fire districts all play a role in managing and suppressing wildland fire. Each State has fire protection responsibility, with the jurisdiction defined by the individual state statutes and regulations. Many have State forests and other State-owned land and some States have statutory responsibility to protect private lands as well. Table 6 lists the number of resources reported to the NFP offices for the Federal Agencies in 2002. The total number of resources fluctuates every year and is based on budgets, fire season severity, and other variables. The totals presented show actual staffing in 2002 and are a good indication of the normal planned levels for the Federal Agencies. The States and local jurisdictions provide additional resource for their area of responsibility. While many State resources are available for national mobilization, most State and local resources are needed for local initial attack.
Table 6: 2002 Initial Attack Resources
Federal Agency Preparedness Resources
Resources BIA BLM FWS NPS FS Combined
Total Firefighters 1 184 2 734 328 426 10 480 15 152Management, Overhead 125 761 248 219 423 1 776Engines 297 381 303 250 995 2 226Helicopters 13 30 3 9 97 152Water/Foam Tenders 18 32 25 14 15 104Dozers 34 16 26 0 105 181Tractor/ Plows 0 0 32 0 90 122Boats 1 1 2 0 8 12Type I or Hotshot Crews 11 12 0 2 65 90Smokejumpers 0 153 0 1 277 431Airtankers 5 28 0 0 41 74Other Aircraft * 0 30 0 0 62 92 *Other aircraft numbers include smokejumper aircraft, air attack aircraft, aerial supervision aircraft.lead planes, etc.

25
With the large number of agencies protecting individual jurisdictions, it is very important that they work together and provide coordinated protection when fires burn across jurisdictional boundaries. It is not uncommon for a fire occurring in an interface area, where wildlands and rural and/or urban areas meet, to burn or threaten land from several jurisdictions. In the early 1970s the FS, working in partnership with other fire management agencies, developed the National Interagency Incident Management System (NIIMS). One key component of the NIIMS is the Incident Command System (ICS). ICS is a management system used to manage emergency incidents of all types: wildland fires, flooding, earthquakes, hurricane response, avian influenza, and human-caused disasters including terrorist attacks. ICS can be used by any agency or organization to respond to an incident using common terminology, common qualifications, and common processes. Following the attack on the Twin Towers in New York City and the success of ICS in managing the response, the President issued a Directive that all incidents involving Federal resources would utilize the ICS system. One of the recommendations from the International Wildland Fire Summit in Sydney in 2003 was that any organization that wanted to work cooperatively with other agencies or governments should adopt a system like the ICS. ICS has been adopted by many countries and fire organization throughout the world. It was due to the fact that Australia and New Zealand use the ICS system, and their system was compatible and corresponds well with the US system, that we were able to develop and sign an Arrangement between our countries that provides for the exchange of fire fighters. 5.6 Collaboration The USA has border agreements with Canada and Mexico that cover every mile of shared border. The agreements provide for reciprocal arrangements for initial attack along the border zone and also have provisions for the exchange of resources for all types of fire management activities. The agreements include assistance on large fires anywhere in the countries when requested, as well as training and technical exchanges. The USA has sent firefighters to Mexico and Canada on several occasions and has received assistance many times. The USA and Canada also have a special type of arrangement called a Compact which is an arrangement between individual border States and the neighbouring provinces of Canada. The compacts are very important in parts of the north-central and northeastern USA where there are very few federal lands and the States are the primary fire protection agency. The Federal Agencies participate in several of the compacts and they are most useful for initial attack activities along shared borders. In 2000, the Federal Agencies signed an Arrangement with the States of Australia and New Zealand for the exchange of firefighters. While the fire fighter exchange arrangement is new, the USA, Australia, and New Zealand have had a long-standing series of exchanges and other technical and training programme. The first Australia Study Tour took place in 1962 and continues every other year with the next one scheduled for 2007. Mexico is planning to join the USA and Canada as a host for part of that tour. Canada, Mexico, and the USA are very active in the North American Forest Commission Fire Management Working Group (FMWG). The FMWG meets every year to coordinate training, exchanges, and activities. The FMWG is the primary sponsor for the International Wildland Fire Conferences held in 1989 in Boston, USA, in 1997 in Vancouver, Canada, and in 2003 in Sydney, Australia. The 4th Conference will be held in 2007 in Madrid, Spain. 5.7 Community Involvement Every year more and more homes and communities are built outside urban centers and in the wildland urban interface. In area where wildland fires are common, these homes and communities are at risk. Homeowners and community leaders must take steps to protect themselves by assuring that transportation routes allow for emergency vehicles to enter and citizens to evacuate, at the same

26
time. Buildings need to be constructed with material that reduces the likelihood of ignition and trees, brush, and other burnable material must be cleared away from structures. In the USA, FIREWISE is the programme that provides information to homeowners and community leaders. The FIREWISE programme is a cooperative effort with the Federal Agencies, the National Association of State Foresters, the US Fire Administration, and the National Fire Protection Association. The website provides information on making a home fire safe, including an online assessment programme. Communities can also participate by becoming FIREWISE communities. 8 Citizen and community participation in planning, organizing, and implementing fire protection programmes is a key to the success and continuing progress. A successful programme requires the cooperation of all the partners. Community Wildfire Protection Plans (CWPP) help communities prepare for wildland fire emergencies and sets priorities for fuel treatment activities. The Federal Agencies are required to give priority for funding projects identified in a CWPP that meets the minimum requirements. More information is available on the Healthy Forest website. 9 The minimum requirements for a CWPP are:
1. Collaboration: A CWPP must be collaboratively developed by State government representatives, in consultation with federal and other interested parties. 2. Prioritized Fuel Reduction: A CWPP must identify and prioritize hazardous fuel reduction treatments and recommend the methods of treatment that will protect one or more at-risk and essential infrastructure(s). 3. Treatment of Structural Ignitability: A CWPP must recommend measures that homeowners and communities can take to reduce the risk to structures throughout the area addressed by the plan.
Community involvement is also important for planning and restoring fire-adapted ecosystems. One effort in the USA that involves all interested participants is Fire Learning Networks established by The Nature Conservancy (TNC) in cooperation with the Federal Agencies. While a fire in many areas would threaten the wildland urban interface or resources of concern to communities such as municipal watersheds, many are also vitally important to maintain and restore habitats and ecosystems. TNC has established fire learning networks internationally as part of their Global Fire Initiative. More information is available on the TNC website. 10
8 www.firewise.org 9 www.healthyforests.gov/community/cwpp.html 10 http://tncfire.org/training_usfln.htm

27
Annex 1: Wildland Fire Statistics Fire statistics are collected by the Fire and Aviation Management Staff of the FS from the other Federal Agencies and the State Foresters. The statistics have been published for many years. Not all wildland fires in the USA are included in these numbers. As noted above, there are thousands of individual fire management jurisdictions from small volunteer departments to large municipal or county departments. Many report wildland fires to the State Forester, but some do not. The causes in the chart were originally set to help fire prevention specialists monitor fire starts and set up prevention programmes that targeted critical causes or areas. For example, trains were a frequent cause of fires from exhaust particles or brake shoes that broke and sent hot metal into the grass and litter along the tracks. The agencies were able to identify the problem and worked with the railroad companies to set clearing standards and other measures to reduce the numbers of fires. The definitions for most of the causes are clear, but a few need explanation. Incendiary fires, or arson, are those intentionally started for a variety of reasons. Equipment fires can be from exhaust particles, sparks from hitting rocks, or friction on flammable material. Railroads are separate from equipment as explained above. Juveniles are children either playing with matches or other burning material, or just using a source of ignition carelessly. Debris fires are those that escape from a debris burning operation. This can be burning household trash, logging debris, or any other type of fire used to clean up flammable material. Some debris burns are done in violation of state or other laws, but many are legitimate activities where the person was negligent in conducting the burn. Miscellaneous are fires that do not fit into the other causes.
Fire Statistics All Jurisdictions - Calendar Year 2000 State/
Cause BLM BIA FWS NPS FS Private Totals Fires 2 613 1 394 190 435 6 362 7 656 18 650 Lightning Acres 1 124 380 278 355 258 344 114 405 1 675 565 1 218 168 4 669 217 Fires 95 124 49 67 1 258 1 875 3 468 Campfire Acres 51 204 2 660 2 533 16 121 52 466 18 943 143 927 Fires 29 182 36 28 236 3 417 3 928 Smoking Acres 1 056 10 376 15 626 105 15 930 44 953 88 045 Fires 70 1 060 89 35 768 25 250 27 272 Incendiary Acres 53 006 20 131 6 093 92 460 155 625 847 759 1 175 074 Fires 156 240 76 41 193 10 104 10 810 Equipment Acres 25 269 22 346 99 009 1 554 8 285 308 635 465 098 Fires 35 17 12 13 56 2 710 2 843 Railroads Acres 3 535 1 065 476 338 55 559 85 258 146 230 Fires 21 1 007 13 14 65 3 191 4 311 Juveniles Acres 384 19 674 1 041 80 211 12 722 34 112 Fires 60 1 011 28 146 34 766 36 011 Debris Acres 8 233 50 311 105 17 105 431 662 507 416 Fires 209 929 83 110 704 15 002 17 037 Miscellaneous Acres 64 313 56 467 6 741 752 128 048 733 404 989 725
Grand Fires 3 288 5 964 548 771 9 788 103 971 124 330 Totals Acres 1 331 380 461 386 389 862 225 920 2 108 792 3 701 504 8 218 844

28
Fire Statistics All Jurisdictions - Calendar Year 2001
State/ Cause BLM BIA FWS NPS FS Private Totals
Fires 2 638 846 132 464 5 546 5 338 14 964 Lightning Acres 696 719 57 405 52 106 173 517 332 835 536 576 1 849 158 Fires 98 141 37 87 1 421 1 919 3 703 Campfire Acres 1 120 25 915 82 24 414 38 519 31 836 121 886 Fires 16 170 25 27 227 3 480 3 945 Smoking Acres 288 46 261 162 13 3 394 18 767 68 884 Fires 45 1,107 55 48 852 19 878 21 985 Incendiary Acres 6 717 24 197 4 000 10 327 32 819 503 624 581 683 Fires 165 269 51 51 176 8 249 8 961 Equipment Acres 13 060 11 099 2 648 1 558 41 906 129 260 199 530 Fires 33 20 11 14 22 1 381 1 481 Railroads Acres 565 22 3 011 219 1 040 15 426 20 283 Fires 12 711 11 19 63 3 526 4 342 Juveniles Acres 1 304 3 294 94 322 1 810 11 770 18 593 Fires 61 869 27 128 27 134 28 219 Debris Acres 7 873 14 008 13 6 237 180 557 208 687 Fires 244 825 75 104 801 13 457 15 506 Miscellaneous Acres 27 813 13 042 2 459 452 79 998 285 773 409 538
Grand Fires 3 312 4 958 397 841 9 236 84 362 103 106 Totals Acres 755 459 195 242 64 561 210 834 538 557 1 713 589 3 478 242
Fire Statistics All Jurisdictions - Calendar Year 2002
State/ Cause BLM BIA FWS NPS FS Private Totals
Fires 1 826 1 014 151 339 4 638 4 906 12 874 Lightning Acres 941 087 433 925 463 551 198 336 984 060 1 310 394 4 331 352 Fires 128 178 49 76 1 039 1 700 3 170 Campfire Acres 7 329 2 052 6 807 228 237 811 23 440 277 667 Fires 30 213 15 36 181 3 326 3 801 Smoking Acres 212 3 259 728 6 219 3 308 20 550 34 277 Fires 51 1 101 53 36 535 16 267 18 043 Incendiary Acres 7 596 499 207 2 946 1 243 35 371 359 739 906 101 Fires 112 286 51 51 152 7 456 8 108 Equipment Acres 9 129 9 146 2 086 35 22 641 214 531 257 567 Fires 17 19 3 19 1 138 1 196 Railroads Acres 5 337 57 400 386 6 344 12 524 Fires 20 887 7 37 2 661 3 612 Juveniles Acres 1 662 34 170 53 73 13 479 49 437 Fires 39 1 099 66 36 113 23 646 24 999 Debris Acres 598 32 527 10 795 6 219 5 831 233 102 289 072 Fires 179 1 463 96 96 771 13 712 16 317 Miscellaneous Acres 24 184 70 141 10 643 1 168 282 008 521 442 909 586
Grand Fires 2 402 6 260 481 680 7 485 74 812 92 120 Total Acres 997 135 1 084 483 497 556 213 901 1 571 488 2 703 021 7 067 584

29
Fire Statistics All Jurisdictions - Calendar Year 2003
State/ Cause BLM BIA FWS NPS FS Private Totals
Fires 2 366 937 124 519 6 183 4 436 14 565 Lightning Acres 244 491 100 529 131 904 312 054 131 811 552 028 1 472 817 Fires 84 139 45 60 1 053 1 377 2 758 Campfire Acres 387 141 566 53 512 1 637 22 748 78 991 Fires 15 118 5 18 139 1 883 2 178 Smoking Acres 71 860 2 46 528 12 246 13 753 Fires 67 1 108 70 13 538 12 270 14 066 Incendiary Acres 6 951 27 233 4 640 478 2 748 230 555 272 606 Fires 115 318 45 37 159 6 860 7 534 Equipment Acres 12 852 24 944 953 3 513 896 1 174 565 1 217 724 Fires 14 19 0 16 1 025 1 074 Railroads Acres 168 918 0 12 8 973 10 071 Fires 19 1 110 8 44 1 686 2 867 Juveniles Acres 3 587 7 435 3 21 139 56 729 88 893 Fires 35 1 068 49 18 96 18 536 19 802 Debris Acres 1 080 82 834 3 454 46 449 180 762 268 625 Fires 204 1 009 156 65 674 16 245 18 353 Miscellaneous Acres 67 669 192 439 18 700 1 523 12 066 416 573 708 970
Grand Fires 2 919 5 826 494 738 8 902 64 318 83 197 Totals Acres 337 257 437 334 160 219 371 175 171 286 2 655 179 4 132 450
Fire Statistics All Jurisdictions - Calendar Year 2004 State/
Cause BLM BIA FWS NPS FS Private Totals Fires 2 191 1 016 191 418 4 615 4 080 12 511 Lightning Acres 1 216 502 15 592 1 814 310 513 115 265 096 2 293 052 6 117 666 Fires 90 102 82 72 928 1 335 2 609 Campfire Acres 1 996 190 10 130 43 31 322 9 516 53 197 Fires 8 73 26 10 104 1 836 2 057 Smoking Acres 55 294 952 3 8 147 6 857 16 307 Fires 23 1 064 62 47 522 13 797 15 515 Incendiary Acres 2 565 13 267 9 103 2 617 36 322 241 654 305 529 Fires 105 236 29 34 173 6 660 7 237 Equipment Acres 5 299 5 896 844 30 54 689 138 199 204 956 Fires 8 11 5 17 956 997 Railroads Acres 1 987 53 5 66 7 127 9 237 Fires 13 644 9 42 2 245 2 953 Juveniles Acres 89 16 869 2 8 613 6 668 32 241 Fires 23 1 098 52 10 116 22 708 24 007 Debris Acres 3 615 12 270 1 123 3 21 527 221 050 259 588 Fires 260 1 023 78 80 603 12 356 14 400 Miscellaneous Acres 30 153 10 281 6 772 1 540 26 111 163 787 238 643
Grand Fires 2 721 5 267 520 685 7 120 65 973 82 286 Totals Acres 1 262 258 74 711 1 843 234 517 357 451 893 3 087 910 7 237 363

30
Annex 2: Fuel Treatment Statistics
Fuels Treatment Project Summary Departments of Agriculture and the Interior
2001
Wildland Urban Interface Acres Other Acres Total
Agency
Prescribed Fire Mechanical Other Prescribed
Fire Mechanical Other Acres Treated
BIA
1 033
7 382
-
55 389
10 206
-
74 010
BLM
35 989
62 601
-
116 355
99 033
-
313 978
FWS
49 066
5 423
-
186 655
529
760
242 433
NPS
2 040
350
453
60 509
696
33 643
97 691
FS
460 219
140 429
10 903
685 154
63 848
1 144
1 361 697
Total
548 347
216 185
11 356
1 104 062
174 312
35 547
2 089 809
2002 Wildland Urban Interface Acres Other Acres Total
Agency
Prescribed Fire Mechanical Other Prescribed
Fire Mechanical Other Acres Treated
BIA 691
12 924
10 886
64 264
21 042
10 954
120 761
BLM 34 659 83 615 -
84 920 117 892 - 321 086
FWS
26 329 21 216
3 969
342 458 5 287 54 346 453 605
NPS
7 825 7 118
87
143 750
4 230
501
163 511
FS
711 216
51 306
1 845
372 910
61 241
-
1 198 518
Total
780 720
176 179
16 787
1 008 302
209 692
65 801
2 257 481
2003 Wildland Urban Interface Acres Other Acres Total
Agency
Prescribed Fire Mechanical Other Prescribed
Fire Mechanical Other Acres Treated
BIA
9,164
33,773
1,042
85,214
27,718
-
156,911
BLM
68,101 93,248
97,833
143,654
66,999
106,996
576,831
FWS
127,228
22,898
4,300
226,866
5,771
405
387,468
NPS
14,080
8,171
272
111,418
1,968
1,718
137,627
FS
970,252 142,739
1,115
280,584
58,655
-
1,453,345
Total
1 188 825
300 829
104 562
847 736
161 111
109 119
2 712 182

31
2004
Wildland Urban Interface Acres Other Acres Total
Agency
Prescribed Fire Mechanical Other Prescribed
Fire Mechanical Other Acres Treated
BIA
20 181
45 887
3 728
77 909
42 396
1 820
191 921
BLM
61 980
104 616
48 673
137 097
74 771
65 080
492 217
FWS
140 933
21 574
6 544
270 358
5 283
320
445 012
NPS
26 928
8 398
444
91 576
2 942
1 245
131 533
FS
1 109 866
197 944
3 462
395 903
83 149
165
1 790 489
Total
1 359 888
378 419
62 851
972 843 208 541 68 630
3 051 172
2005 Wildland Urban Interface Acres Other Acres Total
Agency
Prescribed Fire Mechanical Other Prescribed
Fire Mechanical Other Acres Treated
BIA
24 164
19 892
1 502
65 327
23 427
200
134 512
BLM
28 101
102 820
13 613
82 479
32 835
38 009
297 857
FWS
109 009
5 369
80
219 139
3 629
235
337 461
NPS
46 465
6 308
94
50 456
1 447
1 000
105 770
FS
939 010
111 481
3 286
269 516
26 695
490
1 350 478
Total
1 146 749
245 870
18 575
686 917
88 033
39 934
2 226 078
Summary for 2001 - 2005 Wildland Urban Interface Acres Other Acres Total
Agency
Prescribed Fire Mechanical Other Prescribed
Fire Mechanical Other Acres Treated
BIA 55 233 119 858 17 158 348 103 124 789 12 974 678 115
BLM 228 830 446 900 160 119 564 505 391 530 210 085 2 001 969
FWS 452 565 76 480 14 893 1 245 476 20 499 56 066 1 865 979
NPS 97 338 30 345 1 350 457 709 11 283 38 107 636 132
FS 4 190 563 643 899 20 611 2 004 067 293 588 1 799 7 154 527
Total 5 024 529 1 317 482 214 131 4 619 860 841 689 319 031 12 336 722

32
PUBLICATIONS AVAILABLE ON FIRE MANAGEMENT Fire Management Working Papers: Thematic Paper Series Note: In Code “Working Paper FM/xx”, “x” indicates the WP series number and a suffix E, F or S indicates: E = English, F = French, S = Spanish, in case of multilingual papers. No suffix indicates E only. Available at the Fire Management web site: Working Paper FPF/1 Guidelines on Fire Management in Temperate and Boreal Forests.
November 2002. Working Paper FM/2 International Wildland Fire Management Agreements Template.
Tom Frey, Ricardo Vélez Muñoz. January 2004. Working Paper FM/3 Legal Frameworks for Forest Fire Management: International
Agreements and National Legislation. Fernando Fernández Arriaga, Frédéric St-Martin, Tom Frey, Ricardo Vélez Muñoz. March 2004.
Working Paper FM/4 Community-Based Fire Management in Spain. Ricardo Vélez Muñoz. April 2005.
Working Paper FM/5 Report on Fires in the South American Region. María Isabel Manta Nolasco. March 2006.
Working Paper FM/6 Report on Fires in the North East Asian Region. Leonid Kondrashov. March 2006.
Working Paper FM/7 Report on Fires in the Baltic Region and adjacent countries. Ilkka Vanha-Majamaa. March 2006.
Working Paper FM/8 Report on Fires in the Mediterranean Region. A.P. Dimitrakopoulos and I.D. Mitsopoulos. March 2006.
Working Paper FM/9 Report on Fires in the Sub-Saharan Africa (SSA) Region. Alexander Held. March 2006.
Working Paper FM/10 Report on Fires in the South East Asian Region. B.J. Shields, R.W. Smith and D. Ganz. March 2006.
Working Paper FM/11 Report on Fires in the Balkan Region. Nikola Nikolov. March 2006. Working Paper FM/12 Report on Fires in the Caribbean and Mesoamerican Regions. A.M.J.
Robbins. March 2006. Working Paper FM/13 Report on Fires in the Australasian Region. P.F. Moore. March 2006. Working Paper FM/14 Report on Fires in the South Asian Region. A.M. Benndorf and J.G.
Goldammer. March 2006. Working Paper FM/15 Report on Fires in the North American Region. R. Martínez, B.J. Stocks
and D. Truesdale. March 2006. Working Paper FM/16 Report on Fires in the Central Asian Region and adjacent countries.
Johann G. Goldammer. March 2006.