forest lake state high school queensland state school
TRANSCRIPT

Forest Lake State High School Queensland State School Reporting 2015 School Annual Report
Postal address PO Box 4063 Forest Lake 4078
Phone (07) 3714 2333
Fax (07) 3714 2300
Email [email protected]
Webpages Additional reporting information pertaining to Queensland state schools is located on the My School website and the Queensland Government data website.
Contact person Mr Tom Beck, Principal
Principal’s foreword
Introduction
This report proudly outlines the achievements of Forest Lake State High School and the statistics related to it from 2015. It depicts a successful and dynamic high school that is continually seeking further improvement. This year marked the culmination of the Flying Start initiative with the first cohort of Year 7s completing a year at Secondary School. An excellent preparation program for students and staff ensured the first intake of Year 7s at Forest Lake State High integrated quickly into the school and demonstrated the mature behaviour that leads to high levels of engagement and achievement. As a result of the addition of Year 7, Forest Lake State High experienced significant enrolment growth and the school actively recruited high quality staff, many with expertise in Year 7 teaching. Our Senior School also experienced outstanding success. 100 percent of our Year 12 students achieved a QCIE or QCIA and 84.3% of OP eligible students achieved an OP1-15, the highest results in the school’s history. We are very proud of the achievements documented in this Annual Report. It reflects the efforts and talents of over 160 dedicated staff members and 1430 students.
School progress towards its goals in 2015
In 2015 Forest Lake focused on three areas for improvement:
Excellence in teaching and learning
Successful learners
Community confidence
Excellence in Teaching and Learning
In the area of Teaching and Learning the school:
Continued to embed its Pedagogical Framework (using strategies based around the Art and Science of Teaching and Curiosity and Powerful Learning) including extensive professional development of staff.
Further developed and implemented a specific Junior Secondary pedagogy.
Enhanced the use of 21st Century learning strategies (including ICTs).
Implemented additional Inclusive and differentiated teaching strategies.
Reviewed and amended leadership and line management structures .
Successful Learners
In the area of Successful Learners the school:
Embedded a culture of explicit improvement including data tracking in the areas of: o Literacy and reading

o Numeracy o Attendance o Closing the gap
Further developed a specific Pathways curriculum to meet the needs of learners in: o Senior secondary o Junior secondary o Vocational and Special Needs areas
Refined its tracking systems including the use of OneSchool and TrackEd to utilize data from the following areas:
o All achievement o Task completion o Behaviour and attendance
Community confidence
In the area of Community Confidence the school enhanced its practices in the following areas
PRIDE (Positive Behaviour Management Strategy)
Signature programs (Lighthouse Academic Program, Rugby League and Aspiring Athletes Sporting Programs)
Student leadership
Future outlook
In 2016 the school will focus on the following five School Improvement Priorities:
Implementation of the EPIC (Exemplary Practices in Classrooms) Program of curriculum and pedagogical development
Further development of staff skills in applying the Art and Science of Teaching Pedagogical Framework and the PRIDE Behaviour Management Strategy.
Continued implementation of the Forest lake Reading Project
Implementation of Departmental Annual Performance Development Plans for Teachers, Heads of Program and School Leaders
Establishment of a reliable network to support a Bring Your Own Devices computer strategy and the development of policies and practices to sustain it.
Our school at a glance
School Profile
Coeducational or single sex: Coeducational
Independent Public School: No
Year levels offered in 2015: Year 7 - Year 12
Student enrolments for this school:
Total Girls Boys Indigenous
Enrolment Continuity
(Feb – Nov)
2013 1266 612 654 51 92%
2014 1246 594 652 62 92%
2015 1415 652 763 72 93%
Student counts are based on the Census (August) enrolment collection.
*From 2015, data for all state high schools include Year 7 students. Prior to 2015, only state high schools offering Year 7 had these students included in their counts.
In 2015, there were no students enrolled in a Pre-Prep program.*
*Pre-Prep is a kindergarten program for Aboriginal and Torres Strait Islander children, living across 35 Aboriginal and Torres Strait Islander
communities, in the year before school (http://deta.qld.gov.au/earlychildhood/families/pre-prep-indigenous.html).

Characteristics of the student body:
The student population is very diverse – ethnically and socio-economically. Approximately 40 different ethnic groups are represented in the school. Major groups include students from the Pacific Islands and New Zealand (20.3%) and students from Vietnam (1.3%). Approximately 5.6% of students identify as being of Aboriginal and Torres Strait Islands descent. Students with physical impairment, intellectual impairment, ASD and other disabilities are also catered for in an inclusive manner. The school values its diversity and this is reflected in all aspects of school life.
Average class sizes
Phase
Average Class Size
2013 2014 2015
Prep – Year 3
Year 4 – Year 7 Primary
Year 7 Secondary – Year 10 23 24 23
Year 11 – Year 12 21 20 20
*From 2015, data for all state high schools include Year 7 students. Prior to 2015, only state high schools offering Year 7 had these students included in their counts.
School Disciplinary Absences
* Caution should be used when comparing post 2013 SDA data as amendments to EGPA disciplinary provisions and changes in methodology
created time series breaks in 2014 and 2015.
**From 2015, Exclusion represents principal decisions to exclude rather than recommendations for exclusion. From 2015 where a principal decided
not to exclude, a small number of recommendations for exclusions have been counted as a long suspension. Exclusions, Cancellations and Long &
Charge Suspensions may be upheld or set aside through an appeals process.
Curriculum delivery
Our approach to curriculum delivery
The school uses the Art and Science of Teaching (ASOT) as the basis of its pedagogical framework. In addition to a full range of traditional academic subjects the school offers
an exceptional instrumental music program consisting of a drum-line, jazz and concert bands
a Junior Secondary School curriculum tailored to meet the learning and interests of students
school based literacy, numeracy and ICT subjects developed to scaffold the learning of students in years 8 - 10
a range of vocational education and training options. The strength and breadth of the Forest Lake SHS industry partnerships resulted in the school successfully partnering with three local State High schools and being awarded a coveted federally funded Trade Training Centre. The Centre, located beside Woodcrest State College became operational in 2014 with approximately 20 students from Forest Lake engaging in VET Certificate course including Construction and Automotive. In 2014 and 2015, the school partnered with Griffith University to develop the Accelerated Literacy Learning (ALL) program which is an evidence based reading development program. Results have been outstanding with significant improvements across the board.
Disciplinary Absences
Count of Incidents
2013 2014* 2015**
Short Suspensions - 1 to 5 days 272 219 339
Long Suspensions - 6 to 20 days 28 10 14
Exclusions 19 11 20
Cancellations of Enrolment 12 18 5

Extra curricula activities
Arts Forest Lake State High School is highly regarded for its extensive Arts programs and offerings, including extra-curricular activities. Music and instrumental music programs offer pathways of success for FLSHS students. A vast array of extracurricular activities occur in the Arts department. Students have opportunities to participate in
School performances, including regular junior and senior assemblies
Fanfare (music)
Brisbane EKKA Urban Upbeat Competition (music)
Music Tour or Music Camp (alternating each year)
State Honours Ensemble Program (music)
Drama Club
Dance Competitions (including eisteddfods, Remix (hip hop))
Brisbane Performing Arts Challenge (dance)
Creative Generation Excellence Awards in Visual Art
Music Extension Recitals/Concerts
Film and Television Showcase Night
Senior Drama Performance Night
Dreamworld Performance (music)
Dance Night
Music Excellence Day
Community Events
Artists in Residence (drama, dance)
Salvation Army partnership (music)
Music Theatre Excursions (music, dance, drama, film and television)
Duke of Edinburgh program Sport Sport is a vibrant and integral component of our culture at Forest Lake. We have several inter-house competitions including swimming, athletics and cross country. Our school captains and house leaders are actively involved in the promotion of house spirit. A number of our students go on to represent both the region in these areas. Our school is a member of the Yagara sporting district and participates in an interschool sporting competition that takes place after school each Tuesday. Each sport is represented in three age groups, under 13, under 15 and Open. The following sports are on offer for our students
Netball
Basketball
Soccer
Touch
Rugby League
Volleyball
How Information and Communication Technologies are used to improve learning
Information and Communication Technology is integral to learning. The use of ICTs can accelerate, enable, improve and
transform student learning in all key learning areas and phases of education. Through use of ICTs, teachers can engage the
digital generation, improve individual learning opportunities, spark innovation and enhance pedagogy.
eLearning is a transformative process that empowers teachers and students to work in new ways, provides unlimited access to
knowledge and information, and enhances students’ abilities to construct new knowledge.
The school has 5 fully equipped computer classrooms and 7 clusters x 15 computers across Junior Secondary School pods/classrooms. The computer classrooms have hardware that is capable of running high end applications including AutoCAD and the Adobe software suite.
Data projectors are installed in every classroom to enable teacher and student access to a range of eLearning opportunities
Virtual classrooms (online classrooms) have been set up for every key learning area/subject. These are especially helpful for students who are unable to attend school for a period of time as they can access the curriculum materials online from home or an alternate location.
Forest Lake State High School is a Bring Your Own device school. The school does, however provide laptops to students in years
8 and 9 Lighthouse classes. Students across the school who cannot provide their own laptop may borrow one from the school’s
supply of older devices.
Social Climate
In 2015 the following contributed to a positive and supportive school climate:
The school’s PRIDE program (positive behavioural support basis) continued to be refined to ensure consistent practice and expectations for staff and students across the whole school. Students received weekly explicit PRIDE lessons targeting PRIDE values and expectations, cyber-bullying, enhancing student social skills, resilience and tolerance. The school has a zero tolerance to bullying, and while acknowledging that some instances of bullying and/or harassment will always occur, each reported incident is fully investigated and followed up in accordance with the school’s Responsible Behaviour Plan for Students.
PRIDE processes were more closely aligned to ASoT which ensured that students across the school were receiving a consistent message, behaviorally, academically and socially.
The Junior Secondary School is structured in pods, creating a supportive cluster of classrooms which provide a stable environment for students in Junior Secondary and the transition of year 7 students into highschool..
A junior secondary ACCESS program focused on the health and wellbeing of adolescent learners.
A senior school ACCESS program focusing on Certificate I in Work Education, career planning, life skills and personal health and safety issues.
The student support team consisting of two Guidance Officers, a Youth Support Coordinator, School-based Health Nurse, Student Welfare Worker and ATSI Coordinator. This was supplemented by the inclusion of a Success Coach whose primary purpose was to support at risk students in year 9.
Caring and supportive staff who are individually and collectively committed to supporting students achieve their many and varied goals and dreams.
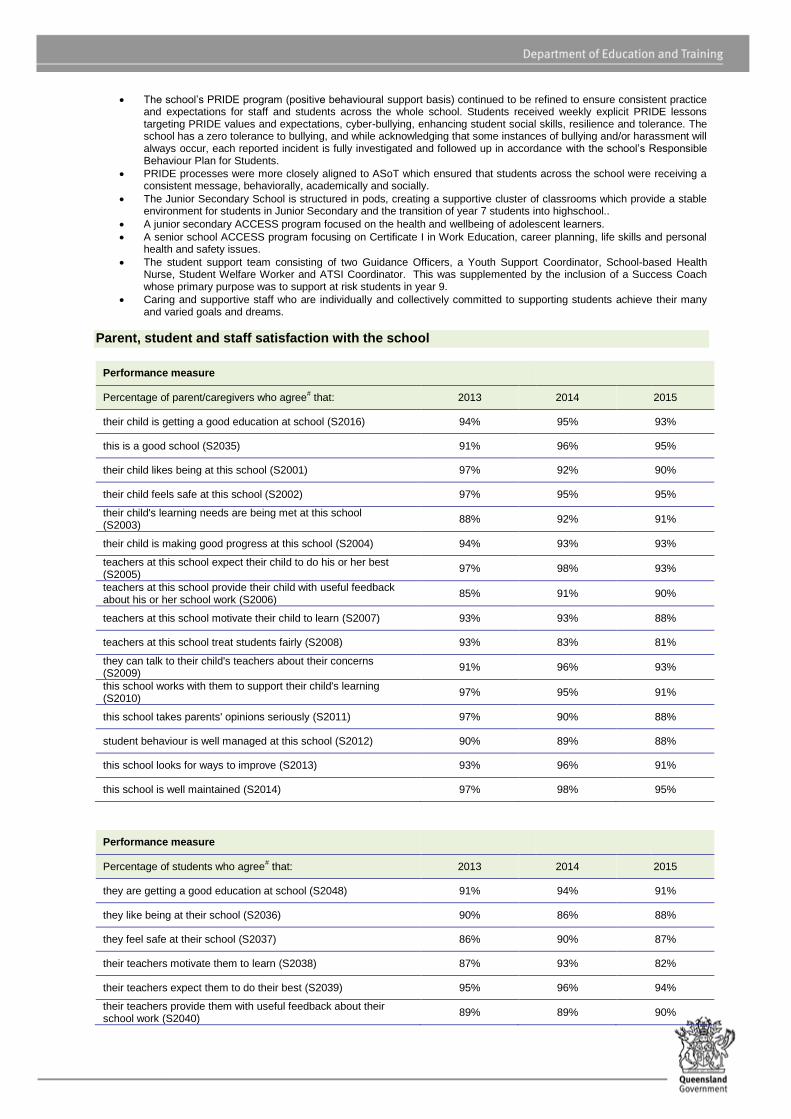
Parent, student and staff satisfaction with the school
Performance measure
Percentage of parent/caregivers who agree# that: 2013 2014 2015
their child is getting a good education at school (S2016) 94% 95% 93%
this is a good school (S2035) 91% 96% 95%
their child likes being at this school (S2001) 97% 92% 90%
their child feels safe at this school (S2002) 97% 95% 95%
their child's learning needs are being met at this school (S2003)
88% 92% 91%
their child is making good progress at this school (S2004) 94% 93% 93%
teachers at this school expect their child to do his or her best (S2005)
97% 98% 93%
teachers at this school provide their child with useful feedback about his or her school work (S2006)
85% 91% 90%
teachers at this school motivate their child to learn (S2007) 93% 93% 88%
teachers at this school treat students fairly (S2008) 93% 83% 81%
they can talk to their child's teachers about their concerns (S2009)
91% 96% 93%
this school works with them to support their child's learning (S2010)
97% 95% 91%
this school takes parents' opinions seriously (S2011) 97% 90% 88%
student behaviour is well managed at this school (S2012) 90% 89% 88%
this school looks for ways to improve (S2013) 93% 96% 91%
this school is well maintained (S2014) 97% 98% 95%
Performance measure
Percentage of students who agree# that: 2013 2014 2015
they are getting a good education at school (S2048) 91% 94% 91%
they like being at their school (S2036) 90% 86% 88%
they feel safe at their school (S2037) 86% 90% 87%
their teachers motivate them to learn (S2038) 87% 93% 82%
their teachers expect them to do their best (S2039) 95% 96% 94%
their teachers provide them with useful feedback about their school work (S2040)
89% 89% 90%

Performance measure
Percentage of students who agree# that: 2013 2014 2015
teachers treat students fairly at their school (S2041) 83% 79% 68%
they can talk to their teachers about their concerns (S2042) 78% 73% 69%
their school takes students' opinions seriously (S2043) 85% 82% 72%
student behaviour is well managed at their school (S2044) 66% 72% 64%
their school looks for ways to improve (S2045) 92% 91% 86%
their school is well maintained (S2046) 86% 82% 89%
their school gives them opportunities to do interesting things (S2047)
84% 80% 85%
Performance measure
Percentage of school staff who agree# that: 2013 2014 2015
they enjoy working at their school (S2069) 95% 98% 100%
they feel that their school is a safe place in which to work (S2070)
97% 99% 100%
they receive useful feedback about their work at their school (S2071)
84% 86% 89%
they feel confident embedding Aboriginal and Torres Strait Islander perspectives across the learning areas (S2114)
85% 82% 92%
students are encouraged to do their best at their school (S2072)
97% 99% 100%
students are treated fairly at their school (S2073) 100% 99% 100%
student behaviour is well managed at their school (S2074) 97% 98% 100%
staff are well supported at their school (S2075) 88% 96% 93%
their school takes staff opinions seriously (S2076) 79% 92% 89%
their school looks for ways to improve (S2077) 98% 98% 98%
their school is well maintained (S2078) 100% 98% 98%
their school gives them opportunities to do interesting things (S2079)
86% 90% 95%
# ‘Agree’ represents the percentage of respondents who Somewhat Agree, Agree or Strongly Agree with the statement. DW = Data withheld to ensure confidentiality.
Parent and Community Engagement
Forest Lake State High School is a genuine reflection of its residential community. The school has a very active Parents and
Citizen’s Association that has a significant input into the school’s decision making processes. The P and C is consulted about all
major decisions and supplies funds for school projects. Parents are also involved in their students’ education through fortnightly
newsletters, media articles and parent information and parent-teacher meetings. The staff are pro-active in contacting parents
where there are concerns with students’ progress, attendance and behaviour.
The school champions diversity. There are programs for Harmony Day, Sorry Day and NAIDOC Week and cultural performances
from the school’s diverse community are showcased where appropriate. The school attempts to maximise inclusion and is adding
automatic doors to improve access to all facilities. All learning experiences, excursions and extra-curricular activities are designed
for maximum inclusion.
Forest Lake State High School seeks to interact extensively with its community. The school provides a venue for community
cultural and sporting activities and takes a leading role in community celebrations such as Clean Up Australia Day and ANZAC
Day. The school also supports a range of charitable causes and gives preference to local tradespeople. It interacts extensively
with local businesses through school-based apprenticeships and traineeships and work experience.

Reducing the school’s environmental footprint
Staff and students are attempting to reduce the school’s environmental footprint. Energy use is minimised by conservation
measures such as switching off lights and fans in unoccupied rooms. In 2015 a new follow-me printing process was finalised for
introduction in 2016 that should greatly reduce the use of paper.
Environmental footprint indicators
Years Electricity
kWh Water kL
2012-2013 691,456 7,417
2013-2014 743,410 5,495
2014-2015 746,686 11,241
*The consumption data is compiled from sources including ERM, Ergon reports and utilities data entered into OneSchool by each school. The data provides an indication of the consumption trend in each of the utility categories which impact on the school’s environmental footprint.
Our staff profile
Staff composition, including Indigenous staff
2015 Workforce Composition Teaching Staff* Non-teaching
Staff Indigenous Staff
Headcounts 112 49 <5
Full-time equivalents 107 38 <5
Qualification of all teachers
Highest level of
attainment
Number of
Teaching Staff *
Certificate 0
Diploma 5
Advanced Diploma 0
Bachelor Degree 60
Graduate Diploma etc.** 38
Masters 7
Doctorate 2
Total 112
05
0
60
38
72
0
10
20
30
40
50
60
70
*Teaching staff includes School Leaders
**Graduate Diploma etc. includes Graduate Diploma, Bachelor Honours Degree, and Graduate Certificate.
Expenditure on and teacher participation in professional development
The total funds expended on teacher professional development in 2015 were $190 772.15.
The major professional development initiatives are as follows:
Literacy and Numeracy
eLearning
QCAA syllabus implementation compliance and monitoring

Vocational education and training compliance and industry currency
Key learning area specific professional development
Strategic planning
Accelerated Literacy Learning (Reading) project
Art and Science of Teaching implementation
School pathways
ATSI perspectives
Quality Schools Inclusive Leaders (QSIL) implementation
Flying Start leading change
School Wide Positive Behaviour
The proportion of the teaching staff involved in professional development activities during 2015 was 100%.
Average staff attendance 2013 2014 2015
Staff attendance for permanent and temporary staff and school leaders. 96% 95% 95%
Proportion of staff retained from the previous school year
From the end of the previous school year, 99% of staff was retained by the school for the entire 2015 school year.
School income broken down by funding source
School income broken down by funding source is available via the My School website at http://www.myschool.edu.au/.
To access our income details, click on the My School link above. You will then be taken to the My School website with the following ‘Find a school’ text box.
Where it says ‘School name’, type in the name of the school you wish to view, select the school from the drop-down list and select <GO>. Read and follow the instructions on the next screen; you will be asked to confirm that you are not a robot then by clicking continue, you acknowledge that you have read, accepted and agree to the Terms of Use and Privacy Policy before being given access to the school’s profile webpage.
School financial information is available by selecting ‘School finances’ in the menu box in the top left corner of the school’s profile webpage. If you are unable to access the internet, please contact the school for a paper copy of income by funding source.

Performance of our students
Key student outcomes
Student attendance 2013 2014 2015
The overall attendance rate for the students at this school (shown as a percentage). 89% 89% 89%
The attendance rate for Indigenous students at this school (shown as a percentage). 85% 85% 87%
The student attendance rate is generated by dividing the total of full-days and part-days that students attended, and comparing this to the total of all possible days for students to attend, expressed as a percentage.
The overall attendance rate in 2015 for all Queensland Secondary schools was 90%.
Student attendance rate for each year level (shown as a percentage)
Prep Year
1 Year
2 Year
3 Year
4 Year
5 Year
6 Year
7 Year
8 Year
9 Year 10
Year 11
Year 12
2013 91% 89% 88% 88% 90%
2014 92% 89% 88% 88% 89%
2015 91% 90% 88% 87% 88% 90%
*From 2013, the methodology used for calculating attendance rates effectively counts attendance for every student for every day of attendance in Semester 1. The student attendance rate is generated by dividing the total of full-days and part-days that students attended, and comparing this to the total of all possible days for students to attend, expressed as a percentage.
DW = Data withheld to ensure confidentiality.
Student attendance distribution
The proportions of students by attendance range.
Description of how non-attendance is managed by the school
Non-attendance is managed in state schools in line with the DET procedures, Managing Student Absences and Enforcing Enrolment and Attendance at State Schools and Roll Marking in State Schools, which outline processes for managing and recording student attendance and absenteeism.
26
22
25
14
15
11
24
24
23
36
39
40
0% 20% 40% 60% 80% 100%
2015
2014
2013
Proportion of Students
Attendance Rate: 0% to <85% 85% to <90% 90% to <95% 95% to 100%

As per the above policies, rolls are marked each morning during a 10 minute roll marking class. Parents of students identified as absent during the whole school roll marking (10 minutes) are notified via text message of the absence at approximately 10.30 am each morning.
Teachers subsequently mark class rolls in each of the 4 periods throughout the day. Follow up of students who are marked present at the whole school roll marking and are absent from individual lessons is the responsibility of a team comprising heads of department for each year level, roll mark teachers and class teachers. This may include an email or phone call to parents.
Processes are in place to monitor and manage student truancy. Verified truancies result in phone or email contact with the parent to notify them of the student absence and consequent make up time. ID Attend software is used to record and follow up truancies. If the problem persists, it is escalated to the respective associate deputy principal or deputy principal.
Parents of students with excessive unexplained absences are contacted by associate deputy principals or deputy principals and are requested to explain such absences to the school. Continuing unexplained absences in years 11 and 12 may result in the student’s enrolment being cancelled.
National Assessment Program – Literacy and Numeracy (NAPLAN) results – our reading,
writing, spelling, grammar and punctuation, and numeracy results for the Years 3, 5, 7, and 9.
Our reading, writing, spelling, grammar and punctuation, and numeracy results for the Years 3, 5, 7 and 9 are available via the My
School website at http://www.myschool.edu.au/.
To access our NAPLAN results, click on the My School link above. You will then be taken to the My School website with the
following ‘Find a school’ text box.
Where it says ‘School name’, type in the name of the school you wish to view, select the school from the drop-down list and select <GO>. Read and follow the instructions on the next screen; you will be asked to confirm that you are not a robot then by clicking continue, you acknowledge that you have read, accepted and agree to the Terms of Use and Privacy Policy before being given access to the school’s profile webpage.
School NAPLAN information is available by selecting ‘NAPLAN’ in the menu box in the top left corner of the school’s profile webpage. If you are unable to access the internet, please contact the school for a paper copy of our school’s NAPLAN results.
Outcomes for our Year 12 cohorts 2013 2014 2015
Number of students receiving a Senior Statement 250 208 213
Apparent retention rates Year 10 to Year 12 2013 2014 2015
Year 12 student enrolment as a percentage of the Year 10 student cohort. 87% 91% 92%
Year 12 Indigenous student enrolment as a percentage of the Year 10 Indigenous student cohort.
56% 93% 114%

Outcomes for our Year 12 cohorts 2013 2014 2015
Number of students awarded a Queensland Certificate of Individual Achievement. 1 0 3
Number of students receiving an Overall Position (OP) 120 66 51
Percentage of Indigenous students receiving an Overall Position (OP) 50% 8% 17%
Number of students who are completing/continuing a School-based Apprenticeship or Traineeship (SAT).
21 35 42
Number of students awarded one or more Vocational Educational Training (VET) qualifications (incl. SAT).
191 147 171
Number of students awarded an Australian Qualification Framework Certificate II or above.
158 122 146
Number of students awarded a Queensland Certificate of Education (QCE) at the end of Year 12.
234 204 210
Percentage of Indigenous students awarded a Queensland Certificate of Education (QCE) at the end of Year 12.
100% 100% 100%
Number of students awarded an International Baccalaureate Diploma (IBD). 0 0 0
Percentage of OP/IBD eligible students with OP 1-15 or an IBD. 77% 79% 84%
Percentage of Year 12 students who are completing or completed a SAT or were awarded one or more of the following: QCE, IBD, VET qualification.
98% 100% 100%
Percentage of Queensland Tertiary Admissions Centre (QTAC) applicants receiving an offer.
96% 98% 92%
As at 16 February 2016. The above values exclude VISA students.
As at 16 February 2016. The above values exclude VISA students.
As at 16 February 2016. The above values exclude VISA students.
VET Qualifications completed in 2015 include
Certificate I in Business
Certificate I in Information, Digital Media and Technology
Overall Position Bands (OP)
Number of students in each Band for OP 1 to 25
Years OP 1-5 OP 6-10 OP 11-15 OP 16-20 OP 21-25
2013 14 36 42 26 2
2014 15 18 19 13 1
2015 8 18 17 7 1
Vocational Educational Training qualification (VET)
Number of students completing qualifications under Australian Qualification Framework (AQF)
Years Certificate I Certificate II Certificate III or above
2013 102 143 47
2014 61 99 42
2015 46 129 31

Certificate I in Engineering
Certificate I in Construction
Certificate I in Work Education
Certificate II in Automotive Servicing
Certificate II in Business
Certificate II in Information, Digital Media and Technology
Certificate II in Workplace Practices
Certificate II in Sport and Recreation
Certificate II in Active Volunteering
Certificate II in Retail
Certificate II in Animal Studies
Certificate III in Business
Certificate III in Children’s Services
Certificate III in Hospitality
Certificate III in Information Technology
Certificate III in Retail
Certificate III in Aged Care
Certificate III in Fitness
Diploma of Business
Post-school destination information
At the time of publishing this School Annual Report, the results of the 2016 post-school destinations survey, Next Step – Student Destination Report (2015 Year 12 cohort) for the school were not available. Information about these post-school destinations of our students will be uploaded to the school’s website in September.
Early school leavers information
In 2015, 106 students in year 10-12 who began the year as students of Forest Lake SHS left before the end of the school year.
Students left school early for a variety of reasons including personal/family reasons, e.g. work, moving or illness (92), unknown
reasons (1) or cancellation of enrolment/exclusion from school (13). Less than 2% of students in year 10-12 exited the school due
to cancellation of enrolment/exclusion. The majority of year 10 students (40 out of 49) who left early re-enrolled with new schools
and left for personal/family reasons or unknown reasons. Ten students in Year 11 had their enrolment cancelled with two of these
transitioning to the TAFE sector.
Forest Lake SHS has a strong culture of school wide positive behaviour to encourage students to positively engage in schooling.
Year 10-12 students have support from a year coordinator and an Associate Deputy Principal or Deputy Principal for each year
level who builds a solid understanding of students and develops strong relationships with them and their families. As a school we
engage with external providers to access alternate programs that support transition of students beyond school and we continue to
differentiate our curriculum in the senior school to provide for a diverse range of academic and vocational pathways to meet the
needs of individual students.