highland reserve state school queensland state school
TRANSCRIPT
Highland Reserve State School Queensland State School Reporting 2015 School Annual Report
Postal address 570 Reserve Road Upper Coomera 4209
Phone (07) 5588 3333
Fax (07) 5588 3300
Email [email protected]
Webpages Additional reporting information pertaining to Queensland state schools is located on the My School website and the Queensland Government data website.
Contact person The Principal
Principal’s foreword
Introduction
Highland Reserve State School was established in 2009 in the rapidly growing suburb of Upper Coomera. The co-educational school caters for students from preparatory to year 6 (P-6).
Highland Reserve State School has experienced continual growth in enrolments since the school opened, with this trend expected to continue. The school focuses on providing a safe, positive learning environment for all students and staff. High standards of behavior are expected from students which is outlined in the school’s Responsible Behaviour Plan for students.
Highland Reserve State School provides a quality education to equip students for the future, to enable them to contribute to a socially, economically and culturally vibrant society. Highland Reserve State School’s shared vision of “Clever, Skilled and Creative Students”, supports the continual provision of an effective learning environment where students are challenged to reach to their potential and strive the excel. Students are encouraged to be aware of their learning needs and to actively engage in mapping out the steps that inform their growth as learners.
Our success in 2015 has been based on the following four key components.
1. Continued high expectations for all groups of students by setting high standards and learning achievement targets supported by a focus on success
2. The ongoing promotion of a high performance staff culture supported by a focus on evidence based teaching practices and regular review of outcomes
3. An understanding that teachers and parents can make significant academic progress when working in partnership
4. A belief by all that student outcomes can and will be improved through effective teaching and a personalized approach to learning.
At Highland Reserve State School we believe the core skills in literacy and numeracy are critical to success and subsequent future life opportunities. As such we are transitioning a culture where the use of learning data critically informs specific teaching and learning programs. Importantly the use of human resources, physical resources and resource purchasing in deliberately targeted learning needs of children is prioritized to meet the learning needs of every child.
The following report provides an overview of Highland Reserve State School’s progress towards its goals for 2015.
School progress towards its goals in 2015
Highland Reserve State School set the following priority areas for development in 2015:
Data driven personalized learning, academic rigor and evidence based effective teaching
Positive Behaviour for Learning
Science
Programs of Excellence
In addition to this the commitment to core learning priorities listed below:
Reading
Numeracy
Writing
Future outlook
As outlined in the Annual Implementation Plan for 2016, the key improvement agenda is focused on the following priorities:
- Reading
- Spelling
- Positive Behaviour for Learning
- My Learning – My Goals
These improvement areas have come from a need identified in school review processes and data sets within the school. The focus areas include the enhancement of school programs, classroom delivery and the use of a common language across the school. The following key strategies will not only support the development of the key priorities but will sustain exemplar practice across the school: - Continue to review and track student performance data and apply evidence based interventions
to maximize learning outcomes for every student - Refine responses to student data at a classroom level to make obvious links to personalized
learning - Develop and refine a concise improvement agenda with clear links to flexible and in time
resourcing - Review P-3 curriculum and pedagogical practices with a view to creating an enhanced
educational experience and transition from early childhood care - Invest in providing enhanced Information and Communication Technology (ICT) across the
school to assist learning - Develop “programs of excellence” within the school in areas of Academics, Sport, The Arts and
Community - Invest in quality staff professional learning programs related to key priorities within the school
Another priority for 2016 will be the development of a long term 2020 Strategic Plan that will guide the future direction of the school.

Our school at a glance
School Profile
Coeducational or single sex: Coeducational
Independent Public School: Yes
Year levels offered in 2015: Prep Year - Year 6
Student enrolments for this school:
Total Girls Boys Indigenous
Enrolment Continuity
(Feb – Nov)
2013 673 312 361 21 93%
2014 766 363 403 18 93%
2015 772 366 406 21 94%
Student counts are based on the Census (August) enrolment collection.
*From 2015, data for all state high schools include Year 7 students. Prior to 2015, only state high schools offering Year 7 had these students included in their counts.
Characteristics of the student body:
Students attending Highland Reserve State School reside in the communities and estates of Upper Coomera, Wongawallen, Heritage Gardens, Highland Reserve and Reserve Rise. This area is experiencing rapid population growth. Many young families move into this area from interstate and overseas to access work in both Brisbane and the gold Coast and to raise their families in a semi-rural environment with coastal access. Families value and seek quality educational outcomes, support their child’s education at school and become involved in many ways to support their child’s achievement. The school maintains a highly respected status in the community and as such many people choose to buy or rent within the school catchment area.
Average class sizes
Phase
Average Class Size
2013 2014 2015
Prep – Year 3 23 24 23
Year 4 – Year 7 Primary 25 24 26
Year 7 Secondary – Year 10
Year 11 – Year 12
*From 2015, data for all state high schools include Year 7 students. Prior to 2015, only state high schools offering Year 7 had these students included in their counts.

School Disciplinary Absences
* Caution should be used when comparing post 2013 SDA data as amendments to EGPA disciplinary provisions and changes in methodology
created time series breaks in 2014 and 2015.
**From 2015, Exclusion represents principal decisions to exclude rather than recommendations for exclusion. From 2015 where a principal decided
not to exclude, a small number of recommendations for exclusions have been counted as a long suspension. Exclusions, Cancellations and Long &
Charge Suspensions may be upheld or set aside through an appeals process.
Curriculum delivery
Our approach to curriculum delivery
The school offers a quality education in the key learning areas of English, Mathematics, Science, History, Geography, The Arts, Technology, Health and Physical Education and LOTE (Chinese).
Music, Health and Physical Education and Chinese are taught by specialist teachers.
The school demands a strong focus on Literacy and Numeracy across all key learning areas.
In 2015, distinctive curriculum programs included:
- English Intervention Programs – Support A Reader (SAR) and intensive intervention guided reading groups
- English and Mathematics extension programs – Upper two bands (high performing students program)
- Pastoral care programs including, ‘Kids Matter’, chaplaincy, behavior management and social skills
- Tailored programs in support a reader, support a writer and support a talker in Early Years
- Sport – Gala Sports program, cross country, swimming and athletics
- Technology supported learning programs across the curriculum
- Science club, showcase night and robotics club
- Arts Excellence through choir, various band programs (instrumental, drum line, guitar) and strings
- Special Education Programs (SEP) including lunch clubs, specially tailored education programs, facilitation of specialist advisor programs for students with diagnosed disabilities and the support of special learning needs as required
Extra curricula activities
Highland Reserve State School aims to provide students with a wide array of academic, sporting, cultural and community programs to support the individual needs of students.
Disciplinary Absences
Count of Incidents
2013 2014* 2015**
Short Suspensions - 1 to 5 days 14 9 19
Long Suspensions - 6 to 20 days 0 0 0
Exclusions 0 0 0
Cancellations of Enrolment 0 0 0
In 2015, these experiences included:
- Choir - Strings - Instrumental - Gala Sports - Cross Country, Athletics and swimming carnivals - Camps and excursions - Robotics club - Gardening club - Running club
How Information and Communication Technologies are used to improve learning
At Highland Reserve State School computers are viewed as essential learning tools to enhance the learning outcomes of students. Students’ confidence in using various Information Technologies including laptops, iPads, digital cameras and interactive whiteboards allows opportunities for students to connect with the world. Students enjoy a high ratio of computers to students and have access to laptops computers in the classroom. Students are exposed to a variety of programs to provide them with multiple tools to engage their learning experiences.
2016 will focus on further resource development and strategies for engaging learners in the digital platform within the classroom.
Social Climate
The school enjoys a healthy social climate supported by the “Kids Matter” ethos. Highland Reserve
State School is a great school where children can come to learn in a supportive environment. At
Highland Reserve State School we are committed to creating and maintaining a safe, respectful and
responsible learning environment through the following rules:
Effort – we have the responsibility to try our best in all that we do
Safety – we have the right to work and play in a pleasant, clean and safe environment
Respect – we have the right to be happy and to be treated with respect, understanding and
politeness
Responsibility – we accept responsibility for our choices and our actions
Our school has a behavior team that works on the research based methods outlined in the “Positive
Behaviour for Learning” (PBL) approach. PBL is a dedicated team that uses the school’s behavior data
to proactively support students and our community in making positive behavior choices. A major part of
this program in underpinned by regular behavior being taught weekly in classrooms to build student
capacity in demonstrating the high standards of behavior at the school.
Our school is supported by the services of a Guidance Officer and a Chaplain. We also enjoy access to
various community services through referral programs.
The school has an extremely active Parents and Citizens Association who work hard to achieve the
best possible outcomes for children. They support the “Kids Matter” program and also assist in running
major fundraising events at the school to purchase classroom resources such as iPads.
Parent, student and staff satisfaction with the school
Performance measure
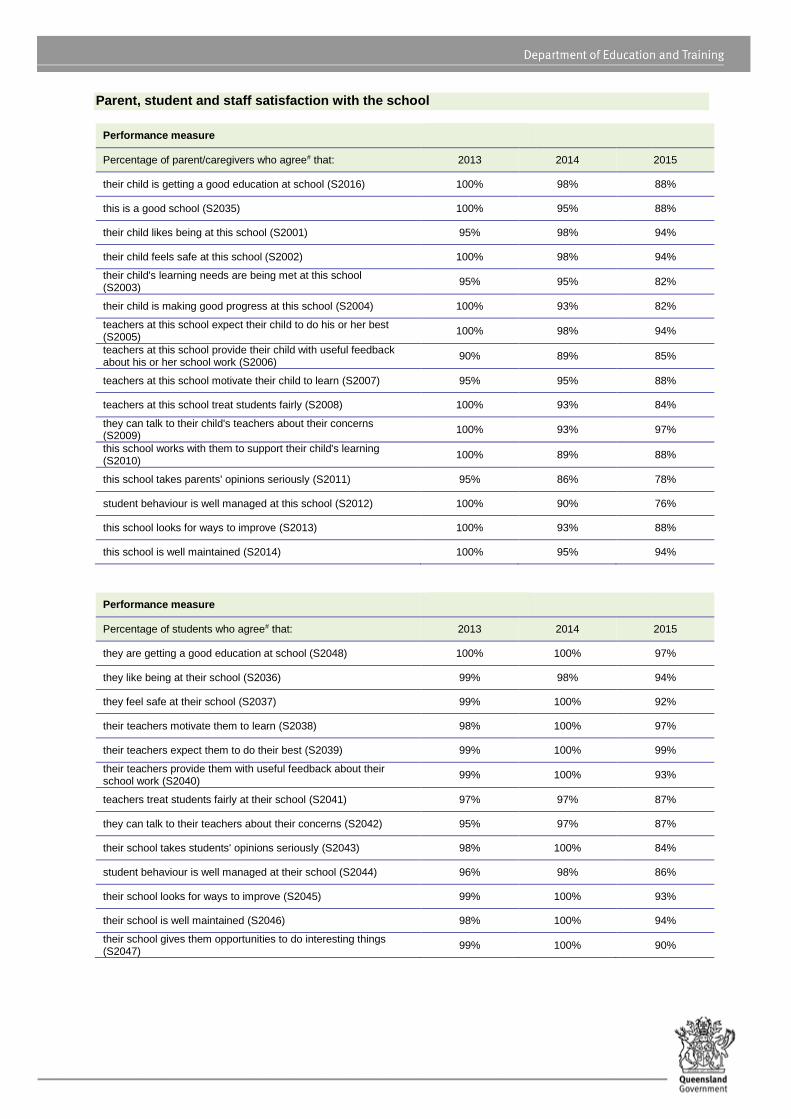
Percentage of parent/caregivers who agree# that: 2013 2014 2015
their child is getting a good education at school (S2016) 100% 98% 88%
this is a good school (S2035) 100% 95% 88%
their child likes being at this school (S2001) 95% 98% 94%
their child feels safe at this school (S2002) 100% 98% 94%
their child's learning needs are being met at this school (S2003)
95% 95% 82%
their child is making good progress at this school (S2004) 100% 93% 82%
teachers at this school expect their child to do his or her best (S2005)
100% 98% 94%
teachers at this school provide their child with useful feedback about his or her school work (S2006)
90% 89% 85%
teachers at this school motivate their child to learn (S2007) 95% 95% 88%
teachers at this school treat students fairly (S2008) 100% 93% 84%
they can talk to their child's teachers about their concerns (S2009)
100% 93% 97%
this school works with them to support their child's learning (S2010)
100% 89% 88%
this school takes parents' opinions seriously (S2011) 95% 86% 78%
student behaviour is well managed at this school (S2012) 100% 90% 76%
this school looks for ways to improve (S2013) 100% 93% 88%
this school is well maintained (S2014) 100% 95% 94%
Performance measure
Percentage of students who agree# that: 2013 2014 2015
they are getting a good education at school (S2048) 100% 100% 97%
they like being at their school (S2036) 99% 98% 94%
they feel safe at their school (S2037) 99% 100% 92%
their teachers motivate them to learn (S2038) 98% 100% 97%
their teachers expect them to do their best (S2039) 99% 100% 99%
their teachers provide them with useful feedback about their school work (S2040)
99% 100% 93%
teachers treat students fairly at their school (S2041) 97% 97% 87%
they can talk to their teachers about their concerns (S2042) 95% 97% 87%
their school takes students' opinions seriously (S2043) 98% 100% 84%
student behaviour is well managed at their school (S2044) 96% 98% 86%
their school looks for ways to improve (S2045) 99% 100% 93%
their school is well maintained (S2046) 98% 100% 94%
their school gives them opportunities to do interesting things (S2047)
99% 100% 90%
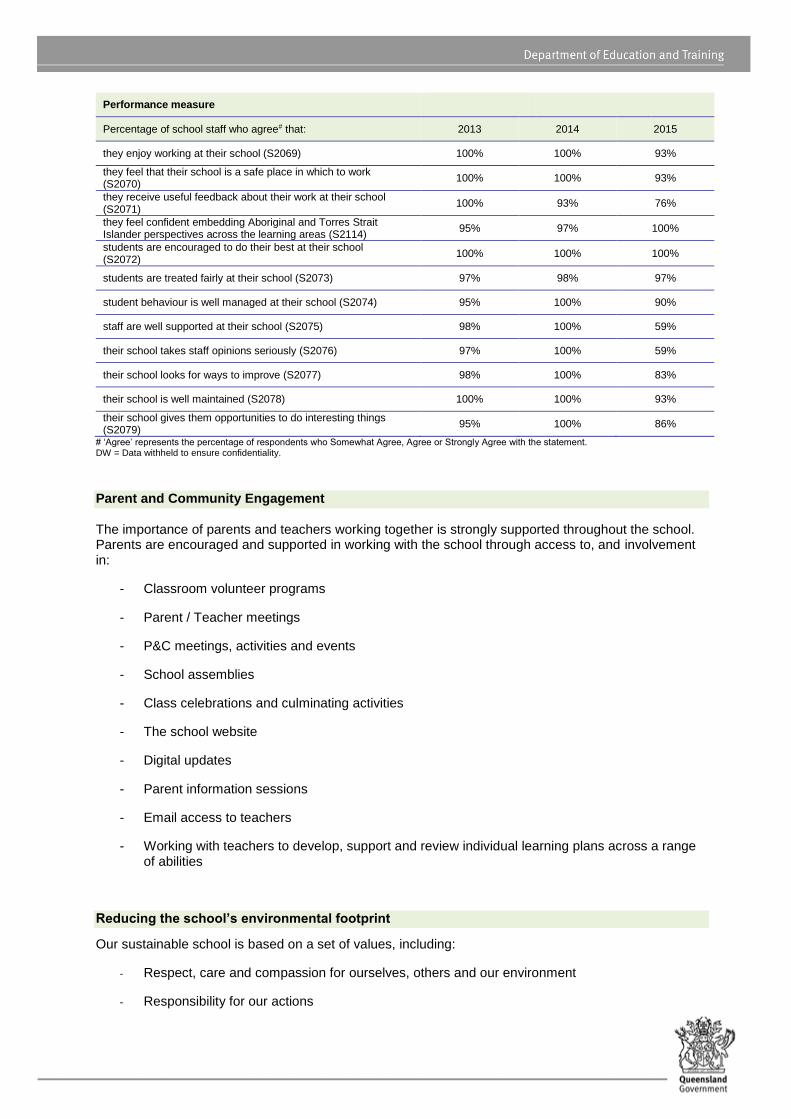
Performance measure
Percentage of school staff who agree# that: 2013 2014 2015
they enjoy working at their school (S2069) 100% 100% 93%
they feel that their school is a safe place in which to work (S2070)
100% 100% 93%
they receive useful feedback about their work at their school (S2071)
100% 93% 76%
they feel confident embedding Aboriginal and Torres Strait Islander perspectives across the learning areas (S2114)
95% 97% 100%
students are encouraged to do their best at their school (S2072)
100% 100% 100%
students are treated fairly at their school (S2073) 97% 98% 97%
student behaviour is well managed at their school (S2074) 95% 100% 90%
staff are well supported at their school (S2075) 98% 100% 59%
their school takes staff opinions seriously (S2076) 97% 100% 59%
their school looks for ways to improve (S2077) 98% 100% 83%
their school is well maintained (S2078) 100% 100% 93%
their school gives them opportunities to do interesting things (S2079)
95% 100% 86%
# ‘Agree’ represents the percentage of respondents who Somewhat Agree, Agree or Strongly Agree with the statement. DW = Data withheld to ensure confidentiality.
Parent and Community Engagement
The importance of parents and teachers working together is strongly supported throughout the school. Parents are encouraged and supported in working with the school through access to, and involvement in:
- Classroom volunteer programs
- Parent / Teacher meetings
- P&C meetings, activities and events
- School assemblies
- Class celebrations and culminating activities
- The school website
- Digital updates
- Parent information sessions
- Email access to teachers
- Working with teachers to develop, support and review individual learning plans across a range of abilities
Reducing the school’s environmental footprint
Our sustainable school is based on a set of values, including:
- Respect, care and compassion for ourselves, others and our environment
- Responsibility for our actions
Whilst a rise in electricity use is observable over time, this can be attributed to a significant population growth over the period in question.
Once the school population plateaus, we will observe some possible areas to address to target sustainable practices within our school.
The decrease in water usage is pleasing considering the enrolment growth. The school will continue to use the tanks within the school and will investigate further methods for minimizing the water use.
Environmental footprint indicators
Years Electricity
kWh Water kL
2012-2013 216,848 1,252
2013-2014 221,955 1,525
2014-2015 237,732 1,083
*The consumption data is compiled from sources including ERM, Ergon reports and utilities data entered into OneSchool by each school. The data provides an indication of the consumption trend in each of the utility categories which impact on the school’s environmental footprint.
Our staff profile
Staff composition, including Indigenous staff
2015 Workforce Composition Teaching Staff* Non-teaching
Staff Indigenous Staff
Headcounts 52 35 0
Full-time equivalents 46 20 0
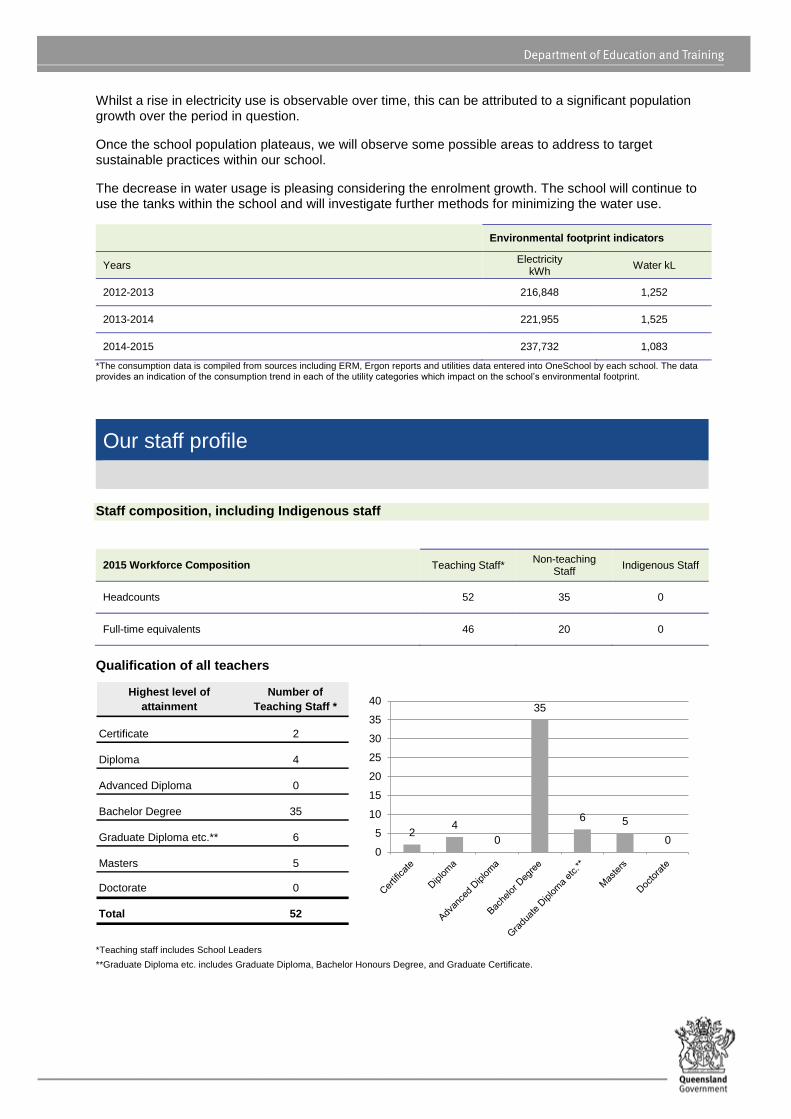
Qualification of all teachers
Highest level of
attainment
Number of
Teaching Staff *
Certificate 2
Diploma 4
Advanced Diploma 0
Bachelor Degree 35
Graduate Diploma etc.** 6
Masters 5
Doctorate 0
Total 52
24
0
35
6 5
00
5
10
15
20
25
30
35
40
*Teaching staff includes School Leaders
**Graduate Diploma etc. includes Graduate Diploma, Bachelor Honours Degree, and Graduate Certificate.

Expenditure on and teacher participation in professional development
The total funds expended on teacher professional development in 2015 were $28664.87
The major professional development initiatives were as follows:
- Mandatory staff training modules
- Positive Behaviour for Learning
- EduTech
- Anita Archer – Reading
- Pedagogical Coaches training
- First Aid
- Peer Review
- QELi
- Principals State Conference
- Workplace Wellbeing
- Maths professional learning
The proportion of the teaching staff involved in professional development activities during 2015 was 100%.
Average staff attendance 2013 2014 2015
Staff attendance for permanent and temporary staff and school leaders. 97% 97% 96%
Proportion of staff retained from the previous school year
From the end of the previous school year, 98% of staff was retained by the school for the entire 2015 school year.
School income broken down by funding source
School income broken down by funding source is available via the My School website at http://www.myschool.edu.au/.
To access our income details, click on the My School link above. You will then be taken to the My School website with the following ‘Find a school’ text box.

Where it says ‘School name’, type in the name of the school you wish to view, select the school from the drop-down list and select <GO>. Read and follow the instructions on the next screen; you will be asked to confirm that you are not a robot then by clicking continue, you acknowledge that you have read, accepted and agree to the Terms of Use and Privacy Policy before being given access to the school’s profile webpage.
School financial information is available by selecting ‘School finances’ in the menu box in the top left corner of the school’s profile webpage. If you are unable to access the internet, please contact the school for a paper copy of income by funding source.
Performance of our students
Key student outcomes
Our school focuses on student attendance and regularly discusses the importance of being at school with students and the community. Regular attendance monitoring procedures are in place to manage attendance and recognise support measures where necessary. The attendance graphs show a positive trend with those students attending less than 85% decreasing to its lowest level of 7% in 2015. The overall attendance rate remains steady at 94%.
Student attendance 2013 2014 2015
The overall attendance rate for the students at this school (shown as a percentage). 93% 94% 94%
The attendance rate for Indigenous students at this school (shown as a percentage). 92% 94% 90%
The student attendance rate is generated by dividing the total of full-days and part-days that students attended, and comparing this to the total of all possible days for students to attend, expressed as a percentage.
The overall attendance rate in 2015 for all Queensland Primary schools was 93%.
Student attendance rate for each year level (shown as a percentage)
Prep Year
1 Year
2 Year
3 Year
4 Year
5 Year
6 Year
7 Year
8 Year
9 Year 10
Year 11
Year 12
2013 92% 93% 94% 93% 93% 93% 92% 92%
2014 95% 94% 94% 94% 95% 93% 93% 93%
2015 94% 94% 94% 94% 94% 95% 94%
*From 2013, the methodology used for calculating attendance rates effectively counts attendance for every student for every day of attendance in Semester 1. The student attendance rate is generated by dividing the total of full-days and part-days that students attended, and comparing this to the total of all possible days for students to attend, expressed as a percentage.
DW = Data withheld to ensure confidentiality.
Student attendance distribution
The proportions of students by attendance range.

7
8
11
13
9
14
27
29
28
53
54
48
0% 20% 40% 60% 80% 100%
2015
2014
2013
Proportion of Students
Attendance Rate: 0% to <85% 85% to <90% 90% to <95% 95% to 100%
Description of how non-attendance is managed by the school
Non-attendance is managed in state schools in line with the DET procedures, Managing Student Absences and Enforcing Enrolment and Attendance at State Schools and Roll Marking in State Schools, which outline processes for managing and recording student attendance and absenteeism.
Teachers and staff at the school monitor student attendance closely making positive approaches to families to ensure children are in attendance at school when they can be.
Referrals to the school Guidance Officer and Chaplain are made where it is deemed necessary to support family circumstances.
National Assessment Program – Literacy and Numeracy (NAPLAN) results – our reading,
writing, spelling, grammar and punctuation, and numeracy results for the Years 3, 5, 7, and 9.
Our reading, writing, spelling, grammar and punctuation, and numeracy results for the Years 3, 5, 7 and 9 are available via the My
School website at http://www.myschool.edu.au/.
To access our NAPLAN results, click on the My School link above. You will then be taken to the My School website with the
following ‘Find a school’ text box.
Where it says ‘School name’, type in the name of the school you wish to view, select the school from the drop-down list and select <GO>. Read and follow the instructions on the next screen; you will be asked to confirm that you are not a robot then by clicking continue, you acknowledge that you have read, accepted and agree to the Terms of Use and Privacy Policy before being given access to the school’s profile webpage.

School NAPLAN information is available by selecting ‘NAPLAN’ in the menu box in the top left corner of the school’s profile webpage. If you are unable to access the internet, please contact the school for a paper copy of our school’s NAPLAN results.