foreign direct investment in the romanian economy. russu.pdf · foreign direct investment in the...
TRANSCRIPT
Economic Insights – Trends and Challenges Vol.V(LXVIII) No. 3/2016
19 - 30
Foreign Direct Investment in the Romanian Economy
Corneliu Russu
Centre for Industry and Services’ Economy, Romanian Academy, 125 Calea Victoriei, Sector 1, 010071,
Bucharest, Romania
e-mail: corneliu_russu2007@ yahoo.com
Abstract
Article deals with the main aspects of the evolution, structure and trend of FDI inflows recorded, in the
period 1990-2014, at the level of the national economy, the manufacturing industry and its component
activities, and development regions. Changes occured in the mentioned period, many welcomed, but were
insufficient compared to considerable needs of modernization of the Romanian economy, the productive
capacities in manufacturing industry, and reducing large disparities between the levels of economic and
social development of the regions. The analysis highlights the welcomed fact that after the Romania’s
integration into the European Union, industrial activities with high and medium-high level of
technological intensity began to attract larger amounts of FDI inflows and, because of this, their
contribution to the competitiveness growth of the Romanian economy increased significantly
Keywords: foreign direct investment (FDI); FDI influx; FDI stock; host country; country of origin
JEL Classification: F21
Introduction
In the transition process to a functioning market economy that Romania has crossed after 1990
and then in that of the restructuring and economic development achieved as a member country
of the European Union, FDI played an essential role, contributing, to a decisive extent, to
structural modernization in good part of the old and obsolete productive apparatus, and
affirmation of new trends of specialization in sectors and activities with greater efficiency. An
important proof of this is the reality that over 70% of the turnover of large industrial enterprises
is carried out currently by the subsidiaries in Romania of foreign MNCs, and foreign investment
companies covered, in 2014, 70,9% of Romanian exports and 64,7% of imports.
Highlighting these appreciable achievements generate legitimate queries on the intensity and
effects of governmental and firms actions to attract a FDI increasing amount through significant
improvement of location advantages, implicitly to increase the attractiveness for foreign
investment of economic activities (according to NACE). Such queries are all the more necessary
as statistics show a concerning trend in recent years for reducing FDI flows to the Romanian
economy and industry, further analyzed.
20 Corneliu Russu
Developments, Structures and Trends of FDI Inflows in the Economy
Romania's commitment to the transition to a functioning market economy has opened up
possibilities of penetration of foreign capital, the overwhelming share of its being FDI type.
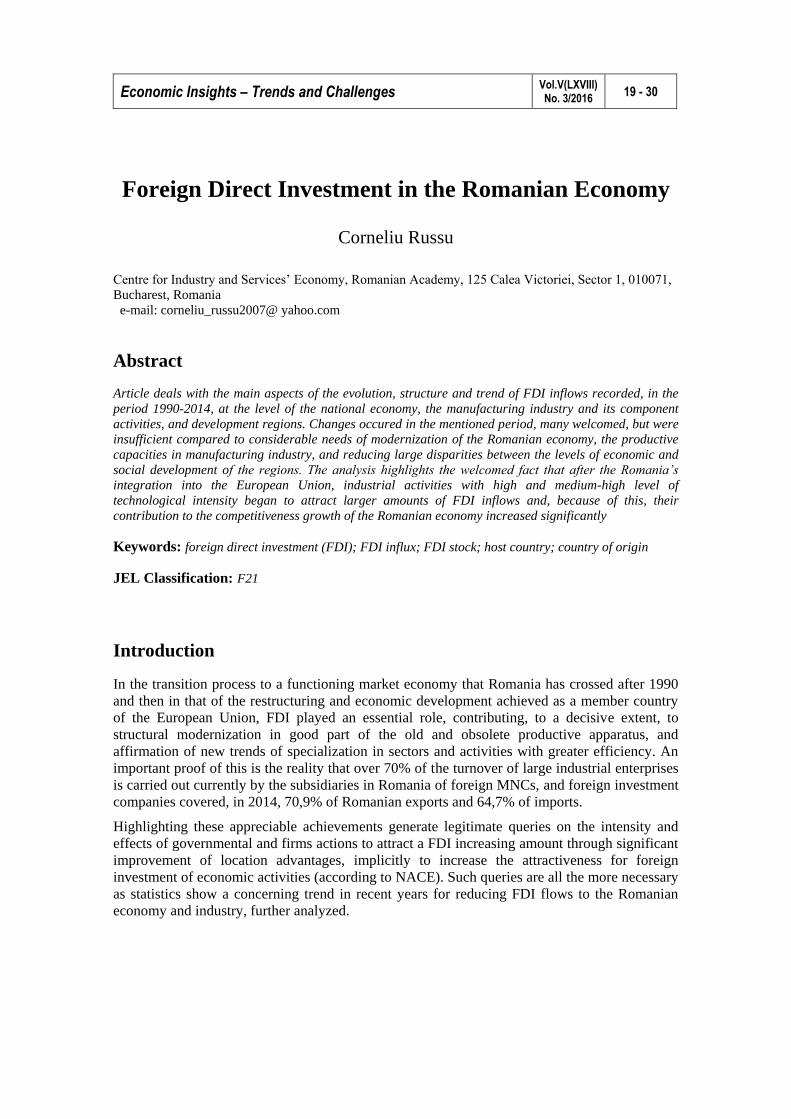
Starting from insignificant levels in the early years of transition, the influx of FDI rose then,
with setbacks in 1999, 2005 and 2007, to a historic peak reached in 2008, then declined sharply
until 2011, then recovered slightly, but at a great distance from the 2008 level, as shown in the
following figure.
0
2000
4000
6000
8000
10000
12000
14000
16000
Fig. 1. FDI inflows in the Romanian economy, 1990....2014
Source: UNCTAD. World Investment Report 2015, Annex Tables, 01. FDI inflows, by region and
economy, 1990-2014
In the sinuous evolution of FDI inflows recorded during the last two and a half decades one can
identify several distinct sub-periods:
o 1993-1996, when over half of inflows was linked to the privatization of state owned
companies which, however, were small, and therefore attracted a large number of foreign
investors but with reduced individual potential;
o 1997-2000, when the privatization offer soared, but severe recoil of the economy and the
legislative instability generated justified reluctance of foreign investors, who were more
attracted by other neighboring former socialist countries with better location advantages;
o 2001-2003, when the economy started to recover, the legislative framework has been
gradually improved, but FDI inflows continued to stagnate at modest levels;
o 2003-2008, when economic growth was stressed, and FDI inflow was recorded in a strong
upward trend with fluctuations mentioned above;
o 2009-2014, when the effects of the global crisis were felt so strongly both by the Romanian
economy and potential foreign investors, FDI inflow reducing to about one third of the level
reached in 2008 and maintaining within modest limits.
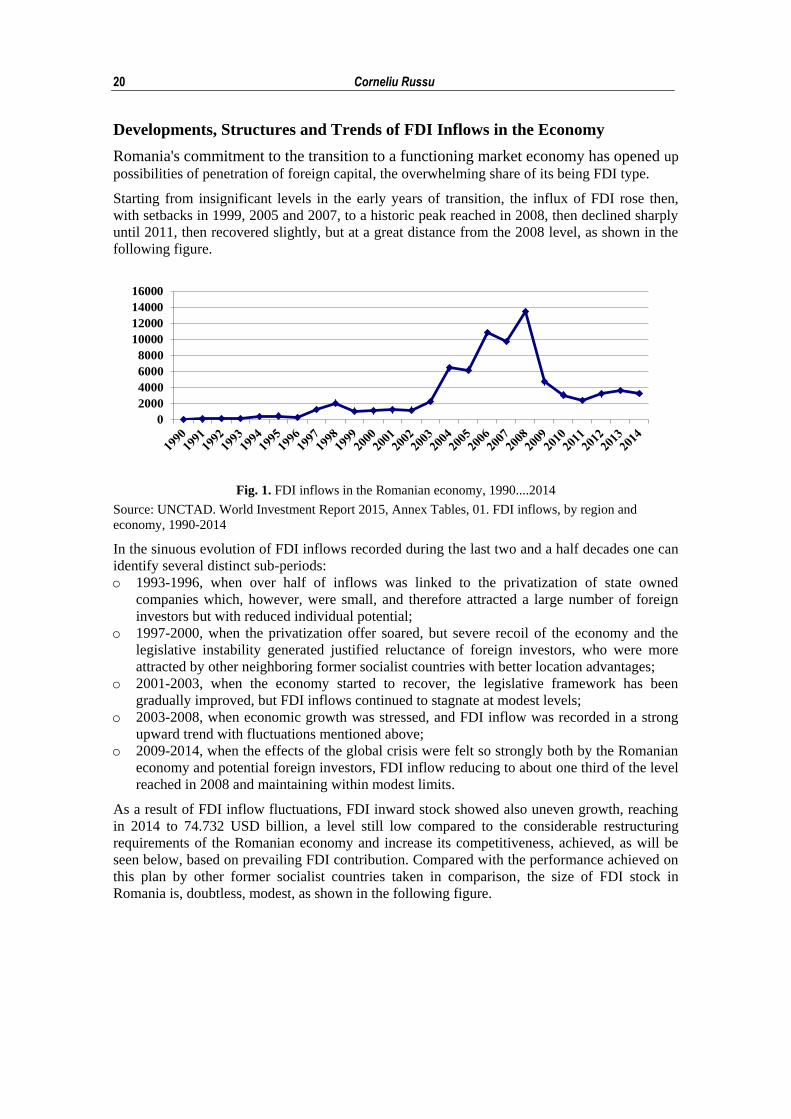
As a result of FDI inflow fluctuations, FDI inward stock showed also uneven growth, reaching
in 2014 to 74.732 USD billion, a level still low compared to the considerable restructuring
requirements of the Romanian economy and increase its competitiveness, achieved, as will be
seen below, based on prevailing FDI contribution. Compared with the performance achieved on
this plan by other former socialist countries taken in comparison, the size of FDI stock in
Romania is, doubtless, modest, as shown in the following figure.
Foreign Direct Investment in the Romanian Economy 21
46.539
121.53
245.161
74.73253.216
98.36
0
50
100
150
200
250
300
Bulgaria Czech Republic Poland Romania Slovakia Hungary
Fig. 2. The value of accumulated FDI inflow stock in some former socialist EU member countries, 2014
(USD billion)
Source: UNCTAD. World Investment Report 2015, Annex tables, 03. FDI inward stock, by region and
economy, 1990-2014
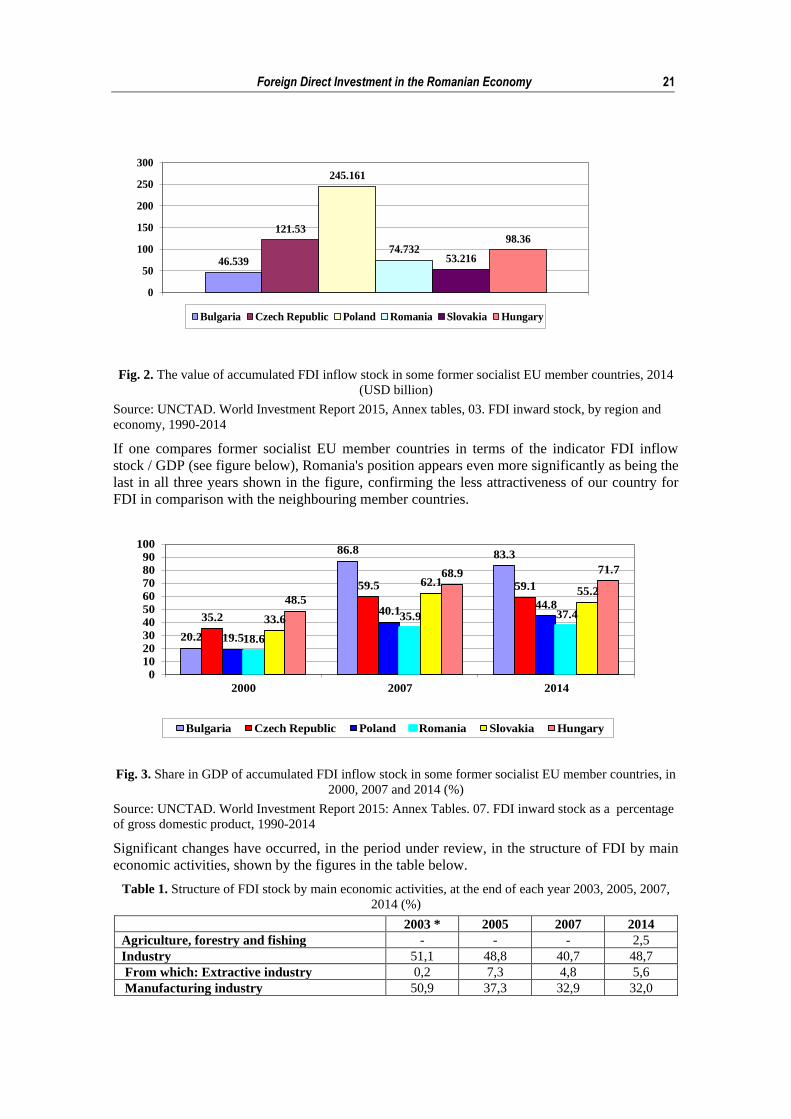
If one compares former socialist EU member countries in terms of the indicator FDI inflow
stock / GDP (see figure below), Romania's position appears even more significantly as being the
last in all three years shown in the figure, confirming the less attractiveness of our country for
FDI in comparison with the neighbouring member countries.
20.2
86.8 83.3
35.2
59.5 59.1
19.5
40.144.8
18.6
35.9 37.433.6
62.155.2
48.5
68.9 71.7
0
10
20
30
40
50
60
7080
90
100
2000 2007 2014
Bulgaria Czech Republic Poland Romania Slovakia Hungary
Fig. 3. Share in GDP of accumulated FDI inflow stock in some former socialist EU member countries, in
2000, 2007 and 2014 (%)
Source: UNCTAD. World Investment Report 2015: Annex Tables. 07. FDI inward stock as a percentage
of gross domestic product, 1990-2014
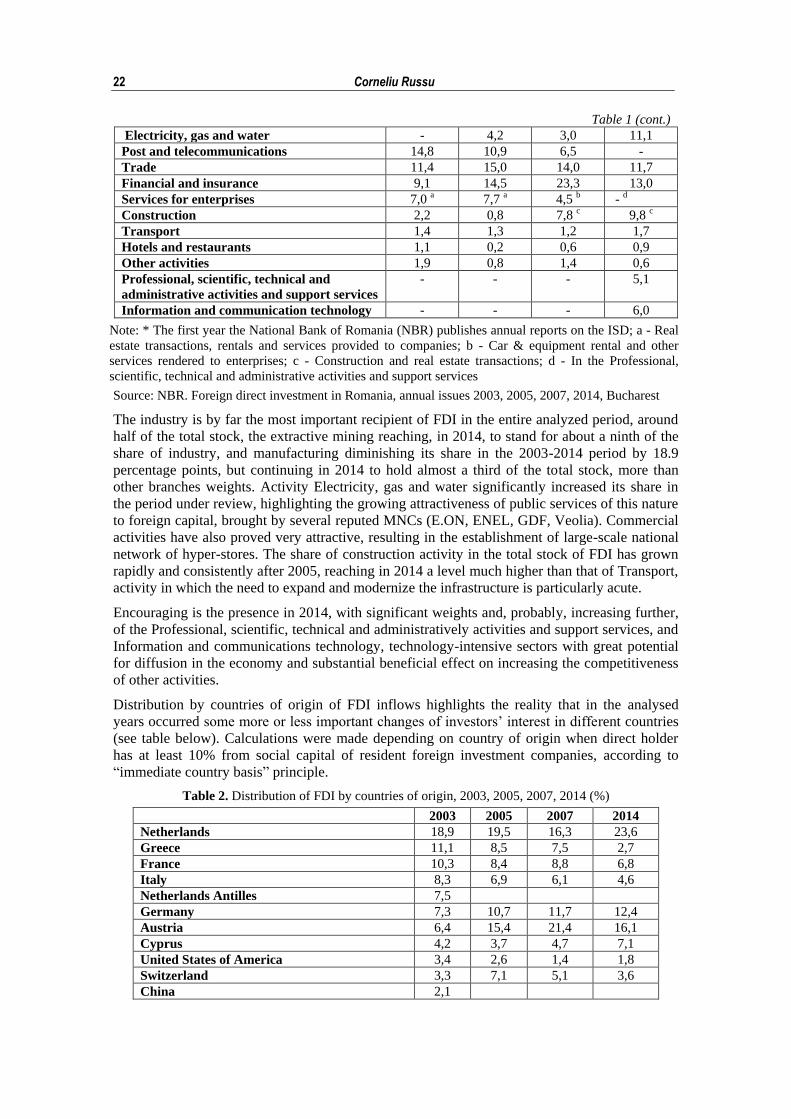
Significant changes have occurred, in the period under review, in the structure of FDI by main
economic activities, shown by the figures in the table below.
Table 1. Structure of FDI stock by main economic activities, at the end of each year 2003, 2005, 2007,
2014 (%)
2003 * 2005 2007 2014
Agriculture, forestry and fishing - - - 2,5
Industry 51,1 48,8 40,7 48,7
From which: Extractive industry 0,2 7,3 4,8 5,6
Manufacturing industry 50,9 37,3 32,9 32,0
22 Corneliu Russu
Table 1 (cont.)
Electricity, gas and water - 4,2 3,0 11,1
Post and telecommunications 14,8 10,9 6,5 -
Trade 11,4 15,0 14,0 11,7
Financial and insurance 9,1 14,5 23,3 13,0
Services for enterprises 7,0 a 7,7 a 4,5 b - d
Construction 2,2 0,8 7,8 c 9,8 c
Transport 1,4 1,3 1,2 1,7
Hotels and restaurants 1,1 0,2 0,6 0,9
Other activities 1,9 0,8 1,4 0,6
Professional, scientific, technical and
administrative activities and support services
- - - 5,1
Information and communication technology - - - 6,0
Note: * The first year the National Bank of Romania (NBR) publishes annual reports on the ISD; a - Real
estate transactions, rentals and services provided to companies; b - Car & equipment rental and other
services rendered to enterprises; c - Construction and real estate transactions; d - In the Professional,
scientific, technical and administrative activities and support services
Source: NBR. Foreign direct investment in Romania, annual issues 2003, 2005, 2007, 2014, Bucharest
The industry is by far the most important recipient of FDI in the entire analyzed period, around
half of the total stock, the extractive mining reaching, in 2014, to stand for about a ninth of the
share of industry, and manufacturing diminishing its share in the 2003-2014 period by 18.9
percentage points, but continuing in 2014 to hold almost a third of the total stock, more than
other branches weights. Activity Electricity, gas and water significantly increased its share in
the period under review, highlighting the growing attractiveness of public services of this nature
to foreign capital, brought by several reputed MNCs (E.ON, ENEL, GDF, Veolia). Commercial
activities have also proved very attractive, resulting in the establishment of large-scale national
network of hyper-stores. The share of construction activity in the total stock of FDI has grown
rapidly and consistently after 2005, reaching in 2014 a level much higher than that of Transport,
activity in which the need to expand and modernize the infrastructure is particularly acute.
Encouraging is the presence in 2014, with significant weights and, probably, increasing further,
of the Professional, scientific, technical and administratively activities and support services, and
Information and communications technology, technology-intensive sectors with great potential
for diffusion in the economy and substantial beneficial effect on increasing the competitiveness
of other activities.
Distribution by countries of origin of FDI inflows highlights the reality that in the analysed
years occurred some more or less important changes of investors’ interest in different countries
(see table below). Calculations were made depending on country of origin when direct holder
has at least 10% from social capital of resident foreign investment companies, according to
“immediate country basis” principle.
Table 2. Distribution of FDI by countries of origin, 2003, 2005, 2007, 2014 (%)
2003 2005 2007 2014
Netherlands 18,9 19,5 16,3 23,6
Greece 11,1 8,5 7,5 2,7
France 10,3 8,4 8,8 6,8
Italy 8,3 6,9 6,1 4,6
Netherlands Antilles 7,5
Germany 7,3 10,7 11,7 12,4
Austria 6,4 15,4 21,4 16,1
Cyprus 4,2 3,7 4,7 7,1
United States of America 3,4 2,6 1,4 1,8
Switzerland 3,3 7,1 5,1 3,6
China 2,1
Foreign Direct Investment in the Romanian Economy 23
Table 2 (cont.)
Hungary 1,9 1,7 1,4
Turkey 1,9 1,9 0,8
Sweden 1,4 0,9 1,0
Belgium 1,3 1,1 2,1
Czech Republic 1,3 0,8 1,4
Virgin Islands (British) 1,1 0,9
Luxembourg 1,0 1,5 3,6
European Bank for Reconstruction and
Development - EBRD
0,7 0,2 0,3
Spain 0,6 1,1 2,4
International Financial Company - IFC 0,6
South Africa 0,5
United Kingdom 0,9 2,5
Canada 0,6 0,2
Israel 0,4
Lebanon 0,4 0,3
Poland 0,3 0,5
Gibraltar 0,3
Denmark 0,8
Ireland 0,6
Norway 0,4
Japan 0,4
Portugal 0,3
Bulgaria 0,2
Other countries * 17,2 4,9 * 4,0 * 2,0 *
Note: * Countries whose investment is under 100 million euro
Source: NBR. Foreign direct investment in Romania, annual issues 2003, 2005, 2007, 2014, Bucharest
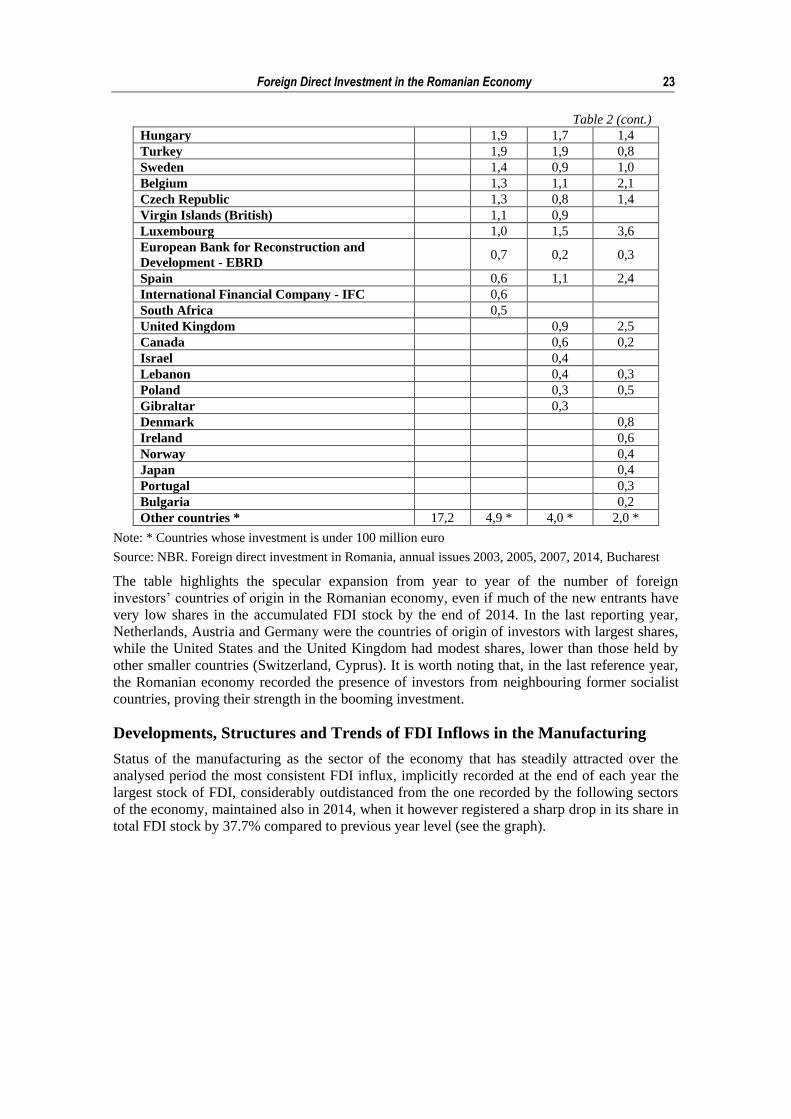
The table highlights the specular expansion from year to year of the number of foreign
investors’ countries of origin in the Romanian economy, even if much of the new entrants have
very low shares in the accumulated FDI stock by the end of 2014. In the last reporting year,
Netherlands, Austria and Germany were the countries of origin of investors with largest shares,
while the United States and the United Kingdom had modest shares, lower than those held by
other smaller countries (Switzerland, Cyprus). It is worth noting that, in the last reference year,
the Romanian economy recorded the presence of investors from neighbouring former socialist
countries, proving their strength in the booming investment.
Developments, Structures and Trends of FDI Inflows in the Manufacturing
Status of the manufacturing as the sector of the economy that has steadily attracted over the
analysed period the most consistent FDI influx, implicitly recorded at the end of each year the
largest stock of FDI, considerably outdistanced from the one recorded by the following sectors
of the economy, maintained also in 2014, when it however registered a sharp drop in its share in
total FDI stock by 37.7% compared to previous year level (see the graph).
24 Corneliu Russu
49176768
8170
11782
1407115236 15555
16840 1737218508 18648 19275
0
5000
10000
15000
20000
25000
2003 2004 2005 2006 2007 2008 2009 2010 2011 2012 2013 2014
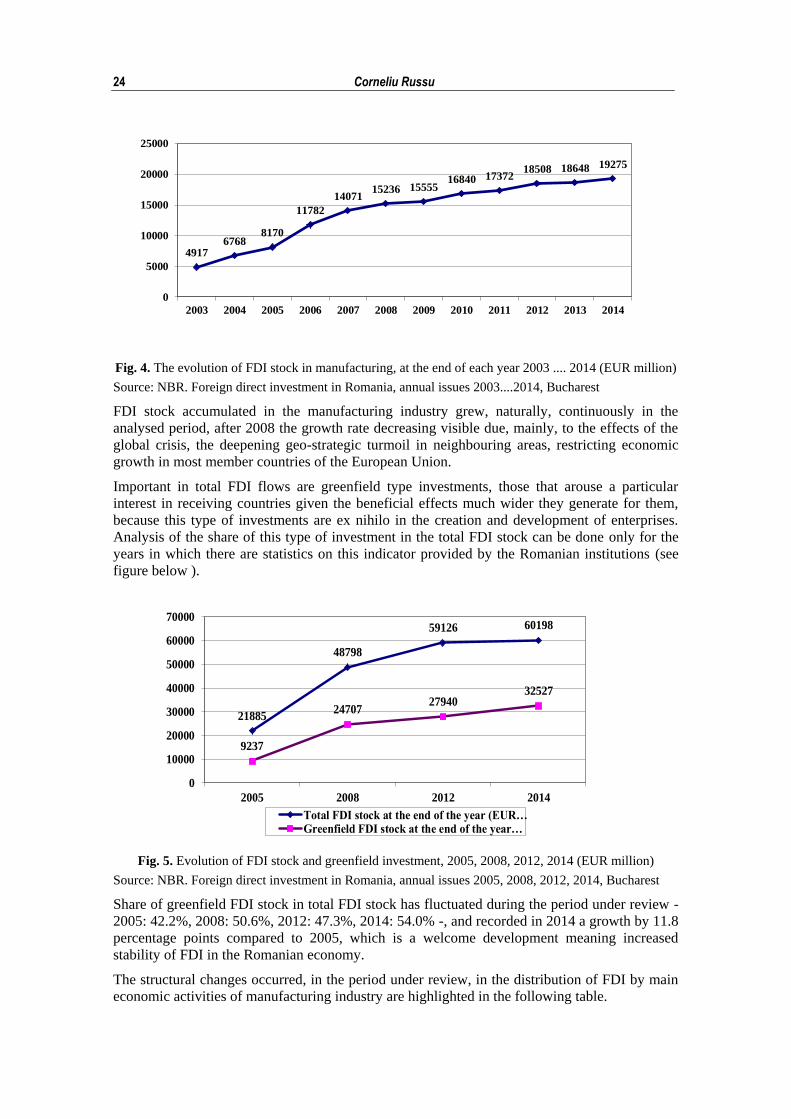
Fig. 4. The evolution of FDI stock in manufacturing, at the end of each year 2003 .... 2014 (EUR million)
Source: NBR. Foreign direct investment in Romania, annual issues 2003....2014, Bucharest
FDI stock accumulated in the manufacturing industry grew, naturally, continuously in the
analysed period, after 2008 the growth rate decreasing visible due, mainly, to the effects of the
global crisis, the deepening geo-strategic turmoil in neighbouring areas, restricting economic
growth in most member countries of the European Union.
Important in total FDI flows are greenfield type investments, those that arouse a particular
interest in receiving countries given the beneficial effects much wider they generate for them,
because this type of investments are ex nihilo in the creation and development of enterprises.
Analysis of the share of this type of investment in the total FDI stock can be done only for the
years in which there are statistics on this indicator provided by the Romanian institutions (see
figure below ).
21885
48798
59126 60198
9237
2470727940
32527
0
10000
20000
30000
40000
50000
60000
70000
2005 2008 2012 2014
Total FDI stock at the end of the year (EUR…Greenfield FDI stock at the end of the year…
Fig. 5. Evolution of FDI stock and greenfield investment, 2005, 2008, 2012, 2014 (EUR million)
Source: NBR. Foreign direct investment in Romania, annual issues 2005, 2008, 2012, 2014, Bucharest
Share of greenfield FDI stock in total FDI stock has fluctuated during the period under review -
2005: 42.2%, 2008: 50.6%, 2012: 47.3%, 2014: 54.0% -, and recorded in 2014 a growth by 11.8
percentage points compared to 2005, which is a welcome development meaning increased
stability of FDI in the Romanian economy.
The structural changes occurred, in the period under review, in the distribution of FDI by main
economic activities of manufacturing industry are highlighted in the following table.
Foreign Direct Investment in the Romanian Economy 25
Table 3. Weights of manufacturing activities in the FDI stock at the end of the year, 2003, 2005, 2007,
2014 (%)
2003 2005 2007 2014
Total economy 100 100 100 100
Manufacturing industry 50,9 37,3 32,9 32,0
Food, beverages and tobacco 9,7 6,5 5,2 4,0
Metallurgy 11,6 8,2 7,5 4,5
Means of transport 5,5 5,1 3,6 5,4
Cement, glass, ceramics 4,6 3,2 3,5 2,6
Machinery and equipment 4,5 1,6 1,3 2,4
Textiles, garments and leather goods 4,4 2,6 1,7 1,6
Crude oil processing, chemical products,
rubber and plastics 4,1 4,1 4,4 5,7
Wood and wooden products manufacturing,
including furniture 2,8 2,8 2,4 2,5
Computers, electric appliances, radio – TV,
communications 2,3 1,8 1,9 2,4
Other manufacturing activities 1,4 1,4 1,4 0,9
Source: NBR. Foreign direct investment in Romania, annual issues 2003, 2005, 2007, 2014, Bucharest
The magnitude of structural changes produced in the analysed period was not great. It is worth
to note: # continuing decline in the share of traditional activities - Food, beverages and tobacco,
Cement, glass, ceramics, Textiles, leather goods -, while Wood and wooden products
manufacturing, including furniture, which fall under the same category, kept its weight to a
constant level; # maintaining relatively constant the share of Means of transport, although
activity has seen massive FDI inflows; # reducing the share of Machinery and equipment
activity, unwanted under the stringent needs for modernization of productive capacities in many
companies; # maintaining constant, with some fluctuations, the share of Computers, electric
appliances, radio - TV, communications, yet low.
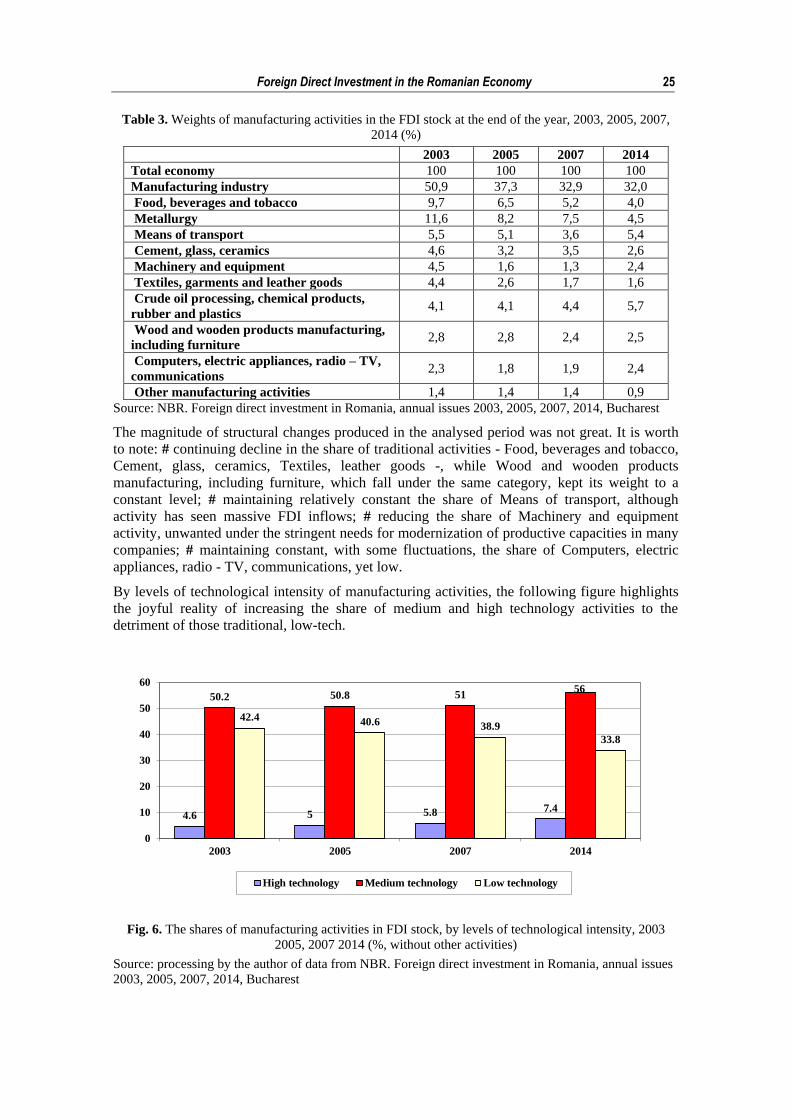
By levels of technological intensity of manufacturing activities, the following figure highlights
the joyful reality of increasing the share of medium and high technology activities to the
detriment of those traditional, low-tech.
4.6 5 5.8 7.4
50.2 50.8 5156
42.4 40.6 38.9
33.8
0
10
20
30
40
50
60
2003 2005 2007 2014
High technology Medium technology Low technology
Fig. 6. The shares of manufacturing activities in FDI stock, by levels of technological intensity, 2003
2005, 2007 2014 (%, without other activities)
Source: processing by the author of data from NBR. Foreign direct investment in Romania, annual issues
2003, 2005, 2007, 2014, Bucharest
26 Corneliu Russu
The materialization of FDI in tangible and intangible assets (machinery, equipment and other
means of production) is important because this gives those investments long-term stability in the
host country, their knowledge enabling more precise identification of direction and prospects of
sustainability of investments made. The weights of tangible and intangible assets by
manufacturing activities are presented, for the period analysed, in the following table.
Table 4. The weights of FDI tangible and intangible assets value in manufacturing activities, 2003, 2005,
2007 2014 (%)
2003 2005 2007 2014
Manufacturing industry (EUR million) 2916 5688 8744 11683
Food, beverages and tobacco 5,7 4,4 3,2 2,5
Metallurgy 7,7 6,3 4,5 3,0
Means of transport 2,4 3,7 2,8 3,6
Cement, glass, ceramics 3,5 2,1 1,9 1,6
Machinery and equipment 1,4 0,9 0,6 1,2
Textiles, garments and leather goods 2,7 1,7 1,1 0,8
Crude oil processing, chemical products,
rubber and plastics 3,4 3,2 2,5 3,3
Wood and wooden products manufacturing,
including furniture 1,4 1,7 1,7 1,7
Computers, electric appliances, radio – TV,
communications 1,2 1,1 1,1 1,1
Other manufacturing activities 0,8 0,9 1,0 0,6
Source: NBR. Foreign direct investment in Romania, annual issues 2003, 2005, 2007, 2014, Bucharest
Trends marking the developments on activities of the manufacturing industry recorded by the
value of tangible and intangible assets are the same, in general, with the findings regarding
weights of FDI stock on the same activities (Table 3), which proves keeping internal structure
(assets, licences acquisition, location expenditures, etc.) of FDI made. So, it comes out: # sharp
decline in the share of FDI assets in traditional industries, except the Wood and wooden
products manufacturing, including furniture; # maintaining a constant share of that amount in
activities of interest for the Romanian economy – Crude oil processing, chemical ...., and
Computers, electrical ....; # very low level of weight for Machinery and equipment; # growth of
the Means of transport share. These are developments which demonstrate, once again, that the
interests of foreign investors converge only partly, with large fluctuations caused by
international conjunctures, with the stringent requirements of modernization of productive
capacities in manufacturing and increase its competitiveness.
Developments, Structures and Trends of FDI Inflows by Development Regions
Important is also the knowledge of the geographical distribution of FDI inflows in order to see
the extent to which the contribution of foreign capital helped increase the competitiveness of
doing business in the regions and, on this basis, the economic development of the regions.
Development regions used to determine statistical data provided by institutions of the European
Union and Romania is based on the classification of territorial units for statistics, NUTS units
respectively, ordered hierarchically depending on the size. The eight development regions of
Romania, corresponding to NUTS level 2 regions, have been delimited according to the
principles established for the whole community1.
The FDI stock by development regions of Romania has evolved, in the period under review,
according to figures in the following table.
1 EUROSTAT. Statistical books. EUROSTAT regional zearbook 2014, Luxembourg: Publications Office
of the European Union, 2014, p. 13
Foreign Direct Investment in the Romanian Economy 27
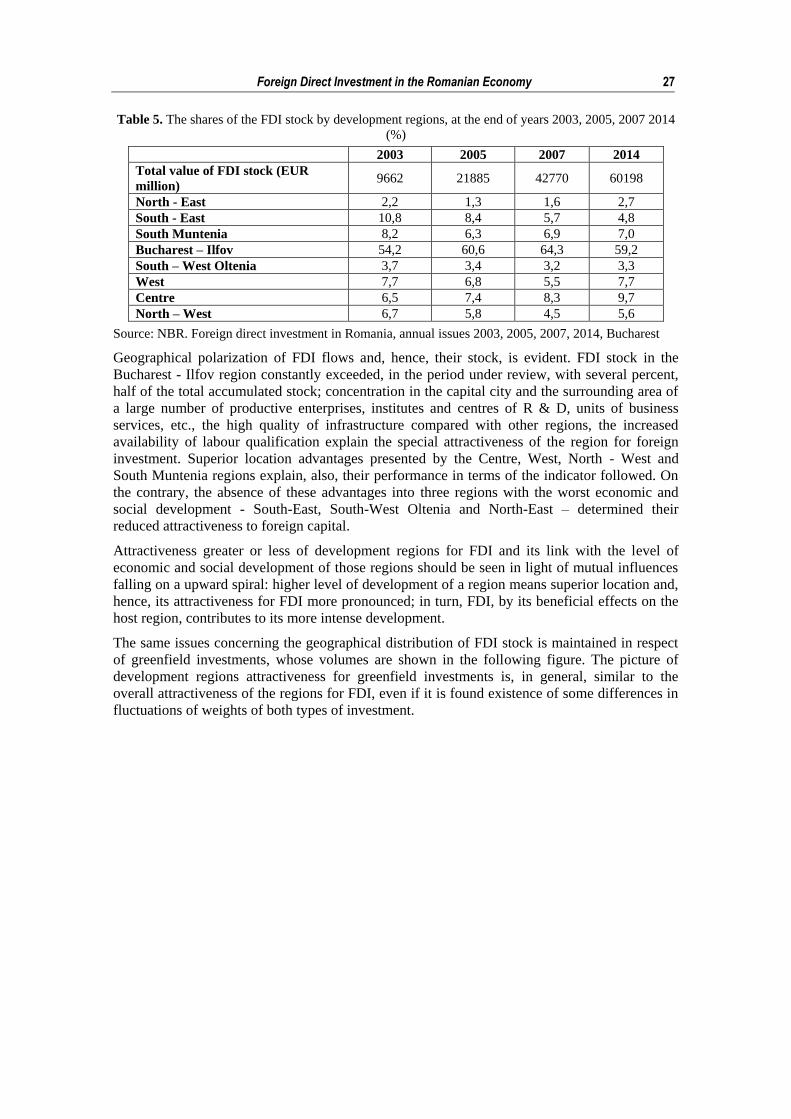
Table 5. The shares of the FDI stock by development regions, at the end of years 2003, 2005, 2007 2014
(%)
2003 2005 2007 2014
Total value of FDI stock (EUR
million) 9662 21885 42770 60198
North - East 2,2 1,3 1,6 2,7
South - East 10,8 8,4 5,7 4,8
South Muntenia 8,2 6,3 6,9 7,0
Bucharest – Ilfov 54,2 60,6 64,3 59,2
South – West Oltenia 3,7 3,4 3,2 3,3
West 7,7 6,8 5,5 7,7
Centre 6,5 7,4 8,3 9,7
North – West 6,7 5,8 4,5 5,6
Source: NBR. Foreign direct investment in Romania, annual issues 2003, 2005, 2007, 2014, Bucharest
Geographical polarization of FDI flows and, hence, their stock, is evident. FDI stock in the
Bucharest - Ilfov region constantly exceeded, in the period under review, with several percent,
half of the total accumulated stock; concentration in the capital city and the surrounding area of
a large number of productive enterprises, institutes and centres of R & D, units of business
services, etc., the high quality of infrastructure compared with other regions, the increased
availability of labour qualification explain the special attractiveness of the region for foreign
investment. Superior location advantages presented by the Centre, West, North - West and
South Muntenia regions explain, also, their performance in terms of the indicator followed. On
the contrary, the absence of these advantages into three regions with the worst economic and
social development - South-East, South-West Oltenia and North-East – determined their
reduced attractiveness to foreign capital.
Attractiveness greater or less of development regions for FDI and its link with the level of
economic and social development of those regions should be seen in light of mutual influences
falling on a upward spiral: higher level of development of a region means superior location and,
hence, its attractiveness for FDI more pronounced; in turn, FDI, by its beneficial effects on the
host region, contributes to its more intense development.
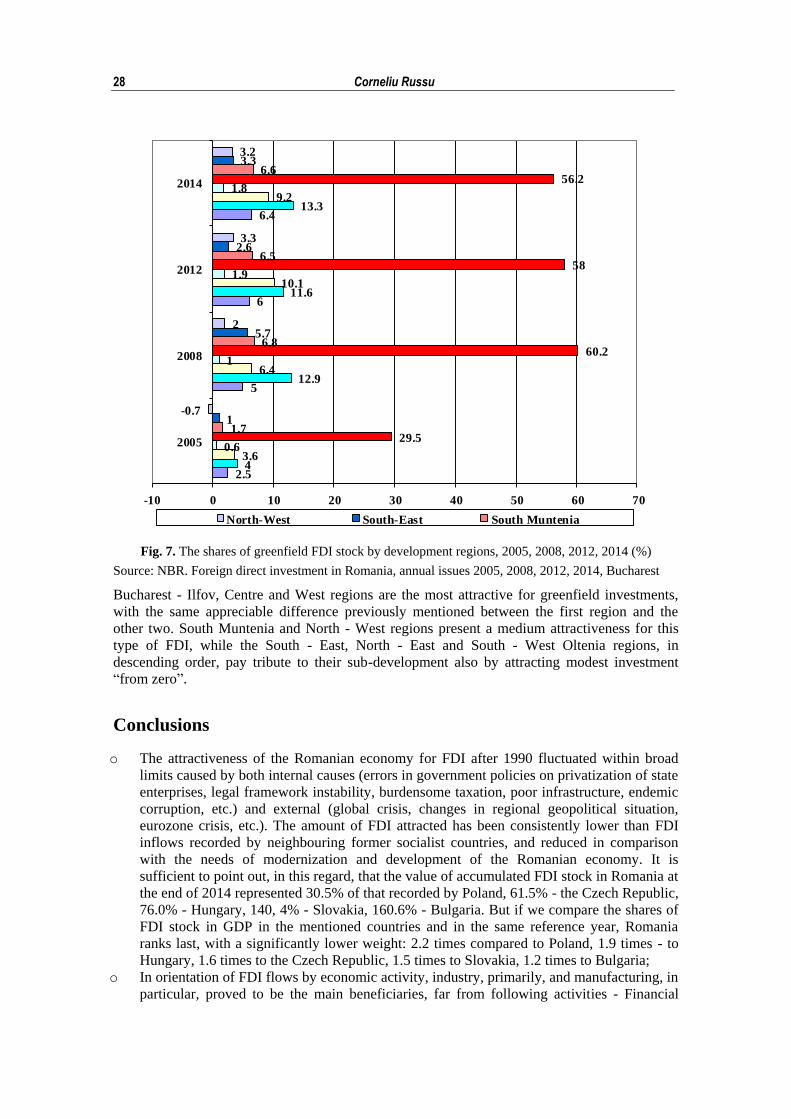
The same issues concerning the geographical distribution of FDI stock is maintained in respect
of greenfield investments, whose volumes are shown in the following figure. The picture of
development regions attractiveness for greenfield investments is, in general, similar to the
overall attractiveness of the regions for FDI, even if it is found existence of some differences in
fluctuations of weights of both types of investment.
28 Corneliu Russu
2.5
5
6
6.4
4
12.9
11.6
13.3
3.6
6.4
10.1
9.2
0.6
1
1.9
1.8
29.5
60.2
58
56.2
1.7
6.8
6.5
6.6
1
5.7
2.6
3.3
-0.7
2
3.3
3.2
-10 0 10 20 30 40 50 60 70
2005
2008
2012
2014
North-West South-East South Muntenia
Fig. 7. The shares of greenfield FDI stock by development regions, 2005, 2008, 2012, 2014 (%)
Source: NBR. Foreign direct investment in Romania, annual issues 2005, 2008, 2012, 2014, Bucharest
Bucharest - Ilfov, Centre and West regions are the most attractive for greenfield investments,
with the same appreciable difference previously mentioned between the first region and the
other two. South Muntenia and North - West regions present a medium attractiveness for this
type of FDI, while the South - East, North - East and South - West Oltenia regions, in
descending order, pay tribute to their sub-development also by attracting modest investment
“from zero”.
Conclusions
o The attractiveness of the Romanian economy for FDI after 1990 fluctuated within broad
limits caused by both internal causes (errors in government policies on privatization of state
enterprises, legal framework instability, burdensome taxation, poor infrastructure, endemic
corruption, etc.) and external (global crisis, changes in regional geopolitical situation,
eurozone crisis, etc.). The amount of FDI attracted has been consistently lower than FDI
inflows recorded by neighbouring former socialist countries, and reduced in comparison
with the needs of modernization and development of the Romanian economy. It is
sufficient to point out, in this regard, that the value of accumulated FDI stock in Romania at
the end of 2014 represented 30.5% of that recorded by Poland, 61.5% - the Czech Republic,
76.0% - Hungary, 140, 4% - Slovakia, 160.6% - Bulgaria. But if we compare the shares of
FDI stock in GDP in the mentioned countries and in the same reference year, Romania
ranks last, with a significantly lower weight: 2.2 times compared to Poland, 1.9 times - to
Hungary, 1.6 times to the Czech Republic, 1.5 times to Slovakia, 1.2 times to Bulgaria;
o In orientation of FDI flows by economic activity, industry, primarily, and manufacturing, in
particular, proved to be the main beneficiaries, far from following activities - Financial
Foreign Direct Investment in the Romanian Economy 29
intermediations and insurance, Trade, Construction etc. After Romania's integration into the
EU, high technological intensity activities, with high value added, began to be increasing
targeted by foreign investors (ICT, Professional, scientific, technical and administrative
activities and support services);
o Countries with the most significant contribution to the formation of FDI stock were the
Netherlands, Austria and Germany, other countries from which one might expect more
interest to do business in Romania registering lower and decreasing weights throughout the
analysed period - France, Italy, United States, United Kindom (the last came into gallery of
investment country of origin only since June 2006);
o The FDI stock in manufacturing industry has evolved since 2003 with about the same pace
as the total FDI stock in the economy, in that it has experienced a sustained growth until
2008, after which growth was slower in 2008-2014 period, when the global crisis produced
its effects and occurred new turmoil in the global economy (recoil of eurozone, downturn in
the Chinese economy, etc.). By NACE activities components of manufacturing industry
changes in the FDI stock structure were not of amplitude, by levels of technological
intensity of activities are being recorded welcomed growth of stock in high-tech (by
60.9%), in 2014 compared to 2003, and medium-tech activities (11.6% in the same year), at
the expense of low-tech activities, which means a substantial potential contribution of FDI
to competitiveness growth of total manufacturing;
o The value of tangible and intangible assets of foreign investment enterprises in the
manufacturing industry increased, over the period 2003-2014, of 4.0 times, which confer to
FDI sustainability in a longer perspective. Variations in the share of this value between
different manufacturing activities prove, in many respects, divergence between the interests
of foreign investors and urgent need for modernization and increased competitiveness of
some activities; illustrative in this respect is maintaining at a constant and low level the
share of assets in the Machinery and equipment activity, one with great impact on the
modernization of other industrial and non-industrial activities in the economy, but which is
not yet sufficiently targeted by foreign capital;
o The structure of FDI stock and greenfield investment by development regions presents an
aspect with far-reaching effects on the competitiveness of the whole economy and balance
which should, normally, exist in the development of different regions: share of more than
half of the total two indicators values of the region Bucharest - Ilfov, followed at great
distance by the Centre and West regions, the remaining five development regions showing
concerning differences between their counties (judets), less pronounced in the case of South
Muntenia and North - West regions but with profound negative implications for the South -
East, North - East and South - West Oltenia regions. Excessive polarization of FDI in
shown meanings deprives regions with the lowest levels of development of an effective
lever of economic emancipation, and diminishes drastically their chances to reduce the gaps
that separate them from the Capital region and the other two mentioned, significantly more
performant.
References
1. Bonciu, F., 2011. Foreign direct investment before and after world economic crisis, Universitary
Publishing House, Bucharest.
2. Bonciu F., Marian,.G. D., 2001. Policies and means to attract foreign direct investment, Albatros
Publishing House, Bucharest, 2001.
3. Botric,V., Skulic. L., 2005 Main Determinants of Foreign Direct Investment in the South East
European Countries. Trade, FDI and Relocation: Challenge for Employment and Growth in the
European Union, 2nd Euroframe Conference on Economic Policy Issues in the European Union,
Vienna.
4. Dăianu, D., 2001. Winners and losers in the process of European integration. A look at Romania,
Romanian Center for Economic Policies, Bucharest.
30 Corneliu Russu
5. International Monetary Fund, 1993. Balance of Payments Manual, 5th Edition, Washington DC.
6. International Monetary Fund, 1995. Balance of Payments Compilation Guide, 1st Edition,
Washington DC.
7. Johnson, A., 2006. The Effects of FDI Inflows on Host Country Economic Growth, CESIS Working
Paper Series, Royal Institute of Technology, Sweden.
8. Kalotay, K., 2008. FDI in Romania and Bulgaria in the Wake of the EU Accession, Journal of East
West Business, 14.
9. Lipsey, R. E., 2001. Foreign Direct Investment and the operations of multinational firms: concepts,
history, and data, Working paper 8665, National Bureau of Economic Research, Cambridge (USA).
10. Meyer, K.E.,. 1995. Foreign direct investment in the early years of economic transition: a survey, The
Economics of Transition. 3 (3), The European Bank for Reconstruction and Development, 1995, pp.
301-320.
11. Organisation for Economic Cooperation and Development, 1996. Benchmark Definition of Foreign
Direct Investment, 3rd Edition, Paris.
12. Sachwald, F., 2005. The Impact of EU Enlargement on the Location of Production in Europe, Les
Etudes de l’IFRI 4 (IFRI), Paris, p.56.
13. Smarzynska, B., 2002. Spillovers from Foreign Direct Investment through Backward Linkages: Does
Technology Gap Matter?, Mimeo, World Bank.
14. National Bank of Romania. Foreign direct investment in Romania, Annual issues, Bucharest.
15. UNCTAD, 2011. World Investment Report, 2011. New York and Geneva.
16. World Bank, 2005. Investment Climate Surveys, available at
http://rru.worldbank.org/InvestmentClimate/