foreign direct investment in cement industry ... - nrb.org.np
TRANSCRIPT

Foreign Direct Investment in Cement Industry in Nepal
A Study on Socio-economic Impact
Study Report
Nepal Rastra Bank
Economic Research Department
Economic Development Division
May 2021

i
Foreword
Cement industry is one of the important industries necessary for the infrastructure development
of a country. The construction sector, contributing around 7 percent to GDP, is a major growth
driver for Nepal. In the aftermath of April 2015 earthquake, the massive reconstruction activities
escalated the demand for cement. Consequently, several cement industries have been established
and some of those have been set up with foreign direct investment (FDI).
This study has been carried out upon the request of Investment Board of Nepal to investigate the
status of cement industries, particularly FDI based ones. The study focuses on their contribution
towards meeting the domestic cement demand, and their impact on the social wellbeing and
economic condition of the surrounding communities. It has been found that FDI-based cement
industries are dominant in the Nepalese market both in terms of the investment and the
production capacity. At present, significant excess capacity exists in the cement industries of
Nepal. However, given the infrastructural needs of the country, the demand for cement is
expected to rise significantly in the coming years. The study has also found that cement
industries have benefitted the local residents in several aspects such as growth in employment
and business opportunities, and increase in land prices. Cement industries have, however, also
found to adversely affect the local people through creating environmental pollution.
I believe that this study would be useful to all the concerned stakeholders. We have completed
this study with valuable suggestions, information and data from various institutions and
individuals. I would like to extend my sincere thanks to all concerned firms and stakeholders for
their contribution and inputs in completing this study. I would also like to thank Executive
Director Dr. Gunakar Bhatta, Director Mr. Dipak Lamechhane, Director Mr. Biggyan Raj
Subedi, Deputy Director Mrs. Binti Shrestha (Prasai), Assistant Mr. Rohan Byanjankar, and all
colleagues of Economic Development Division of Economic Research Department for their
valuable contribution to preparing this report.
May 2021
Prakash Kumar Shrestha, Ph.D.
Executive Director

ii
Table of Contents
Foreword .......................................................................................................................................... i
Table of Contents ............................................................................................................................ ii
List of Tables ................................................................................................................................. iv
List of Figures ................................................................................................................................. v
Abbreviation .................................................................................................................................. vi
Executive Summary ...................................................................................................................... vii
CHAPTER I: INTRODUCTION .................................................................................................... 1
1.1. Background of the study ..................................................................................................... 1
1.2. Objectives of the study........................................................................................................ 4
1.3. Significance of the study ..................................................................................................... 4
1.4. Limitations .......................................................................................................................... 5
CHAPTER II: REVIEW OF LITERATURE ................................................................................. 6
2.1. Review of International Literature ...................................................................................... 6
2.2. Review of National Literature ............................................................................................ 8
CHAPTER III: RESEARCH METHODOLOGY .......................................................................... 9
3.1 Research Design.................................................................................................................. 9
3.2 Nature and Sources of Data ................................................................................................ 9
3.3 Sampling and Data Collection ............................................................................................ 9
CHAPTER IV: DATA PRESENTATION AND ANALYSIS ..................................................... 11
4.1. Cement Consumption: International Comparison ............................................................ 11
4.2. Cement Industries in Nepal ............................................................................................... 13
4.3. Status of Cement Production in Nepal .............................................................................. 16
4.4. Market Structure of Nepalese Cement Industry ................................................................ 19
4.5. The efficiency of Cement Industries ................................................................................. 21

iii
4.5.1. Financial status........................................................................................................ 21
4.5.2. Technical status ....................................................................................................... 22
4.6. Socio-economic Impact on the Surrounding Communities .............................................. 23
4.6.1. Promotion of business opportunities ....................................................................... 23
4.6.2. Employment opportunities ...................................................................................... 24
4.6.3. Negative externalities and pollution ....................................................................... 25
4.6.4. Contribution to infrastructure development ............................................................ 26
4.6.5. Impact on land prices .............................................................................................. 27
4.7. Facilities to Employees ..................................................................................................... 28
4.7.1. Employment status .................................................................................................. 28
4.7.2. Working hours ........................................................................................................ 29
4.7.3. Salary earned by employees.................................................................................... 30
4.7.4. Benefits other than salary........................................................................................ 30
4.7.5. Quality of work-life ................................................................................................ 31
CHAPTER V: CONCLUSION AND RECOMMENDATIONS ................................................. 32
5.1 Conclusion ........................................................................................................................ 32
5.2 Recommendations ............................................................................................................. 34
References
Annex 1
Annex 2
Annex 3

iv
List of Tables
Table Number Details Page number
Table 1 FDI commitments in the Nepalese industry in 2018/19 2
Table 2 Selection of sample design 10
Table 3 Top 20 countries based on cement consumption in 2017 12
Table 4 Top 10 Asian countries in terms of Per-capita Cement
Consumption (PCC) in 2017
12
Table 5 Categorization of cement industry according to ownership and
product
14
Table 6 List of Cement industries with FDI in Nepal 14
Table 7 Source of financing for Hongshi-Shivam Cement 15
Table 8 Present Scenario of Cement Production 18
Table 9 Annual installed capacity of sampled cement industries 18
Table 10 Production capacity 18
Table 11 Forecast of Cement Demand for the next 5 Years 19
Table 12 Descriptive statistics regarding price of OPC cement of 26
cement industries
20
Table 13 Capacity Utilization of Cement industries from 2013/14 to
2018/19
22

v
List of Figures
Figure Number Details Page number
Figure 1 Import and production of cement and clinker 16
Figure 2 Average sales figures of cement industries 21
Figure 3 Promotion of business opportunities by the cement industry 23
Figure 4 Employment to local people 24
Figure 5 Negative externality and Pollution 25
Figure 6 Contribution to infrastructure development by the cement
industry
26
Figure 7 Impact on land prices 27
Figure 8 Employment status 28
Figure 9 Working hours 28
Figure 10 Salary earned by employees 29
Figure 11 Benefits other than salary 30
Figure 12 Quality of work-life 30

vi
Abbreviation
DOI: Department of Industry
FDI: Foreign Direct Investment
GoN: Government of Nepal
IBEF: India Brand Equity Foundation
IBN: Investment Board of Nepal
IMF: International Monetary Fund
MoF: Ministry of Finance
MOICS: Ministry of Industry, Commerce, and Supplies
NPC: National Planning Commission
NRB: Nepal Rastra Bank
OPC: Ordinary Portland cement
PCC: Per Capita Cement Consumption
PPC: Pozzolanic Portland cement
PSC: Portland Slag Cement
SAARC: South Asian Association for Regional Cooperation
TEPC: Trade and Export Promotion Centre
vii
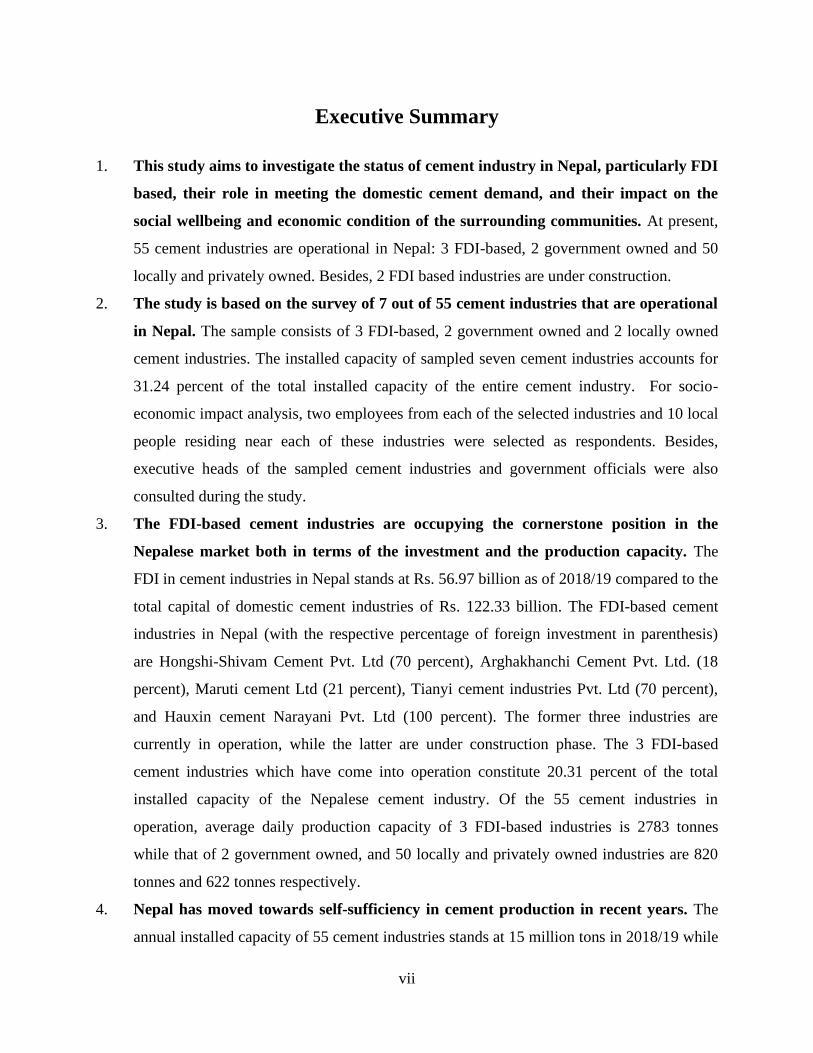
Executive Summary
1. This study aims to investigate the status of cement industry in Nepal, particularly FDI
based, their role in meeting the domestic cement demand, and their impact on the
social wellbeing and economic condition of the surrounding communities. At present,
55 cement industries are operational in Nepal: 3 FDI-based, 2 government owned and 50
locally and privately owned. Besides, 2 FDI based industries are under construction.
2. The study is based on the survey of 7 out of 55 cement industries that are operational
in Nepal. The sample consists of 3 FDI-based, 2 government owned and 2 locally owned
cement industries. The installed capacity of sampled seven cement industries accounts for
31.24 percent of the total installed capacity of the entire cement industry. For socio-
economic impact analysis, two employees from each of the selected industries and 10 local
people residing near each of these industries were selected as respondents. Besides,
executive heads of the sampled cement industries and government officials were also
consulted during the study.
3. The FDI-based cement industries are occupying the cornerstone position in the
Nepalese market both in terms of the investment and the production capacity. The
FDI in cement industries in Nepal stands at Rs. 56.97 billion as of 2018/19 compared to the
total capital of domestic cement industries of Rs. 122.33 billion. The FDI-based cement
industries in Nepal (with the respective percentage of foreign investment in parenthesis)
are Hongshi-Shivam Cement Pvt. Ltd (70 percent), Arghakhanchi Cement Pvt. Ltd. (18
percent), Maruti cement Ltd (21 percent), Tianyi cement industries Pvt. Ltd (70 percent),
and Hauxin cement Narayani Pvt. Ltd (100 percent). The former three industries are
currently in operation, while the latter are under construction phase. The 3 FDI-based
cement industries which have come into operation constitute 20.31 percent of the total
installed capacity of the Nepalese cement industry. Of the 55 cement industries in
operation, average daily production capacity of 3 FDI-based industries is 2783 tonnes
while that of 2 government owned, and 50 locally and privately owned industries are 820
tonnes and 622 tonnes respectively.
4. Nepal has moved towards self-sufficiency in cement production in recent years. The
annual installed capacity of 55 cement industries stands at 15 million tons in 2018/19 while

viii
the domestic demand is 9.05 million tons. Domestic cement industries produced 7.49
million tons while 1.56 million tons of cement was imported in 2018/19. Though the
import of both cement and clinker declined in 2018/19, significant quantity has still been
importing primarily because of issues like certification, quality inconsistency and bulk
supply ability issues related to domestic cement industries.
5. There exists significant excess capacity in cement industries of Nepal. The average
capacity utilization of sampled seven industries stands at 50.41 percent, with
government-owned cement industry at 50.12 percent, locally-owned cement industry at
63.78 percent, and FDI-based cement industry at 45.81 percent.
6. Since the demand for cement is projected to be doubled in the next three years, there
is still room for more cement industries to be set up in Nepal. The per capita
consumption of cement is low in Nepal (303 kg) compared to other countries like China
(1716 kg), South Korea (1102 kg) and Bhutan (734 kg). As Nepal is in the process of
developing infrastructure, the demand for cement is likely to go up. Several mega projects
and national pride projects such as Gautam Buddha Regional International Airport,
Budhigandaki Hydropower Project, Pokhara Regional International Airport, and so on are
under construction. Similarly, Upper Marshyangdi Hydropower–2, Kaligandaki Gorge
Hydropower Project, and Ankhu Khola Hydropower Project are already in the pipeline. A
study by the Ministry of Industry, Commerce, and Supplies (2019) has projected the
installed capacity of the cement industry increase to 20 million tons by 2023/24. Huaxin
cement industry with a production capacity of 3000 MTD, Garud cement industry with a
production capacity of 3000 MTD, and Tianyi cement industry with a production capacity
of 720 MTD1 are under construction and is expected to start production by 2022/23.
7. FDI-based cement industries are found to be more efficient and profitable than both
government owned and locally owned cement industries. In order to produce 1 ton of
cement, while the FDI-based cement industry, on an average, uses 0.99 metric tons of
limestone, the government-owned cement industry uses 1.45 metric tons. Similarly, the
production cost to the sales ratio of the FDI-based cement industry is about 46.63 percent
compared to 48.95 percent and 82.18 percent of locally owned and government owned
cement industry. Arising economies of scale owing to larger size and the use of superior
1 Extracted from Industrial Information System, Department of Industry

ix
technology in the FDI-based cement industries are the reasons behind their higher
efficiency.
8. Majority of respondents, especially those who reside near FDI-based or locally owned
cement industry, agree that cement industry has assisted in the promotion of business
opportunities. Government-owned cement industries are located far from the residential
area while the FDI- based and locally owned cement industries are located near residential
areas.
9. Around fifty-seven percent of respondents agree that FDI-based cement industry has
provided employment to local people. However, for the government owned and locally
owned industries, 90 percent and 60 percent respondents, respectively, agree that cement
industries have provided employment to local people. However, local people constitute of
less than 10 percent of total employees in cement industry.
10. Around 92 percent of respondents agree that cement industries has created negative
externality through air, sound, land and water pollution. Air pollution is the major
negative externality faced by the residents followed by sound pollution and land pollution.
FDI-based industries, owing to their superior technology, generate comparatively lower air
pollution than locally owned and government-owned industries.
11. Respondents residing near cement industry who agree that the industry has
contributed to infrastructure development are 37 percent for FDI based cement
industry compared to 90 percent for the government-owned cement industry. The
majority of the cement industries have contributed to building roads and schools. The
government owned cement industries are found to be engaged more in infrastructure
development.
12. The impact of the cement industry on nearby land prices is found to be mixed. Forty-
seven percent of respondents agree that the cement industry has a positive impact on
land prices. The majority of the respondents living near the government-owned cement
industry respond that the cement industry does not have a positive impact on land prices.
Land prices have been increased by almost 433 percent near the FDI-based cement
industry followed by a locally-owned cement industry (359 percent), and government-
owned industry (100 percent) compared to the land prices before establishment of these
factories. However, the hike in land price has resulted only in the front part of the industry

x
while the land located behind the industry has lost its value due to pollution generated by
the industry.
13. The role of the government is important in increasing the capacity utilization of the
cement industries. The government can raise the domestic demand by aggressively
undertaking construction activities of the mega projects for infrastructure development.
The government could also introduce a favorable policy including provision of certification
for domestically produced cement that would encourage export of cement to the adjoining
states of India given that the nearby states of India do not have limestone ore.
14. Regulations need to be designed to make cement industries internalize the negative
externalities they create. Government authorities must not allow establishment of cement
industries near the residential areas or highways where the pollution could easily reach out
to general people. Besides, cement industries should be mandated to invest in local
development such as roads, schools, hospitals as part of its corporate social responsibility.
15. FDI in cement industries should be kept open as FDI helps in bringing new
technology into the country and promotes the competition forcing domestic industries
to be more efficient. It is, however, better to allow FDI in cement industries only on
condition that local investors also hold certain minimum percent equity in such industries.
This would help in the transfer of both technical and managerial know-how from foreign
investors to local stakeholders. Also, it is important to review the regulation regarding the
maximum permissible debt to equity ratio in FDI based cement industry in the context that
significant amount of debt is being raised by the FDI-based cement industry in Nepal.

CHAPTER I: INTRODUCTION
1.1. Background of the study
The cement industry is one of the most important industries for infrastructure
development. Cement is a basic substance required in construction2, and therefore, the
demand for cement is generally used as an indicator of construction activities taking
place in an economy. The consumption of cement has been increasing in Nepal in recent
years. After the earthquake of 2015, the reconstruction activities have driven up the
demand for cement. The domestic annual demand for cement in Nepal increased from
4.54 million tons in 2014/15 to 4.81 million tons in 2015/16 and to 9.05 million tons in
2018/193. Although most of the reconstruction activities now have been completed, the
demand for cement is unlikely to subside. Nepal aims to upgrade to developing country
status by 2022 and achieve sustainable development goals (SDG) by 2030. This calls for
a total investment amounting to Rs. 17 trillion, mostly in infrastructure in 9 years
(UNDP, 2013). Besides, the National Planning Commission has identified 22 national
pride projects in line with the national vision of "Prosperous Nepal; Happy Nepali". This
necessitates the investment in mega projects in physical and social overhead, which is
likely to raise the demand for cement within the country.
Because of the sheer quantity of cement required in the construction sector and the huge
transportation cost associated with its import, it is strategically important for an economy
to develop robust domestic capacity in cement production. Development of the domestic
cement industry will bring the utilization of domestic limestone ore, save foreign
exchange, generate employment opportunities as well as ensure cost-effective and
smooth supply of cement to meet the domestic demand.
Although Nepal has been historically dependent on imports for meeting a significant
proportion of its cement demand, the situation has now been changing with the
establishment of new cement industries in the country. Buoyed by the surging demand for
2 As per Industrial Production Index for Nepal, the weightage of cement in construction activities on an
average is around 20 percent. (Source: Central Bureau of Statistics, Kathmandu, Nepal) 3 Calculation by NRB using the data of excise duty from Department of Customs and import data from
TEPC

2
cement due to reconstruction activities, several cement industries have been established
in recent years, and some of those have been set up with foreign direct investment (FDI).
The inflow of FDI in the cement industry can be attributed to the brighter prospect on
near-future of development activities in Nepal as well as the liberal FDI policy adopted
by the government.
Given the resources and technology gap in the country, Nepal has adopted an open and
active policy to attract FDI in several sectors, including the cement industry. Investment
Board of Nepal has identified 8 different potential investment sectors for FDI, that is,
hydropower, transport, agriculture, tourism, information communication technology,
mines and minerals, health and education, manufacturing, and financial. Table 1 shows
the FDI commitments received in key sectors of the Nepalese industry in 2018/19.
Industries that fall on the mineral category have the least number of FDI recipient
projects and have the least FDI inflow in 2018/19. However, the FDI in cement industries
stands at Rs. 56.97 billion, while the total capital of domestic cement industries stands at
Rs. 122.33 billion as of 2018/19 (DOI, 2020a). At present, there are 3 cement industries
with FDI in operation while 2 are still under construction.
Table 1: FDI commitments in the Nepalese industry in 2018/19.
Category Number of
Projects
FDI (Share
in total FDI)
FDI to
Project Cost
FDI in
cement*
Agro and forestry-based 17 1.58 98.56 -
Information technology 24 2.55 73.61 -
Manufacturing 62 26.57 61.53 5
Mineral 2 0.05 70.00 -
Service 108 27.89 98.48 -
Tourism 131 41.36 85.43 -
Total 344 100 - 5
Source: DOI, 2020
Note: * Number of industries approval from DOI between 2013/14 and 2018/19
With the growth in the number of cement industries, the installed capacity for the cement
now exceeds the domestic demand. The installed production capacity of cement stands at
15 million tons whereas the domestic demand is at 9.05 million tons in 2018/19 in the

3
country4. Of this, 7.49 million tons have, however, been met with domestic supply while
the rest have been from imports.
Though the country seems to be self-sufficient in terms of installed production capacity
for cement at present, several issues warrant the attention of the policymakers. Despite
the existence of sufficient domestic capacity for cement production, a significant quantity
of cement has still been imported at present. Given the prospective infrastructural
activities in the coming years, it is also necessary to identify whether the present installed
capacity of cement production is sufficient to meet future demand. Further, many
questions need to be explored such as whether the FDI in cement industries have helped
to introduce better technology and management expertise within the country or not; and
whether the government should prioritize the FDI in the cement industry or not. Besides,
there are several socio-economic effects associated with the cement industries which
need to be duly considered by the policymakers.
The establishment of cement industries generally brings significant externalities, both
positive and negative. Setting up cement factories can generate employment
opportunities, directly by hiring local people and indirectly by stimulating business
activities near its premises. The development of the road to the factory site will also
benefit the local community and can also boost the land prices. However, the cement
factory can create significant pollution both air and noise which can be hazardous to the
health of surrounding communities. Battelle (2002) figures out that the cement industry
generated about 3 percent of global greenhouse gas emissions. Cement plants and
quarries have adverse effects on local ecology, biodiversity and water resources. Busuyi,
Frederick, and Fatai (2008) find that the lifestyle of people around cement manufacturing
plants is poor and characterized by poor education and a high percentage of illiteracy.
Apart from its widespread impact on the surrounding environment, the cement industry
has a significant impact on the national economy. While granting a permit for setting up a
cement factory, it is, therefore, important that the authority should analyze both social
cost and benefits associated with the project and ensure that both get accounted for.
4 Calculation by NRB using excise data of cement industries from Department of Customs and data of
cement imports from TEPC.

4
1.2. Objectives of the study
This research aims to analyze the status of the cement industry in Nepal, especially FDI
based, and how they compare with locally owned cement industries and how effective
have they been in fulfilling the gap between domestic demand and supply of cement. This
study also explores the socioeconomic impact of cement industries on surrounding
communities. Specifically, the objectives of the study are:
• To investigate the effectiveness of FDI on fulfilling the existing gap in cement
production.
• To examine the impact of cement industries on social wellbeing and economic
condition of the surrounding communities.
1.3. Significance of the study
The study has provided a clear insight into the status of cement industries; especially FDI
based ones, in Nepal. The details of installed capacity, actual domestic production and
import of cement and clinker help in evaluating the development and competitiveness of
the domestic cement industries. The study focuses on the role of FDI-based cement
industries in fulfilling the growing demand of cement in the country. The comparison of
technical and financial status of FDI based and locally owned cement industries has
provided important information relating to the technical and managerial efficiency of FDI
based industries relative to locally owned ones. Such information can be crucial for
policymakers while assessing the need for FDI in cement industries.
The present study also aims to examine the socio-economic impact of cement industries
on surrounding communities. The study concentrating on the socio-economic impact of
the cement industry has not been conducted in Nepal yet. However, this type of study has
been conducted in the majority of other SAARC countries. The analysis of socio-
economic aspects like employment generation, health hazards, infrastructure
development, land prices, among others, provides valuable information which could be
useful in designing policies that require the cement industries to internalize the
externalities associated with them.

5
1.4. Limitations
The study covers all the FDI based and government owned cement industries operating in
Nepal but covers only two privately and locally owned cement industries. As such, care
should be taken while generalizing the results with respect to locally owned cement
industries. Further, non-probability sampling method (judgmental sampling) has been
used to select respondents during the study for the sake of convenience. The number of
respondents are limited; hence results may not be fully representative.

CHAPTER II: REVIEW OF LITERATURE
The review of literature is classified into two parts: a) review of international literature
and b) review of national literature. Under review of international literature, the study has
reviewed the research done by Afeni and Adeogun (2015), Kusena, Shoko and
Marambanyika (2012), Burange and Yamini (2009), and Muthukrishan (2002).
Moreover, the study has reviewed the study report prepared by the Ministry of Industry,
Commerce, and Supplies (2019) as well.
2.1. Review of International Literature
Afeni and Adeogun (2015) assess the socio-economic impact of limestone quarrying and
processing operations at Ewekoro, South-Western Nigeria on the inhabitants of the
community and the workers. They find that limestone exploitation have both positive and
negative effects on the host community and the workers. However, the benefits derived
by the host community like employment, good roads, schools, and hospitals are
insignificant compared to the negative effects of the exploitation on the community
which includes a reduction in crop production, negligence of education by students,
overcrowding and high competition for little-available social amenities. They have made
several recommendations to ameliorate those negative socioeconomic effects.
Similarly, Kusena, Shoko, and Marambanyika (2012) examine the socio-economic
impact of cement production at Sino on the nearby Hozheri community by collecting data
through questionnaires, observations, and interviews from sixty-five households selected
through stratified random sampling. Research findings reveal that the establishment of
Sino-Zimbabwe cement manufacturing company has socio-financial benefits to the
surrounding community through the creation of employment, establishment of a lucrative
local market, retention of skilled teachers, construction of schools and healthcare
facilities as well as provision of bursaries to excelling students. However, local people
and the company blame each other for the slow pace of development being realized. High
dust emissions also pose a threat to human health, crops, livestock, and indigenous
forests. The study has recommended that the company should adopt effective
environmental management tools to reduce dust emissions.

7
Muthukrishan (2002), however explores the performance of the cement industry with
special reference to Tamil Nadu. The trends in productivity growth have been measured
by introducing partial and total factor productivity. The operating efficiency has been
measured in terms of capacity utilization, limestone consumption, coal consumption,
power consumption, and average price realization per tonne of cement. The sector-wise
comparison of operating efficiency indicates that the performance of private sector
cement companies has been more outstanding than that of the public sector cement
company. Also, the productivity status has been analyzed based on eight parameters
suggested by Alan Lawlor. They are total earnings to conversion cost, purchased services
to total earnings, wages, and salaries to sales percentage, profits to conversion cost ratio,
profits to sales percentage, profits per employee, sales per employee, and value-added per
employee. The sector-wise comparison of total earnings to conversion cost ratio finds
that the earnings in the private sector are consistently good. The purchased service costs
are higher in the public sector. The private sector has more control over wages and
salaries than the public sector. Likewise, the comparison of profit to conversion cost
indicates that the private sector has reported good profits. In terms of profit to sales, the
private sector is better than the public sector. The sector-wise comparison of sales per
employee indicates that the public sector is below unity compared to higher than unity in
the private sector.
Similarly, Burange and Yamini (2009) study the performance of the Indian cement
industry and find that the cement industry has been experiencing a boom on account of
the overall growth of the Indian economy. The performance of the industry, under
different policy regimes, truly establishes that decontrol of the industry and the
liberalization of the economy has led to remarkable improvement in the indicators such
as installed capacity, capacity utilization, per capita consumption, and exports. Positive
trends can be evidenced in some of the other indicators too namely technology, prices,
and regional and market concentration. While evaluating competition among firms for the
year 2006-2007, out of the sample of 17 firms (90.21 percent of the market share), about
47 percent have recorded above industry average performance in the overall
competitiveness index. The marginal difference between the indices of competitiveness
of different firms implies the tough competition among the firms in the industry.

8
2.2. Review of National Literature
A study done by Ministry of Industry, Commerce, and Supplies (2019), Government of
Nepal shows the present status of cement manufacturing industries and has made a
forecast of the demand of cement in Nepal for the next 10 years. The methods used for
data collection includes direct interviews, Focus Group Discussion (FGD), and Key
Informant Information (KII). The study has projected the installed capacity of the cement
industries in the country to reach 10 million tons per annum by the end of 2020 and 20
million tons per annum by 2024. This study worries that small cement plants of less than
500TPD are likely to face threats in the future from the large-sized FDI based cement
factories. The study asserts that the large number of small and medium-sized cement
manufacturers has been impacting the cost of production and failing to reap the
economies of scale and, therefore, the establishment of a few giant industries could be a
viable option. Hence, FDI in cement industry is necessary.
In the last two decades, cement production in Nepal has not followed a linear growth.
Since 2010, the production has spiked significantly and by the end of 2019, the import of
cement has declined sharply. On account of the direct relationship of cement demand
with the GDP growth, the study finds out that the multiplier factor of 4.79 to the cement
demand in Nepal, that is, a one percentage point increase in GDP leads to 4.79 percent in
the demand for cement in Nepal.
There have not been many studies related to the cement industry in Nepal. The study by
Ministry of Industry, Commerce, and Supplies (2019) has covered the other aspects but it
has not focused on socio-economic aspects. In this regard, the present study focuses on
the FDI based industries and explores the socio-economic impact of Nepalese cement
industries on surrounding communities in detail.

CHAPTER III: RESEARCH METHODOLOGY
3.1 Research Design
This study has been conducted through a descriptive and explorative research design. The
study mainly focuses on the cement industry having FDI. A comparison has been made
between cement industries having FDI and not having FDI in the areas of production,
employment, profitability, capacity utilization, among others. Qualitative as well as
quantitative data have been collected. Qualitative data have been processed and presented
through explanation, interpretation, and summarization, while quantitative data have been
processed through percentage, ratio, and trend analysis.
3.2 Nature and Sources of Data
Primary data has been mainly used for this study, but secondary data is also used
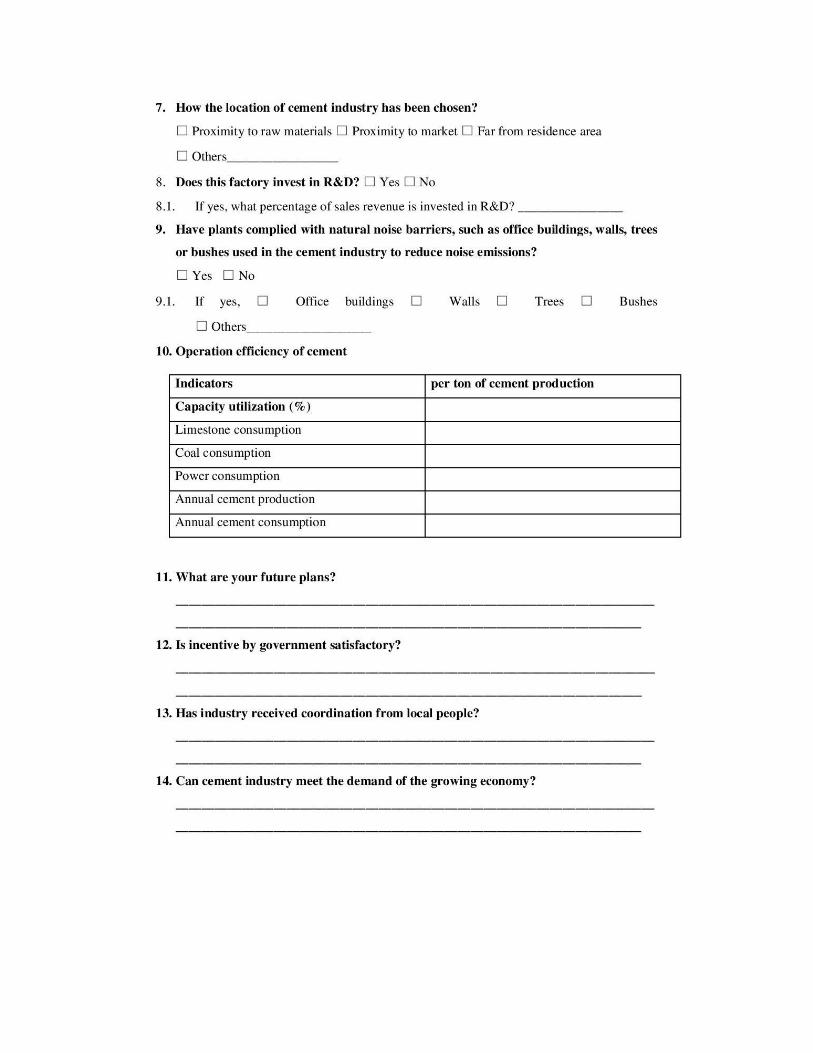
wherever deemed necessary. The questionnaire has been the main instrument for
collecting primary data. A semi-structured interview has also been conducted to collect
tacit information. The respondents included executive heads of the sampled cement
industry, employees of the industry, government officials, and the local people who are
living around the industry. For a different group of respondents’ different sets of
questionnaires have been developed (Annex 3). Published as well as unpublished annual
reports of the industry, reports published by various authorities, media coverage, among
others are the major sources of secondary data.
3.3 Sampling and Data Collection
The judgmental sampling method has been applied to choose the sample items from the
stratified population. The cement industries operating in the country have been grouped
into three categories.

10
Table 2: Selection of sample design
S.
N. Particulars
Populatio
n Sample Industry
Basis of
Selection
1 Cement Industries with
FDI 3 3
Hongshi Shivam
Cement Pvt. Ltd.
Arghakhanchi Cement
Pvt. Ltd
Maruti Cement Ltd
FDI related
2
Cement
Industries
without
FDI
Government
Owned 2 2
Hetauda Cement Ltd,
Udaypur Cement Ltd
Govt. Owned
Locally
owned5 50 2
Ghorahi Cement
Industry Pvt. Ltd.
Jagadamba Cement
Industries Pvt. Ltd.
Large in
Production
Size,
representation
of a
geographical
area, and
representation
of both
integrated and
clinker-based
industry.
Total 55 7
Note: There are 5 cement industries with foreign investment, but only 3 are currently in operation.
Employees of the selected industry also have been the respondents of the study. The
permanent employees have been selected based on their job- administrative/ technical,
and labor. Two employees from each category have been interviewed in the study.
Local people residing near the factory site and the government officials have been
another group of respondents. At least 10 local people have been selected based on
judgmental sampling method. During selection, priority has been given to the residents
who live very near to the factory site. The other respondents include chairman of
Federation of Nepal Chamber of Commerce and Industry, Cement Manufacturers
Association of Nepal, Director General of Department of Industry, investors of the
cement industry, and engineers of national pride projects. Field survey and interviews
were carried in January 2020.
5The domestic cement industries fully owned by Private Nepalese investors.

CHAPTER IV: DATA PRESENTATION AND ANALYSIS
This chapter is presented in six sections. The first section makes an international
comparison of cement consumption across countries. The second and third section deals
with the scenario of the cement industries and the status of cement production in Nepal,
respectively. The fourth section describes the market structure of cement in Nepal while
the fifth section analyses the efficiency of cement industries. The last section analyzes the
socio-economic impact of the cement industries on the surrounding communities. The
data of FDI-based, government-owned, and locally owned cement industries are used
separately for comparison. A relative frequency contingency table has been used for data
presentation and analysis.
4.1. Cement Consumption: International Comparison
According to Concreatech (2018), China is the largest consumer of cement with 2386
million metric ton followed by India with 284 million metric tons in 2017. Both China
and India together accounted for about 64.17 percent of the total cement consumption in
the world. China's cement consumption alone in 2017 is more than the total cement
consumed by the rest of the world combined.
The developing countries are the major cement consumers of the world. Out of 20 top
cement consuming countries, 16 countries are developing countries. Likewise, 14 out of
20 countries are Asian. Amongst SAARC countries, India, Pakistan, and Bangladesh
occupy the top 20 positions in cement consumption.

12
Table 3: Top 20 countries based on cement consumption in 2017
Rank Country Consumption
(Mt)
Share
(%) Rank Country Consumption
(Mt)
Share
(%)
1 China 2386 57.2 11 Iran 49 1.2 2 India* 284 6.9 12 Saudi Arabia 47 1.1
3 The United
States**
97 2.3 13 Japan** 42 1.0 4 Turkey 75 1.8 14 Mexico 41 1.0
5 Indonesia 66 1.6 15 Pakistan* 39 0.9 6 Vietnam 60 1.4 16 Philippines 30 0.7
7 South Korea** 57 1.4 17 Thailand 29 0.7
8 Russia 55 1.3 18 Germany** 29 0.7 9 Egypt 54 1.3 19 Algeria 28 0.7
10 Brazil 54 1.3 20 Bangladesh* 28 0.7
Source: Concreatech, 2018
Note:
* 3 out of 8 SAARC countries are in the top 20 lists.
** 4 out of 39 advanced economies6 are in the top 20 lists.
# 14 out of 20 countries are Asian.
## 16 out of 20 countries are developing economies
### Global cement consumption in the world stands at 4142 million metric tons in 2017
Table 4: Top 10 Asian countries in terms of Per-capita Cement Consumption (PCC) in
2017
Rank Country PCC (kg) Rank Country PCC (kg)
1 China 1716 6 Mongolia 560
2 South Korea 1102 7 Hong Kong 829
3 Macau 995 8 Bhutan* 734
4 Brunei 979 9 Vietnam 643
5 Singapore 916 10 Malaysia 619
- Nepal 303 - India7 202
Source: Concreatech, 2018
Note: * Bhutan is only South Asian country to be in the Top 10.
Table 4 depicts the top 10 Asian countries in terms of per capita cement consumption in
2017. The per capita cement consumption is the ratio of total cement consumption to the
total population of a country. China, with 1716 kg per person, is the country with the
highest per capita cement consumption in Asia in 2017.
6 Advanced economies as classified by International Monetary Fund (IMF, 2019) 7 IBEF. (2018). Cement. Retrieved fromhttps://www.ibef.org/download/cement-dec-2018.pdf

13
The per capita cement consumption for Nepal stood at 303 kg in 2017 (Concreatech,
2018), which is far below the world average and even less than in Bhutan, marking a
slower pace of infrastructural development relative to other countries.
4.2. Cement Industries in Nepal
Himal Cement Factory, established in 1972, was the first cement factory in Nepal. Later
Hetauda Cement Factory and Udaypur Cement Factory were established in 1976 and
1987 respectively. All of these were government-owned enterprises. After the closure of
himal cement industry in 2002, only two government owned cement industries are
currently in operation. With the adoption of economic liberalization policy since the early
1990s, the private sector has emerged as the major player in the Nepalese cement
industry. Thus, private cement factories have gradually increased in Nepal.
The Economic Survey 2019/20 has identified the cement industry as one of the leading
industries of Nepal (Ministry of Finance, 2020). According to the Cement Manufacturers’
Association (2020), 55 cement industries are in operation in Nepal. Of these, Hetauda
Cement Industry and Udaypur Cement Industry are the only two government owned
industries; 3 are FDI based-includes both joint ventures and wholly-owned, and the
remaining 50 are locally owned industries.
Nepalese cement industries produce PPC, OPC, and PSC cement. Nepalese cement
industries are mandatorily required to produce at least 33-grade PPC, PSC and OPC
cement. However, the Nepal Bureau of Standards and Metrology provides Nepal
Standard certification to PPC, PSC, and OPC category as a whole but not on specific
grades within them. Table 5 depicts the categorization of cement industry according to
ownership and product.

14
Table 5: Categorization of cement industry according to ownership and product
Category PPC OPC PSC PPC/OP
C/PSC
PPC/
OPC
OPC/
PSC
PPC/
PSC
Unspecifie
d Total Share
Local 4 24 1 34 33 9 0 15 120 96%
FDI 0 0 0 3 1 0 1 0 5 4%
Total 2 24 1 37 34 9 1 15 125 100%
Share 1.6% 19.2% 0.8% 29.6% 27.2% 7.2% 0.8% 12.0% 100%
Source: Department of Industry, Government of Nepal, 2075
Note: PPC is generally used for plastering; OPC is used for roofing and making grouts; PSC is
environmentally friendly cement, which is similar to PPC. PPC generally takes 28 days to achieve concrete
strength with a minimum of 430kg/sqcm, while OPC takes 28 days to achieve concrete strength with a
minimum of 530 kg/sqcm.
4.2.1. FDI in Cement Industries in Nepal
The FDI in cement industries stands at Rs. 56.97 billion, while the total capital of
domestic cement industries amounts to Rs. 122.33 billion as of 2018/19 (DOI, 2020a).
List of cement industries with FDI is given in Table 6. Out of five so far registered, 3 are
in operation and 2 are under construction. A brief description of those in operation is
presented below.
Table 6: List of Cement industries with FDI in Nepal
S.N. Cement Industry with
FDI
FDI Foreign Partner and
country
Registered
date
Status
1 Hongshi-Shivam
Cement Pvt Ltd
70 % Hong Kong Red Lion
Cement No 3
(Hongshi Group),
China
12/14/2015 Operation
2 Tianyi Cement
Industries Pvt.Ltd.
70 % N/A 11/12/2017 N/A
3 Arghakhanchi cement
PvtLtd
18 % Uma International,
India
12/31/2015 Operation
4 Maruti Cements Ltd 21 % Gravity Sales Pvt Ltd,
India
12/25/2005 Operation
5 Hauxin Cement
Narayani Pvt Ltd
(under construction)
100 % Huaxin Central Asia Investment (Wuhan) Co Ltd, China
12/15/2017 Under
Construction
Source: DOI, 2020a
15
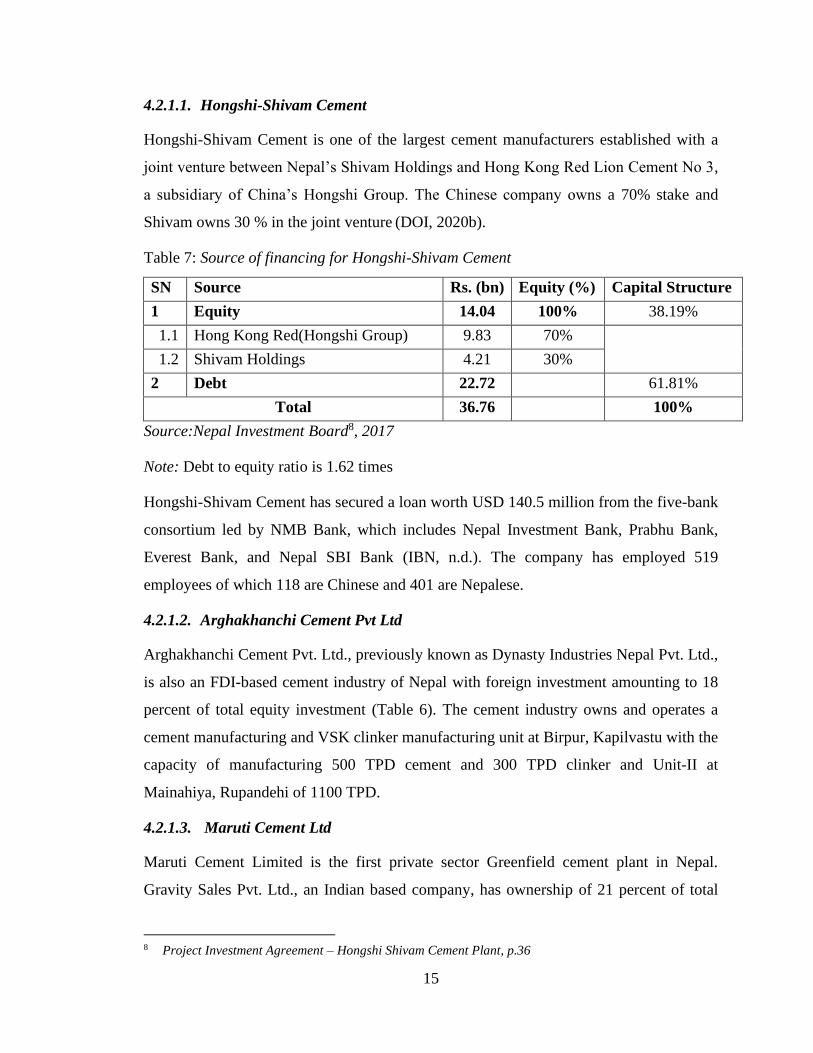
4.2.1.1. Hongshi-Shivam Cement
Hongshi-Shivam Cement is one of the largest cement manufacturers established with a
joint venture between Nepal’s Shivam Holdings and Hong Kong Red Lion Cement No 3,
a subsidiary of China’s Hongshi Group. The Chinese company owns a 70% stake and
Shivam owns 30 % in the joint venture (DOI, 2020b).
Table 7: Source of financing for Hongshi-Shivam Cement
SN Source Rs. (bn) Equity (%) Capital Structure
1 Equity 14.04 100% 38.19%
1.1 Hong Kong Red(Hongshi Group) 9.83 70%
1.2 Shivam Holdings 4.21 30%
2 Debt 22.72
61.81%
Total 36.76
100%
Source:Nepal Investment Board8, 2017
Note: Debt to equity ratio is 1.62 times
Hongshi-Shivam Cement has secured a loan worth USD 140.5 million from the five-bank
consortium led by NMB Bank, which includes Nepal Investment Bank, Prabhu Bank,
Everest Bank, and Nepal SBI Bank (IBN, n.d.). The company has employed 519
employees of which 118 are Chinese and 401 are Nepalese.
4.2.1.2. Arghakhanchi Cement Pvt Ltd
Arghakhanchi Cement Pvt. Ltd., previously known as Dynasty Industries Nepal Pvt. Ltd.,
is also an FDI-based cement industry of Nepal with foreign investment amounting to 18
percent of total equity investment (Table 6). The cement industry owns and operates a
cement manufacturing and VSK clinker manufacturing unit at Birpur, Kapilvastu with the
capacity of manufacturing 500 TPD cement and 300 TPD clinker and Unit-II at
Mainahiya, Rupandehi of 1100 TPD.
4.2.1.3. Maruti Cement Ltd
Maruti Cement Limited is the first private sector Greenfield cement plant in Nepal.
Gravity Sales Pvt. Ltd., an Indian based company, has ownership of 21 percent of total
8 Project Investment Agreement – Hongshi Shivam Cement Plant, p.36

16
equity investment. It has an installed capacity of producing 207000 MT PPC and 138000
MT PSC (DOI, 2020b).
4.3. Status of Cement Production in Nepal
Over the past few years, cement production has followed an upward trend in Nepal.
Currently, 55 cement industries are in operation with an annual capacity of 15 million
metric tons (Table 8). The establishment of Hongshi Cement as a big cement
manufacturer as well as an increase in production of clinker and cement by other
domestic factories has played a crucial role in lowering the import of cement. Domestic
cement industries produced about 7.49 million tons of cement in 2018/19 (Table 8).
According to Nepal Rastra Bank (2019a), Nepal imported cement worth Rs 12.97 billion
in 2018/19 compared to Rs. 31.12 billion in the previous year. In quantitative terms, 1.56
million tons of cement was imported in 2018/19 compared to 3.42 million ton in 2017/18
(TEPC, 2020). Likewise, Nepal imported clinker worth Rs. 12.80 billion in 2018/19
compared to Rs. 30.50 billion in the preceding year. In quantitative terms, 1.35 million
tons of clinker was imported in 2018/19 compared to 3.32 million metric ton in 2017/18
(TEPC, 2020).
Figure 1: Import and production of cement and clinker
Source: TEPC (2020) and NRB (2020)
Figure 1 depicts the pattern of change in the import of cement and clinker between
2014/15 and 2018/19. There has been a sharp decline in the import of cement and clinker.

17
In 2018/19, the cement import declined by almost 54 percent and clinker import fell by
almost 56 percent as compared to the previous year.
The gap between the domestic demand and supply of cement has gradually narrowed
down. Nonetheless, the cement is still being imported from India due to various reasons.
Domestic cement industries have a limited ability to supply cement in bulk quantities as
needed by the megaprojects. The megaprojects in Nepal use cement manufactured both in
Nepal and India. These projects rely on Indian companies for supplying cement in bulk.
The testing of the quality of cement requires about two to three weeks9, and for each
batch of cement the testing needs to be carried out. When cement supply consists of
smaller batches, considerable time gets wasted in the testing process which slows down
the construction activities. Another reason for megaprojects to rely on Indian companies
is due to their quality consistency, which is a major problem in Nepalese cement
manufacturers10.
Table 8: Present scenario of Cement Production
Description Quantity (Million Metric ton)
Annual installed capacity* 15
Annual actual production** 7.49
Domestic consumption demand 9.05
Export 0
Import 1.56
Source: TEPC, 2020; Cement manufacturers’ association, 2020
* Interview with Chairman, Cement manufacturers’ association
** Extracted from customs data
Table 9 presents the annual installed capacity of sampled cement industries. The total
installed capacity of sampled cement industries amounts to 4.687 million metric tons,
which is 31.24 percent of the total installed capacity of the entire cement industry in
Nepal. Three FDI-based cement industries constitute 20.31 percent of the total installed
capacity of the industry.
9 For projects, it is mandatory to test the quality of cement which requires casting a block of cement
concrete and then allowing it to cure for at least three weeks. 10 Information gathered from the interview with the authorities associated with national pride projects and
other mega projects such as Tamakoshi Hydropower Project.

18
Table 9: Annual installed capacity of sampled cement industries
SN Category Cement
Industry
Million
metric tons
Share in national
installed capacity (%)
1.
FDI based
Hongshi cement 2.190 14.600
2. Arghakhanchi 0.402 2.677
3. Maruti 0.456 3.042
4. Locally
owned
Ghorai 0.712 4.745
5. Jagadamba 0.329 2.190
6. Government
Owned
Udayapur 0.307 2.044
7. Hetauda 0.292 1.947
Total 4.687 31.244
Source: Field Survey
Table 10 depicts the average production capacity of FDI-based, government-owned, and
locally-owned cement industries in Nepal. FDI-based cement industries are giant with an
average production capacity of 2783.33 tons per day, followed by government-owned,
and locally-owned. The production capacity of average FDI based cement industry is
more than 4 times the average of privately and locally owned cement industries. Ministry
of Industry, Commerce, and Supplies (2019) has concluded that domestic industries with
a production capacity of fewer than 500 tons per day are under threat as FDI-based
industries with larger production capacity enjoys economies of scale and can adopt
penetrating pricing strategy, which ultimately forces small domestic cement industry to
exit from the market.
Table 10: Production Capacity
SN Category Number of
industry
Average production capacity
(Ton per day)
1 FDI based 3 2783.33
2 Government-owned 2 820.00
3 Locally owned 50 622.12
Source: Field Survey

19
The demand for cement is expected to rise in coming years as Nepal is in the process of
developing and enhancing infrastructure and social overhead. Several mega projects and
national pride projects are under construction and these projects are the major drivers of
cement demand. Some of the major ongoing projects are Gautam Buddha Regional
International Airport, Budhigandaki Hydropower Project, Pokhara Regional International
Airport, and the like. Several mega projects are in pipeline such as Upper Marshyangdi
Hydropower – 2 projects, Kaligandaki Gorge Hydropower Project, and Ankhu Khola
Hydropower Project.
Table 11: Forecast of Cement Demand for the next 5 Years
Year Annual Cement demand (million
MT)
2020/21 13.27
2021/22 15.41
2022/23 18.69
2023/24 22.42
2024/25 25.88
Source: Estimation based on regression result shown in Annex 2
Based on the NPC's projection for the growth of construction sector in the 15th Plan, the
demand for cement is projected for the next five years. The forecast of cement demand
for the next 5 years presented in Table 11 is based on the elasticity coefficient of real
GDP obtained from two-stage regression presented in Annex 2. Likewise, the Ministry
of Industry, Commerce, and Supplies (2019) has projected to increase the installed
capacity of cement industry to 20 million metric tons by the end of 2023/24. Huaxin
cement industry with production capacity of 3000 MTD, Garud cement industry with
production capacity of 3000 MTD, and Tianyi cement industry are under construction
and expected to start production by 2022/23. Hence, we can argue that these FDI based
cement industries will be helpful to fulfil the demand and supply gap in cement
production.
4.4. Market Structure of Nepalese Cement Industry
Prices of almost all the cement industries remain in a same range except for Hetauda and
Udayapur cement industries. The average year-round price of OPC cement of 26 cement

20
industries was Rs. 775 per bag, while the average price of OPC cement of 24 cement
industries, excluding government-owned industries, was Rs. 764 per bag at the time of
survey (Table 12).
Table 12: Descriptive statistics regarding price of OPC cement of 26 cement industries
Descriptive statistics including Hetauda
and Udayapur
Descriptive statistics excluding
Hetauda and Udayapur
Mean 775 Mean 764
S.D. 43.40 S.D. 26.56
C.V. 5.64 C.V. 3.47
Note: Annex 1 presents the market price of OPC cement of 26 cement industries
The price of government-owned cement industries is relatively higher than that of other
industries (Annex 1). The prices of cement produced by domestic industries other than
government-owned are more or less similar. The price of Hetauda cement and Udayapur
cement is at least 15.96 percent and 18.84 percent, respectively, higher than the average
price of other cement factories in Nepal. As reported by heads of the government owned
cement factories during interview, they have been using at least 30 to 40 years long
conventional production technologies and the production process occasionally gets halted
due to kiln brick lining problem, kiln heating up11, and kiln inlet seal breaking.
After analyzing the price structure of 26 cement brands produced in Nepal, the study
finds that Sweezy’s kinked demand model best describes the Nepalese cement market
structure. Excluding government-owned cement industries, all other domestic cement
industries tend to follow each other in case of a downfall in price, but they may not
necessarily follow in case of price rise.
Nepalese cement industries are upward price rigid means that if one of the firms increases
the price, then others may not follow it, but if one of the firms decreases price, other
firms also follow them. The same scenario was seen when Hongshi-Shivam cement
industry set its price below the prevailing market price.
11 It takes time to heat up kiln once the kiln stops.

21
4.5. The efficiency of Cement Industries
Under this, the study focuses on the financial and technical aspects of the cement
industry. Under the financial segment, the study encompasses sales, conversion cost,
wages and salary, and profit. The technical aspects consider capacity utilization,
limestone consumption and production of electricity.
4.5.1. Financial status
Among the sampled cement industries, the average sales of FDI-based cement industries
are 1.74 times that of government-based and locally owned cement industries combined.
The sales revenue of FDI-based cement industries is driven by revenue generated from
the sale of clinker, while the majority of domestic industries make value addition to
clinker purchased or produce clinker for their use only (Figure 2).
The production cost to sales ratio of cement for FDI-based cement industries is
significantly lower in comparison to government-owned cement industries.
Quantitatively, the production cost to the sales ratio of the FDI-based cement industry is
about 46.63 percent, that of locally owned cement industry is about 48.95 percent, and
the government-owned cement industry is about 82.18 percent. Likewise, wages and
salary to sales ratio of FDI-based cement industries stand at 1.62 percent, while such a
ratio of government-owned and locally owned cement industries stand at 5.54 percent
and 2.58 percent respectively. The lower sales revenue of government-owned cement
industry is due to diseconomies of scale, lack of sales outlets, and reluctance of dealers to
engage in trade due to lower profit margin.
Similarly, the net profit margins of locally owned cement industries and FDI-based
cement industries are 10.42 percent and 10.17 percent respectively, while that of
government-owned industries is negative.

22
Figure 2: Average sales figures of cement industries
Source: Field Survey
4.5.2. Technical status
Capacity utilization of FDI-based industries was 45.81 percent at the time of survey,
which is lower than that of government-owned cement industry of 50.12 percent, and
locally-owned cement industry of 63.78 percent. Overall capacity utilization of all
cement industries is shown in Table 13. There is a wide fluctuation in capacity utilization
and the FY2018/19 showed heavy decline of capacity utilization to 40.4 percent from
74.6 percent a year earlier.
Table 13: Capacity Utilization of Cement industries from 2013/14 to 2018/19
Year Capacity Utilization
2013/14 60.67
2014/15 51.53
2015/16 54.91
2016/17 71.80
2017/18 74.60
2018/19 40.40
Source: Nepal Rastra Bank, 2019b
As the major ingredient for cement production, government-owned cement industries use
1.45 metric tons of limestone for producing 1 ton of cement, while FDI-based cement
industries use 0.99 metric tons of limestone for producing 1 ton of cement on average.

23
Such a comparison cannot be done as one of the sampled local cement industries does not
produce clinker.
Electricity consumption is the major performance indicator of an industry. On average,
the electricity consumption by domestic cement industries was 45236 MWh and by FDI-
based cement industries was 122722 MWh in 2018/19. Because of its large-scale
production, FDI-cement industries consume more units of electricity. Also, FDI-based
cement industries produced 104949.6MWh of electricity in 2018/19.
4.6. Socio-economic Impact on the Surrounding Communities
The socio-economic impact of cement industries on local communities has been analyzed
based on employment opportunity, business opportunity, land prices, and environmental
pollution to the local people and corporate social responsibility borne by industry as
reported by respondents.
4.6.1. Promotion of business opportunities
The respondents who agree that the cement industry has assisted in the promotion of
business opportunities constitute 49%, while 51% shows disagreement. Government-
owned cement industries are located far from the residential area, while FDI- based and
locally owned cement industries are located near residential areas so the former do not
seem to promote business opportunities much. Quantitatively, majority (54% and 57%)
of respondents near FDI-based and locally owned cement industries respectively agree
that the cement industry has promoted the business opportunity, whereas only 35% of
respondents living near government-owned cement industries agree that cement industry
has promoted their business opportunity (Figure 3).

24
Figure 3: Promotion of business opportunities by the cement industry
Source: Field Survey
4.6.2. Employment opportunities
Around sixty-nine percent of respondents on average agree that the cement industry has
employed local people. However, as high as 90 percent of respondents living near
government-owned cement industries agree that the industries employ local people, while
only 57 percent of them near FDI-based cement industries agree that local people are
employed by the cement industry (Figure 4). However, the local people account for less
than 10 percent of the total employment of the cement industry. Industries prefer to avoid
local people due to lack of skills and to avoid the problem of unionism.

25
Figure 4: Employment to local people
Source: Field Survey
4.6.3. Negative externalities and pollution
Ninety-two percent of respondents agree that they have suffered from negative
externality from the cement industry (Figure 5). The majority of respondents in all three
categories of industries have been suffered from negative externality. Air pollution is the
major negative externality faced by the residents followed by sound pollution and land
pollution. FDI-based industries, owing to their superior technology, generate
comparatively lower air pollution than locally owned and government-owned industries.

26
Figure 5: Negative externality and Pollution
Source: Field Survey
4.6.4. Contribution to infrastructure development
Ninety percent of respondents agree that the government-owned cement industry has
contributed to infrastructure development, while only 37 percent of respondents living
near the FDI-based cement industry agree on the same (Figure 6). Analyzing the overall
scenario, 61 percent of total respondents have agreed that the cement industry has
contributed to infrastructure development.
The majority of the cement industries have contributed to building roads. About 78
percent of total respondents reveal that the cement industry has built or assisted in road
maintenance (Figure 6). Further,- about 19 percent of respondents living near FDI-based
and Government-owned cement industries agree that the industry has made contributions
in building schools in their locality. However, the government-owned cement industries
are found more active in infrastructure development.

27
Figure 6: Contribution to infrastructure development by the cement industry
Source: Field Survey
4.6.5. Impact on land prices
Forty-seven percent of respondents agree that the cement industry has a positive impact
on land prices (Figure 7). The majority of the respondents living near the government-
owned cement industry has responded that the cement industry does not have a positive
impact on land prices. However, 57 percent and 70 percent of respondents near the FDI-
based and locally owned cement industry, respectively, believe that the cement industry
has led to a hike in land prices. Quantitatively, land prices have increased by almost 433
percent near the FDI-based cement industry followed by a locally-owned cement industry
(by 359 percent), and government-owned industry (by 100 percent). However, the hike in
land price results only in the front part of the industry, while the land located behind the
industry has lost its value due to pollution generated by the industry.

28
Further, the direction of the wind has also affected the land price. Residents located west
of the factory suffered much in the area with the dominance of easterlies; as a result, land
prices have dropped on the west side of the industry.
Figure 7: Impact on Land Prices
Source: Field Survey
4.7. Facilities to Employees
For analysis of employee facility, the study considers salary to employees, working
hours, benefits others than salary, and quality of work life.
4.7.1. Employment status
Male employees have dominated the cement industry. Permanent employees are
dominant in all three categories of cement industry. Except in government-owned
industries, all women employees are permanent employees. Locally owned cement
industries have a large number of employees working under contract (Figure 8).

29
Figure 8: Employment status
Source: Field Survey
4.7.2. Working hours
Seventy percent of employees work for 8 hours while 20 percent work for more than 8
hours (Figure 9). Interestingly, 100 percent of respondents working in the FDI-based
cement industry work for 8 hours, while 40 percent and 25 percent of employees working
in locally owned and government-owned cement industry work for more than 8 hours
respectively. FDI-based cement industries seem to be strict in following working hours.
Figure 9: Working hours
Source: Field Survey

30
4.7.3. Salary earned by employees
Forty-five percent of employees earn more than Rs 40,000 per month (Figure 10). About
half of employees working in FDI-based and government-owned cement industries earn
more than Rs. 40000 salary a month. The FDI-based industry seems better as employees
earn a higher salary and industry follows strict working hours, that is, 8 hours per day.
Figure 10: Salary earned by employees
Source: Field Survey
4.7.4. Benefits other than salary
Seventy percent of respondents receive some sort of benefits other than salary (Figure
11). All respondents working in the FDI-based cement industry get benefits other than
salary, while 60 percent and 50 percent of respondents working in locally owned and
government-owned employees get benefits other than salary respectively. About 66
percent of employees working in a locally-owned cement industry only get bonuses while
50 percent of employees working in government-owned cement industry get a bonus,
provident fund, and insurance. Interestingly, about 66 percent of employees working in
FDI-based cement industries receive a bonus, provident fund, insurance, and other
benefits. Thus, FDI-based cement industries care more about benefits other than salary in
comparison to domestic industries.

31
Figure 11: Benefits other than salary
Source: Field Survey
4.7.5. Quality of work-life
Quality of work-life has been assessed through three variables, hygienic food, better
lighting, and compensation for industrial accidents. About 93 percent of employees agree
that the industry provides compensation for industrial accidents (Figure 12). Likewise, 57
and 62 percent agreed that the industry provides better lighting and hygienic food.
Government-owned industries provide better lighting and compensation for industrial
accidents, while locally owned industries provide hygiene food. The FDI-based industry
provides compensation for industrial accidents but focuses less on hygiene food and
lighting facilities.
Figure 12: Quality of work-life
Source: Field Survey

CHAPTER V: CONCLUSION AND RECOMMENDATIONS
5.1 Conclusion
In the last few years, the cement and clinker production in the country have been picking
up following a surge in demand from the post-earthquake reconstruction works. With
increase in domestic production, cement import has declined. However, new cement
industries have been established in FDI. This has created an optimistic scenario for the
country to move further in the path of self-sufficiency in cement production.
The study finds that the annual actual production is around half (7.49 million metric tons)
of the annual installed capacity (15 million metric tons) of the total cement industries in
operation with 9.05 million metric ton domestic consumption demand in 2018/19.
Around 1.56 million metric tons of cement was imported from India in that year. The
mega projects in Nepal often import cement from India due to issues of certification,
quality consistency and ability for bulk supply related to domestic cement suppliers.
The demand for cement is likely to increase in the coming years as large investment in
infrastructure is very much needed in the country. It is projected that the annual demand
for cement will increase to 25.88 million metric tons by 2024/25.
The FDI in cement industries in Nepal stands at Rs. 56.97 billion, while the total capital
investment of domestic cement industries stands at Rs. 122.33 billion as of 2018/19. At
present, there are 3 cement industries with FDI in operation while 2 are still under
construction. The 3 FDI-based cement industries constitute 20.31 percent of the total
installed capacity of the cement industry. Of the 55 cement industries in operation,
average daily production capacity of 3 FDI-based industries is 2783 tonnes while that of
2 government owned and 50 locally and privately owned industries is 820 tonnes and 622
tonnes respectively.
Based on the survey conducted during the study, FDI-based cement industries are found
to be more efficient and profitable than government owned or locally owned cement
industries. In order to produce 1 ton of cement, while the FDI-based cement industry uses
0.99 metric tons of limestone on average, the government-owned cement industry uses

33
1.45 metric tons. Similarly, the production cost to the sales ratio of the FDI-based cement
industry is about 46.63 percent compared to 48.95 percent and 82.18 percent of locally
owned and government owned cement industry. The economies of scale owing to larger
size and the superior technology of the FDI-based cement industries are the reasons
behind their higher efficiency.
The operation of large FDI-based cement manufacturers like Hongshi-Shivam cement
industry (with the daily production capacity of 6000 metric ton) which is also supplying
clinker to a large number of other cement industries has been helping significantly in
squeezing the gap between the domestic demand and the production of cement in the
country.
On the socio-economic front, it has become beneficial for the local people due to the
growth in business activities like hotels, restaurants, retailers, and access to the road
networks, schools, hospitals, vehicles near the cement factories. Government-owned
cement industries have even contributed to building schools, provided cement in
subsidized price to locals, and provided employment to locals. However, in the case of
land price, the land in forefront of the industry has recorded price hike while the land in
the back part of the industry has lost its value due to pollution generated from the
industries.
Most of the employees, especially working in FDI based cement industries, receive
benefits like bonus, provident fund and insurance besides salary. The majority of the
workers works for 8 hours and earn more than Rs 40000 per month in government owned
and FDI-based cement factories. Cement industries have employed the majority number
of male employees compared to female employees. Although cement industries have
created employment opportunities, only less than 10 percent of the total employment of
cement industries is from local people.
Further the cement industries’ operations have created hardships in the daily activities of
surrounding communities due to sound and air pollution. However, FDI-based industries,
owing to their superior technology, generate comparatively lower air pollution than
locally owned and government-owned industries.

34
5.2 Recommendations
Based on the interview with the stakeholders of cement industry, affected communities,
relevant authorities and findings of the study, following recommendations are made:
• The production capacity of domestic cement industries has been underutilized. The
government should introduce a favorable policy including provision of certification
for cement that would encourage its export in the adjoining states of India given that
the nearby states of India do not have limestone ore.
• Because of geographic reasons, constructing the certain sections of roads and
highways of Nepal using concrete instead of asphalt can be more cost effective in the
long run. Concrete roads are more water resistant and require low maintenance and it
increases the demand for cement
• The cement industries are established near the residence or the highway, so the
cement industries must be established far from residence and the highways.
Department of industry and the company registrar office must direct industries not to
establish near residential areas or near highways where industrial pollution can easily
reach out to the general public.
• The cement industry is one of the most pollution emitting industries. These industries
adversely affect the health and wellbeing of the surrounding communities. In India,
cement industries have invested in rural development, education initiatives, and non-
farm skill-based income generation program. In Nepal also, cement industries should
be mandated to invest in local development such as roads, schools, hospitals as part of
its corporate social responsibility.
• Government-owned cement industries have quality products. However, due to low
margin, dealers are reluctant to offer their product to customers. So, these industries
need to open their outlets to expand their business. Another option for government
owned cement industries is to introduce a strategic partner, and use updated
technology. These government-owned cement industries should be converted into
public limited company to enhance its managerial capacity.

35
• It is found that significant amount of debt is being raised by the FDI-based cement
industry from local banking sector. It is important to review the regulation regarding
the maximum permissible debt to equity ratio in FDI based cement industry.
• FDI helps in bringing new technology into the country and promotes the competition
forcing domestic industries to be more efficient. It is better to allow FDI in cement
industries only on condition that local investors also hold certain minimum percent
equity in such industries. This would help in the transfer of both technical and
managerial know-how from foreign investors to local stakeholders.

References
Afeni, T., & Adeogun, A. (2015). Communities - Company relation in limestone mining
region of SOuthwest Nigeria: The Ewekoro socio-economic view. International
Journal of Development and Economic Sustainability, 85-98.
Battelle. (2002). Towards a sustainable cement industry. Columbus: Battelle Memorial
Institute.
Benos, N. (2009). Fiscal policy and economic growth: Empirical evidence from EU
countries. University of Ioannina. .
Burange, L. G., & Yamini, S. (2009). Performance of the Indian Cement Industry: The
competitive landscape. Artha Vijnana, 209-242.
Busuyi, T. A., Frederick, C., & Fatai, A. (2008). Assessment of the socio-economic
impacts of quarrying and processing of limestone at Obajana. European Journal of
Social Sciences, 6(4), 56-71.
Cement Manufacturers’ Association. (2020). List of cement industries. Kathmandu
Chairman of Cement Manufacturer's Association. (2020). Status of cement industry in
Nepal. (NRB staff, Interviewer).
Concreatech. (2018). International Cement Review. New Delhi: Concreatech.
CW Research. (2016). Global cement demand to slide to 4 billion tons by 2050. .
Retrieved August 2, 2020, from https://www.cwgrp.com/cemweek-features/499423-
global-cement-demand-to-slide-to-4-billion-tons-by-2050
DOI. (2020a). Industry registered details. Retrieved from
https://www.doind.gov.np/images/iis/74_75_ind_reg_details.pdf
DOI. (2020b). FDI approval details. Retrieved from
https://www.doind.gov.np/images/iis/74-75_fdi_approval_details.pdf
Fischer, S. (1992). Macroeconomic Stability and Growth. Cuadernos de Economía,
29(87), 171-186.
Hongshi Shivam Cement Pvt Ltd & Nepal Investment Board. (2017). Project investment
agreement - Hongshi Shivam cement plant. Kathmandu: Nepal Investment Board.
HousingNepal. (2020). Price of OPC and PPC cement in Nepal cement industry

IBEF. (2018). Cement. Retrieved from https://www.ibef.org/download/cement-dec-
2018.pdf. India Brand Equity Foundation.
IBN. (n.d.). Honghi-Shivam secures financial closure. Retrieved from
https://www.ibn.gov.np/honghi-shivam-secures-financial-closure. Investment Board
of Nepal
IMF. (2019). World economic outlook. Washington DC: International Monetary Fund.
Knight, M., N., L., & D., V. (1993). Testing the neoclassical theory of economic growth:
A panel data approach. Staff Papers (International Monetary Fund), 40(3), 512-541.
Mihut, I. S., & Luţaş, M. (2014). Sustainable growth: recent trends across central and
eastern European economies. Annals of the University of Oradea, Economic Science
Series, 23(1), 175-186.
MoF. (2019). Economic survey. Kathmandu: Ministry of Finance.
MoF. (2020). Economic Survey. Kathmandu: Ministry of Finance.
MOICS. (2019). Detailed study of cement manufacturing industry. Kathmandu: Ministry
of Industry, Commerce, and Supplies.
NPC. (2019). National pride projects. Retrieved from
https://www.npc.gov.np/en/page/74/visualing_development/data/national_pride_proj
ects. National Planning Commission
NRB. (2019a). Current macroeconomic and financial situation. Kathmandu: Nepal
Rastra Bank.
NRB. (2019b). Economic Activity Report. Kathmandu: Nepal Rastra Bank.
TEPC. (2020). Import Export data bank. Retrieved from
http://www.efourcore.com.np/tepcdatabank/, Trade and Export Promotion Center
UNDP. (2013). Nepal braces for graduation from an LDC. Retrieved from
https://www.np.undp.org/content/nepal/en/home/operations/projects/poverty_reducti
on/snpc/nepal-braces-for-graduation-from-an-ldc.html. United Nations Development
Programme

Annex 1
Table 1A: Average annual price of OPC cement per bag
Cement Brand Price (Rs.) Cement Brand Price (Rs.)
Agni cement 753 Maruti cement 799
Ambe Cement 766 Nirman Cement 717
Ambuja Cement 743 Om cement 800
Arghakhanchi Cement 753 Pyuthan cement 785
Bishal Cements 740 Reliance cement 760
Buddha cement 760 Riddhi Siddhi cement 771
CG Cement 795 Sarbottam cement 796
Dobhan cement 755 Salimar cement 750
Ghorai cements 800 Shivam cement 800
Hetauda cement 886 Trisakti cement 710
HongshiShivam Cement 750 Udayapur cement 908
Jagadamba cement 773 United cement 783
Mangalam cement 720 Vijaya Cement 770
Source: HousingNepal, 2020

Annex 2
Result
Instrumental variables (2SLS) regression
Log of cement demand Coef. p-value [95% Conf Interval] Sig
Log of Real GVA of
construction (pakki)
2.575 0.00 2.052 3.099 ***
Dummy (1 for rise in
cement demand)
.285 0.00 .179 .391 ***
Constant -27.798 0.00 -38.017 -17.579 ***
*** p<.01, ** p<.05, * p<.1
Note: Log of population has been used as an instrumental variable. The two fundamental properties of
instrumental variable are: instrumental variable must be correlated with independent variable, and must not
be correlated with dependent variable. The population satisfies both requirements as population has a
positive impact on economic growth (Fischer, 1992; Knight, Loayza &Villanueva, 1993; Benos, 2009;
Mihut & Lutas, 2014), whereas it is not correlated with cement demand. CW research12
(2020) concluded
that in under-developed geographies cement demand is largely driven by investments in infrastructure.
Endogenity Test
Ho: variables are exogenous
Durbin (score) chi2(1) = 4.9935 (p = 0.0254)
Wu-Hausman F(1,1 = 768.638 (p = 0.0230)
Power of Instrument
Variable R-sq. Adjusted
R-sq.
Partial R-
sq.
F(1,2) Prob.
Log of Real GVA of
construction (pakki)
0.8691 0.7382 0.8607 12.35 0.07*
* p.<.1
Note: The endogeneity test confirms that log of real GVA is endogenous variable. Likewise, significant F-
statistics (12.35) signifies the model is free of problem of weak instrument.
12 CW Research. (2016). Global cement demand to slide to 4 billion tons by 2050. Retrieved from
https://www.cwgrp.com/cemweek-features/499423-global-cement-demand-to-slide-to-4-billion-tons-
by-2050

Annex 3
Questionnaire