development of the nepalese financial system: need for...
TRANSCRIPT

Development of the Nepalese Financial System: Nepal for the Formulation of a Master Plan 31
Development of the Nepalese Financial System: Need for the Formulation of a
Master Plan
Nephil Matangi Maskay, Ph.D.* and Satyendra Raj Subedi**
The paper examines the development of Nepalese financial system which is categorized into three different phases: the first phase is the pre-NRB period; the second phase starts with NRB Act of 1955, which is further disaggregated into two sub-periods at 1984, the start of domestic financial liberalization; and the third and ongoing phase starts after enactment of current NRB Act of 2002. After analyzing period aggregate data on the financial system, the paper concludes that despite significant financial deepening in the context of financial liberalization and integration with the external economy, there is still scope for geographically balanced financial development. For addressing these challenges in a comprehensive manner, the study proposes initiating the development of a Financial Sector Master Plan.
I. BACKGROUND
A healthy financial sector is essential to facilitate sustainable economic growth. Theoretically, the channel by which financial development supports economic growth is via enhancing financial intermediation, for example, moving funds from savers to investors in a cost-effective manner which motivates individuals towards more efficient resource allocation decisions .[Greenwood and Jovanovic (1989), Levine and Zervos (1998)]. In the literature, there are four channels by which financial development affects economic growth: (1) by improving the screening of funds-seeking investors and their subsequent monitoring, and thereby channeling the allocation of resources for its most profitable investments; (2) by encouraging the mobilization of savings by means of providing diverse instruments that match the differing preferences of savers; (3) by lowering the transaction, screening, and monitoring costs through economies of scale; and
* Director, Research Department, Nepal Rastra Bank ** Assistant Director, Research Department, Nepal Rastra Bank Remarks: We would like to acknowledge the valuable comments and suggestions from Keshav Prasad Acharya, Tula Raj Basyal, Bhubanesh Pant, Ramesh Kumar Pokharel, Danda Pani Poudel and Govinda Bahadur Thapa; but any error which fall out of the paper are the sole responsibility of the authors. Also, the views expressed in the paper by the authors are personal and in no way are to be construed as reflecting the stance of the Nepal Rastra Bank. Corresponding Author: Satyendra Raj Subedi, E-mail: [email protected]

ECONOMIC REVIEW 32
(4) by enhancing various options of risk and liquidity management. Each of these four financial functions influences savings and investment decisions of economic agents and ultimately results in higher economic growth. Does this theoretically important relationship between the financial sector and economic growth hold true for Nepal? There is no clear cut answer. Recent publications by Bhetuwal (2007) and Poudel (2006) find that financial development (FD) contributes positively to domestic economic growth. On the other hand, Shrestha (2005) did not find any significant relationship between economic growth and FD. A recent study by Nepal Rastra Bank suggests that domestic economic growth is found to be somewhat supported by FD; but, the effect is noticeable with a one-year lag, but not at a contemporaneous level (NRB, 2009). In this context of mixed results, the appropriate development of Nepalese financial sector is essential so that it can play a critical and positive role in the economic growth of the nation. The goal of this paper is to provide both an overview of the developments in the domestic financial system and a recommendation for reaping the maximum benefit from domestic FD. In this regard, the paper assesses the Nepalese FD system, provides some observation and analysis leading to recommendations on the next steps to be taken by policy makers. The paper is structured into five sections. In the next section, stylized facts are provided on the Nepalese financial system. This will be followed by some performance measurements of the domestic financial system. The fourth section provides some discussion and observation highlighting three issues, which is followed by a recommendation for initiating the formulation of a Financial Sector Master Plan (FSMP) with the last section providing summary and a concluding remark.
II. STYLIZED FACTS OF THE NEPALESE FINANCIAL SYSTEM
Definition of Financial System
There are many descriptions of the financial system. Despite these variations, there is a consensus on its basic function: to efficiently and effectively allocate resources. In this regard, there are three main actors: (1) banks and financial institutions; (2) insurance companies; and (3) capital markets. These three actors are not independent but are interdependent and given the present innovation of technology, the separating lines, at times, are blurred.1 For this paper, the domestic financial sector takes a narrow focus that is confined within the perspective of the Nepal Rastra Bank, given its longer history and the availability of data compared to others.
History of Domestic Financial Sector Development
The Nepalese financial system development has a very recent history, starting just from the early twentieth century. The full period, from initiation to the present, can be broken down into three distinct phases. The shifts in these phases are determined by different milestones: the first milestone is the establishment of the Nepal Rastra Bank 1 The World Trade Organization has classified Financial Services Sector into two sub-sectors: (1) Insurance and Insurance Related Services and (2) Banking and Other Financial Services.
Development of the Nepalese Financial System: Nepal for the Formulation of a Master Plan 33
(NRB), the Central Bank of Nepal, in 1956 - this determines the shift from the first to the second phase; similarly the second milestone is the promulgation of the current NRB Act 2002 - this determines the shift from the second phase to the ongoing third phase. The first phase: This phase corresponds with the initiation of formal domestic banking system in Nepal till the establishment of NRB in 1956. Nepal's formal financial system had a late start and began less than one and a half centuries ago. The establishment of Tejarath Adda in 1880 can be conceived as the beginning of the process of credit mobilization in Nepal. However, this institution, although formally established, was not allowed to take public deposit and provide credit to public – the fund had been provided by the government for credit to their staff and landlords only. Therefore, it was not a bank per se. Even the urban people in need of the financial support had to rely on Shahus (merchants) and landlords because of the limited activities of Tejarath Adda (Pant, 1964). It was only with the establishment of Nepal Bank Limited (NBL) in 1937 that the financial services were made available to the general public. In this regard, the establishment of NBL was the epoch-making since it signified commencement of formal banking system in Nepal. The second phase: This phase commences with the establishment of NRB in 1956 under the NRB Act 1955, and completes with the promulgation of the current NRB Act 2002. With the establishment of NRB in 1956, the process was made easier for establishment of banks and financial institutions in the country. However, this phase can be further subdivided into two sub-periods: The first sub-period (or second phase A), was a period of restriction where the Nepalese payment system was characterized as "predominantly a cash-economy" (NRB, 1965);2 but, this period took a different turn with the establishment of Nepal Arab Bank Limited as the first joint-venture bank in 1984, under the Government's liberalized policy. The first sub-period saw more directed role of NRB in terms of credit control (including directed credit programs) and control of different categories of interest rates. In this sub-period, three institutions of diverse nature were established under the full ownership of the Government of Nepal (GON). They were (i) Nepal Industrial Development Corporation (NIDC in 1959)3; (ii) Rastriya Banijya Bank (RBB in 1966)4; and (iii) Agriculture Development Bank, Nepal (in 1968)5. The second sub-period (or second phase B) witnessed greater financial liberalization that practically started from 1984 until the enactment of new NRB Act in 2002. This sub-period corresponds with the overall economic liberalization policy of GON after the nation underwent sustained balance of payment crisis in the early 1980s. This later sub-
2 Some comparative ratios of Nepal, UK and India demonstrate the level of financial development at that time. Nepal had 400,000 persons per bank branch while it was 4,000 and 70,000 for UK and India respectively. Additionally, the per capita deposit at that time in Nepal was Nrs. 8, or less than a dollar, compared to 367 dollars for UK and 9 dollars for India (NRB, 1961). 3 This was established under Nepal Industrial Development Cooperation Act, 1959 with the objectives of mobilizing capital to industrial sector and facilitating industrial development in private sector 4 This was established under Rastriya Banijya Bank Act, 1965 with the objective of providing banking services throughout Nepal and contributing to the socio economic development of the country 5 This was established under Agriculture Development Bank Act, 1967 with the objective of providing credit to agriculture sector throughout the country

ECONOMIC REVIEW 34
period saw major shifts in the policy measures such as: from a controlled to a deregulated framework of interest rate; from direct to indirect methods of monetary control, emphasizing open market operations as the main policy tool; and permitting market-determined exchange rate of the Nepalese currency against convertible currencies and full convertibility of the Nepalese currency in the current account (NRB, 1996). During this sub-period, Nepal Indosuez Bank (later named as Nepal Investment Bank) and Nepal Grindlays Bank (now Standard Chartered Bank Nepal) were established in 1986 and 1987 respectively as the second and third joint-venture banks. However, no fully owned domestic-funded banks were established during this period. The entry of other development banks, finance companies, micro-credit development banks, savings and credit cooperatives and Non-government organizations (NGOs) for limited banking transactions started after 1992 under three major acts namely Finance Company Act 1985, Company Act 1964 and Development Bank Act 1996. The third phase: The current NRB Act of 2002 marks the initiation of the currently undergoing third phase. This act replaced the NRB Act 1955 and allowed NRB to be more autonomous in exercising decisions relating to formulation of monetary and foreign exchange policy as well as monitoring and regulating banks and financial institutions across the nation. However, it was felt that the existing situation of multiple numbers of acts under banking and financial institution sector made the process of regulation and monitoring system very cumbersome. As a result and as a process of financial sector reform program (see Box 1 below for short background), all those diversified acts were grouped together under the 'Bank and Financial Institution Act (BAFIA), 2006.'6 This Act, also known as Umbrella Act, categorized all the banks and financial institutions under four heads on the basis responsibility differences: Group A as commercial bank; Group B as development bank; Group C as finance company; and Group D as micro-credit development banks. The other two forms of institutions, namely saving and credit cooperatives and Non-Government Organizations (NGOs), both allowed by NRB for limited banking transactions, are however not put in any of those groups and are being operated under specific directives and rules.
6 This Act was already being effective in the form of an ordinance from 2003
Development of the Nepalese Financial System: Nepal for the Formulation of a Master Plan 35
BOX 1: Short Background of the Most Recent Financial Sector Reform Program
There were prior episodes of financial sector reform which was initiated from 1984. The most recent program was motivated by the indication (from evaluation of both financial indicators and process) that the system was weak, vulnerable and risky up to recent past.7 Therefore, a reform strategy was initiated which was consistent with the joint report of World Bank and International Monetary Fund (IMF). As a result, Financial Sector Strategy Paper (FSSP) which was approved by cabinet on October 3, 2000 and announced publicly on November 22 of that year was developed with the technical assistance from the World Bank. FSSP, which is also known as the financial sector strategy statement of GON, had the goal of making the financial system well diversified, competitive, sound, and supportive to the attainment of development objectives of the economy. The strategy paper assigned an important and enhanced role, responsibility and accountability to the NRB which launched this program in two phases: Phase I as Financial Sector Technical Assistance Project (FSTAP); and Phase II as Financial Sector Restructuring Project (FSRP). The focus of this program is on: 1) reengineering of NRB (2) reform of two large ailing commercial banks namely RBB and NBL; and (3) support for capacity building in financial sector. These reform programs have resulted in a significant progress in terms of making regulatory and supervisory aspects more strengthened via implementation of different norms such as that of Basel core principle. Source: www.nrb.org.np Current Status: Presently, as of March 1, 2009, the number of banks and financial institutions (BFI) licensed by NRB are: 25 commercial banks under Group A; 60 development banks under Group B; 78 finance companies under Group C; and 13 micro-credit development banks under Group D. Similarly, there are 16 savings and credit co-operatives and 45 non-government organizations (NGOs), both being allowed by NRB for undertaking limited banking transactions. The historical development of the number of BFIs is summarized in Table 1 below.
7 The reports of Commercial Banks Problem Analysis and Strategy Study (CBPASS) which was initiated in FY 1989/90, had pointed out the above mentioned problems and also identified NBL and RBB. Accordingly in 1991 the government had initiated a re-capitalization plan[0] in view of strengthening and improving the performance of these banks (Dhungana, 2005). Amid the report of financial sector assessment program (FSAP) in 1999, which was jointly conducted by World Bank and IMF, it was realized that the indicators of the domestic financial sector had shown Nepalese financial system to be very weak, vulnerable and very risky – e.g. Nepal was only compliant to one core principle and largely compliant to 7 core principles and norms, out of 25 core principles and 30 norms of Basel Accord 1988 (quoted by Dhungana, 2005). With these backgrounds and supported by the reports from "Reconciliation Project" carried out by Nepalese auditors, a study of NBL and RBB was conducted in 2000 by KPMG. The report of this group also highlighted serious shortfalls in all aspects of their governance, management, and operations.
ECONOMIC REVIEW 36
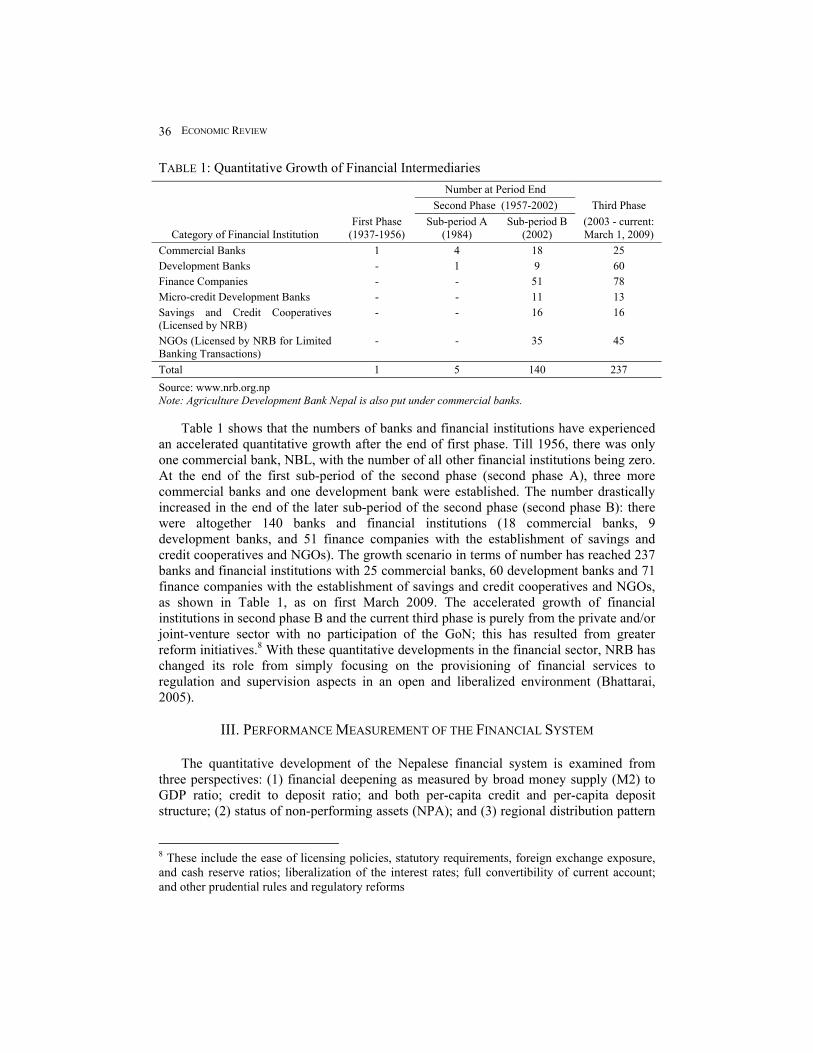
TABLE 1: Quantitative Growth of Financial Intermediaries
Number at Period End Second Phase (1957-2002) Third Phase
Category of Financial Institution
First Phase (1937-1956)
Sub-period A (1984)
Sub-period B (2002)
(2003 - current: March 1, 2009)
Commercial Banks 1 4 18 25 Development Banks - 1 9 60 Finance Companies - - 51 78 Micro-credit Development Banks - - 11 13 Savings and Credit Cooperatives (Licensed by NRB)
- - 16 16
NGOs (Licensed by NRB for Limited Banking Transactions)
- - 35 45
Total 1 5 140 237
Source: www.nrb.org.np Note: Agriculture Development Bank Nepal is also put under commercial banks. Table 1 shows that the numbers of banks and financial institutions have experienced an accelerated quantitative growth after the end of first phase. Till 1956, there was only one commercial bank, NBL, with the number of all other financial institutions being zero. At the end of the first sub-period of the second phase (second phase A), three more commercial banks and one development bank were established. The number drastically increased in the end of the later sub-period of the second phase (second phase B): there were altogether 140 banks and financial institutions (18 commercial banks, 9 development banks, and 51 finance companies with the establishment of savings and credit cooperatives and NGOs). The growth scenario in terms of number has reached 237 banks and financial institutions with 25 commercial banks, 60 development banks and 71 finance companies with the establishment of savings and credit cooperatives and NGOs, as shown in Table 1, as on first March 2009. The accelerated growth of financial institutions in second phase B and the current third phase is purely from the private and/or joint-venture sector with no participation of the GoN; this has resulted from greater reform initiatives.8 With these quantitative developments in the financial sector, NRB has changed its role from simply focusing on the provisioning of financial services to regulation and supervision aspects in an open and liberalized environment (Bhattarai, 2005).
III. PERFORMANCE MEASUREMENT OF THE FINANCIAL SYSTEM
The quantitative development of the Nepalese financial system is examined from three perspectives: (1) financial deepening as measured by broad money supply (M2) to GDP ratio; credit to deposit ratio; and both per-capita credit and per-capita deposit structure; (2) status of non-performing assets (NPA); and (3) regional distribution pattern
8 These include the ease of licensing policies, statutory requirements, foreign exchange exposure, and cash reserve ratios; liberalization of the interest rates; full convertibility of current account; and other prudential rules and regulatory reforms

Development of the Nepalese Financial System: Nepal for the Formulation of a Master Plan 37
of commercial bank branches. However, due to lack of time series data for financial institutions under group B, C, and D as defined by BAFIA Act, such analysis is carried out by the data from commercial banks (group A) only and hence do not capture the broader financial institutions - a major limitation of the study.
Financial Deepening The standard measures to assess the extent of financial deepening are ratios of: M2 to GDP; currency to M2; and credit to GDP. In Figure 1 below, the trends of these ratios are shown. The span of the ratios is taken from 1965 onward, due to non-availability of data and hence exclude phase I scenario and includes only a portion of phase II. FIGURE 1: Some Selected Proxies of Financial Deepening Indicators
0
10
20
30
40
50
60
70
1965 1970 1975 1980 1985 1990 1995 2000 2005
M2/GDP
currency/M2
private credit/GDP
Total Credit/GDP
Source: NRB and authors' calculations. Eyeballing the above-time series it is observed that all have distinct growth trends. This is more carefully explored in Table 2 below which demonstrates the summary statistics of these ratios during the different phases and sub-periods. Table 2 shows that from phase II to phase III, M2 to GDP ratio more than doubled; private sector credit to GDP ratio more than tripled; and total credit to GDP ratio increased by more than 250 percent. Similarly, the currency to M2 ratio had decreased from 36.4 percent in phase II to 27.6 percent in phase III.9 All these ratios have sharp diversion from the second period of phase II.
9 This figure may not give a true picture of the magnitude of currency in circulation due to the presence of Indian currency in Nepal.
ECONOMIC REVIEW 38
TABLE 2: Phase-wise Summary of Financial Deepening Indicator
M2/GDP Currency/M2
Private Credit/GDP
Total Credit/GDP
Phase I - - - - Phase II 26.4 36.4 11.0 13.2 Sub-period A 16.6 44.5 5.0 6.6 Sub-period B 36.7 27.6 17.3 19.9 Phase III 54.2 22.6 34.2 36.4
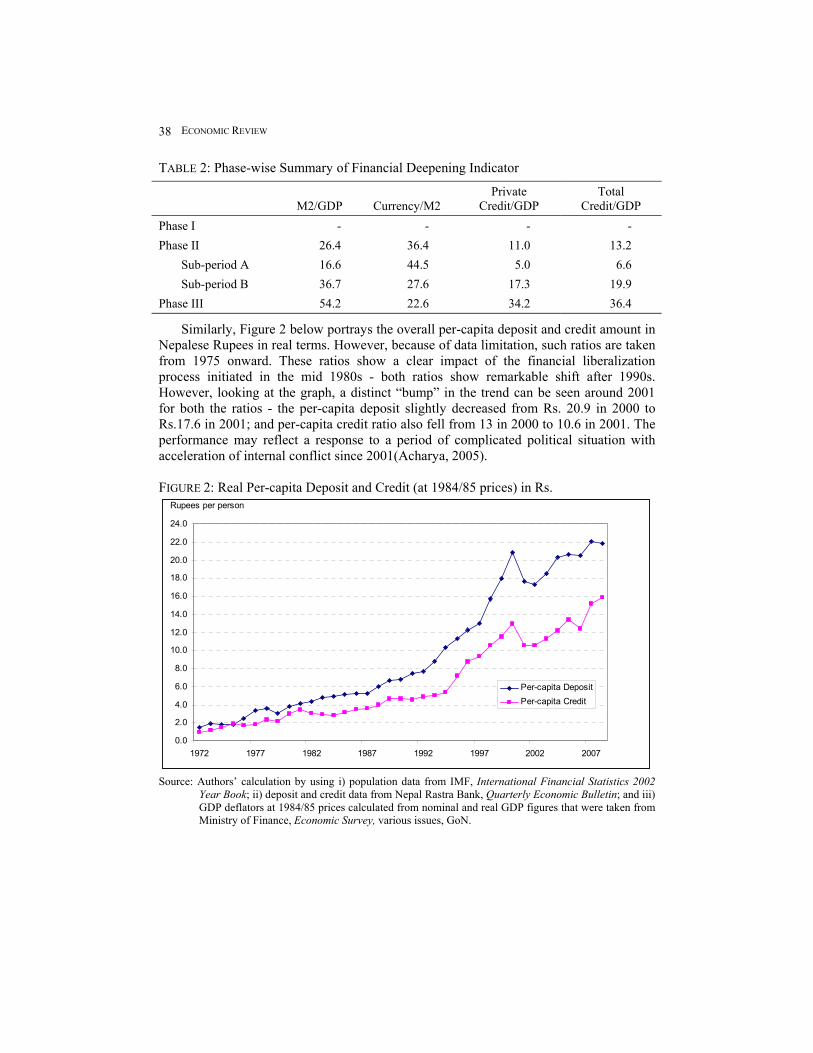
Similarly, Figure 2 below portrays the overall per-capita deposit and credit amount in Nepalese Rupees in real terms. However, because of data limitation, such ratios are taken from 1975 onward. These ratios show a clear impact of the financial liberalization process initiated in the mid 1980s - both ratios show remarkable shift after 1990s. However, looking at the graph, a distinct “bump” in the trend can be seen around 2001 for both the ratios - the per-capita deposit slightly decreased from Rs. 20.9 in 2000 to Rs.17.6 in 2001; and per-capita credit ratio also fell from 13 in 2000 to 10.6 in 2001. The performance may reflect a response to a period of complicated political situation with acceleration of internal conflict since 2001(Acharya, 2005). FIGURE 2: Real Per-capita Deposit and Credit (at 1984/85 prices) in Rs.
0.0
2.0
4.0
6.0
8.0
10.0
12.0
14.0
16.0
18.0
20.0
22.0
24.0
1972 1977 1982 1987 1992 1997 2002 2007
Per-capita DepositPer-capita Credit
Rupees per person
Source: Authors’ calculation by using i) population data from IMF, International Financial Statistics 2002 Year Book; ii) deposit and credit data from Nepal Rastra Bank, Quarterly Economic Bulletin; and iii) GDP deflators at 1984/85 prices calculated from nominal and real GDP figures that were taken from Ministry of Finance, Economic Survey, various issues, GoN.
Development of the Nepalese Financial System: Nepal for the Formulation of a Master Plan 39
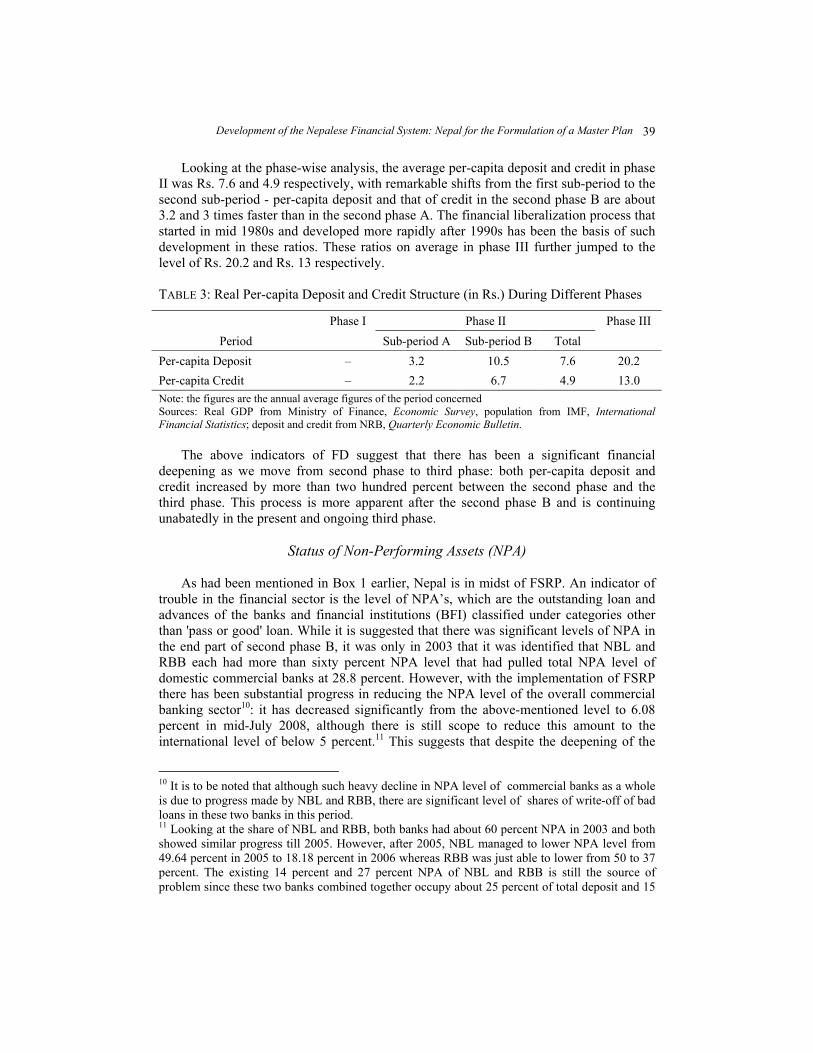
Looking at the phase-wise analysis, the average per-capita deposit and credit in phase II was Rs. 7.6 and 4.9 respectively, with remarkable shifts from the first sub-period to the second sub-period - per-capita deposit and that of credit in the second phase B are about 3.2 and 3 times faster than in the second phase A. The financial liberalization process that started in mid 1980s and developed more rapidly after 1990s has been the basis of such development in these ratios. These ratios on average in phase III further jumped to the level of Rs. 20.2 and Rs. 13 respectively. TABLE 3: Real Per-capita Deposit and Credit Structure (in Rs.) During Different Phases
Phase I Phase II Phase III Period Sub-period A Sub-period B Total
Per-capita Deposit – 3.2 10.5 7.6 20.2 Per-capita Credit – 2.2 6.7 4.9 13.0
Note: the figures are the annual average figures of the period concerned Sources: Real GDP from Ministry of Finance, Economic Survey, population from IMF, International Financial Statistics; deposit and credit from NRB, Quarterly Economic Bulletin.
The above indicators of FD suggest that there has been a significant financial deepening as we move from second phase to third phase: both per-capita deposit and credit increased by more than two hundred percent between the second phase and the third phase. This process is more apparent after the second phase B and is continuing unabatedly in the present and ongoing third phase.
Status of Non-Performing Assets (NPA)
As had been mentioned in Box 1 earlier, Nepal is in midst of FSRP. An indicator of trouble in the financial sector is the level of NPA’s, which are the outstanding loan and advances of the banks and financial institutions (BFI) classified under categories other than 'pass or good' loan. While it is suggested that there was significant levels of NPA in the end part of second phase B, it was only in 2003 that it was identified that NBL and RBB each had more than sixty percent NPA level that had pulled total NPA level of domestic commercial banks at 28.8 percent. However, with the implementation of FSRP there has been substantial progress in reducing the NPA level of the overall commercial banking sector10: it has decreased significantly from the above-mentioned level to 6.08 percent in mid-July 2008, although there is still scope to reduce this amount to the international level of below 5 percent.11 This suggests that despite the deepening of the
10 It is to be noted that although such heavy decline in NPA level of commercial banks as a whole is due to progress made by NBL and RBB, there are significant level of shares of write-off of bad loans in these two banks in this period. 11 Looking at the share of NBL and RBB, both banks had about 60 percent NPA in 2003 and both showed similar progress till 2005. However, after 2005, NBL managed to lower NPA level from 49.64 percent in 2005 to 18.18 percent in 2006 whereas RBB was just able to lower from 50 to 37 percent. The existing 14 percent and 27 percent NPA of NBL and RBB is still the source of problem since these two banks combined together occupy about 25 percent of total deposit and 15

ECONOMIC REVIEW 40
financial sector and greater participation of private sector in asset ownership, the existence of significant NPA levels prior to the FSRP program pointed to fragility in the domestic financial system. The reduction in NPA levels of NBL and RBB as well as the commercial banking sector as a whole can be taken as one of the success measures of FSRP process among others such as formulation of different acts, strengthening regulation and supervision of financial institutions at NRB, and movement towards compliance of Basel II Capital Accord, among others. TABLE 4: NPA as Percent of Total Gross Loan of Commercial Banks (mid-July)
Year NBL RBB Industry Average
2003 60.47 60.15 28.80
2004 53.74 57.64 22.80
2005 49.64 50.7 18.94
2006 18.18 34.83 14.22
2007 13.49 27.65 9.65
2008 8.95 21.65 6.08 Source: NRB. 2008. Banking and Financial Statistics, No. 51, mid-July, pp. 8, 20.
Regional Distribution Pattern of Commercial Bank Branches
This measures imbalances, of the growth of financial system among different developmental regions within the nation. It also gives an indicative picture of access to financial services via its concentration in a particular region. The proxy used in this regard is the region-wise population per bank branch. The lower the value, the higher is the expected gain from financial institutions to the public and may suggest stronger competition among the financial institutions.
percent of total credit facilities of commercial banks and their branches cover all 75 districts of the country
Development of the Nepalese Financial System: Nepal for the Formulation of a Master Plan 41
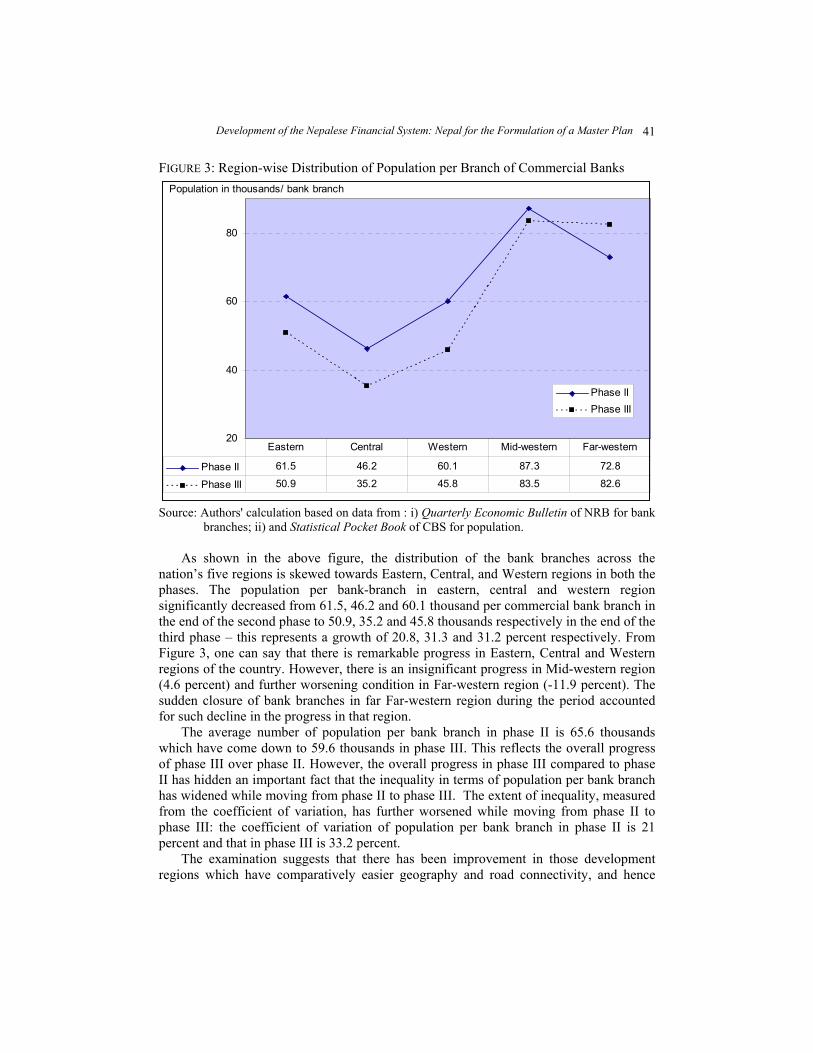
FIGURE 3: Region-wise Distribution of Population per Branch of Commercial Banks
20
40
60
80
Phase IIPhase III
Phase II 61.5 46.2 60.1 87.3 72.8
Phase III 50.9 35.2 45.8 83.5 82.6
Eastern Central Western Mid-western Far-western
Population in thousands/ bank branch
Source: Authors' calculation based on data from : i) Quarterly Economic Bulletin of NRB for bank
branches; ii) and Statistical Pocket Book of CBS for population. As shown in the above figure, the distribution of the bank branches across the nation’s five regions is skewed towards Eastern, Central, and Western regions in both the phases. The population per bank-branch in eastern, central and western region significantly decreased from 61.5, 46.2 and 60.1 thousand per commercial bank branch in the end of the second phase to 50.9, 35.2 and 45.8 thousands respectively in the end of the third phase – this represents a growth of 20.8, 31.3 and 31.2 percent respectively. From Figure 3, one can say that there is remarkable progress in Eastern, Central and Western regions of the country. However, there is an insignificant progress in Mid-western region (4.6 percent) and further worsening condition in Far-western region (-11.9 percent). The sudden closure of bank branches in far Far-western region during the period accounted for such decline in the progress in that region. The average number of population per bank branch in phase II is 65.6 thousands which have come down to 59.6 thousands in phase III. This reflects the overall progress of phase III over phase II. However, the overall progress in phase III compared to phase II has hidden an important fact that the inequality in terms of population per bank branch has widened while moving from phase II to phase III. The extent of inequality, measured from the coefficient of variation, has further worsened while moving from phase II to phase III: the coefficient of variation of population per bank branch in phase II is 21 percent and that in phase III is 33.2 percent. The examination suggests that there has been improvement in those development regions which have comparatively easier geography and road connectivity, and hence

ECONOMIC REVIEW 42
occupy more urban areas. This is consistent with the various studies such as Pradhan (2005) and World Bank (2008). From the above analysis, it is suggested that the growing number of commercial bank branches is not geographically balanced.
IV. DISCUSSION, OBSERVATIONS AND RECOMMENDATIONS
Discussion
The information provided by the previous sections suggests that there is steady numerical growth of the financial sector as measured by different indicators of commercial banks which is quite apparent in the second phase. However growing levels of NPA in the later part of the second phase B pointed to weakness in the domestic financial system which necessitated the initiation of the FSRP. With its introduction, the upward trend of FD continued in the third phase backed up by the reducing level of NPAs of the financial system. However, simply looking at FD does not convey a picture of the whole economy - it is important to examine FD, in this case proxied by M2/GDP and credit/GDP, to the measure of economic well being, proxied by per-capita income (PCI). These are shown in Figure 4 below where the indicators are normalized from 1984, the start of the second phase B, the period of financial liberalization.12 The normalization of the indicators has a benefit that the value of particular indicator at particular point of time can be easily compared with the value of normalizing year. FIGURE 4: Trends of Some Ratios
0
0.5
1
1.5
2
2.5
3
3.5
4
1984
1986
1988
1990
1992
1994
1996
1998
2000
2002
2004
2006
2008
Credit/GDPM2/GDPPCI
Source: Annex 1.
12 Although phase II started from 1956, data on PCI and other FD indicators are only available for initial period of phase II. Therefore, for ease of analysis, the examination is confined to the period after 1984 - the start of the period of phase II B.
Development of the Nepalese Financial System: Nepal for the Formulation of a Master Plan 43
Observations
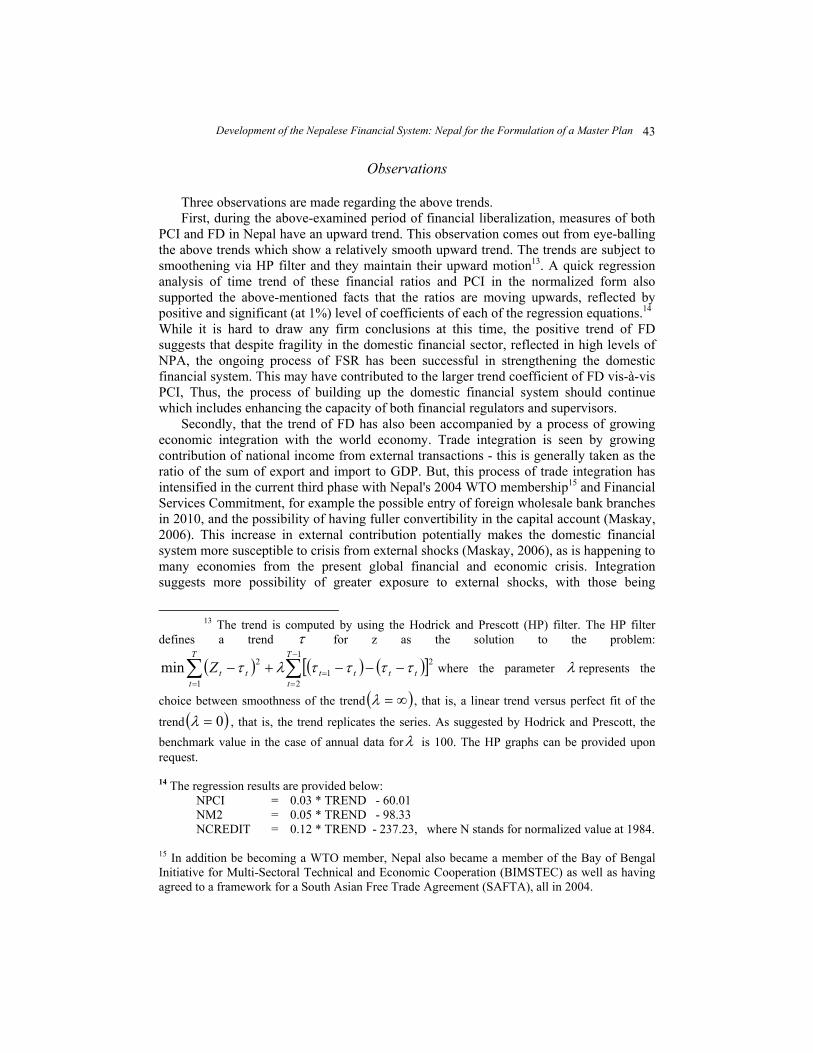
Three observations are made regarding the above trends. First, during the above-examined period of financial liberalization, measures of both PCI and FD in Nepal have an upward trend. This observation comes out from eye-balling the above trends which show a relatively smooth upward trend. The trends are subject to smoothening via HP filter and they maintain their upward motion13. A quick regression analysis of time trend of these financial ratios and PCI in the normalized form also supported the above-mentioned facts that the ratios are moving upwards, reflected by positive and significant (at 1%) level of coefficients of each of the regression equations.14 While it is hard to draw any firm conclusions at this time, the positive trend of FD suggests that despite fragility in the domestic financial sector, reflected in high levels of NPA, the ongoing process of FSR has been successful in strengthening the domestic financial system. This may have contributed to the larger trend coefficient of FD vis-à-vis PCI, Thus, the process of building up the domestic financial system should continue which includes enhancing the capacity of both financial regulators and supervisors. Secondly, that the trend of FD has also been accompanied by a process of growing economic integration with the world economy. Trade integration is seen by growing contribution of national income from external transactions - this is generally taken as the ratio of the sum of export and import to GDP. But, this process of trade integration has intensified in the current third phase with Nepal's 2004 WTO membership15 and Financial Services Commitment, for example the possible entry of foreign wholesale bank branches in 2010, and the possibility of having fuller convertibility in the capital account (Maskay, 2006). This increase in external contribution potentially makes the domestic financial system more susceptible to crisis from external shocks (Maskay, 2006), as is happening to many economies from the present global financial and economic crisis. Integration suggests more possibility of greater exposure to external shocks, with those being
13 The trend is computed by using the Hodrick and Prescott (HP) filter. The HP filter
defines a trend τ for z as the solution to the problem:
( ) ( ) ( )[ ]∑ ∑=
−
== −−−+−
T
t
T
tttttttZ
1
1
2
21
2min ττττλτ where the parameter λ represents the
choice between smoothness of the trend ( )∞=λ , that is, a linear trend versus perfect fit of the
trend ( )0=λ , that is, the trend replicates the series. As suggested by Hodrick and Prescott, the benchmark value in the case of annual data forλ is 100. The HP graphs can be provided upon request. 14 The regression results are provided below: NPCI = 0.03 * TREND - 60.01 NM2 = 0.05 * TREND - 98.33 NCREDIT = 0.12 * TREND - 237.23, where N stands for normalized value at 1984. 15 In addition be becoming a WTO member, Nepal also became a member of the Bay of Bengal Initiative for Multi-Sectoral Technical and Economic Cooperation (BIMSTEC) as well as having agreed to a framework for a South Asian Free Trade Agreement (SAFTA), all in 2004.
ECONOMIC REVIEW 44
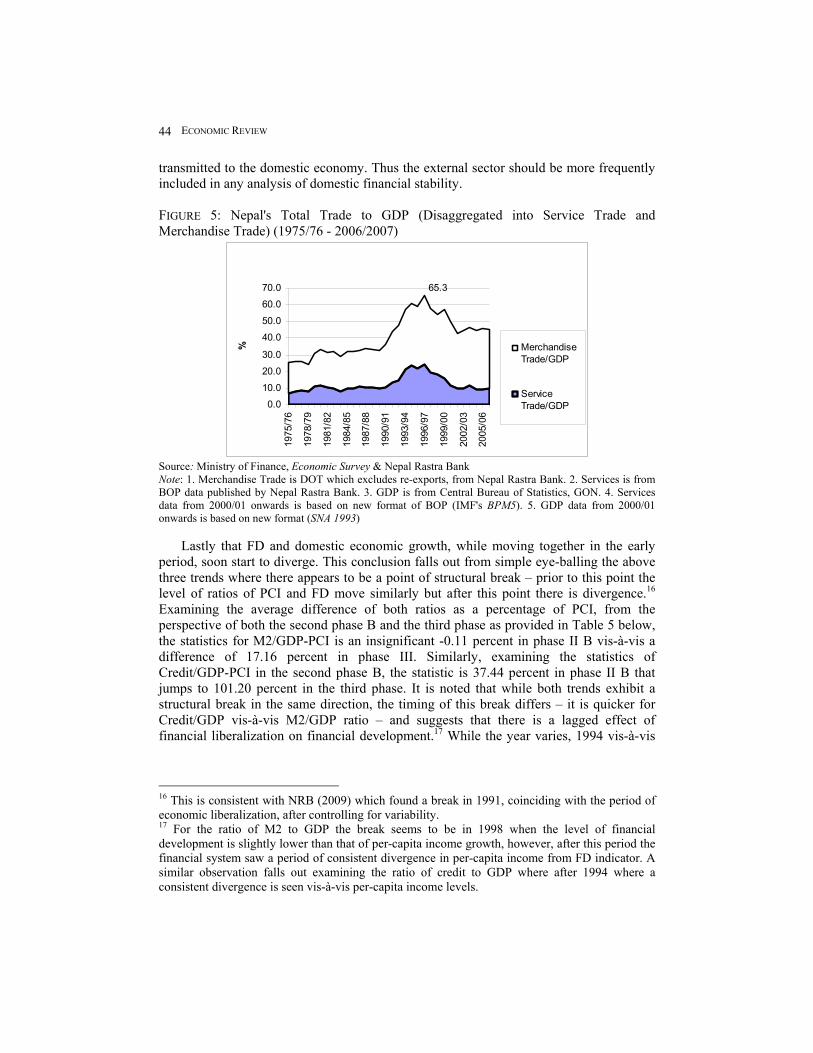
transmitted to the domestic economy. Thus the external sector should be more frequently included in any analysis of domestic financial stability. FIGURE 5: Nepal's Total Trade to GDP (Disaggregated into Service Trade and Merchandise Trade) (1975/76 - 2006/2007)
Trends in Nepal's External Statistics
65.3
0.0
10.0
20.0
30.0
40.0
50.0
60.0
70.019
75/7
6
1978
/79
1981
/82
1984
/85
1987
/88
1990
/91
1993
/94
1996
/97
1999
/00
2002
/03
2005
/06
% MerchandiseTrade/GDP
ServiceTrade/GDP
Source: Ministry of Finance, Economic Survey & Nepal Rastra Bank Note: 1. Merchandise Trade is DOT which excludes re-exports, from Nepal Rastra Bank. 2. Services is from BOP data published by Nepal Rastra Bank. 3. GDP is from Central Bureau of Statistics, GON. 4. Services data from 2000/01 onwards is based on new format of BOP (IMF's BPM5). 5. GDP data from 2000/01 onwards is based on new format (SNA 1993) Lastly that FD and domestic economic growth, while moving together in the early period, soon start to diverge. This conclusion falls out from simple eye-balling the above three trends where there appears to be a point of structural break – prior to this point the level of ratios of PCI and FD move similarly but after this point there is divergence.16 Examining the average difference of both ratios as a percentage of PCI, from the perspective of both the second phase B and the third phase as provided in Table 5 below, the statistics for M2/GDP-PCI is an insignificant -0.11 percent in phase II B vis-à-vis a difference of 17.16 percent in phase III. Similarly, examining the statistics of Credit/GDP-PCI in the second phase B, the statistic is 37.44 percent in phase II B that jumps to 101.20 percent in the third phase. It is noted that while both trends exhibit a structural break in the same direction, the timing of this break differs – it is quicker for Credit/GDP vis-à-vis M2/GDP ratio – and suggests that there is a lagged effect of financial liberalization on financial development.17 While the year varies, 1994 vis-à-vis
16 This is consistent with NRB (2009) which found a break in 1991, coinciding with the period of economic liberalization, after controlling for variability. 17 For the ratio of M2 to GDP the break seems to be in 1998 when the level of financial development is slightly lower than that of per-capita income growth, however, after this period the financial system saw a period of consistent divergence in per-capita income from FD indicator. A similar observation falls out examining the ratio of credit to GDP where after 1994 where a consistent divergence is seen vis-à-vis per-capita income levels.
Development of the Nepalese Financial System: Nepal for the Formulation of a Master Plan 45
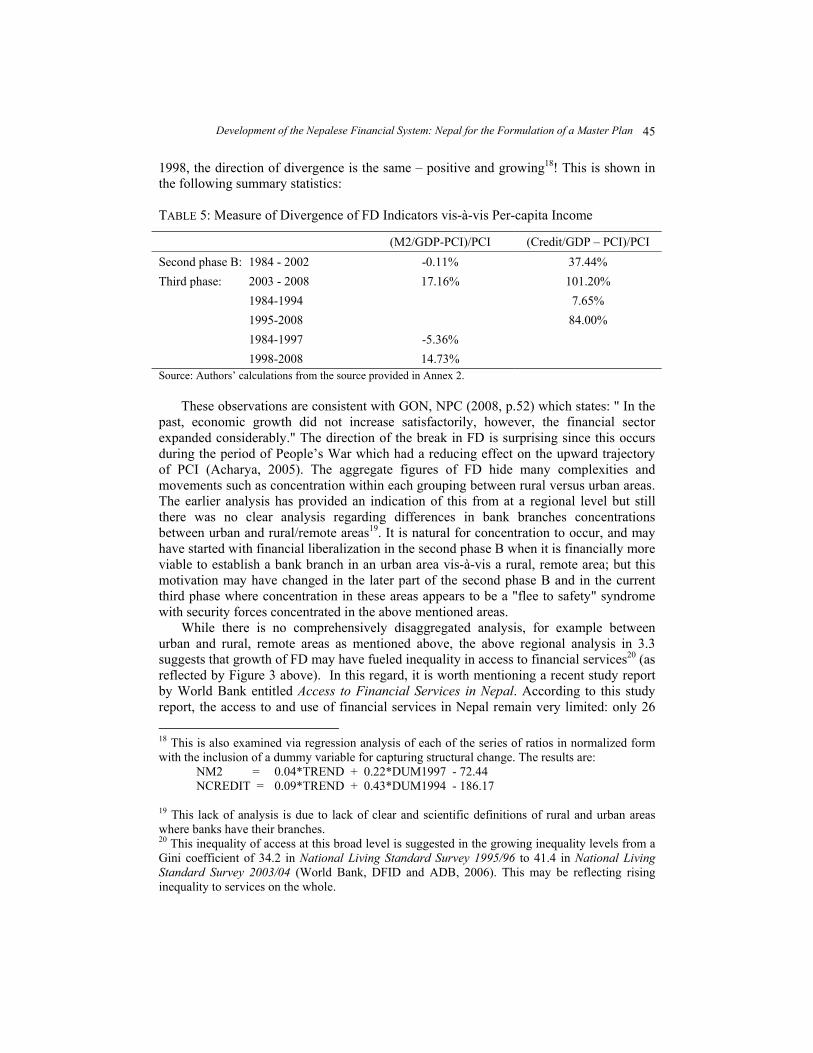
1998, the direction of divergence is the same – positive and growing18! This is shown in the following summary statistics: TABLE 5: Measure of Divergence of FD Indicators vis-à-vis Per-capita Income
(M2/GDP-PCI)/PCI (Credit/GDP – PCI)/PCI Second phase B: 1984 - 2002 -0.11% 37.44% Third phase: 2003 - 2008 17.16% 101.20% 1984-1994 7.65% 1995-2008 84.00% 1984-1997 -5.36% 1998-2008 14.73% Source: Authors’ calculations from the source provided in Annex 2. These observations are consistent with GON, NPC (2008, p.52) which states: " In the past, economic growth did not increase satisfactorily, however, the financial sector expanded considerably." The direction of the break in FD is surprising since this occurs during the period of People’s War which had a reducing effect on the upward trajectory of PCI (Acharya, 2005). The aggregate figures of FD hide many complexities and movements such as concentration within each grouping between rural versus urban areas. The earlier analysis has provided an indication of this from at a regional level but still there was no clear analysis regarding differences in bank branches concentrations between urban and rural/remote areas19. It is natural for concentration to occur, and may have started with financial liberalization in the second phase B when it is financially more viable to establish a bank branch in an urban area vis-à-vis a rural, remote area; but this motivation may have changed in the later part of the second phase B and in the current third phase where concentration in these areas appears to be a "flee to safety" syndrome with security forces concentrated in the above mentioned areas. While there is no comprehensively disaggregated analysis, for example between urban and rural, remote areas as mentioned above, the above regional analysis in 3.3 suggests that growth of FD may have fueled inequality in access to financial services20 (as reflected by Figure 3 above). In this regard, it is worth mentioning a recent study report by World Bank entitled Access to Financial Services in Nepal. According to this study report, the access to and use of financial services in Nepal remain very limited: only 26 18 This is also examined via regression analysis of each of the series of ratios in normalized form with the inclusion of a dummy variable for capturing structural change. The results are: NM2 = 0.04*TREND + 0.22*DUM1997 - 72.44 NCREDIT = 0.09*TREND + 0.43*DUM1994 - 186.17 19 This lack of analysis is due to lack of clear and scientific definitions of rural and urban areas where banks have their branches. 20 This inequality of access at this broad level is suggested in the growing inequality levels from a Gini coefficient of 34.2 in National Living Standard Survey 1995/96 to 41.4 in National Living Standard Survey 2003/04 (World Bank, DFID and ADB, 2006). This may be reflecting rising inequality to services on the whole.
ECONOMIC REVIEW 46
percent of households have a bank account, and 45 percent of these households prefer to save at home—while 53 percent prefer to borrow from the informal sector (World Bank, 2008). This study reiterated that "the banks have not been in easy access to rural or urban population at lower echelons of income distribution" (Acharya, 2003). Thus, the examination suggests that there is scope for geographically balanced FD growth.
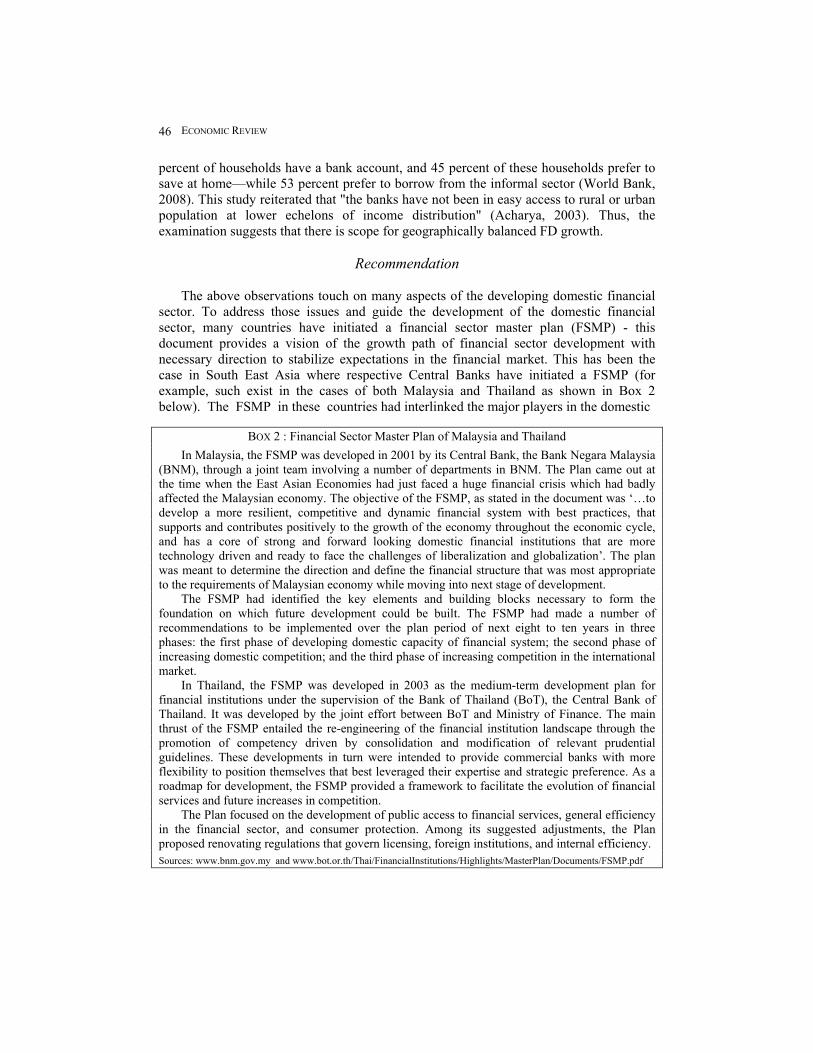
Recommendation The above observations touch on many aspects of the developing domestic financial sector. To address those issues and guide the development of the domestic financial sector, many countries have initiated a financial sector master plan (FSMP) - this document provides a vision of the growth path of financial sector development with necessary direction to stabilize expectations in the financial market. This has been the case in South East Asia where respective Central Banks have initiated a FSMP (for example, such exist in the cases of both Malaysia and Thailand as shown in Box 2 below). The FSMP in these countries had interlinked the major players in the domestic
BOX 2 : Financial Sector Master Plan of Malaysia and Thailand
In Malaysia, the FSMP was developed in 2001 by its Central Bank, the Bank Negara Malaysia (BNM), through a joint team involving a number of departments in BNM. The Plan came out at the time when the East Asian Economies had just faced a huge financial crisis which had badly affected the Malaysian economy. The objective of the FSMP, as stated in the document was ‘…to develop a more resilient, competitive and dynamic financial system with best practices, that supports and contributes positively to the growth of the economy throughout the economic cycle, and has a core of strong and forward looking domestic financial institutions that are more technology driven and ready to face the challenges of liberalization and globalization’. The plan was meant to determine the direction and define the financial structure that was most appropriate to the requirements of Malaysian economy while moving into next stage of development. The FSMP had identified the key elements and building blocks necessary to form the foundation on which future development could be built. The FSMP had made a number of recommendations to be implemented over the plan period of next eight to ten years in three phases: the first phase of developing domestic capacity of financial system; the second phase of increasing domestic competition; and the third phase of increasing competition in the international market. In Thailand, the FSMP was developed in 2003 as the medium-term development plan for financial institutions under the supervision of the Bank of Thailand (BoT), the Central Bank of Thailand. It was developed by the joint effort between BoT and Ministry of Finance. The main thrust of the FSMP entailed the re-engineering of the financial institution landscape through the promotion of competency driven by consolidation and modification of relevant prudential guidelines. These developments in turn were intended to provide commercial banks with more flexibility to position themselves that best leveraged their expertise and strategic preference. As a roadmap for development, the FSMP provided a framework to facilitate the evolution of financial services and future increases in competition. The Plan focused on the development of public access to financial services, general efficiency in the financial sector, and consumer protection. Among its suggested adjustments, the Plan proposed renovating regulations that govern licensing, foreign institutions, and internal efficiency.
Sources: www.bnm.gov.my and www.bot.or.th/Thai/FinancialInstitutions/Highlights/MasterPlan/Documents/FSMP.pdf
Development of the Nepalese Financial System: Nepal for the Formulation of a Master Plan 47
financial system - i.e. banks and financial institutions, insurance companies, and stock markets in a comprehensive manner - to enhance their contribution to economic growth in today's technology-driven dynamic environment; this would largely be through enhanced regulatory and supervisory efficiency and effectiveness. In consonance with other countries, it is important for such a guiding document to be produced in Nepal, to provide vision and direction to the developing domestic financial sector. In this connection, NRB's Strategic Action Plan 2006-2010 has also acknowledged the importance of having a FSMP for banking and financial sector under the part “Financial Sector Management” and has stated:
“The financial services industry has grown by leaps and bounds without a long-term financial sector master plan. NRB will take initiatives in this regard and formulate the Financial Sector Master Plan. In this context, it will review the implications of such financial sector master plans of the South East Asian Central Banks and formulate the appropriate plan in the Nepalese context with the collaboration of financial services industry and all other stakeholders” (NRB 2006, p.12).
Our recommendation is thus to develop a FSMP as highlighted above, tailored to the Nepal context by involving all related stakeholders in its development. The major components of this FSMP, among others, may include: (1) vision of the direction of the Nepalese FD; (2) enhancing its efficiency; (3) awareness and possible safeguards to external shocks; (4) geographically balanced growth of FD. An example of this process is the Project Approach used by Bank Negara Malaysia (BNM). BNM developed their FSMP through a joint team involving a number of departments.21 To facilitate consultations with the financial industry on specific issues, an Industry Advisory Group was set up comprising Chief Executive Officers and Managing Directors of selected institutions. A number of consultations and discussions were also held with relevant ministries and Government agencies, industry players and other key stakeholders on the specific recommendations in the FSMP. The approach was to determine the most viable options in achieving the strategic direction and objectives with an emphasis on an iterative, consultative and collaborative process. The process was pursued through a series of workshops/meetings/interviews with industry players on related issues.22 The same had occurred at Bank of Thailand (BOT) where a FSMP Committee was set up in February 2002; the committee comprised of representative from "government sector, regulatory agencies (i.e., the BOT, the Office of the Securities and Exchange Commission, and the Department of Insurance), financial sector, consumer groups, the general public and a number of recognized experts. The Committee was charged with the task of setting the vision and framework for the development of Thailand financial sector" (BOT website). Similarly for Nepal, such a process can be emulated. A high level committee can be set up of stakeholders - this can be limited to those directly under the NRB and thus under 21 An internal steering committee chaired by Dr. Zeti Akhtar Aziz (then Deputy Governor) and comprising the Assistant Governors and Directors of the relevant departments was set up to oversee the work of the team. 22 This involved analyzing industry trends through external and internal interviews, cross country comparison of alternative financial structures and liberalization paths, identifying the critical gaps in the financial system, defining key success factors in financial market development and formulating alternative end games for the Malaysian financial system.
ECONOMIC REVIEW 48
the Bank's leadership. Alternatively and consistent with the broader understanding of the financial sector, this can also include the capital market and insurance markets. As these do not fall within the purview of the NRB, it is suggested that perhaps a path such as followed by Zambia be taken. That is, the NRB, as the economic advisor to GON, can coordinate the drafting of the FSMP with the role of GON being to ensure its appropriate implementation.
V. SUMMARY AND A CLOSING REMARK
The Nepalese financial system witnessed a large jump in terms of number of financial institutions after financial liberalization in 1984; this has translated into an increasing trend of FD. The paper observes that (1) FD has taken place in an environment of growing integration with the global economy, which is making the domestic economy more prone to external shocks and (2) FD has not been geographically balanced, which is suggested to have resulted in growing inequality in terms of access to financial services. With these observations, the paper recommends that the process be initiated for developing a FSMP to address these challenges in an integrated and comprehensive manner. This framework is observed to be of much urgent considering the present global financial crisis. In the end, a closing remark is provided on the viability of this recommendation for initiating a FSMP, given the current circumstance where Nepal is moving into uncharted waters of state restructuring and a federal structure. We feel that the present situation provides a unique opportunity to implement this recommendation for providing guidance to FD in the New Nepal
REFERENCES
Acharya, Keshav. 2005. "An Assessment of Economic Cost of The Ongoing Armed Conflict in Nepal: An empirical examination of the period 1990 – 2005". The Telegraph October 26. Available at http://www.nepalnews.com.np/contents/englishweekly/telegraph/2005/oct/oct26/national.php
Acharya, Meena. 2003. "Development of the Financial System and its Impact on Poverty Alleviation in Nepal." Economic Review 15.
Bank Negara Malaysia. "Financial Sector Master Plan". Available at http://www.bnm.gov.my/index.php?ch=20
Bank of Thailand. "Financial Sector Master Plan". Available at http://www.bot.or.th/bothomepage/BankAtWork/FinInstitute/FISystemDevPlan/ENGVer
/pdffile/eng.pdf Bank of Zambia. 2004. "Implementation Structure of the Financial Sector Development
Plan" Available at: www.boz.zm/FSDP/FSDP_ImplementationStructure.pdf Bhattarai, Bijay Nath. 2005. "Nepal Rastra Bank: A Journey of Fifty Years". In NRB,
Fifty Years of Nepal Rastra Bank, Milestones. Kathmandu: NRB. Available at www.nrb.org.np
Development of the Nepalese Financial System: Nepal for the Formulation of a Master Plan 49
Bhetuwal, Khem Raj. 2007. "Financial liberalization and Financial Development in Nepal." Economic Review, 19.
Central Bureau of Statistics 2002. Statistical Pocket Book Nepal, 2002. Kathmandu: Central Bureau of Statistics (CBS)
Greenwood, J and B. Jovanovic. 1989. “Financial Development, Growth and the Distribution of Income”. NBER Working Paper Sseries No. 3189. Available at www.nber.org
Levine, Ross and Sara Zervos. 1998. “Stock Markets, Banks, and Economic Growth.” American Economic Review 88:537–558
Maskay, Nephil Matangi. 2006. “Capital Account Convertibility for Nepal: A Cautionary Thought” Arthic Sangalo. Nepal. (2063 Baisakh) 75 – 77.
Nepal Rastra Bank. 2009. "Financial Sector Development and Economic Growth in Nepal: FY 1975 - FY 2007." Forthcoming.
____. 2006. NRB Strategic Action Plan 2006-2010 (2006). Available at www.nrb.org.np ____. 2002. Nepal Rastra Bank Act, 2002. Kathmandu: NRB. ____ . 1996. "Forty Years of Nepal Rastra Bank 1956 - 1996". Kathmandu: NRB. ____. 1961. Report of the Board of Directors to His Majesty's Government for the Fiscal
Years: 1957-58, 1958-59, 1959-60 and 1960-61. ____. 1965. Report of the Board of Directors to His Majesty's Government for the Fiscal
Years; 1961-62, 1962-63, 1963-64 and 1964-65. Pant, Pushkar Nath. 1964. "The Dual Currency System in Nepal." Unpublished
Dissertation. Vanderbilt University. Paudel, Narayan Prasad. 2005. "Financial System and Economic Development." In
NRB, Nepal Rastra Bank in Fifty Years. Kathmandu: NRB. Available at: www.nrb.org.np
Pradhan, Krishna Kumar. 2005. "Development Finance." In NRB, Nepal Rastra Bank in Fifty Years. Kathmandu: NRB. NRB. Available at: www.nrb.org.np
Shrestha, Min Bahadur. 2005. "Financial Liberalization in Nepal." Ph.D. Dissertation submitted to University of Wollongon, Australia.
World Bank. 2008. "Access to Financial Services in Nepal." Available at:www.worldbank.org/Nepal
World Bank, DFID and ADB. 2006. Nepal Resilience Amidst Conflict: An Assessment of Poverty in Nepal, 1995–96 and 2003–04. Report No. 34834-NP. Kathmandu: The World Bank Nepal Office.
World Trade Organization. 1998. "Financial Services: Background Note by the Secretariat." S/C/W/72. December 2.

ECONOMIC REVIEW 50
ANNEX 1: Raw Data (in Rs. million, except for GDP deflator and population)
Year Currency M2 NGDP RGDP* Total Credit Total Deposit Population (in million)
GDP Deflator at 1984/85 Prices
1960 109.5 200.6 32.30 72.20 1961 142 235.6 45.60 75.30 1962 156.2 279.7 57.50 79.30 1963 161.7 304.1 59.30 100.70 1964 235.3 405.3 88.50 112.40 1965 296.3 489.7 5602 25052.4 107.00 128.90 22.40 1966 345.8 570.7 6909 26815.6 162.20 125.00 25.80 1967 368.6 641.4 6411 26394.5 146.80 181.80 24.30 1968 419.1 727.1 7172 26573.2 198.70 222.50 27.00 1969 470.2 857.2 7985 27753.6 195.60 319.50 28.80 1970 531.4 975.3 8768 28605.1 279.30 405.00 30.70 1971 576.1 1072.1 8938 28134.9 334.40 475.50 31.80 1972 601.2 1261.8 10369 29011.3 399.40 623.00 11.81 35.70 1973 694.7 1529.2 9969 28870.5 492.30 770.50 12.06 34.50 1974 878.6 1911 12808 30701.5 766.90 941.30 12.32 41.70 1975 916.5 2064.4 15966 31148.3 1194.50 1174.00 12.59 51.30 1976 963.5 2524 16589 32518.6 1145.20 1605.20 12.86 51.00 1977 1193.2 3223 16255 33499.8 1157.80 2146.80 13.14 48.50 1978 1351.9 3772.1 18421 34975.3 1647.30 2528.50 13.42 52.70 1979 1615.2 4511.4 24692 35804.3 2025.80 2920.90 13.71 69.00 1980 1799.3 5285.3 21886 34973.4 2626.90 3351.60 14.01 62.60 1981 2065.7 6307.7 25466 37890.7 3440.90 4160.20 15.02 67.20 1982 2436.7 7458 29037 39323.0 3469.60 4935.40 15.42 73.80 1983 2752 9222.4 31644 38152.0 3848.10 6308.40 15.83 82.90 1984 3273.4 10455.2 37004 41845.6 4124.40 7091.20 16.25 88.40 1985 3737.3 12296.6 44441 44440.0 5191.20 8560.10 16.69 100.00 1986 4842.9 15159 53215 46511.0 6910.00 10315.40 17.13 114.40 1987 5746.1 17498.2 61140 47428.0 8083.90 11900.50 17.56 128.90 1988 6374.6 21422.6 73170 50762.0 9964.10 14996.20 17.37 144.10 1989 7946.6 26605.1 85831 53518.0 13152.70 19008.60 17.74 160.40 1990 9718.2 31552.4 99702 56151.0 14782.10 21942.50 18.11 177.60 1991 11654.5 37712.5 116127 59767.0 16383.80 26804.90 18.49 194.30 1992 13639.7 45670.5 144933 62531.0 21348.80 33686.10 18.94 231.80 1993 16313 58322.5 165350 64584.0 24884.60 43777.90 19.39 256.00 1994 19659.7 69777.1 191596 69686.0 33311.50 52304.80 19.86 274.90 1995 22493.9 80984.7 209974 71685.0 45627.90 61164.10 20.34 292.90 1996 25046.4 92652.2 239388 75773.0 59644.80 71346.20 20.83 315.90 1997 27333.7 103720.6 269570 79388.0 68702.80 81660.60 21.33 339.60 1998 20893.2 126462.6 289798 82039.6 81251.00 102543.60 21.84 353.20 1999 34984.3 152800.2 330018 85764.2 96896.20 127062.90 22.37 384.80 2000 42143 186120.8 366251 90987.2 116027.40 154940.80 22.9 402.50 2001 48295.1 214454.2 425454 95418.3 133642.80 181674.90 23.15 445.90 2002 55658.3 223988.3 444052 95857.2 142848.90 184331.10 23.67 463.20 2003 56885.2 245911.2 473545 99164.3 161177.60 203296.90 24.2 477.50 2004 63218.9 277310.1 517993 104251.4 183383.50 233292.80 24.74 496.90 2005 68784.1 300440 566579 107347.7 211263.80 251008.00 25.3 527.80 2006 77780.4 346824.1 623083 110879.4 225902.70 290557.90 25.86 562.60 2007 83515.5 395320.6 696989 113651.4 271522.00 336792.70 26.44 604.30 2008 95731.7 459799.5 792130 120015.9 323854.60 389851.80 27.00 650.30
Sources: a) Quarterly Economic Bulletin for currency, M2, total deposit and total credit; b) Economic Survey for NGDP and RGDP; c) International Financial Statistics of IMF for population. * This is real GDP at factor cost (basic price now) at constant prices of 1984/85 and hence is the adjusted figure for various changes in base year in Economic survey data

Development of the Nepalese Financial System: Nepal for the Formulation of a Master Plan 51
ANNEX 2: Data of Some Ratios Before and After Normalization
Ratios Normalized Value Year Credit/GDP M2/GDP PCI Year Credit/GDP M2/GDP PCI 1984 11.146 28.254 2575.114 1984 1 1 1 1985 11.681 27.669 2662.672 1985 1.048 0.979 1.034 1986 12.985 28.486 2715.178 1986 1.165 1.008 1.054 1987 13.222 28.620 2700.911 1987 1.186 1.013 1.049 1988 13.618 29.278 2922.395 1988 1.222 1.036 1.135 1989 15.324 30.997 3016.798 1989 1.375 1.097 1.172 1990 14.826 31.647 3100.552 1990 1.330 1.120 1.204 1991 14.109 32.475 3232.396 1991 1.266 1.149 1.255 1992 14.730 31.511 3301.531 1992 1.322 1.115 1.282 1993 15.050 35.272 3330.789 1993 1.350 1.248 1.293 1994 17.386 36.419 3508.862 1994 1.560 1.289 1.363 1995 21.730 38.569 3524.336 1995 1.950 1.365 1.369 1996 24.916 38.704 3637.686 1996 2.235 1.370 1.413 1997 25.486 38.476 3721.894 1997 2.287 1.362 1.445 1998 28.037 43.638 3756.392 1998 2.515 1.544 1.459 1999 29.361 46.301 3833.894 1999 2.634 1.639 1.489 2000 31.680 50.818 3973.240 2000 2.842 1.799 1.543 2001 31.412 50.406 4121.741 2001 2.818 1.784 1.601 2002 32.169 50.442 4049.734 2002 2.886 1.785 1.573 2003 34.036 51.930 4097.698 2003 3.054 1.838 1.591 2004 35.403 53.535 4213.880 2004 3.176 1.895 1.636 2005 37.288 53.027 4242.992 2005 3.345 1.877 1.648 2006 36.256 55.663 4287.680 2006 3.253 1.970 1.665 2007 38.956 56.718 4298.464 2007 3.495 2.007 1.669 2008 40.884 58.046 4445.817 2008 3.668 2.054 1.726
Sources: As in Annex 1.