forecasting globalization: the use of international ... · globalization vienna paper hughes 5.doc...
TRANSCRIPT
Forecasting Globalization: The Use of International Futures (IFs)
Paper prepared for
Globalization as Evolutionary Process: Modeling, Simulating, and Forecasting Change,
edited by George Modelski, Tessaleno Devezas, and William R. Thompson
to be published by Routledge (Taylor and Francis)
Originally presented at a research seminar with the same name, International Institute for Applied Systems Analysis (IIASA),
Laxenburg, Vienna April 6-8, 2006
Seminar sponsored by the Calouste Gulbenkian Foundation
Barry B. Hughes
Graduate School of International Studies University of Denver
November, 2006

Globalization Vienna Paper Hughes 5.doc
Forecasting Globalization: The Use of International Futures (IFs)
Table of Contents
1. What is Globalization?................................................................................................ 1 2. What is International Futures (IFs)? ........................................................................... 3 3. Elements and Dynamics of Globalization................................................................... 6 4. Measuring Globalization in IFs ................................................................................ 10 5. Representing Globalization More Broadly with IFs................................................. 14 6. Forecasting Globalization ......................................................................................... 17 7. Conclusions on the Forecasting of Globalization ..................................................... 24 Bibliography ..................................................................................................................... 25

Globalization Vienna Paper Hughes 5.doc ii
Abstract
This paper explores the possibilities for the forecasting of globalization. It does so generally, but also with respect to a particular global forecasting system, namely the International Futures (IFs) modeling system.
The basic argument is that globalization can be conceptualized in terms of key positive and negative feedback loops that any long-term forecasting approach needs to consider explicitly. The variables driving those relationships are difficult but not impossible to operationalize and represent. The varying strengths of the dynamics over time, however, are unlikely to be represented very adequately in any current forecasting system.
In short the answer to the question “Can we forecast globalization processes?” is “yes” and “no.” We can represent them dynamically in ways that provide very important insights about them and facilitate thinking about alternative possible futures, but we probably cannot forecast the specifics of the processes with any real confidence.
Welcome to IFs
Globalization Vienna Paper Hughes 5.doc 1
1. What is Globalization? Can we forecast the unfolding of globalization? That is the question that this paper explores. As one of the most widely discussed phenomena of global change, understood by many to be the “meta-driver” of global change (e.g. NIC 2004), globalization certainly merits attempts to measure and foresee its future. It is impossible to forecast the unfolding of a phenomenon that cannot be conceptualized, defined and operationalized. Globalization comes close to being such a phenomenon, which is one of the reasons that this volume devotes considerable attention to defining it as an evolutionary process. A widely-used term that rose rapidly to great popularity, even to cliché status, in the second half of the twentieth century (Chanda 2002 declares it to have appeared in 1962), analysts have given it a multitude of meanings. Most simply and almost certainly too limited in conceptualization, many observers describe it simply as the expansion of global trade and financial flows. A more encompassing, still largely connectivist conceptualization sees it as the expansion also of human flows and interactions, as well as those of ideas and cultural elements. A large number of analysts, however, understand the process of expansion of flows to be more fundamentally transformative of human patterns (or stocks) and include the transformational elements in the conceptualization:
A process (or set of processes) which embodies a transformation in the spatial organization of social relations and transactions – assessed in terms of their extensity, intensity, velocity and impact – generating transcontinental or interregional flows and networks of activity, interaction, and the exercise of power. (Held, McGrew, Goldblatt, and Perraton 1999: 16).
Held and McGrew have elaborated the nature of that transformation at some length, largely summarized in this statement (which, however, emphasizes interactive flows rather than social or institutional stocks):
It is characterized by four types of change. First, it involves a stretching of social, political and economic activities across frontiers, regions and continents. Second, it is marked by the intensification, or the growing magnitude, of interconnectedness and flows of trade, investment, finance, migration, culture, etc. Third, it can be linked to a speeding up of global interactions and processes, as the development of world-wide systems of transport and communication increases the velocity of the diffusion of ideas, goods, information, capital and people. And, fourth, the growing extensity, intensity and velocity of global interactions can be associated with their deepening impact such that the effects of distant events can be highly significant elsewhere and specific local developments can come to have considerable global consequences. In this sense, the boundaries between domestic matters and global affairs become increasingly fluid. Globalization, in short, can be thought of as the widening, intensifying, speeding up, and growing impact of world-wide interconnectedness. (David Held and

Globalization Vienna Paper Hughes 5.doc 2
Anthony McGrew website on Global Transformations at http://www.polity.co.uk/global/globocp.htm)
Conceptualization without operationalization runs the risk of creating an apparent understanding that does not stand up to rigors of either measurement or forecasting. That is, different observers could potentially describe the same situation in quite different terms with respect to the extent/character of globalization or change in it over time. Operationalization does not absolutely require quantification, but certainly can benefit from it. When the topic turns to possible quantitative operationalizations of globalization only existing one leaps out: the A.T. Kearney/Foreign Policy Globalization Index (GI). Foreign Policy released the fifth annual results in their May/June 2005 issue.1 There is no truly competitive index of globalization. See articles by Kurdle (2004) and Lockwood (2004) for some evaluations of the GI. Although the GI has changed a little over time, its structure has remained relatively stable. It consists of four sub-indices: (1) political engagement (international organization memberships, UN peacekeeping, treaties ratified, and government transfers or aid); (2) technological connectivity (internet users, internet hosts, secure servers); (3) personal contact (travel and tourism, international telephone traffic, remittances and personal transfers); and (4) economic integration (trade and foreign direct investment; in past years this also included portfolio flows and income payments). Looking at those sub-indices, it is apparent that the last three primarily tap the increased flow or connectivity elements of globalization conceptualizations. Only the first sub-index seems primarily to tap the transformational or evolutionary elements, but certainly without the richness of the Held-McGrew definition. Still, even the flow elements, and especially technological connectivity, promise some help with operationalization of the concept. How then can we proceed with exploration of the potential for forecasting globalization? There are a number of approaches that could be taken, but that of this paper will be to examine the degree to which a specific quantitative forecasting project, namely the International Futures (IFs) simulation, might be able to help us forecast it. The next section provides some basic information about IFs. The following one returns to globalization and attempts to map the key dynamics of it. The succeeding two sections turn back to IFs and the manner in which it operationalizes and forecasts globalization. The final section will draw conclusions about the strengths and weaknesses of forecasting with IFs and the prospects for doing better.
1 The timing of annual release has become somewhat later over time. The two previous years were released in Jan/Feb 2003 and March/April 2004.

Globalization Vienna Paper Hughes 5.doc 3
2. What is International Futures (IFs)?
In this paper the International Futures (IFs) modeling system is being used as a test-bed for thinking about the forecasting of globalization processes. This section provides a very brief introduction to IFs. Somewhat more information will follow in the discussion of the ways in which IFs represents elements of globalization. Much more information is available in Hughes and Hillebrand (2006), on the project’s web site (which includes extensive documentation including Hughes with Hossain and Irfan 2004), and in the Help system of the model where even model equations and code are available. See http://www.du.edu/~bhughes/ifswelcome.html for the IFs web site and www.ifs.du.edu for both a web-based version of the model and a downloadable version of it.
International Futures (IFs) is a large-scale integrated global modeling system. The broad purpose of the International Futures (IFs) modeling system is to serve as a thinking tool for the analysis of near through long-term country-specific, regional, and global futures across multiple, interacting issue areas.2
More specifically, IFs is a thinking tool, allowing variable time horizons up to 100 years, for exploring human leverage with respect to pursuit of key goals in the face of great uncertainty. The goals around which IFs was designed fall generally into three categories: human development, social fairness and peace, and environmental sustainability (see Table 1).
Humans as Individuals Human Development/Freedom
Humans with each Other Security/Social Fairness
Humans with the Environment Sustainable Material Well-Being
Table 1. The Dimensions of Sustainable Human Development in IFs
2Current development of IFs is being funded primarily by Frederick S. Pardee, by the U.S. National Intelligence Council, and the United Nations Environment Programme in support of its Global Environment Outlook 4. Development of International Futures in 2000-2005 was funded in substantial part by the TERRA project of the European Commission, the Strategic Assessments Group of the U.S. Central Intelligence Agency (which supported work on the globalization index of IFs), and the European Union Center at the University of Michigan (supporting enhancement of the user interface) . None of these institutions bears any responsibility for the analysis presented here, but their support is greatly appreciated. Thanks also to the National Science Foundation, the Cleveland Foundation, the Exxon Education Foundation, the Kettering Family Foundation, the Pacific Cultural Foundation, the United States Institute of Peace, General Motors and the RAND Pardee Center for funding that contributed to earlier generations of IFs. Also of great importance, IFs owes much to the large number of students, instructors, and analysts who have used the system over many years and provided much appreciated advice for enhancement (some are identified in the Help system). The project also owes great appreciation to Anwar Hossain, Mohammod Irfan, and José Solórzano for data, modelling, and programming support within the most recent model generation, as well as to earlier student participants in the project (see again the Help system, as recently revised by Jonathan Moyer).

Globalization Vienna Paper Hughes 5.doc 4
IFs is heavily data-based and also deeply rooted in theory. It represents major agent-classes (households, governments, firms) interacting in a variety of global structures (demographic, economic, social, and environmental). The system draws upon standard approaches to modeling specific issue areas whenever possible, extending those as necessary and integrating them across issue areas.
The menu-drive interface of the International Futures software system allows display of results from the base case and from alternative scenarios over time horizons from 2000 up to 2100. It provides tables, standard graphical formats, and a basic Geographic Information System (GIS) or mapping capability. It also provides specialized display formats for age-cohort demographic structures and social accounting matrices.
The system facilitates scenario development and policy analysis via a scenario-tree that simplifies changes in framing assumptions and agent-class interventions. Scenarios can be saved for development and refinement over time. Standard framing scenarios, such as those from the United Nations Environment Programme’s Global Environmental Outlook 4, are available (UNEP forthcoming; see UNEP 2002 for earlier representation).
The modeling system also provides access to an extensive database for longitudinal and cross-sectional analysis. Insofar as possible, data represent 182 countries since 1960. In addition to providing a basis for developing formulations within the model, the database facilitates comparison of data with “historic forecasts” over the 1960-2000 period, which also allows assessment of model credibility (for more general discussion of issues of verification, validation, and accreditation, see Hughes 2006).
A number of assumptions underlie the development of IFs. First, issues touching human development systems are growing in scope and scale as human interaction and human impact on the broader environment grow. This does not mean the issues are necessarily becoming more threatening or fundamentally insurmountable than in past eras. But it does mean that attention to the issues must have a global perspective, as well as local and regional ones.
Second, goals and priorities for human systems are becoming clearer and are more frequently and consistently enunciated. For instance, the UN Millennium Summit and the 2002 conference in Johannesburg (UNDP 2003) set specific Millennium Development Goals (MDGs) for 2015 that include many focusing on the human condition. Such goals increasingly guide a sense of collective human opportunity and responsibility. Also, our ability to measure the human condition relative to these and other goals has improved enormously in recent years with advances in data and measurement.
Third, understanding of the dynamics of human systems is growing rapidly. As discussed later, IFs development has roots that go back to the 1970s. Understandings of the systems included in the IFs model are remarkably more sophisticated now than they were then.

Globalization Vienna Paper Hughes 5.doc 5
Fourth, and derivatively, the domain of human choice and action is broadening. The reason for the creation of IFs is to help in thinking about such intervention and its consequences.

Globalization Vienna Paper Hughes 5.doc 6
3. Elements and Dynamics of Globalization As discussed in Section 1, forecasting of a phenomenon requires conceptualization of it. Forecasting also involves, of course, understanding the dynamics underlying it. Elaborating the dynamics of globalization is an on-going scholarly enterprise that is unlikely to ever reach any real consensus. For instance, the three volume series of Manuel Castells, particularly the first on the Rise of the Network Society (2000), are all part of that large, collective scholarly project. This brief paper will, therefore, not pretend to be representing the dynamics of globalization in a manner that would likely satisfy a wide range of those who are elaborating these. It will, however, attempt to present a schematic of some key aspects of the dynamics that may be quite useful. To do so, it discusses some core positive feedback loops that generally characterize most discussions of globalization. It will then outline some important negative feedback loops that operate around those central positive dynamics and that can periodically disrupt the long-term growth of globalization. Figure 1 shows important positive loops in the globalization process. Almost all observers point to the importance of ongoing technological progress as a key driver. In particular, transportation and communication technologies inherently facilitate the wide variety of flows that characterize globalization. Historically, the development of new types of shipping or the opening of new trade routes have often marked new waves in the process (Devezas and Modelski 2005; Rasler and Thompson 1994; Modelski and Thompson 1996). Technological advance and existing knowledge feed on themselves to create one of the dominant feedback loops driving globalization.
Figure 1. Positive Feedback Processes that Drive Globalization Dynamics

Globalization Vienna Paper Hughes 5.doc 7
Technologies other than transportation and communication have obviously been very important. Many analysts like those cited above have emphasized technologies associated with warfare. Those, too, have tended over time to extend their geographic reach and globally integrating character. A second positive loop is via economic advance with associated expansion of assorted flows. That also tends (ceteris paribus) to accelerate technological advance. For instance, the developments in information and communication technology (ICT) late in the twentieth century have been argued by many to be setting the foundations for a New Economy with faster productivity growth and a more global character; the web’s expansion throughout the economy is, in turn, supporting scientific and technological advance. A third positive loop flows through population growth. Julian Simon (1981) argued that population is The Ultimate Resource. That may or may not be true, but population growth has also facilitated technological advance. The final positive loop portrayed is via socio-political transformation. Over time the physical extent of human political units has expanded (even if historically very large empires often organized some significant populations) and some significant aspects of governance have become global. A wide range of global regimes has emerged. Positive feedback loops produce exponential growth patterns. Globalization has often been associated with such growth. Chanda traces the globalization process and exponential growth back to the spread of humans around the world and then their gradual increase in connectivity:
The exponential growth in the exchange of goods, ideas, institutions and people that we see today is part of a long-term historical trend. Over the course of human history, the desire for something better and greater has motivated people to move themselves, their goods, and their ideas around the world. (Chanda 2002)
Yet even if globalization has been a very long-term process with generally exponential character, and some may debate that, no one can fail to recognize that it has been subject to wave-like patterns. Most recently, the belle époque (roughly 1890-1914) was a cyclical high point in terms of global flows (Arrighi 1999). Some argue that flow levels (often measured in that period across a small number of states or empires, to the detriment of objective longitudinal comparison) were not surpassed until late in the twentieth century. More generally, broad-sweep historians, world systems theorists and long-wave theorists regularly map waves in the process, even while often identifying a secular trend below those waves. Negative feedback loops produce oscillating patterns such as the waves of globalization. Figure 2 attempts to augment Figure 1, identifying some of the key negative loops.

Globalization Vienna Paper Hughes 5.doc 8
�
(QYLURQPHQWDO,PSDFW
,QHTXDOLW\�RI�,PSDFW�:LWKLQ�DQG�$FURVV�
6RFLHWLHV�
� �
(FRQRPLF$GYDQFH�ZLWK�
([SDQVLRQ�RI�)ORZV�LQ7UDGH��)LQDQFH��
+XPDQV��DQG�,GHDV�
&XOWXUDO'LVUXSWLRQ
�
� �
�
�
�
Figure 2. Negative Feedback Processes that Limit or Stop Globalization Dynamics Perhaps the loop most frequently emphasized is that around the inequality of impact of globalization processes. Such inequality lies near the heart of analysis around the rise and fall of global system leadership; shifts in technological leadership are a substantial part of the explanation for leadership transitions. Inequality within societies may also be the natural consequence of the rising phase of cycles, as some benefit more quickly than others from new technology and economic processes. A significant debate has raged within economics around the relative contributions of increased trade and changing technology to increased domestic inequality in many countries during recent decades (Rodrik 1997) A second negative loop involves culture or identity. Friedman (1999) most succinctly captured this tension with globalization processes in his association of the Lexus with globalization and the olive tree with identity. Huntington (1993) posited that the “clash of civilizations” unleashed by that tension could derail the globalization process by unleashing conflicts based in identity. The third negative loop involves the environment. Long-sweep historians, not least Toynbee (1972), have often explained the fall of civilizations and the collapse of the related connectivity and systemic transformations the civilizations as a result of the overexploitation of the environment. Contemporary environmentalists (Brown 2001; Rifkin 2002) have used that historical pattern as a warning about the dangers of currently rapid economic growth and global exploitation of the inputs and sinks of the environment. Not surprisingly, the critics of contemporary globalization processes almost invariably draw on one or more of the negative feedback loops for inspiration with respect to their critiques (International Forum on Globalization 2002). The “street people” of Seattle, Genoa and other locales, protesting possible progress on trade negotiations or meetings of the World Bank and IMF, intuitively pick up on all of the negative loops with signs and

Globalization Vienna Paper Hughes 5.doc 9
garb that often seem unintelligible to globalization supporters who inherently see the positive feedback loops as both fundamentally powerful and generally beneficial.
From Figures 1 and 2, it is not at all obvious what the future of globalization will be, although they and the discussion suggest a plausible generalization: globalization will continue to advance, but the changes associated with it will be painful to some and there will likely be continued waves around the advance. Only the negative feedback loop around the environment would appear potentially strong enough to indefinitely disrupt the process, because socio-political systems and cultures are with lags ultimately adaptive. Environmental damage of the most severe types, in contrast, can be irreversible. There are certainly many missing components in the above discussion with respect to the dynamics of globalization. It might be useful to float at least two additional thoughts. First, energy systems may have particular importance in the historic and future processes of globalization or its retrenchment. For instance, the transition from coal to oil and natural gas has been associated with the dramatic expansion of global trade in those commodities and with associated financial flow expansions. They have also given rise to many points of international political interaction with special focus on the Middle East. Would not a transition in the current century to much more decentralized and variable energy sources (a range of renewable forms) significantly alter if not remove this important pressure for a range of global flows? (Lovins et al. 2005 explore how rapidly such a new energy system could develop.) Second, and somewhat related, will the continued unfolding of the ICT revolution change patterns in important ways? It has been argued by many that the global system has in the last two centuries been transformed from one in which progress in well-being was tied to the land to one in which it has become tied to trade (Rosecrance 1986). Even in the second half of the twentieth century, major advances in globalization were linked to changes in trade such as those allowed by oil supertankers and large container ships (with intermodal transport links to land systems). The advance of ICT in early phases facilitates further trade expansion (for instance, by adding sophisticated logistics and allowing corporations to build complex and long value chains of production). Is there the possibility, however, that more advanced phases in the ICT wave will lead to the diffusion of a wide range of production technologies, perhaps across agricultural, energy, and industrial systems, facilitating localization instead of globalization (as in the Great Transition scenario of Raskin et al 2002)? Could the territory to trade transition be followed by a trade to terabyte transition? Again, the discussion here is highly incomplete, but it has attempted to provide a basis for both some qualitative thinking about the future of globalization and the more quantitative forecasting of it. The next two sections turn to the latter.

Globalization Vienna Paper Hughes 5.doc 10
4. Measuring Globalization in IFs The last section used the basic tool of systems dynamics, the feedback loop, to facilitate thinking about the dynamics of globalization. This section moves to forecasting using the International Futures (IFs) model. IFs is not a systems dynamic model, although like any useful long-term forecasting tool it does build upon the representation of positive and negative feedback processes. As described elsewhere, IFs also draws upon the standard accounting systems of its various constituent issue areas (such as cohort-component systems in population and social accounting systems in economics) and on statistical or econometric estimation of dominant relationships that generate its dynamics. This section will look at the operationalization or measurement of globalization in IFs. The next section will turn to the representation of globalization dynamics. It was noted earlier that the Globalization Index (GI) of A.T. Kearney /Foreign Policy consists of four sub-indices, which were listed with associated component measures. IFs has patterned its own index of globalization, in the variable named GLOBALIZ, after the GI. For a full explanation see Hughes (2005 May). The reader may find this section’s explanation of that index among the least enjoyable portions of this paper and is certainly welcome to skip directly to the next section, which begins to address the important model dynamics below the index. Nonetheless, this is an important discussion for full understanding of the strengths and weaknesses of IFs for forecasting globalization. The implementation of globalization (GLOBALIZ) in IFs proceeds in stages. First, personal contact (PERSON) is computed as a simple average of two submeasures: a telephone infrastructure measure that is built as the ratio of telephone infrastructure in a country relative to what would be expected at that level of GDP and a worker remittance measure that compares the ratio of net remittances (sent or received) to GDP with the global average for such remittances.
R
r
R
r
r
r
r
r
rr
rrr
GDP
XWORKREMITABS
GDP
XWORKREMITABS
WorkRemit
and
GDPPCPANALFUNC
INFRATELETeleRatio
where
WorkRemitTeleRatioPERSCON
)(
)(
)(
2

Globalization Vienna Paper Hughes 5.doc 11
Second, economic integration (ECONINTEG) is computed as a weighted average (FDI given twice the weight of trade following the GI measure) of trade and FDI measures. The trade measure is the sum of exports and imports over GDP (the typical measure of trade openness) relative to the global level of trade openness. The FDI measure is the sum of stocks of investment into and out of a country over GDP relative to the global level of such FDI connectedness.
R
r
R
rr
r
rr
r
R
r
R
rr
r
rr
r
rrr
GDP
XFDISTOUTXFDISTOCK
GDP
XFDISTOUTXFDISTOCK
InvComp
and
GDP
MRPAXRPA
GDP
MRPAXRPA
TradeComp
where
InvCompTradeCompECONINTEG
3
*2
Third, a measure of political engagement (PolEngage) is calculated from the sum of foreign aid expenditures or receipts as a portion of GDP relative to the global average. Although the GI presumably focuses on expenditures, as with worker remittances and FDI, it is reasonable to assume that receipts are a significant component of globalization also.
R
r
R
r
r
r
r
GDP
AIDABS
GDP
AIDABS
PolEngage
)(
)(
Fourth, the overall globalization measure is computed as a weighted average of political engagement (not shown in capital letters because it is not a variable in IFs that can be displayed), the electronic network infrastructure measure (explained in Chapter 3 of Hughes 2005 May), personal contact, and economic integration.

Globalization Vienna Paper Hughes 5.doc 12
4rrrr
r
ECONINTEGPERSCONINFRANETPolEngageGLOBALIZ
Before the four components are averaged in the above calculation, they are scaled from 0-100, from the lowest to the highest values for countries in IFs. The GI uses rankings rather than scaled values. IFs uses the scaled values because it preserves underlying interval-level information. It does the same with the GLOBALIZ measure itself, which runs from lowest (0) to highest (100) values for all countries and country groupings in IFs. Using this analog within IFs of the A.T. Kearney/Foreign Policy Globalization Index, Figure 3 shows the general pattern of globalization around the world as a function of GDP per capita, as of the beginning of the century.
Afghanis tan
Albania
Algeria Angola
Argentina
Armenia
Australia
Austria
Azerbaijan
Bahamas
Bahrain
Bangladesh Barbados
Belarus
Belgium
Belize
Benin
Bhutan
Boliv ia
Bosnia Botswana
Braz il
Brunei
Bulgaria
Burk ina Faso
Burundi
Cambodia
Cameroon
Canada
Cape Verde
Central AfR
Chad
Chile
China
Colombia
Comoros Congo, Democratic Republic of
Congo, Republic of
Costa Rica Cote Ivoire
Croatia
Cuba
Cyprus
Czech Republic
Denmark
Djibouti
DominicanRep
Ecuador
Egypt El Salvador Equa Guinea
Eritrea
Estonia
Ethiopia
Fiji
Finland
France
Gabon Gambia Georgia
Germany
Ghana
Greece
Grenada
Guatemala
Guinea
GuineaBiss
Guyana
Haiti
Honduras
Hong Kong
Hungary Iceland
India
Indonesia
Iran
Iraq
Ireland
Israel
Italy Jamaica
Japan
Jordan
Kazakhstan
Kenya
Korea North
Korea South
Kuwait
Kyrgyz
Laos
Latvia
Lebanon Lesotho Liberia
Libya
Lithuania
Luxembourg
Macedonia
Madagascar Malawi Malays ia
Maldives Mali
Malta
Mauritania Mauritius
Mexico
Micronesia, Fed. Sts .
Moldova
Mongolia Morocco
Mozambique
Myanmar
Namibia Nepal
Netherlands
New Zealand
Nicaragua
Niger Nigeria
Norway
Oman Pakis tan
Palestine
Panama
Papua NG
Paraguay Peru
Philippines
Poland Portugal
Puerto Rico Qatar
Romania Russ ia
Rwanda
Samoa Sao Tome and Princ ipe
Saudi Arabia
Senegal
Serbia Montenegro
SierraLeo
Singapore
Slovak Rep Slovenia
Solomon Is lands
Somalia
South Africa
Spain Sri Lanka
St. Luc ia
St. Vincent and the Grenadines
Sudan
Suriname
Swaziland
Sweden
Switzerland
Syria
Taiwan
Tajik is tan
Tanzania
Thailand
Timor
Togo
Tonga Trinidad
Tunis ia
Turkey
Turkmenistan UAE
Uganda
Ukraine
Unitd Kingdm
Uruguay
USA
Uzbekis tan
Vanuatu
Venezuela
Vietnam Yemen
Zambia Zimbabwe
0
10
20
30
40
50
60
70
80
90
100
0 5 10 15 20 25 30 35 40 45
Globalization Level in 2000Scaled from Lowest (0) to Highest (100)
Year = 2000
Glo
baliz
atio
n In
dex
(0-1
00)
GDP per Capita at Purchasing Power Parity (2000 Dollars)
Figure 3. Globalization (as Measured in IFs) as a Function of GDP per Capita There are some obvious similarities between the values in the above figure and the rankings of the GI. For instance, both place the Scandinavian countries and the Netherlands highly. But there are also some striking differences. For instance, the United States does not rank nearly as high in the figure above as it does in the annual GI tables. When one considers the component measures of the GLOBALIZ index, that is not surprising. The PolEngage measure of IFs includes only official developmental assistance as a portion of GDP and the US scores low on this; in the GI political engagement carries other components, including treaty memberships (although were it scaled by size the US would not necessarily be high ranking on that either). The Economic Integration (ECONINTEG) dimension of both GLOBALIZ and GI scales countries by GDP; trade is a relatively small portion of the GDP of large countries like the United States and in both IFs and the GI measures it would probably make sense to

Globalization Vienna Paper Hughes 5.doc 13
control in some way for size. And although FDI stocks of the US abroad and of other countries in the US are huge, when one controls for GDP, there are large numbers of countries at similar levels or higher. The same is true of personal connections when one controls for population size. It is quite possible that the use by GI of rankings rather than scaling and the restriction of the GI to developed countries give the US much higher total scores on the GI measure than it achieves on the IFs GLOBALIZE measure. Because there is a strong argument for not throwing away the information that one has in interval measures in order to substitute ordinal ones, the use by IFs of scaling has good basis. There are other surprises in Figure 3. Although there is some tendency for richer countries to show up at higher levels of the GLOBALIZ index than do poorer countries, it is not a particularly strong relationship (although the R-squared is a respectable 0.265). In fact, a very large number of developing countries cluster just below the middle of the GLOBALIZ scale. Although richer countries may be absolutely more significant on the global stage, when GDP and population size are controlled, developing countries are clearly very much influenced by and involved in globalization processes. The 2005 release of the GI calculation reported only on 62 countries (A.T. Kearney 2005). Because those included cover 96 percent of the global GDP and 85 percent of the world’s population, they are obviously the richest and largest of the 182 countries covered by IFs. Figure 3 shows that many of the other 120 countries in IFs are highly globalized, especially when the measures tap penetration by the outside world (aid and FDI receipt, remittances from workers abroad, etc) as well as penetration of the outside world. A striking case is China, which ranked 54 of 62 on the AT Kearney/Foreign Policy GI measure in 2005. As Figure 3 shows, when we control for GDP and population size, China appears below the vast majority of not just richer, but also of smaller, poorer countries on the GLOBALIZ measure. A measure like GLOBALIZ is, however, only the tip of the forecasting iceberg. It is the representation of dynamics beneath the measure that determine the ability for the measure to be useful in forecasting. The next section addresses the representation of dynamics.
Globalization Vienna Paper Hughes 5.doc 14
5. Representing Globalization More Broadly with IFs
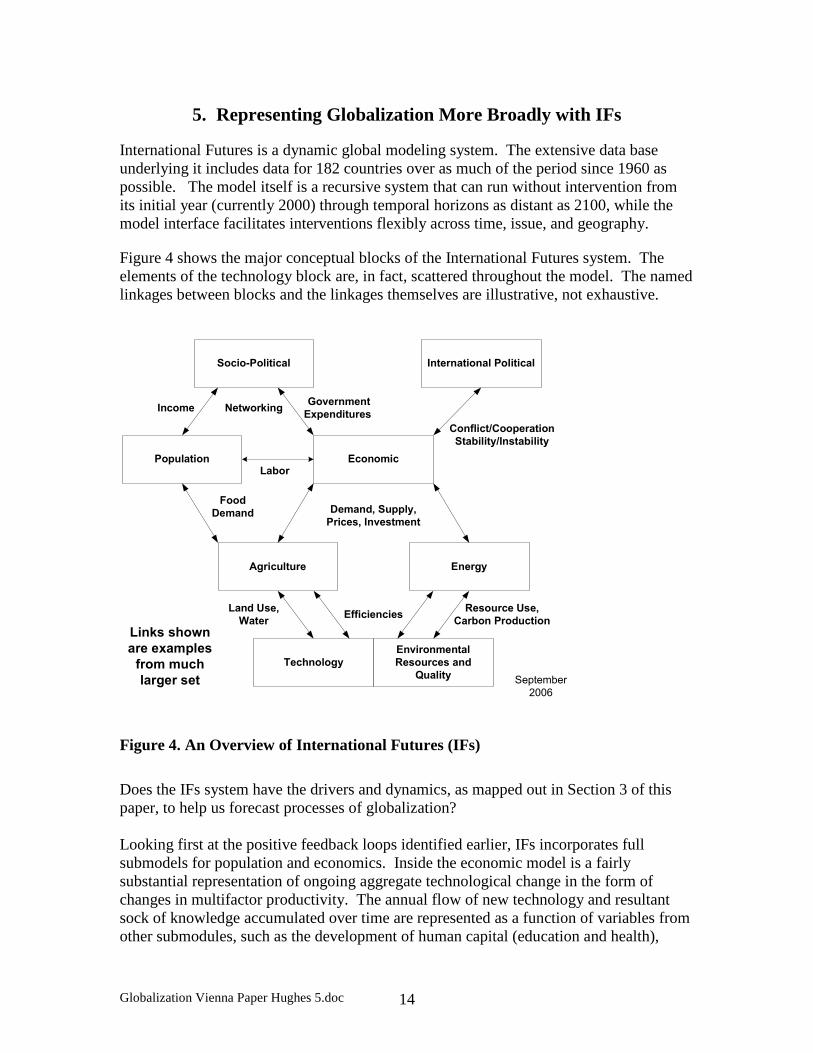
International Futures is a dynamic global modeling system. The extensive data base underlying it includes data for 182 countries over as much of the period since 1960 as possible. The model itself is a recursive system that can run without intervention from its initial year (currently 2000) through temporal horizons as distant as 2100, while the model interface facilitates interventions flexibly across time, issue, and geography.
Figure 4 shows the major conceptual blocks of the International Futures system. The elements of the technology block are, in fact, scattered throughout the model. The named linkages between blocks and the linkages themselves are illustrative, not exhaustive.
(FRQRPLF
6RFLR�3ROLWLFDO
3RSXODWLRQ
$JULFXOWXUH (QHUJ\
(QYLURQPHQWDO�5HVRXUFHV�DQG�
4XDOLW\
,QWHUQDWLRQDO�3ROLWLFDO
/DERU
'HPDQG��6XSSO\��3ULFHV��,QYHVWPHQW
5HVRXUFH�8VH�&DUERQ�3URGXFWLRQ
/DQG�8VH�:DWHU
�*RYHUQPHQW�([SHQGLWXUHV�
&RQIOLFW�&RRSHUDWLRQ6WDELOLW\�,QVWDELOLW\
)RRG�'HPDQG
,QFRPH 1HWZRUNLQJ
7HFKQRORJ\6HSWHPEHU�����
(IILFLHQFLHV
/LQNV�VKRZQ�DUH�H[DPSOHV�IURP�PXFK�ODUJHU�VHW
Figure 4. An Overview of International Futures (IFs)
Does the IFs system have the drivers and dynamics, as mapped out in Section 3 of this paper, to help us forecast processes of globalization? Looking first at the positive feedback loops identified earlier, IFs incorporates full submodels for population and economics. Inside the economic model is a fairly substantial representation of ongoing aggregate technological change in the form of changes in multifactor productivity. The annual flow of new technology and resultant sock of knowledge accumulated over time are represented as a function of variables from other submodules, such as the development of human capital (education and health),

Globalization Vienna Paper Hughes 5.doc 15
social capital (quality and character of governance), physical/natural capital (focusing on energy prices), and the knowledge development and diffusion processes (partly via R&D). Turning to the negative feedback loops, there is representation of cultural values and value change in terms of the two central dimensions of the World Value Survey project, namely survival/self-expression and traditional/secular rational. But there are no formulations in the model that really capture increasing cultural tensions due to the globalization processes, much less a feedback from those to the globalization dynamic. There is also representation of environmental impact of growth processes, including especially deforestation and atmospheric accumulation of carbon dioxide. Again, however, there is not a feedback from either that would significantly alter the globalization growth process generated by the positive feedback dynamics. Finally, there is a representation of changes in domestic and, more strongly founded, in international income distributions. Still again, there is no feedback represented from those to the core positive dynamics. Along the same lines, the model can be used to examine the likely changes in global power capabilities over time (with an explicit POWER measure), but the power transitions generated in that representation are not used to generate warfare or other system disruption. Along the same line, there is no explicit representation of systemic leadership with respect to global finance and therefore no manner in which the leader could exhaust its capability to provide public goods such as being the lender of last resort in financial crises (Kindleberger 1973). Further, the model does represent ongoing democratization processes and even has a basic representation that can generate waves in democratization. There is, however, no portrayal of shifts in governance away from states to regional and global actors or regimes. This failure affects the measurement of contemporary globalization levels as well as the forecasting of future ones. In short, the central positive dynamics have basic representation, but while some of the key variables in the negative feedback loops are represented, the loops are not closed. It is predictable, therefore, that the forecasts of the model will display more of the longer-term growth in globalization than the periodic oscillations or systemic crises. At the same time, however, there are other useful features of the system. For instance, its substantial representation of energy systems does capture the movement from fossil fuels to renewable sources over time and therefore allows some examination of the relationships between the energy system and globalization processes. The model also has a basic representation of the growth of the internet and could therefore help think about possible change in the dynamics underlying advances in human well-being that were the subject of speculation in Section 3 (from territory to trade to terabytes). With respect to the general issue raised in this section, namely whether IFs can help us forecast globalization or not, the answer is clearly “yes and no.” There are important

Globalization Vienna Paper Hughes 5.doc 16
foundations but many missing elements. Some missing elements might well be handled via scenarios. Why are a number of potentially important feedback linkages missing in the model? One part of the explanation is that they are fundamentally less well understood than are the basic positive-feedback dynamics. Another part could be that for long-range forecasting the power of the core positive feedbacks may outweigh the long-range influence of the negative feedbacks, at least as they have unfolded in the last century or more. Even the great depression and the major world wars of the twentieth century were hard to find in the systemic indicators at the end of the century. In spite of the limitations for forecasting identified here, the next section will take a preliminary look at the kinds of forecasts that IFs generates with respect to globalization.

Globalization Vienna Paper Hughes 5.doc 17
6. Forecasting Globalization Using the index of globalization within IFs (rooted in the A.T. Kearney/Foreign Policy index) and using the dynamics that do exist in IFs, what might we learn, if anything, about the possible progression of globalization through the twenty-first century? Figure 5 begins the exploration by showing long-term forecasts from the base case for, respectively the OECD and non-OECD countries (as rough proxies for the North and South of the world). Note that on the 100-point index rooted in the experience of 2000, the world continues a fairly steady process of globalization and reaches very high levels by 2100, especially in OECD countries. The absence of much fluctuation around the growth pattern reflects the weakness (essential absence) of the negative feedback loops, as discussed earlier. The slowing down of the growth process in the long-term has two explanations: saturation effects created by the operationalization and saturation effects inherent in the process. With respect to the former, the measure is constrained by an upper limit of 100, therefore imposing saturation in the forecasts. A first reaction might logically be that such saturation is artificial. Nonetheless, the pattern should simultaneously raise the question of deeper substantive significance to be pursued here: could the globalization process truly be subject to saturation and, if so, might the current century be the century in which saturation would become apparent?
30
40
50
60
70
80
90
100
Differentiation of Globalization Levels and Change
Inde
x
Year2008 2017 2026 2035 2044 2053 2062 2071 2080 2089 2098
(OECD) (non-OECD)
Figure 5. Globalization Forecast in IFs Base Case. In addition to the saturation effect, the other eye-catching aspect of Figure 5 is the bending of the curve in the middle of the second decade of the century. Why does that occur? The easiest way to explore for explanation is to investigate the sub-dimensions of the globalization measure. Figure 6 shows the sub-dimension for personal contacts, which again indicates some saturation effect, but no substantial curve bending.

Globalization Vienna Paper Hughes 5.doc 18
20
25
30
35
40
45
50
55
60
65
70
75
80
Two Component Indices of Globalization IndexIn
dex
Year2008 2017 2026 2035 2044 2053 2062 2071 2080 2089 2098
Personal Contact Economic Integration
Figure 6. Component Indices Forecast in IFs Base Case. The second component measure is global economic integration, also shown in Figure 6. There the curve bending does appear. Why? Figures 7 and 8 explore the two sub-dimensions of global economic integration in the IFs measure, namely global trade and foreign direct investment. The trade figure, representing global trade over global GDP, shows a slight down-turn in growth early in the century, related in part to the energy system transformation discussed earlier. But thereafter the curve actually bends somewhat upward as the trade share rises quite steadily.
24
26
28
30
32
34
36
Global Trade over Global GDP
Per
cent
Year2000 2010 2020 2030 2040 2050 2060 2070 2080 2090 2100
Figure 7. Trade Openness Forecast in IFs Base Case

Globalization Vienna Paper Hughes 5.doc 19
In contrast, the global stock of FDI over GDP (below) does exhibit the curve bending. Again the question is why?
25
30
35
40
45
50
55
Global FDI Stock as Percent of Global GDP
Year2008 2017 2026 2035 2044 2053 2062 2071 2080 2089 2098
Figure 8. Global FDI Stocks over GDP Forecast in IFs Base Case The explanation for the curve bending becomes apparent from study of Figure 10, which focuses on flows of FDI instead of stocks. After a period of recovery from the sharp downturn in FDI flows that followed the stock market retrenchments of the early century (most of FDI is related to mergers and acquisitions and all of it reflects confidence in global markets), the pace of FDI flows over GDP resumes a relatively steady but slow upward growth. The relatively slow growth pattern will cause the global stocks to begin saturating (as in the above figure) because they suggest essentially a systemic shift from low flow rates and stock levels in the early 1980s to fairly high flow and stock levels by about 2020. Since global investment over GDP falls over time in the range of 20-30 percent of GDP, saturation of FDI over GDP at the level of about 3 percent of GDP may be somewhat low, but there is inevitably going to be such saturation, causing the kind of curve bending we have seen. Once again, this may indicate a weakness in the measure, but it may be a hint of true saturation processes ahead.

Globalization Vienna Paper Hughes 5.doc 20
2.4
2.6
2.8
3.0
3.2
3.4
3.6
3.8
Global FDI Inflows as Percent of Global GDPP
erce
nt
Year2008 2017 2026 2035 2044 2053 2062 2071 2080 2089 2098
Figure 9. Global FDI Flows over GDP Forecast in IFs Base Case Interestingly, turning to the third component of the globalization measure, namely the extent of electronic connection through networking, we again see in Figure 10 both the shorter run bending of the curve and the longer-term saturation effect. No more than 100 percent of the world’s population is likely to ever be connected to the world wide web. Again, this may simply suggest a conceptualization/measurement weakness, because even if everyone is connected, the amount of information exchanged could grow for some considerable time. Nonetheless, the figure does logically raise the deeper question: might such saturation truly occur?
5
10
15
20
25
30
35
40
45
50
55
60
65Global Percentage Use of Electronic Networking
Per
cent
Year2008 2017 2026 2035 2044 2053 2062 2071 2080 2089 2098
Figure 10. Global Percent Networked Forecast in IFs Base Case

Globalization Vienna Paper Hughes 5.doc 21
All of the above figures being discussed were produced for the base case of IFs, a forecast that has been calibrated with both historical patterns and other forecasting projects. Nonetheless, the base case represents only one of an infinite number of possible futures, and given the range of possibilities, it must be considered a low probability future. Figure 11 shows the globalization index across four alternative scenarios, those of the United Nations Environmental Programme’s Global Environmental Outlook 4 (UNEP forthcoming). Interestingly, the Security First scenario, which posits a breakdown of global trade and aid, as well as much less rapid economic progress in the global South, leads to a stabilization of globalization levels. The only real surprise, perhaps, is that it does not cause a drop in them. The other three scenarios all lead to similar patterns in the continuing growth of globalization. Scenarios are built to frame future uncertainties. If these scenarios do so successfully, some continued advance in globalization, and quite possible considerable advance, seems likely.
30
35
40
45
50
55
60
65
70
75
80
85
Four Scenarios of World-Wide GlobalizationUNEP GEO-4 Scenario Set
Inde
x
Year2008 2017 2026 2035 2044 2053 2062 2071 2080 2089 2098
Markets First Policy First Security First Sustainability First
Figure 11. Alternative Scenarios of Globalization from IFs As this paper has noted repeatedly, however, there is much that the IFs model omits that would be relevant to a forecast of globalization. Figure 12 shows one such element, namely the nearly certain coming power transition between the United States and China.3 The figure shows the percentage share of systemic power capabilities (for details on the measure and flexibility of it see Hughes and Hillebrand 2006). The graph has its own story to tell, including the apparent peaking of Chinese power share not long after its overtaking of a (relatively) declining United States (related to continued rise of India and other parts of the global South). But for this analysis the key point is that the earlier 3 “Nearly certain” may seem too high, given the fairly narrow range of power superiority obtained by China in Figure 12 and knowing (1) the crudeness of power measures and its forecasting and (2) the possibility that a democratic US would have stronger alliance support than a potentially still authoritarian China. A wide range of alternative assumptions within IFs, however, produce similar results.

Globalization Vienna Paper Hughes 5.doc 22
figures discussed are not affected within IFs by this transition, even though we know well that past power transitions have fed back to the globalization process. The difficulty is, of course, in knowing how that feedback should be structured in the IFs model.
10
12
14
16
18
20
22
24
26
The Coming Global Power Transition
Inde
x
Year2008 2017 2026 2035 2044 2053 2062 2071 2080 2089 2098
(USA) (CHINA)
Figure 12. Global Power Transition Forecast in IFs Base Case Finally, Figure 13 shows a forecast of global democratization. Like power structures in Figure 12, democratization moves us beyond the analysis of flows and connectedness and more directly into the analysis of social structures and globalization as evolutionary and transformative processes. What it shows is the possibility that various drivers (including economic growth and the spread and deepening of education, a transformative factor itself) will push most of the world, including most of the developing world, through the stages of unconsolidated democracy to quite high levels of (consolidated) democracy. If so, that has great implications for globalization.

Globalization Vienna Paper Hughes 5.doc 23
11
12
13
14
15
16
17
18
19
20
Democracy Level, PolityThe Policy Scale is 0 to 20 (Most Democratic)
Inde
x
Year2008 2017 2026 2035 2044 2053 2062 2071 2080 2089 2098
Non-OECD OECD
Figure 13. Global Democratization Forecast in IFs Base Case

Globalization Vienna Paper Hughes 5.doc 24
7. Conclusions on the Forecasting of Globalization What can this paper tell us about the prospects for forecasting globalization processes? Several things:
Many of the general dynamics of those processes are reasonably well understood, as suggested in the portrayal of them here in terms of key positive and negative feedbacks.
Large portions of the specifics of the processes are less clear, as suggested by the
failure within the International Futures model to close the negative feedback loops, in particular. Even if those closures could be represented in terms of rough magnitudes of impact on the underlying process, it is difficult to believe that the timing of the key negative effects would be easy to forecast.
It is not just the dynamics of the processes that complicate forecasting. The very
measurement or representation of globalization is far from simple. Alternative representations, particularly with respect to measures that saturate or do not, could make large differences in forecasts.
Alternative scenarios should be used in forecasting. Differences in forecasts
across credible scenarios can be large.
To the extent that the very basic forecasting effort described here has any remaining credibility after the caveats above, it suggests the following conclusions:
o Globalization appears highly like to continue through the century, even if
there are setbacks (the Security First scenario suggests that the process could stall altogether).
o Globalization appears likely to continue not just in terms of flows or
connectedness, but also in terms socio-political transformations or evolution, such as increasingly widespread movement towards democracy (with one foundation in substantial advance of educational levels).
o Consideration should be given to at least one possible additional conclusion,
that the globalization process may be subject to some form of saturation effect. Might there be limits to some of the sub-processes, if not the overall phenomenon, and might we be approaching some such limits this century?
Although forecasting of globalization looks to be strewn with pitfalls, the process remains the meta-trend of global change. There is therefore much reason to continue enhancing our capability to anticipate the future of that key force.

Globalization Vienna Paper Hughes 5.doc 25
Bibliography
Brown, Lester R. 2001. Eco-Economy: Building an Economy for the Earth. New York: W.W. Norton & Company.
Castells, Manuel. 2000. The Rise of the Network Society, 2nd edition. Oxford: Blackwell Publishers.
Chanda, Nayan. 2002 (November 19). What is Globalization? YaleGlobal Online at http://yaleglobal.yale.edu/about/essay.jsp [February 2, 2006]
Devezas, Tessaleno and George Modelski. 2005 (July). “The Portuguese as System-builders in the XVth –XVIth centuries: A Case Study on the Role of Technology in the Evolution of the World System,” manuscript for the research seminar on Globalization as Evolutionary Process: Modeling, Simulating, and Forecasting Change, International Institute for Applied Systems Analysis (IIASA), Laxenburg, Vienna April 6-8, 2006.
Freeman, Chris and Francisco Louçã. 2001. As Time Goes By: From the Industrial Revolutions to the Information Revolution. Oxford: Oxford University Press.
Friedman, Thomas L. 1999. The Lexus and the Olive Tree. New York: Anchor Books.
Held, David, Anthony McGrew, David Goldblatt, and Jonathan Perraton. 1999. Global Transformation: Politics, Economics and Culture. Cambridge: Polity Press (also Stanford University Press).
Held, David and Anthony McGrew, eds. 2003. The Global Transformations Reader, 2nd edition. Cambridge: Polity Press.
Hughes, Barry B. 1997. “Rough Road Ahead: Global Transformations in the 21st Century,” Futures Research Quarterly 13, No. 2 (Summer): 83-107.
Hughes, Barry B. 2001. “Global Social Transformation: The Sweet Spot, the Steady Slog, and the Systemic Shift,” Economic Development and Cultural Change 49, No. 2 (January): 423-458.
Hughes, Barry B. and Peter D. Johnston. 2005. “Sustainable Futures: Policies for Global Development,” Futures 37: 813-831.
Hughes, Barry B. 2004 (May). “The Structure of IFs,” Graduate School of International Studies, University of Denver (June). IFs working paper on the IFs website. With Anwar Hossain and Mohammod Irfan.
Hughes, Barry B. 2005 (May). “Forecasting Productivity and Economic Growth in International Futures (IFs) Part 2: Driving the Drivers and Indices,” Graduate School of International Studies, University of Denver (June). IFs working paper on the IFs website. 71 pages.

Globalization Vienna Paper Hughes 5.doc 26
Hughes, Barry B. 2006. “Assessing the Credibility of Forecasts Using International Futures (IFs): Verification and Validation.” Graduate School of International Studies, University of Denver (June). IFs working paper on the IFs website.
Hughes, Barry B. and Evan E. Hillebrand. 2006. Exploring and Shaping International Futures. Boulder, CO: Paradigm Publishers.
Huntington, Samuel P. 1993. “The Clash of Civilizations,” Foreign Affairs 72 (3): 22-49.
Inglehart, Ronald. 1997. Modernization and Postmodernization. Princeton: Princeton University Press.
International Forum on Globalization, A Better World is Possible! Alternatives to Economic Globalization. Spring, 2002. Available at www.ifg.org/alt_eng.pdf [October 15, 2005]. 20 page summary of larger report.
Kindleberger, Charles P. 1973. The World in Depression 1929-1939. Berkeley, CA: University of California Press.
Kurdle, Robert T. 2004. “Globalization by the Numbers: Quantitative Indicators and the Role of Policy,” International Studies Perspectives Vol 5: 341-355.
Lockwood, Ben. 2004. “How Robust is the Kearney/Foreign Policy Globalization Index?” The World Economy, Vol 27, No. 4: 507-523. Available at http://ideas.repec.org/a/bla/worlde/v27y2004i4p507-523.html.
Lovins, Amory B., E. Kyle Datta, Odd-Even Bustnes, Jonathan G. Koomey, and Nathan J. Glasgow. 2005. Winning the Oil Endgame. Snowmass, CO: Rocky Mountain Institute.
Modelski, George and William R. Thompson. 1996. Leading Sectors and World Powers: The Coevolution of Global Politics and Economics. Columbia: University of South Carolina Press.
National Intelligence Council . 2004 (December). Mapping the Global Future: Report of the National Intelligence Council’s 2020 Project. Washington, D.C.: USGPO.
Raskin, Paul, et al. 2002. Great Transition: The Promise and Lure of the Times Ahead. Boston: Stockholm Environment Institute. See http://www.tellus.org/seib/publications/Great_Transitions.pdf; February 15, 2004
Rasler, Karen A. and William R. Thompson. 1994. The Great Powers and Global Struggle 1490-1990. Lexinton, KY: University of Kentucky Press.
Rifkin, Jeremy. 2002. The Hydrogen Economy. New York: Penguin.

Globalization Vienna Paper Hughes 5.doc 27
Rodrick, Dani. 1997. Has Globalization Gone Too Far? Washington, D.C.: Institute for International Economics.
Rosecrance, Richard N. 1986. The Rise of the Trading State: Commerce and Conquest in the Modern World. New York: Basic Books.
Simon, Julian. 1981. The Ultimate Resource. Princeton, NJ: Princeton University Press.
Toynbee, Arnold. 1972. A Study of History. New York: Weathervane Books.
United Nations Development Programme (UNDP). 2003. Human Development Report 2002. Issue topic was Millennium Development Goals. New York: Oxford University Press.
United Nations Environment Programme (UNEP). 2002. Global Environment Outlook 3: Past, Present, and Future Perspectives. London and Sterling, VA: Earthscan Publications Ltd.
United Nations Environment Programme (UNEP). Forthcoming. Global Environment Outlook 4.