forecasting capabilities - epi3000.com 2011 web.pdf · semi-structured brain storming sessions ......
TRANSCRIPT
EPICENTER Consulting LLC Copyright © All rights reserved 2011EPICENTER Consulting LLC Copyright © All rights reserved 2011
Dr. P. MuellerEpicenter Consulting LLC
Forecasting Capabilities
Epicenter Consulting LLC
EPICENTER Consulting LLC Copyright © All rights reserved 2011
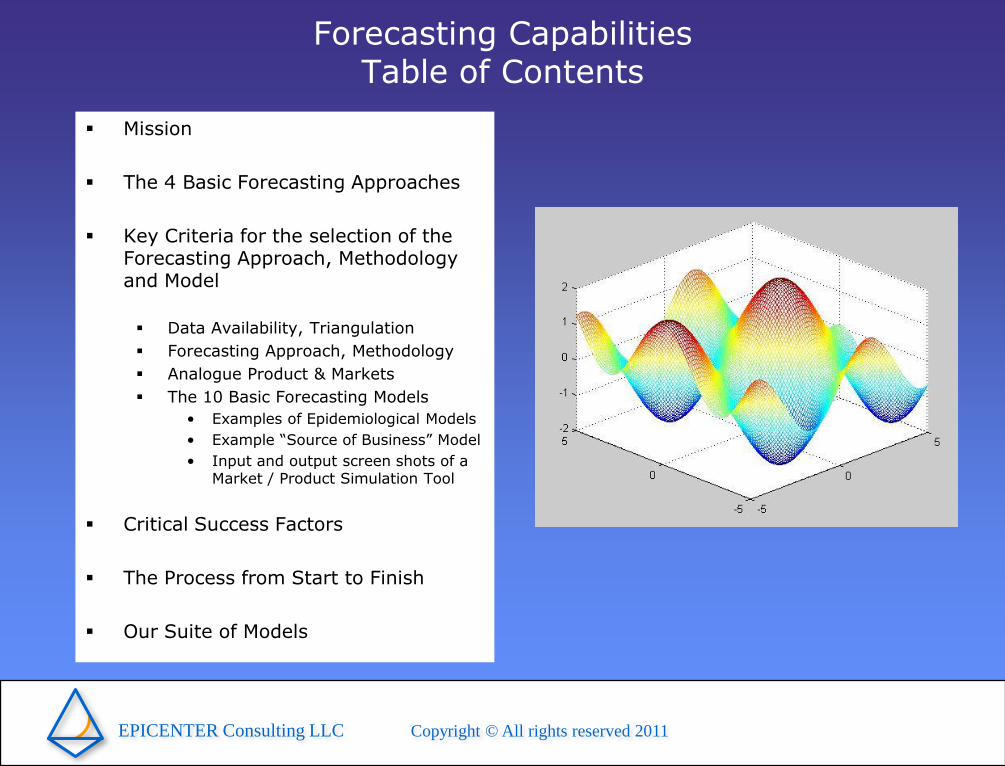
Forecasting Capabilities Table of Contents
Mission
The 4 Basic Forecasting Approaches
Key Criteria for the selection of the Forecasting Approach, Methodology and Model
Data Availability, Triangulation
Forecasting Approach, Methodology
Analogue Product & Markets
The 10 Basic Forecasting Models
• Examples of Epidemiological Models
• Example “Source of Business” Model
• Input and output screen shots of a Market / Product Simulation Tool
Critical Success Factors
The Process from Start to Finish
Our Suite of Models
EPICENTER Consulting LLC Copyright © All rights reserved 2011
Epicenter Consulting LLC
Our Mission is to provide World-class
Marketing
Forecasting
and
Management Expertise
to our Clients in the Pharmaceutical and Biotechnology Industry
Our Forecasting expertise is based on 23 Years of Global Experience in the Pharmaceutical Industry as well as
10 years of Consulting.Our Global Forecasting Expertise goes across
all Therapeutic Areas andall phases of Product Development
EPICENTER Consulting LLC Copyright © All rights reserved 2011
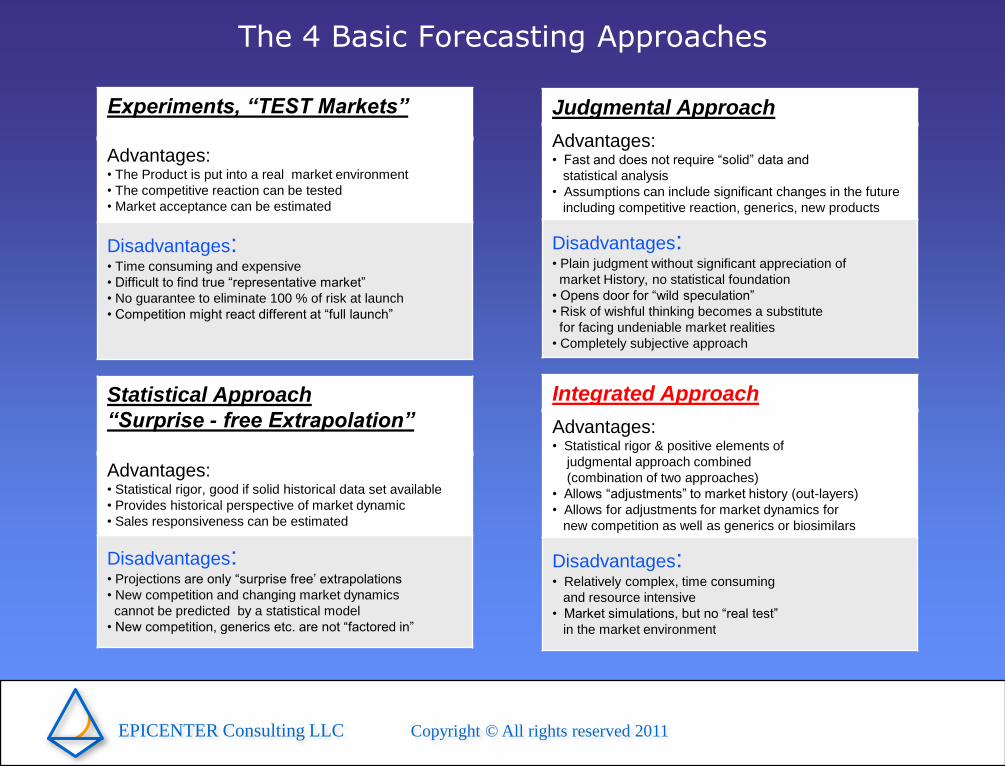
The 4 Basic Forecasting Approaches
Experiments, “TEST Markets”
Advantages:• The Product is put into a real market environment
• The competitive reaction can be tested
• Market acceptance can be estimated
Disadvantages:• Time consuming and expensive
• Difficult to find true “representative market”
• No guarantee to eliminate 100 % of risk at launch
• Competition might react different at “full launch”
Statistical Approach
“Surprise - free Extrapolation”
Advantages:• Statistical rigor, good if solid historical data set available
• Provides historical perspective of market dynamic
• Sales responsiveness can be estimated
Disadvantages:• Projections are only “surprise free’ extrapolations
• New competition and changing market dynamics
cannot be predicted by a statistical model
• New competition, generics etc. are not “factored in”
Judgmental Approach
Advantages:• Fast and does not require “solid” data and
statistical analysis
• Assumptions can include significant changes in the future
including competitive reaction, generics, new products
Disadvantages:• Plain judgment without significant appreciation of
market History, no statistical foundation
• Opens door for “wild speculation”
• Risk of wishful thinking becomes a substitute
for facing undeniable market realities
• Completely subjective approach
Integrated Approach
Advantages:• Statistical rigor & positive elements of
judgmental approach combined
(combination of two approaches)
• Allows “adjustments” to market history (out-layers)
• Allows for adjustments for market dynamics for
new competition as well as generics or biosimilars
Disadvantages:• Relatively complex, time consuming
and resource intensive
• Market simulations, but no “real test”
in the market environment
EPICENTER Consulting LLC Copyright © All rights reserved 2011
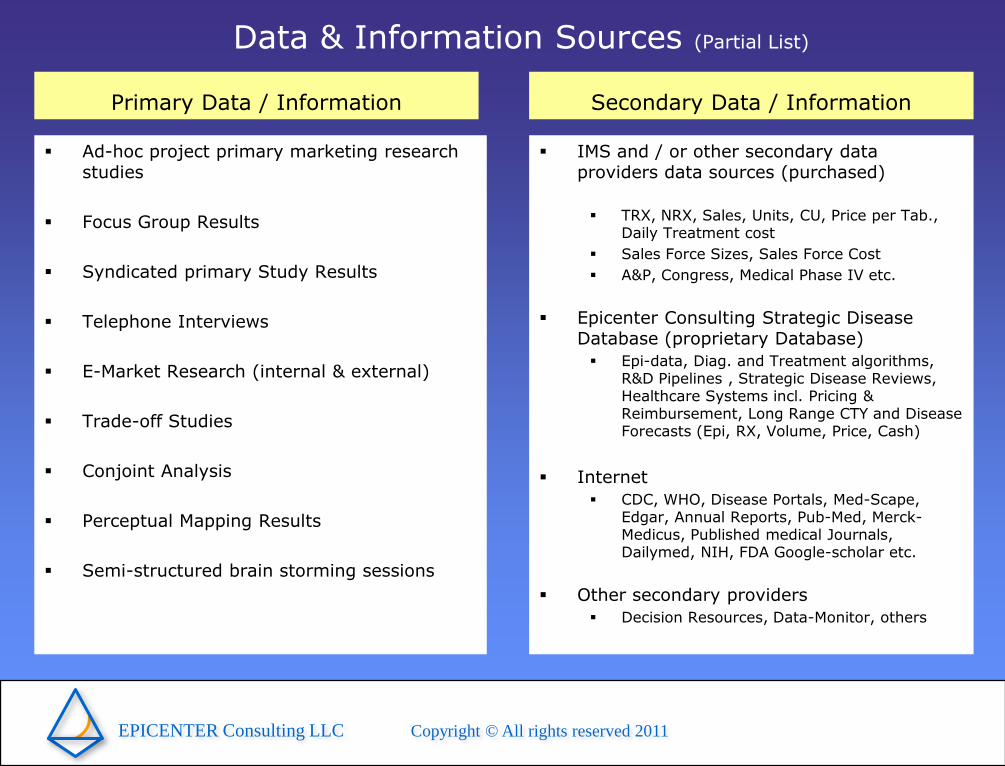
Data & Information Sources (Partial List)
Primary Data / Information
Ad-hoc project primary marketing research studies
Focus Group Results
Syndicated primary Study Results
Telephone Interviews
E-Market Research (internal & external)
Trade-off Studies
Conjoint Analysis
Perceptual Mapping Results
Semi-structured brain storming sessions
Secondary Data / Information
IMS and / or other secondary data providers data sources (purchased)
TRX, NRX, Sales, Units, CU, Price per Tab., Daily Treatment cost
Sales Force Sizes, Sales Force Cost
A&P, Congress, Medical Phase IV etc.
Epicenter Consulting Strategic Disease Database (proprietary Database)
Epi-data, Diag. and Treatment algorithms, R&D Pipelines , Strategic Disease Reviews, Healthcare Systems incl. Pricing & Reimbursement, Long Range CTY and Disease Forecasts (Epi, RX, Volume, Price, Cash)
Internet
CDC, WHO, Disease Portals, Med-Scape, Edgar, Annual Reports, Pub-Med, Merck-Medicus, Published medical Journals, Dailymed, NIH, FDA Google-scholar etc.
Other secondary providers
Decision Resources, Data-Monitor, others
EPICENTER Consulting LLC Copyright © All rights reserved 2011
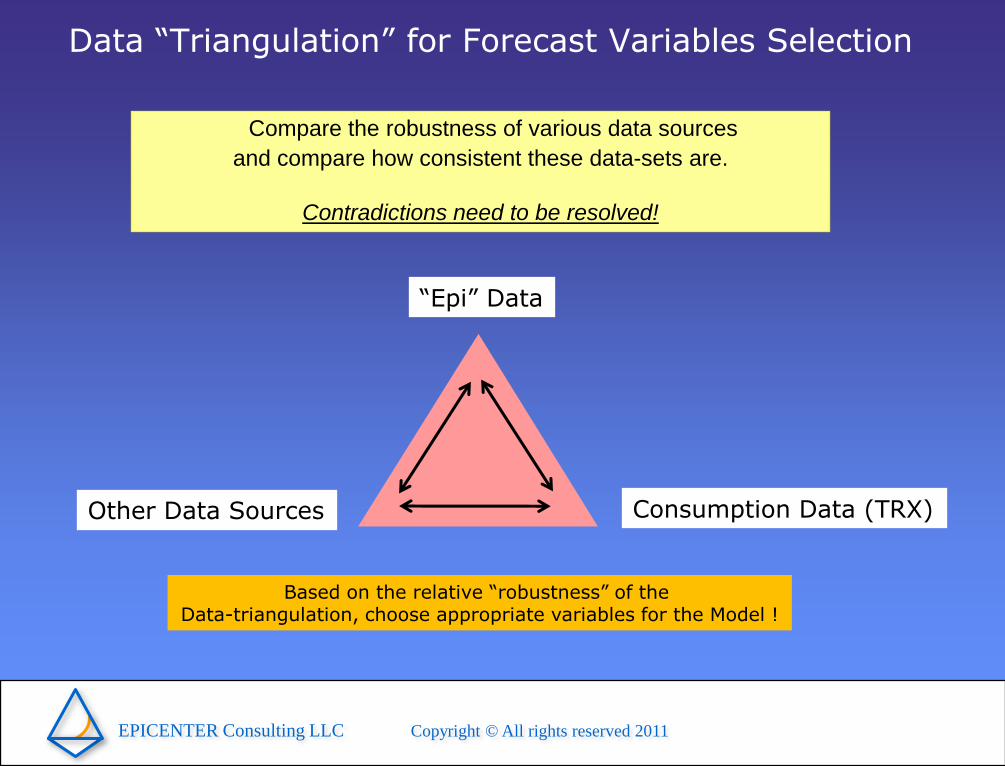
Data “Triangulation” for Forecast Variables Selection
Compare the robustness of various data sources
and compare how consistent these data-sets are.
Contradictions need to be resolved!
“Epi” Data
Consumption Data (TRX)Other Data Sources
Based on the relative “robustness” of the Data-triangulation, choose appropriate variables for the Model !
EPICENTER Consulting LLC Copyright © All rights reserved 2011
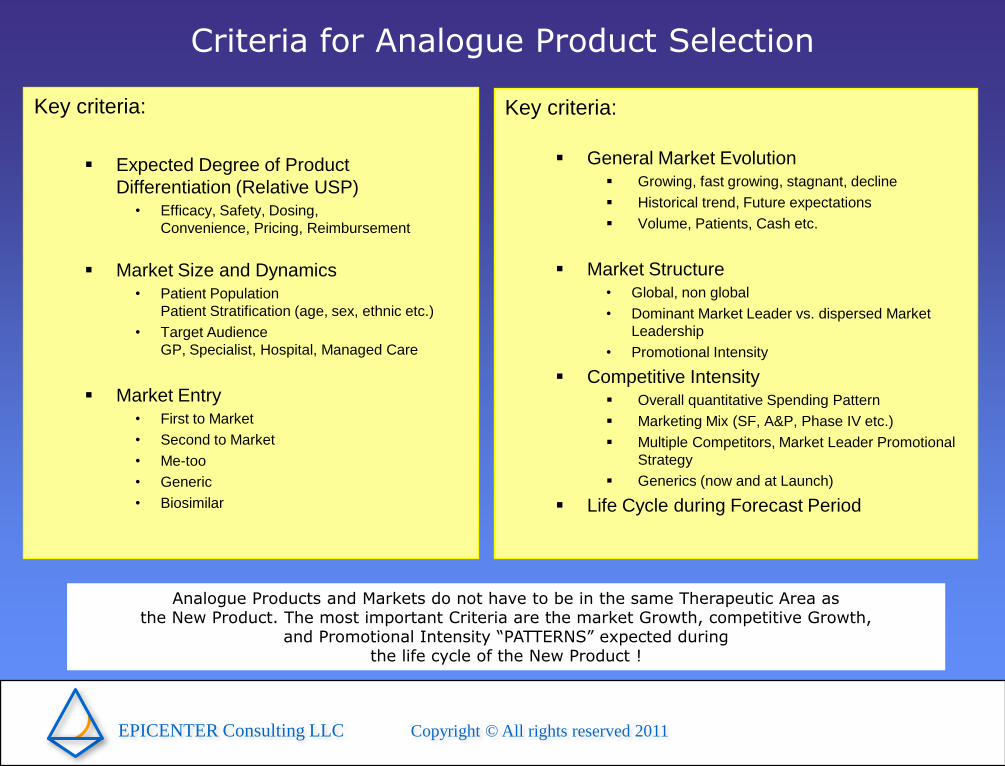
Criteria for Analogue Product Selection
Key criteria:
Expected Degree of Product
Differentiation (Relative USP)
• Efficacy, Safety, Dosing,
Convenience, Pricing, Reimbursement
Market Size and Dynamics
• Patient Population
Patient Stratification (age, sex, ethnic etc.)
• Target Audience
GP, Specialist, Hospital, Managed Care
Market Entry
• First to Market
• Second to Market
• Me-too
• Generic
• Biosimilar
Key criteria:
General Market Evolution
Growing, fast growing, stagnant, decline
Historical trend, Future expectations
Volume, Patients, Cash etc.
Market Structure
• Global, non global
• Dominant Market Leader vs. dispersed Market
Leadership
• Promotional Intensity
Competitive Intensity
Overall quantitative Spending Pattern
Marketing Mix (SF, A&P, Phase IV etc.)
Multiple Competitors, Market Leader Promotional
Strategy
Generics (now and at Launch)
Life Cycle during Forecast Period
Analogue Products and Markets do not have to be in the same Therapeutic Area as the New Product. The most important Criteria are the market Growth, competitive Growth,
and Promotional Intensity “PATTERNS” expected during the life cycle of the New Product !

EPICENTER Consulting LLC Copyright © All rights reserved 2011
Incomplete Complete
Unstable
Multiple Regression
CommitteesSales ForceComposites
Independent
Judgment
Simple Moving Average
Census X-11Box-Jenkins
Winters
Simple Regression
Robust
Regression
Demand
Pull
CompanyPush
Stable
Forecasting Approach Data Quality & Quantity
Patient-Based Modeling
BusinessStrategy
EPICENTER Consulting LLC Copyright © All rights reserved 2011
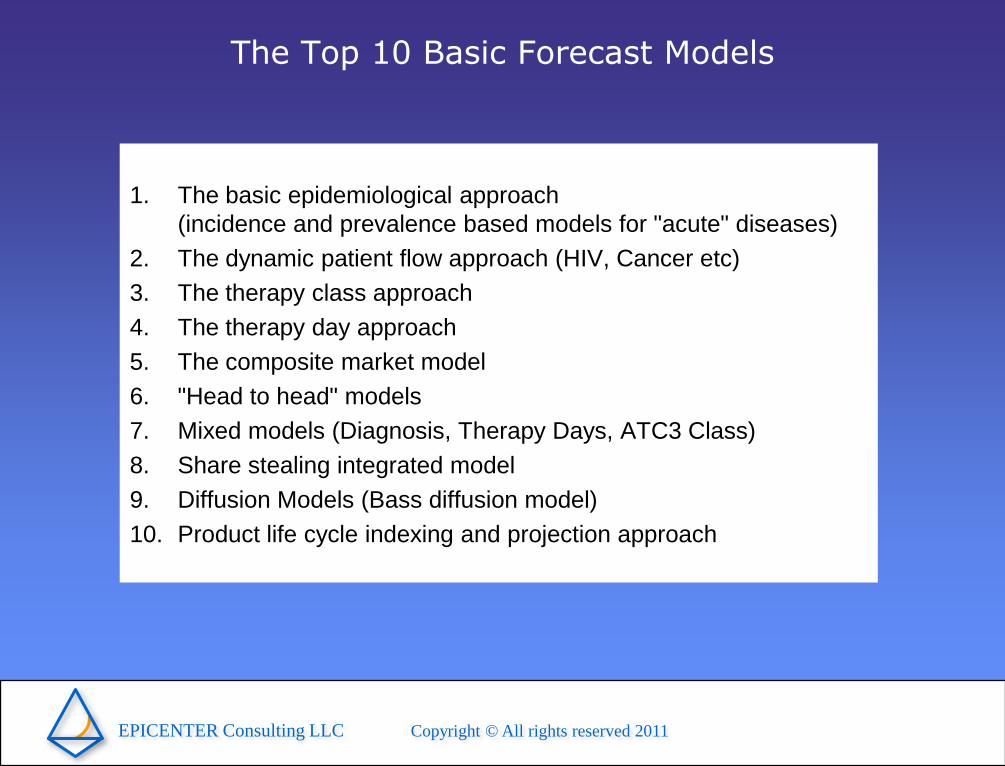
The Top 10 Basic Forecast Models
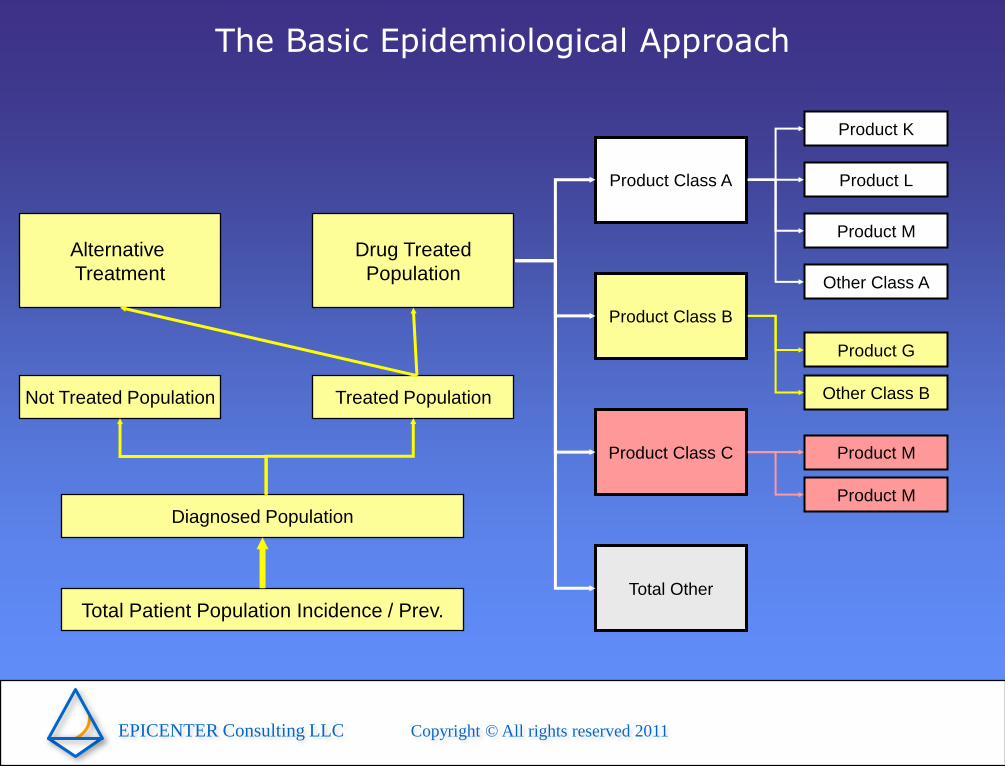
1. The basic epidemiological approach
(incidence and prevalence based models for "acute" diseases)
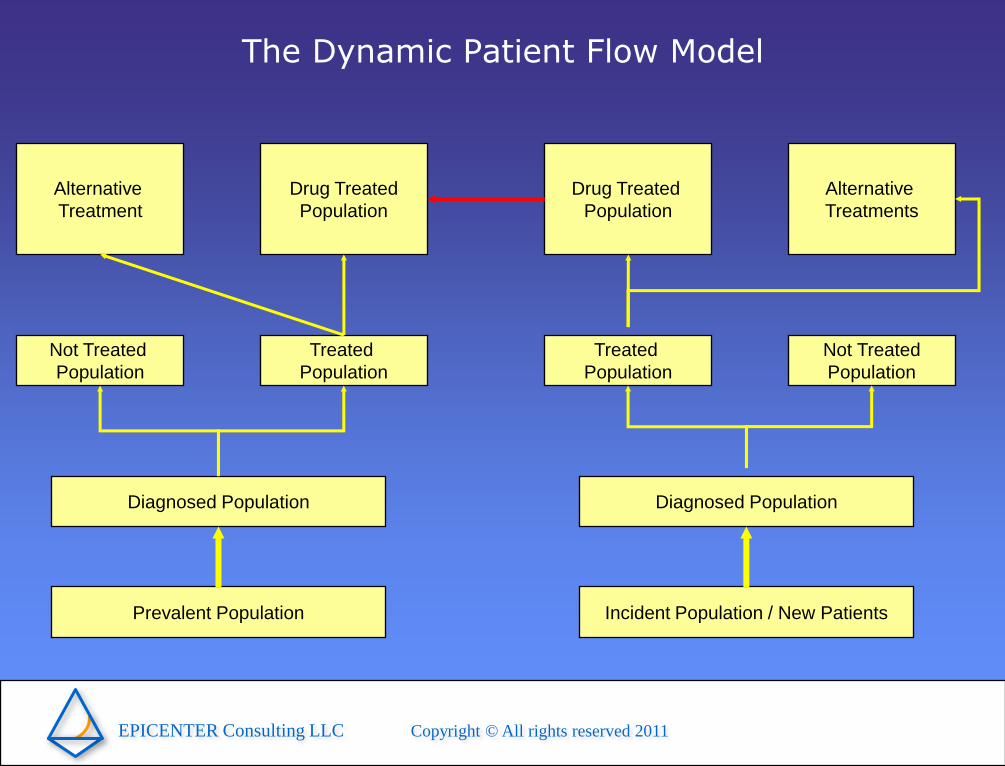
2. The dynamic patient flow approach (HIV, Cancer etc)
3. The therapy class approach
4. The therapy day approach
5. The composite market model
6. "Head to head" models
7. Mixed models (Diagnosis, Therapy Days, ATC3 Class)
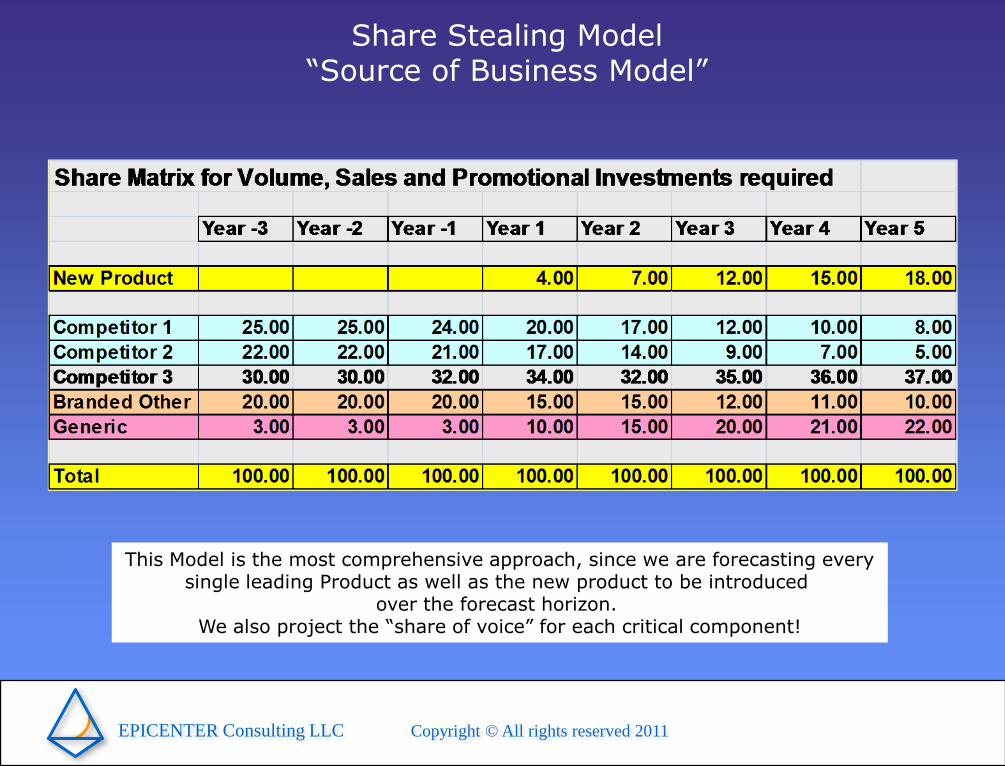
8. Share stealing integrated model
9. Diffusion Models (Bass diffusion model)
10. Product life cycle indexing and projection approach
EPICENTER Consulting LLC Copyright © All rights reserved 2011
The Basic Epidemiological Approach
Total Patient Population Incidence / Prev.
Diagnosed Population
Not Treated Population Treated Population
Drug Treated
Population
Alternative
Treatment
Product Class A
Total Other
Product Class C
Product Class B
Product K
Other Class A
Product M
Product L
Other Class B
Product G
Product M
Product M
EPICENTER Consulting LLC Copyright © All rights reserved 2011
The Dynamic Patient Flow Model
Prevalent Population
Diagnosed Population
Not Treated
Population
Treated
Population
Drug Treated
Population
Alternative
Treatment
Incident Population / New Patients
Diagnosed Population
Treated
Population
Not Treated
Population
Alternative
Treatments
Drug Treated
Population
EPICENTER Consulting LLC Copyright © All rights reserved 2011
Share Stealing Model“Source of Business Model”
This Model is the most comprehensive approach, since we are forecasting everysingle leading Product as well as the new product to be introduced
over the forecast horizon. We also project the “share of voice” for each critical component!
EPICENTER Consulting LLC Copyright © All rights reserved 2011
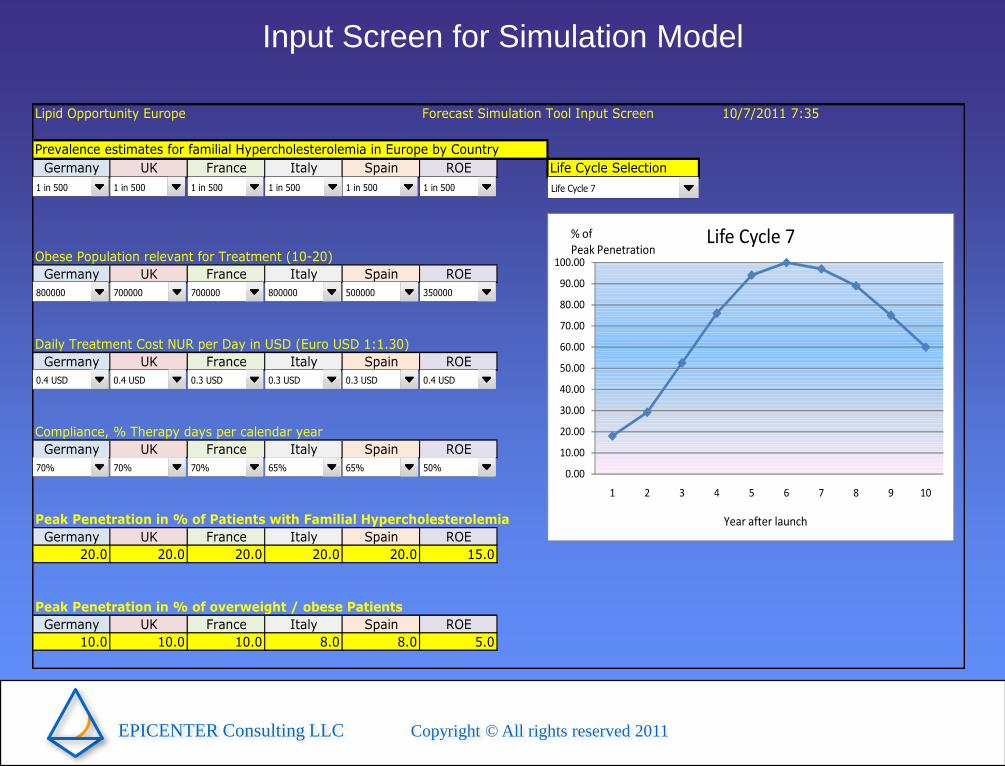
Input Screen for Simulation Model
Lipid Opportunity Europe Forecast Simulation Tool Input Screen 10/7/2011 7:35
Prevalence estimates for familial Hypercholesterolemia in Europe by Country
Germany UK France Italy Spain ROE Life Cycle Selection
Obese Population relevant for Treatment (10-20)
Germany UK France Italy Spain ROE
Daily Treatment Cost NUR per Day in USD (Euro USD 1:1.30)
Germany UK France Italy Spain ROE
Compliance, % Therapy days per calendar year
Germany UK France Italy Spain ROE
Peak Penetration in % of Patients with Familial Hypercholesterolemia
Germany UK France Italy Spain ROE
20.0 20.0 20.0 20.0 20.0 15.0
Peak Penetration in % of overweight / obese Patients
Germany UK France Italy Spain ROE
10.0 10.0 10.0 8.0 8.0 5.0
0.00
10.00
20.00
30.00
40.00
50.00
60.00
70.00
80.00
90.00
100.00
1 2 3 4 5 6 7 8 9 10
Life Cycle 7% of Peak Penetration
Year after launch
1 in 500 1 in 500 1 in 500 1 in 500 1 in 500 1 in 500 Life Cycle 7
800000 700000 700000 800000 500000 350000
70% 70% 70% 65% 65% 50%
0.4 USD 0.4 USD 0.3 USD 0.3 USD 0.3 USD 0.4 USD
EPICENTER Consulting LLC Copyright © All rights reserved 2011
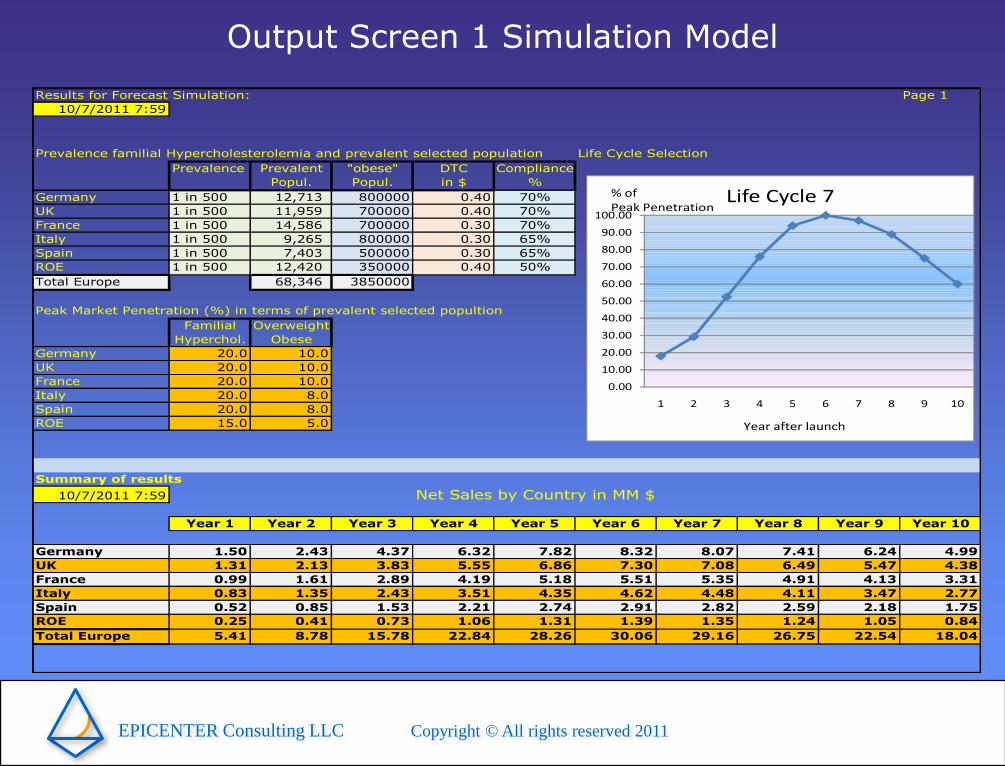
Output Screen 1 Simulation Model
Results for Forecast Simulation: Page 1
10/7/2011 7:59
Prevalence familial Hypercholesterolemia and prevalent selected population Life Cycle Selection
Prevalence Prevalent "obese" DTC Compliance
Popul. Popul. in $ %
Germany 1 in 500 12,713 800000 0.40 70%
UK 1 in 500 11,959 700000 0.40 70%
France 1 in 500 14,586 700000 0.30 70%
Italy 1 in 500 9,265 800000 0.30 65%
Spain 1 in 500 7,403 500000 0.30 65%
ROE 1 in 500 12,420 350000 0.40 50%
Total Europe 68,346 3850000
Peak Market Penetration (%) in terms of prevalent selected popultion
Familial Overweight
Hyperchol. Obese
Germany 20.0 10.0
UK 20.0 10.0
France 20.0 10.0
Italy 20.0 8.0
Spain 20.0 8.0
ROE 15.0 5.0
Summary of results
10/7/2011 7:59 Net Sales by Country in MM $
Year 1 Year 2 Year 3 Year 4 Year 5 Year 6 Year 7 Year 8 Year 9 Year 10
Germany 1.50 2.43 4.37 6.32 7.82 8.32 8.07 7.41 6.24 4.99
UK 1.31 2.13 3.83 5.55 6.86 7.30 7.08 6.49 5.47 4.38
France 0.99 1.61 2.89 4.19 5.18 5.51 5.35 4.91 4.13 3.31
Italy 0.83 1.35 2.43 3.51 4.35 4.62 4.48 4.11 3.47 2.77
Spain 0.52 0.85 1.53 2.21 2.74 2.91 2.82 2.59 2.18 1.75
ROE 0.25 0.41 0.73 1.06 1.31 1.39 1.35 1.24 1.05 0.84
Total Europe 5.41 8.78 15.78 22.84 28.26 30.06 29.16 26.75 22.54 18.04
0.00
10.00
20.00
30.00
40.00
50.00
60.00
70.00
80.00
90.00
100.00
1 2 3 4 5 6 7 8 9 10
Life Cycle 7% of Peak Penetration
Year after launch
EPICENTER Consulting LLC Copyright © All rights reserved 2011
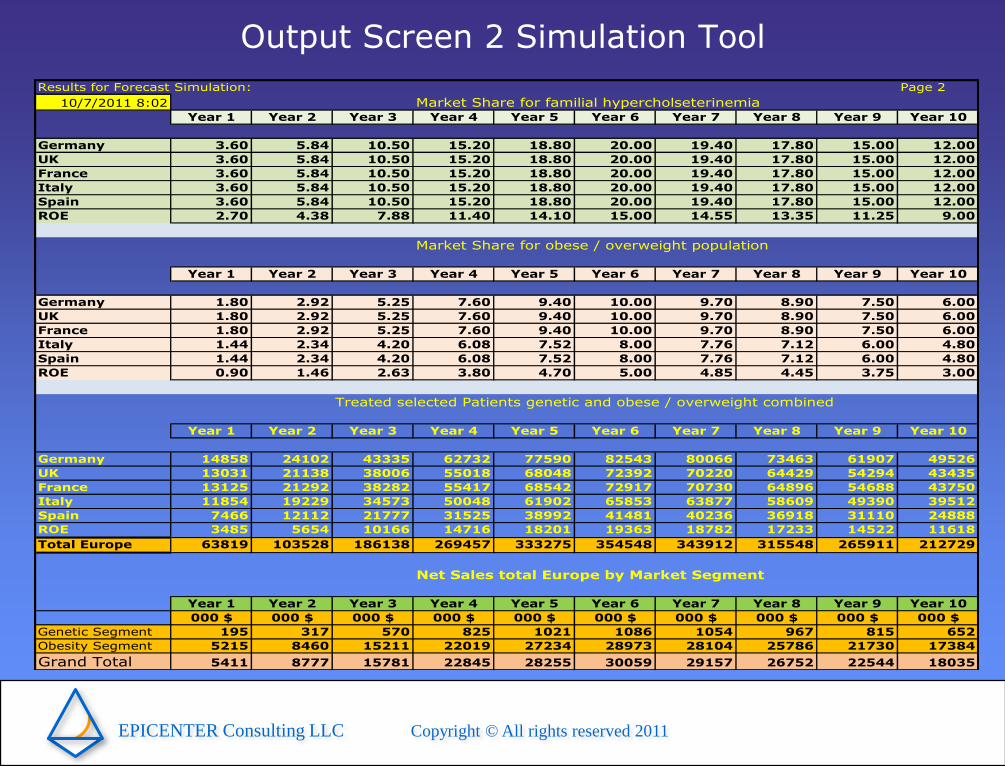
Output Screen 2 Simulation Tool
Results for Forecast Simulation: Page 2
10/7/2011 8:02 Market Share for familial hypercholseterinemiaYear 1 Year 2 Year 3 Year 4 Year 5 Year 6 Year 7 Year 8 Year 9 Year 10
Germany 3.60 5.84 10.50 15.20 18.80 20.00 19.40 17.80 15.00 12.00
UK 3.60 5.84 10.50 15.20 18.80 20.00 19.40 17.80 15.00 12.00
France 3.60 5.84 10.50 15.20 18.80 20.00 19.40 17.80 15.00 12.00
Italy 3.60 5.84 10.50 15.20 18.80 20.00 19.40 17.80 15.00 12.00
Spain 3.60 5.84 10.50 15.20 18.80 20.00 19.40 17.80 15.00 12.00
ROE 2.70 4.38 7.88 11.40 14.10 15.00 14.55 13.35 11.25 9.00
Market Share for obese / overweight population
Year 1 Year 2 Year 3 Year 4 Year 5 Year 6 Year 7 Year 8 Year 9 Year 10
Germany 1.80 2.92 5.25 7.60 9.40 10.00 9.70 8.90 7.50 6.00
UK 1.80 2.92 5.25 7.60 9.40 10.00 9.70 8.90 7.50 6.00
France 1.80 2.92 5.25 7.60 9.40 10.00 9.70 8.90 7.50 6.00
Italy 1.44 2.34 4.20 6.08 7.52 8.00 7.76 7.12 6.00 4.80
Spain 1.44 2.34 4.20 6.08 7.52 8.00 7.76 7.12 6.00 4.80
ROE 0.90 1.46 2.63 3.80 4.70 5.00 4.85 4.45 3.75 3.00
Treated selected Patients genetic and obese / overweight combined
Year 1 Year 2 Year 3 Year 4 Year 5 Year 6 Year 7 Year 8 Year 9 Year 10
Germany 14858 24102 43335 62732 77590 82543 80066 73463 61907 49526
UK 13031 21138 38006 55018 68048 72392 70220 64429 54294 43435
France 13125 21292 38282 55417 68542 72917 70730 64896 54688 43750
Italy 11854 19229 34573 50048 61902 65853 63877 58609 49390 39512
Spain 7466 12112 21777 31525 38992 41481 40236 36918 31110 24888
ROE 3485 5654 10166 14716 18201 19363 18782 17233 14522 11618
Total Europe 63819 103528 186138 269457 333275 354548 343912 315548 265911 212729
Net Sales total Europe by Market Segment
Year 1 Year 2 Year 3 Year 4 Year 5 Year 6 Year 7 Year 8 Year 9 Year 10
000 $ 000 $ 000 $ 000 $ 000 $ 000 $ 000 $ 000 $ 000 $ 000 $
Genetic Segment 195 317 570 825 1021 1086 1054 967 815 652
Obesity Segment 5215 8460 15211 22019 27234 28973 28104 25786 21730 17384
Grand Total 5411 8777 15781 22845 28255 30059 29157 26752 22544 18035
EPICENTER Consulting LLC Copyright © All rights reserved 2011
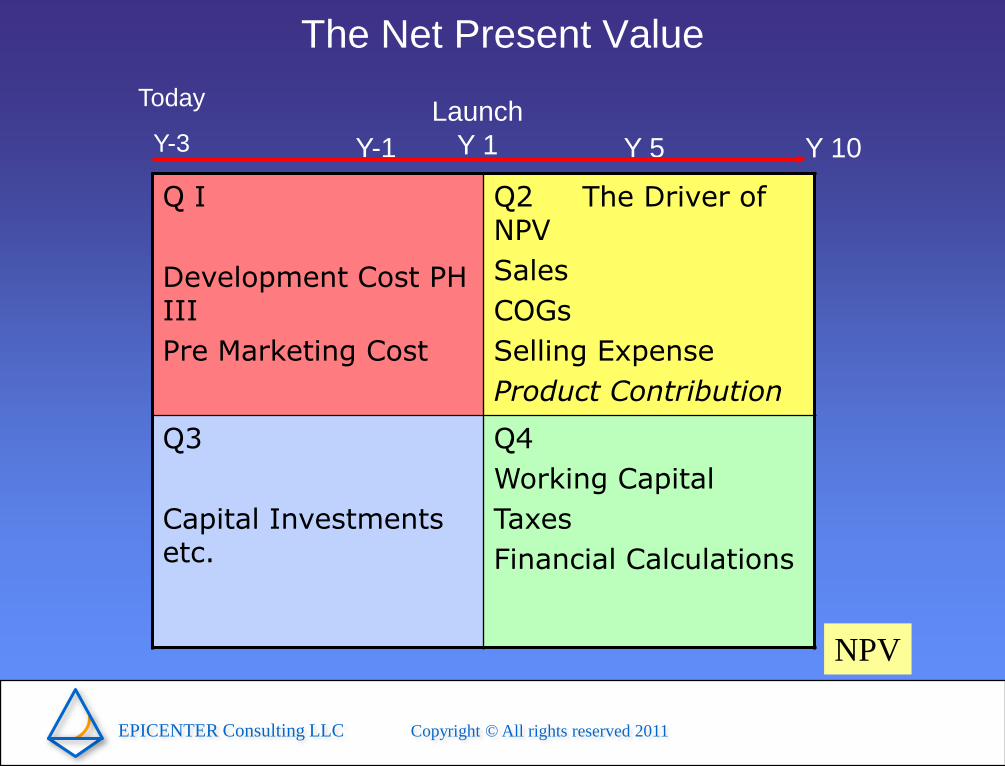
The Net Present Value
Q I
Development Cost PH III
Pre Marketing Cost
Q2 The Driver of NPV
Sales
COGs
Selling Expense
Product Contribution
Q3
Capital Investments etc.
Q4
Working Capital
Taxes
Financial Calculations
Launch
Y 1 Y 10Y 5
Today
Y-3 Y-1
NPV
EPICENTER Consulting LLC Copyright © All rights reserved 2011
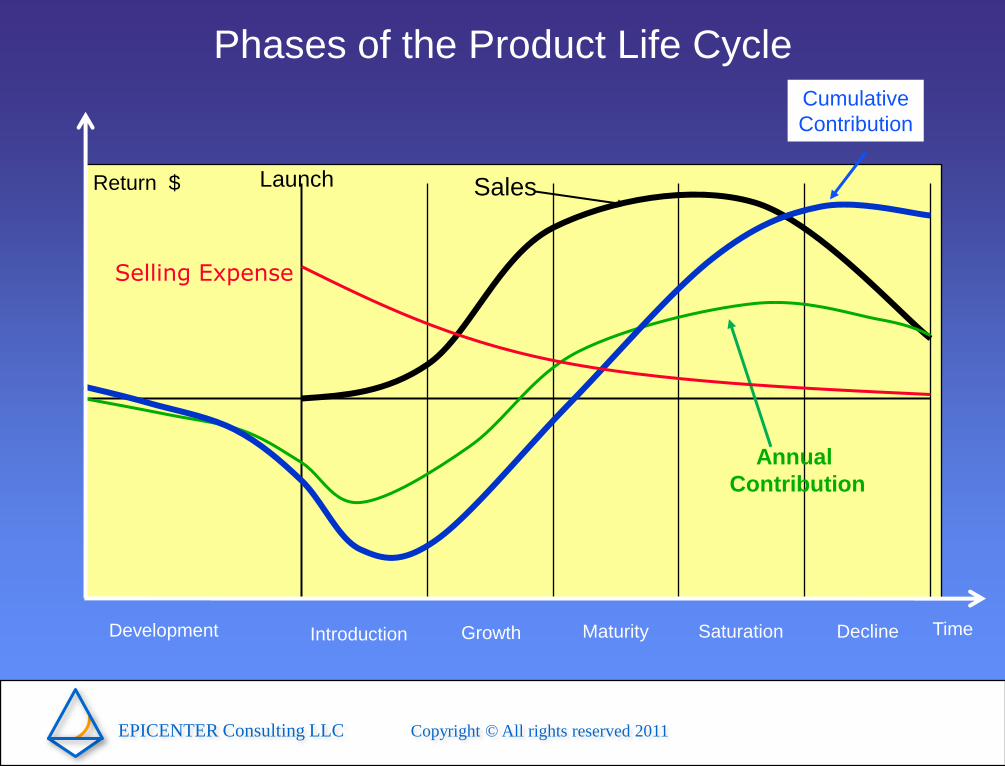
Phases of the Product Life Cycle
Return $
Time
Launch
Introduction Growth Maturity Saturation DeclineDevelopment
Sales
Annual
Contribution
Cumulative
Contribution
Selling Expense
EPICENTER Consulting LLC Copyright © All rights reserved 2011
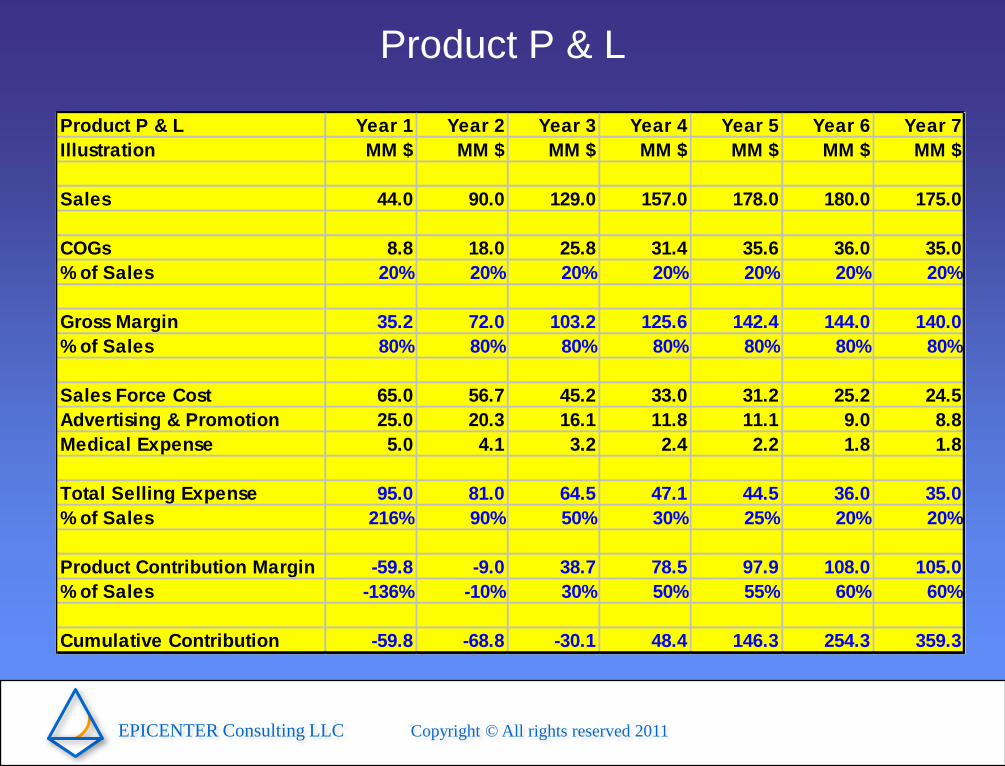
Product P & L
Product P & L Year 1 Year 2 Year 3 Year 4 Year 5 Year 6 Year 7
Illustration MM $ MM $ MM $ MM $ MM $ MM $ MM $
Sales 44.0 90.0 129.0 157.0 178.0 180.0 175.0
COGs 8.8 18.0 25.8 31.4 35.6 36.0 35.0
% of Sales 20% 20% 20% 20% 20% 20% 20%
Gross Margin 35.2 72.0 103.2 125.6 142.4 144.0 140.0
% of Sales 80% 80% 80% 80% 80% 80% 80%
Sales Force Cost 65.0 56.7 45.2 33.0 31.2 25.2 24.5
Advertising & Promotion 25.0 20.3 16.1 11.8 11.1 9.0 8.8
Medical Expense 5.0 4.1 3.2 2.4 2.2 1.8 1.8
Total Selling Expense 95.0 81.0 64.5 47.1 44.5 36.0 35.0
% of Sales 216% 90% 50% 30% 25% 20% 20%
Product Contribution Margin -59.8 -9.0 38.7 78.5 97.9 108.0 105.0
% of Sales -136% -10% 30% 50% 55% 60% 60%
Cumulative Contribution -59.8 -68.8 -30.1 48.4 146.3 254.3 359.3
EPICENTER Consulting LLC Copyright © All rights reserved 2011
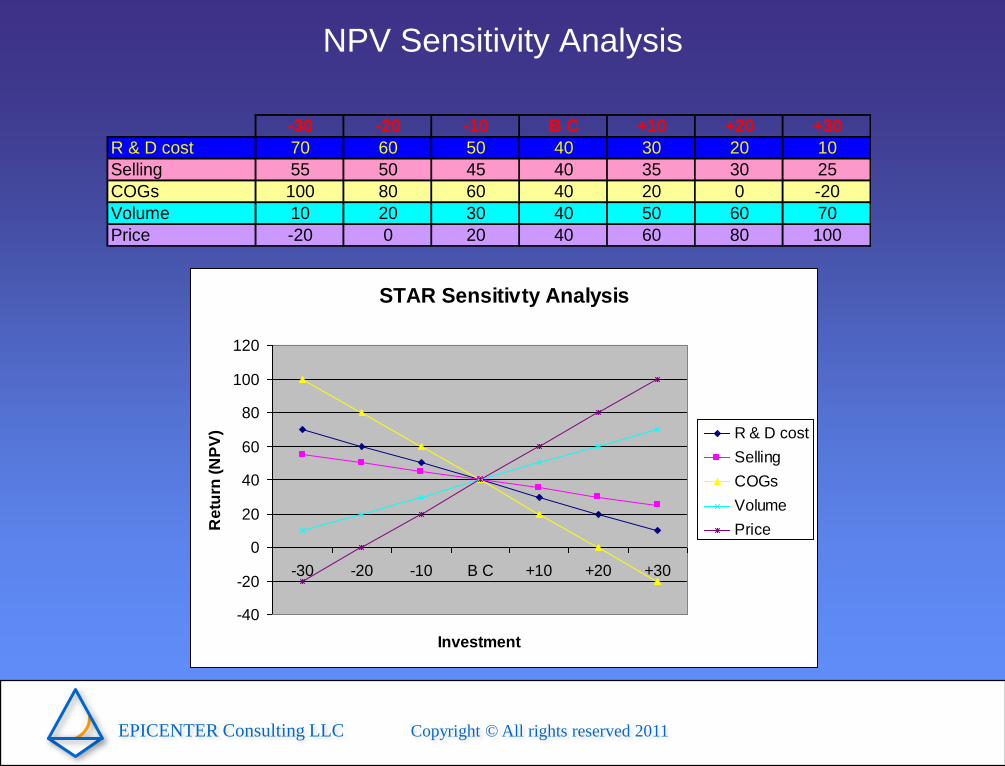
NPV Sensitivity Analysis
STAR Sensitivty Analysis
-40
-20
0
20
40
60
80
100
120
-30 -20 -10 B C +10 +20 +30
Investment
Re
turn
(N
PV
) R & D cost
Selling
COGs
Volume
Price
-30 -20 -10 B C +10 +20 +30
R & D cost 70 60 50 40 30 20 10
Selling 55 50 45 40 35 30 25
COGs 100 80 60 40 20 0 -20
Volume 10 20 30 40 50 60 70
Price -20 0 20 40 60 80 100
EPICENTER Consulting LLC Copyright © All rights reserved 2011
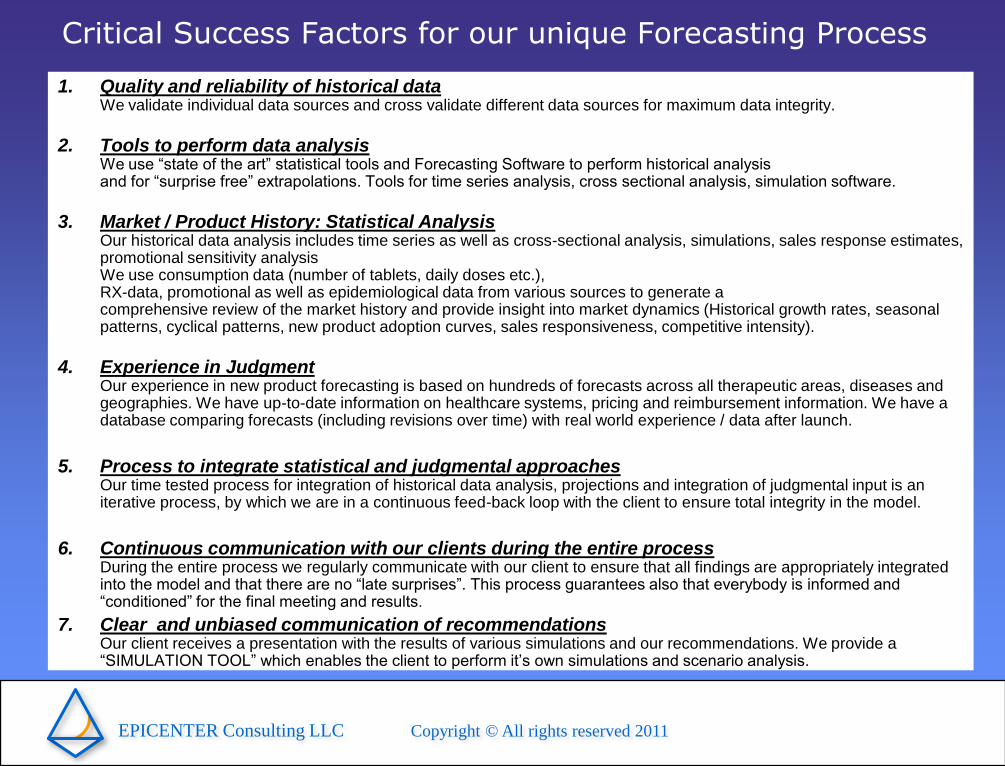
Critical Success Factors for our unique Forecasting Process
1. Quality and reliability of historical dataWe validate individual data sources and cross validate different data sources for maximum data integrity.
2. Tools to perform data analysisWe use “state of the art” statistical tools and Forecasting Software to perform historical analysis and for “surprise free” extrapolations. Tools for time series analysis, cross sectional analysis, simulation software.
3. Market / Product History: Statistical AnalysisOur historical data analysis includes time series as well as cross-sectional analysis, simulations, sales response estimates, promotional sensitivity analysisWe use consumption data (number of tablets, daily doses etc.), RX-data, promotional as well as epidemiological data from various sources to generate a comprehensive review of the market history and provide insight into market dynamics (Historical growth rates, seasonal patterns, cyclical patterns, new product adoption curves, sales responsiveness, competitive intensity).
4. Experience in JudgmentOur experience in new product forecasting is based on hundreds of forecasts across all therapeutic areas, diseases and geographies. We have up-to-date information on healthcare systems, pricing and reimbursement information. We have a database comparing forecasts (including revisions over time) with real world experience / data after launch.
5. Process to integrate statistical and judgmental approachesOur time tested process for integration of historical data analysis, projections and integration of judgmental input is an iterative process, by which we are in a continuous feed-back loop with the client to ensure total integrity in the model.
6. Continuous communication with our clients during the entire processDuring the entire process we regularly communicate with our client to ensure that all findings are appropriately integrated into the model and that there are no “late surprises”. This process guarantees also that everybody is informed and “conditioned” for the final meeting and results.
7. Clear and unbiased communication of recommendationsOur client receives a presentation with the results of various simulations and our recommendations. We provide a “SIMULATION TOOL” which enables the client to perform it’s own simulations and scenario analysis.
EPICENTER Consulting LLC Copyright © All rights reserved 2011
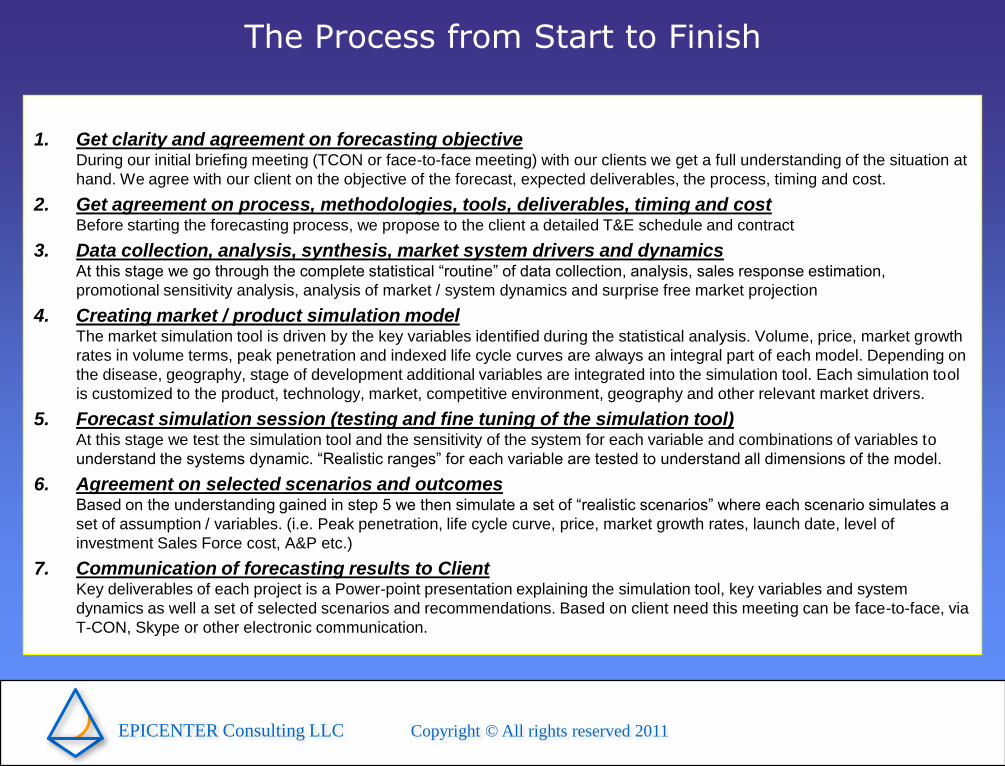
The Process from Start to Finish
1. Get clarity and agreement on forecasting objectiveDuring our initial briefing meeting (TCON or face-to-face meeting) with our clients we get a full understanding of the situation at
hand. We agree with our client on the objective of the forecast, expected deliverables, the process, timing and cost.
2. Get agreement on process, methodologies, tools, deliverables, timing and costBefore starting the forecasting process, we propose to the client a detailed T&E schedule and contract
3. Data collection, analysis, synthesis, market system drivers and dynamicsAt this stage we go through the complete statistical “routine” of data collection, analysis, sales response estimation,
promotional sensitivity analysis, analysis of market / system dynamics and surprise free market projection
4. Creating market / product simulation modelThe market simulation tool is driven by the key variables identified during the statistical analysis. Volume, price, market growth
rates in volume terms, peak penetration and indexed life cycle curves are always an integral part of each model. Depending on
the disease, geography, stage of development additional variables are integrated into the simulation tool. Each simulation tool
is customized to the product, technology, market, competitive environment, geography and other relevant market drivers.
5. Forecast simulation session (testing and fine tuning of the simulation tool)At this stage we test the simulation tool and the sensitivity of the system for each variable and combinations of variables to
understand the systems dynamic. “Realistic ranges” for each variable are tested to understand all dimensions of the model.
6. Agreement on selected scenarios and outcomesBased on the understanding gained in step 5 we then simulate a set of “realistic scenarios” where each scenario simulates a
set of assumption / variables. (i.e. Peak penetration, life cycle curve, price, market growth rates, launch date, level of
investment Sales Force cost, A&P etc.)
7. Communication of forecasting results to ClientKey deliverables of each project is a Power-point presentation explaining the simulation tool, key variables and system
dynamics as well a set of selected scenarios and recommendations. Based on client need this meeting can be face-to-face, via
T-CON, Skype or other electronic communication.
EPICENTER Consulting LLC Copyright © All rights reserved 2011
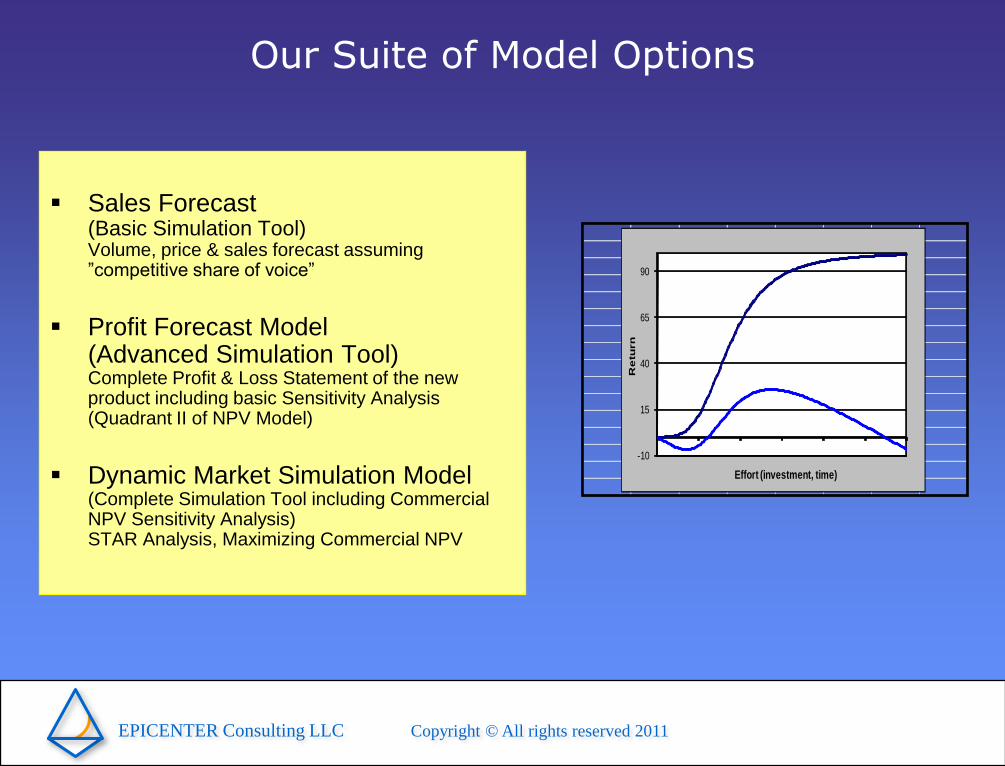
Our Suite of Model Options
Sales Forecast (Basic Simulation Tool)Volume, price & sales forecast assuming ”competitive share of voice”
Profit Forecast Model (Advanced Simulation Tool)Complete Profit & Loss Statement of the new product including basic Sensitivity Analysis (Quadrant II of NPV Model)
Dynamic Market Simulation Model(Complete Simulation Tool including Commercial NPV Sensitivity Analysis)STAR Analysis, Maximizing Commercial NPV
-10
15
40
65
90
Re
turn
Effort (investment, time)