for the - qazathletics.kz · biomechanical report for the triple jump men’s dr catherine tucker,...
TRANSCRIPT

BIOMECHANICAL REPORT FOR THE
Triple Jump Men’s
Dr Catherine Tucker, Dr Gareth Nicholson, Mark Cooke and Dr Athanassios Bissas
Carnegie School of Sport
Stéphane Merlino IAAF Project Leader

Event Directors Dr Catherine Tucker Mark Cooke
Dr Gareth Nicholson
Project Director Dr Athanassios Bissas
Project Coordinator Louise Sutton
Senior Technical Support Liam Gallagher Aaron Thomas Liam Thomas
Senior Research Officer Josh Walker
Report Editor Dr Catherine Tucker
Analysis Support Dr Lysander Pollitt
Logistics Dr Zoe Rutherford
Calibration Dr Brian Hanley
Data Management Nils Jongerius
Technical Support Ashley Grindrod
Joshua Rowe Ruth O’Faolain Lewis Lawton
Joe Sails
Dr Catherine Tucker
Data Analysts Philip McMorris
Mark Cooke
Dr Tim Bennett
Project Team Dr Alex Dinsdale
Helen Gravestock
Masalela Gaesenngwe Mike Hopkinson
Emily Gregg Parag Parelkar
Rachael Bradley
Jamie French Maria van Mierlo James Webber Jessica Wilson
Amy Brightmore Callum Guest
Dr Ian Richards Jack Whiteside
Lara Wilson
Helen Davey Ruan Jones
William Shaw Dr Emily Williams
Dr Stephen Zwolinsky
External Coaching Consultant Toni Minichiello

Table of Contents
INTRODUCTION 1
METHODS 2
RESULTS 6
Overall analysis 6
Hop, step and jump analysis 12
Landing analysis 17
COACH’S COMMENTARY 18
CONTRIBUTORS 20
Figures
Figure 1. Camera locations within the stadium for the men’s triple jump final (shown in green). 2
Figure 2. The calibration frame was constructed and filmed before and after the competition. 3
Figure 3. The last two steps before the take-off board in the triple jump. 3
Figure 4. Relative percentage of hop, step and jump lengths (relative to effective distance) along with step length in metres. 8
Figure 5. Change in horizontal velocity of the two steps before the take-off board and the hop, step and jump for the top 6 finishers. 9
Figure 6. Change in horizontal velocity of the two steps before the take-off board and the hop, step and jump for the bottom 6 finishers. 9
Figure 7. Contact and flight times for the hop phase of the triple jump for all finalists. 10
Figure 8. Contact and flight times for the step phase of the triple jump for all finalists. 10
Figure 9. Contact and flight times for the jump phase of the triple jump for all finalists. 11
Figure 10. The change in horizontal velocity for the hop, step and jump for each finalist. 13
Figure 11. Take-off angle in the hop, step and jump for the top 6 finalists. 14
Figure 12. Take-off angle in the hop, step and jump for the bottom 6 finalists. 14
Figure 13. The landing distances for each finalist in the men’s triple jump. 17

Tables
Table 1. Definition of variables analysed in the triple jump final. 4
Table 2. Competition results in comparison with athletes’ personal bests (PB) and season's bests (SB) for 2017 (before World Championships). 6
Table 3. Distance characteristics of the individual best jumps. 7
Table 4. Step length data for the two steps before the take-off board and the hop, step and jump. 7
Table 5. Relative percentage of the hop, step and jump to overall effective distance and the technique employed. 8
Table 6. Step times for the two steps before the take-off board and the hop, step and jump. 11
Table 7. Horizontal and vertical velocities at take-off of the hop, step and jump. 12
Table 8. CM height lowering during the hop, step and jump. 12
Table 9. Minimum knee angle during the contact phases of hop, step and jump. 15
Table 10. Changes in trunk angle during touchdown (TD) and take-off (TO) of the hop, step and jump. 15
Table 11. Thigh angle at take-off and mean thigh angular velocity of the swing leg (during the contact phase) for the hop, step and jump. 16
Table 12. Landing characteristics in the men's triple jump final. 17

1
INTRODUCTION
The men’s triple jump finals took place on the night of August 10th in warm and still weather
conditions. Coming into the final, Christian Taylor and Will Claye, both of the USA, were strong
contenders given their season leading performances. The final was a battle between the two
Americans for the gold. Taylor’s third round jump of 17.68 metres in response to Claye’s jump of
17.63 metres was enough to win him the gold medal. Claye’s jump was enough to secure the
silver medal position. Portugal’s Nelson Évora earned the bronze medal with a third round jump
of 17.19 metres.

2
METHODS
Seven vantage locations for camera placement were identified and secured. These locations
were situated in the stand along the back straight in line with the runway. A calibration procedure
was conducted before and after each competition. A rigid cuboid calibration frame was positioned
on the run up area multiple times over discrete predefined areas along the runway to ensure an
accurate definition of a volume within which athletes were achieving running their last two steps
before the take-off board and their hop, step and jump.
Figure 1. Camera locations within the stadium for the men’s triple jump final (shown in green).
Nine cameras were used to record the action during the triple jump final. Three Sony PXW-FS5
cameras operating at 200 Hz (shutter speed: 1/1750; ISO: 2500; FHD: 1920x1080 px) were used
to capture the motion of athletes as they were moving through the calibrated area of the run-up
to the take-off board. Six Canon EOS 700D cameras operating at 60 Hz (shutter speed: 1/1000;
ISO: 1600; SHD: 1280x720 px) were positioned in line with the runway to capture the kinematics
of the hop, step and jump sections of the triple jump including landing. These cameras operated
in pairs to capture these zones of movement for the athletes.
The video files were imported into SIMI Motion (SIMI Motion version 9.2.2, Simi Reality Motion
Systems GmbH, Germany) and were manually digitised by a single experienced operator to
obtain kinematic data. An event synchronisation technique (synchronisation of four critical

3
instants) was applied through SIMI Motion to synchronise the two-dimensional coordinates from
each camera involved in the recording. Digitising started 15 frames before the beginning of the
step and completed 15 frames after to provide padding during filtering. Each file was first digitised
frame by frame and upon completion adjustments were made as necessary using the points over
frame method, where each point (e.g. right knee joint) was tracked through the entire sequence.
The Direct Linear Transformation (DLT) algorithm was used to reconstruct the three-dimensional
(3D) coordinates from individual camera’s x and y image coordinates. Reliability of the digitising
process was estimated by repeated digitising of one jump with an intervening period of 48 hours.
The results showed minimal systematic and random errors and therefore confirmed the high
reliability of the digitising process. De Leva’s (1996) body segment parameter models were used
to obtain data for the whole body centre of mass (CM). A recursive second-order, low-pass
Butterworth digital filter (zero phase-lag) was employed to filter the raw coordinate data. The cut-
off frequencies were calculated using residual analysis.
Figure 2. The calibration frame was constructed and filmed before and after the competition.
Figure 3. The last two steps before the take-off board in the triple jump.
Last step 2nd last step

4
Table 1. Definition of variables analysed in the triple jump final.
Variable Definition
Official distance The official distance published in the results.
Effective distance The distance from the foot tip at take-off to the
mark in the sand that is closest to the take-off
board.
Take-off loss The distance from the foot tip (take-off foot) to
the front edge of the take-off board.
Step length (2nd last and last step before take-off board)
The length of the second-last and last
approach steps before the take-off board
measured from the foot tip in each step to the
next foot tip.
Step length (hop, step and jump) The length of the hop, step and jump as
measured from the foot tip in each step to the
next foot tip.
Relative step length (hop, step and jump) The percentage length of the hop, step and
jump relative to the effective distance.
Velocity (2nd last and last step before take-off, hop, step and jump)
The mean horizontal (anteroposterior) centre
of mass (CM) velocity of the athlete measured
during the last two steps before the take-off
board as well as the hop step and jump. The
horizontal velocity was also measured at the
instant of take-off of the hop, step and jump.
Vertical velocity (hop, step and jump) The athlete’s vertical CM velocity at the instant
of take-off of the hop, step and jump.
Change in horizontal velocity (hop, step and jump)
The difference between the horizontal velocity
at take-off for the hop, step and jump, relative
to the value at toe-off of the preceding step.
Contact time (hop, step and jump) The time spent in contact during the support
phase of the hop, step and jump.
Trunk angle The angle of the trunk relative to the horizontal
and considered to be 90° in the upright
position measured at touchdown (TD) and
take-off (TO) of the hop, step and jump contact

5
phases. This was also measured at instant of
landing.
Take-off angle The angle of the athlete’s CM at take-off
relative to the horizontal of the hop, step and
jump.
Knee angle The angle between the thigh and lower leg and
considered to be 180° in the anatomical
standing position. This was measured when it
reached its minimum during contact of the
hop, step and jump. It was also measured at
the instant of landing.
Thigh angle of swing leg The angle of the thigh of the swinging leg
measured from the horizontal at take-off of the
hop, step and jump.
Thigh angular velocity of swing leg The mean angular velocity of the thigh of the
swinging leg from initial contact to take-off of
the hop, step and jump.
CM lowering (hop, step and jump) The reduction in CM height from take-off of the
last step to the minimum CM height during the
contact phases of the hop, step and jump.
Hip angle The angle between the trunk and thigh and
considered to be 180° in the anatomical
standing position. This was measured at the
instant of landing.
Landing distance The distance from the athlete’s heel to the
centre of mass at the first contact in the pit.
Landing loss The distance between the first contact point in
the sand and the point to which the
measurement was made. A value of zero
indicates no landing loss.
Note: CM = centre of mass.

6
RESULTS
Overall analysis
Table 2 below provides the official recorded distance of each athlete along with its comparison
with their personal and season best. Copello was the only athlete to jump a season’s best,
improving on his previous best by 6 centimetres.
Table 2. Competition results in comparison with athletes’ personal bests (PB) and season's bests (SB) for 2017 (before World Championships).
Athlete Rank Official
distance (m)
SB (2017) (m)
Comparison with SB (m) PB (m) Comparison
with PB (m)
TAYLOR 1 17.68 18.11 −0.43 18.21 −0.53
CLAYE 2 17.63 17.91 −0.28 17.91 −0.28
ÉVORA 3 17.19 17.20 −0.01 17.74 −0.55
BENARD 4 17.16 17.48 −0.32 17.48 −0.32
COPELLO 5 17.16 17.10 0.06 17.68 −0.52
NÁPOLES 6 17.16 17.27 −0.11 17.27 −0.11
DÍAZ 7 17.13 17.40 −0.27 17.40 −0.27
PONTVIANNE 8 16.79 17.13 −0.34 17.13 −0.34
WU 9 16.66 17.18 −0.52 17.18 −0.52
TORRIJOS* 10 16.60 16.96 −0.36 17.04 −0.44
DURANONA 11 16.42 17.02 −0.60 17.20 −0.78
MARTÍNEZ 12 16.25 17.07 −0.82 17.24 −0.99 Note: Negative values represent a shorter jump in the World Championship final compared with the PB and SB.
*Each athlete’s best jump was analysed, except for Torrijos, whose second-best attempt was analysed.

7
Table 3 provides some distance characteristics of each athlete’s best jumps in relation to their
effective distance and distance lost at the take-off board. The smallest loss at the take-off board
was by Duranona with no loss, and the largest loss was by Martínez with a loss of 17 centimetres.
The mean loss was 7 centimetres. Table 4 below shows the step lengths of each finalist for the
last two steps before the take-off board, the hop, step and jump.
Table 3. Distance characteristics of the individual best jumps.
Athlete Analysed attempt
Official distance (m)
Effective distance (m)
Take-off loss (m)
TAYLOR 3 17.68 17.79 0.11
CLAYE 3 17.63 17.74 0.11
ÉVORA 2 17.19 17.21 0.02
BENARD 6 17.16 17.21 0.05
COPELLO 1 17.16 17.18 0.02
NÁPOLES 3 17.16 17.17 0.01
DÍAZ 1 17.13 17.15 0.02
PONTVIANNE 3 16.79 16.94 0.15
WU 2 16.66 16.74 0.08
TORRIJOS 3 16.53 16.65 0.12
DURANONA 1 16.42 16.42 0.00
MARTÍNEZ 2 16.25 16.42 0.17
Table 4. Step length data for the two steps before the take-off board and the hop, step and jump.
Athlete 2nd last (m) Last (m) Hop (m) Step (m) Jump (m)
TAYLOR 2.37 2.11 5.83 5.56 6.40
CLAYE 2.46 2.30 6.11 5.33 6.30
ÉVORA 2.11 2.03 6.15 5.14 5.92
BENARD 2.48 2.36 6.22 5.11 5.88
COPELLO 2.50 2.31 5.89 5.29 6.00
NÁPOLES 2.40 2.43 6.00 5.28 5.89
DÍAZ 2.32 2.31 6.25 4.83 6.07
PONTVIANNE 2.25 2.20 5.80 4.94 6.20
WU 2.29 2.49 5.99 4.09 6.66
TORRIJOS 2.23 2.13 5.94 4.88 5.83
DURANONA 2.40 2.38 6.15 4.78 5.49
MARTÍNEZ 2.42 2.15 5.93 4.60 5.89 Note: The hop, step and jump distances were provided by deltatre.

8
Table 5 and Figure 4 illustrate the contribution of the hop, step and jump (relative percentage) to
the effective distance. Table 4 also shows the technique used by each athlete (classified as either
hop- or jump-dominated if the difference in relative percentage of the hop and jump was greater
than 2%).
Table 5. Relative percentage of the hop, step and jump to overall effective distance and the technique employed.
Athlete Hop (%) Step (%) Jump (%) Technique
TAYLOR 32.8 31.3 36.0 Jump-dominated CLAYE 34.4 30.0 35.5 Balanced ÉVORA 35.7 29.9 34.4 Balanced BENARD 36.1 29.7 34.2 Balanced COPELLO 34.3 30.8 34.9 Balanced NÁPOLES 34.9 30.8 34.3 Balanced DÍAZ 36.4 28.2 35.4 Balanced PONTVIANNE 34.2 29.2 36.6 Jump-dominated WU 35.8 24.4 39.8 Jump-dominated TORRIJOS 35.7 29.3 35.0 Balanced DURANONA 37.5 29.1 33.4 Hop-dominated MARTÍNEZ 36.1 28.0 35.9 Balanced
Note: Percentages might not add up to 100% because of rounding.
Figure 4. Relative percentage of hop, step and jump lengths (relative to effective distance) along with step length in metres.
5.83 m
6.11 m
6.15 m
6.22 m
5.89 m
6.00 m
6.25 m
5.80 m
5.99 m
5.94 m
6.15 m
5.93 m
5.56 m
5.33 m
5.14 m
5.11 m
5.29 m
5.28 m
4.83 m
4.94 m
4.09 m
4.88 m
4.78 m
4.60 m
6.40 m
6.30 m
5.92 m
5.88 m
6.00 m
5.89 m
6.07 m
6.20 m
6.66 m
5.83 m
5.49 m
5.89 m
0% 10% 20% 30% 40% 50% 60% 70% 80% 90% 100%
TAYLOR
CLAYE
ÉVORA
BENARD
COPELLO
NÁPOLES
DÍAZ
PONTVIANNE
WU
TORRIJOS
DURANONA
MARTÍNEZ
Hop Step Jump

9
Figures 5 and 6 show the change in velocities across the two steps before the take-off board, the
hop, the step and jump. The mean horizontal velocity for the second-last step before the take-off
board was 9.78 m/s and the last step before the take-off board was 9.81 m/s. The mean horizontal
velocity for the hop was 9.30 m/s, the step was 8.42 m/s and the jump was 7.03 m/s.
Figure 5. Change in horizontal velocity of the two steps before the take-off board and the hop, step and jump for the top 6 finishers.
Figure 6. Change in horizontal velocity of the two steps before the take-off board and the hop, step and jump for the bottom 6 finishers.
Note: The velocities in Figures 5 and 6 include contact and flight of each phase.
2nd last step Last step Hop Step JumpTAYLOR 10.08 10.10 9.89 8.93 6.57CLAYE 10.03 9.95 9.83 8.34 7.35ÉVORA 10.58 9.60 8.97 8.01 6.73BENARD 9.76 9.91 9.50 8.22 6.72COPELLO 9.60 9.81 9.21 8.47 6.73NÁPOLES 9.42 9.81 9.18 8.00 6.65
6.00
6.50
7.00
7.50
8.00
8.50
9.00
9.50
10.00
10.50
11.00
Velo
city
(m/s
)
2nd last step Last step Hop Step JumpDÍAZ 9.08 9.50 8.87 8.15 7.11PONTVIANNE 9.78 9.76 9.18 8.84 7.73WU 10.55 10.45 9.61 9.63 8.41TORRIJOS 9.49 9.75 9.07 8.27 6.28DURANONA 9.68 9.68 9.23 7.87 6.88MARTÍNEZ 9.29 9.40 9.04 8.25 7.17
6.00
6.50
7.00
7.50
8.00
8.50
9.00
9.50
10.00
10.50
11.00
Velo
city
(m/s
)

10
Figures 7, 8 and 9 show the contact and flight times for hop, step and jump, respectively. The
medallists are highlighted in their respective medal colours. Table 6 on the next page shows the
step times for the two steps before the take-off board, the hop, step and jump.
Figure 7. Contact and flight times for the hop phase of the triple jump for all finalists.
Figure 8. Contact and flight times for the step phase of the triple jump for all finalists.
0.12
0
0.11
5
0.12
5
0.11
5
0.12
5
0.12
5
0.13
5
0.11
0
0.12
0
0.12
0
0.13
0
0.12
5
0.48
4
0.53
4
0.56
8
0.55
1
0.51
8
0.55
1
0.58
5
0.51
8
0.51
8
0.53
4
0.55
1
0.53
4
0.00
0.10
0.20
0.30
0.40
0.50
0.60
0.70
0.80
0.90
1.00TA
YLO
R
CLA
YE
ÉVO
RA
BEN
ARD
CO
PELL
O
NÁ
POLE
S
DÍA
Z
PON
TVIA
NN
E
WU
TOR
RIJ
OS
DU
RA
NO
NA
MAR
TÍN
EZ
Tim
e (s
)
Contact Flight
0.15
0
0.15
0
0.16
7
0.13
4
0.15
0
0.16
7
0.16
7
0.13
4
0.13
4
0.15
0
0.16
7
0.15
0
0.48
4
0.50
1
0.48
4
0.50
1
0.48
4
0.50
1
0.43
4
0.43
4
0.30
1
0.45
1
0.45
1
0.41
8
0.00
0.10
0.20
0.30
0.40
0.50
0.60
0.70
0.80
0.90
1.00
TAYL
OR
CLA
YE
ÉVO
RA
BEN
ARD
CO
PELL
O
NÁ
POLE
S
DÍA
Z
PON
TVIA
NN
E
WU
TOR
RIJ
OS
DU
RA
NO
NA
MAR
TÍN
EZ
Tim
e (s
)
Contact Flight

11
Figure 9. Contact and flight times for the jump phase of the triple jump for all finalists.
Table 6. Step times for the two steps before the take-off board and the hop, step and jump.
Athlete 2nd last (s) Last (s) Hop (s) Step (s) Jump (s)
TAYLOR 0.230 0.175 0.604 0.634 0.902
CLAYE 0.245 0.195 0.649 0.651 0.868
ÉVORA 0.200 0.180 0.693 0.651 0.902
BENARD 0.235 0.210 0.666 0.635 0.885
COPELLO 0.260 0.205 0.643 0.634 0.952
NÁPOLES 0.250 0.210 0.676 0.668 0.952
DÍAZ 0.235 0.210 0.720 0.601 0.869
PONTVIANNE 0.220 0.200 0.628 0.568 0.835
WU 0.210 0.215 0.638 0.435 0.851
TORRIJOS 0.225 0.185 0.654 0.601 0.801
DURANONA 0.255 0.215 0.681 0.618 0.802
MARTÍNEZ 0.235 0.205 0.659 0.568 0.852
0.18
4
0.15
0
0.18
4
0.16
7
0.18
4
0.18
4
0.18
4
0.16
7
0.15
0
0.15
0
0.18
4
0.18
4
0.71
8
0.71
8
0.71
8
0.71
8 0.76
8
0.76
8
0.68
5
0.66
8
0.70
1
0.65
1
0.61
8 0.66
8
0.00
0.10
0.20
0.30
0.40
0.50
0.60
0.70
0.80
0.90
1.00
TAYL
OR
CLA
YE
ÉVO
RA
BEN
ARD
CO
PELL
O
NÁ
POLE
S
DÍA
Z
PON
TVIA
NN
E
WU
TOR
RIJ
OS
DU
RA
NO
NA
MAR
TÍN
EZ
Tim
e (s
)
Contact Flight

12
Hop, step and jump analysis
Table 7 shows the horizontal and vertical velocities of the take-off for the hop, step and jump
phases. Table 8 shows the change in CM height for the hop, step and jump.
Table 7. Horizontal and vertical velocities at take-off of the hop, step and jump.
Hop Step Jump
Athlete Horizontal
velocity (m/s)
Vertical velocity (m/s)
Horizontal velocity (m/s)
Vertical velocity (m/s)
Horizontal velocity (m/s)
Vertical velocity (m/s)
TAYLOR 9.85 2.77 8.52 2.35 6.34 2.43 CLAYE 9.16 2.66 8.77 2.37 7.09 2.91 ÉVORA 8.84 2.88 7.85 2.75 6.26 2.75 BENARD 8.94 3.25 7.81 2.18 6.84 3.46 COPELLO 9.81 2.90 7.92 2.08 6.86 3.22 NÁPOLES 9.32 2.91 8.40 2.94 5.94 3.31 DÍAZ 9.04 3.23 8.31 2.44 6.96 2.64 PONTVIANNE 9.30 2.98 7.70 1.87 7.55 2.65 WU 9.77 2.40 8.66 1.15 8.57 2.95 TORRIJOS 9.54 2.99 8.16 2.37 7.28 2.60 DURANONA 9.13 2.98 7.33 2.34 6.65 2.21 MARTÍNEZ 9.25 3.13 8.86 2.23 6.50 2.66
Note: These instantaneous velocities for the phases have been captured at different frame rates. This should be considered when examining these velocities along with those in Figures 5 and 6.
Table 8. CM height lowering during the hop, step and jump.
Athlete Hop (cm) Step (cm) Jump (cm)
TAYLOR 1 26 18
CLAYE 6 30 16
ÉVORA 2 31 15
BENARD 2 21 19
COPELLO 7 31 18
NÁPOLES 5 25 18
DÍAZ 4 32 13
PONTVIANNE 4 27 11
WU 4 28 10
TORRIJOS 4 28 15
DURANONA 6 30 13
MARTÍNEZ 1 30 14
13
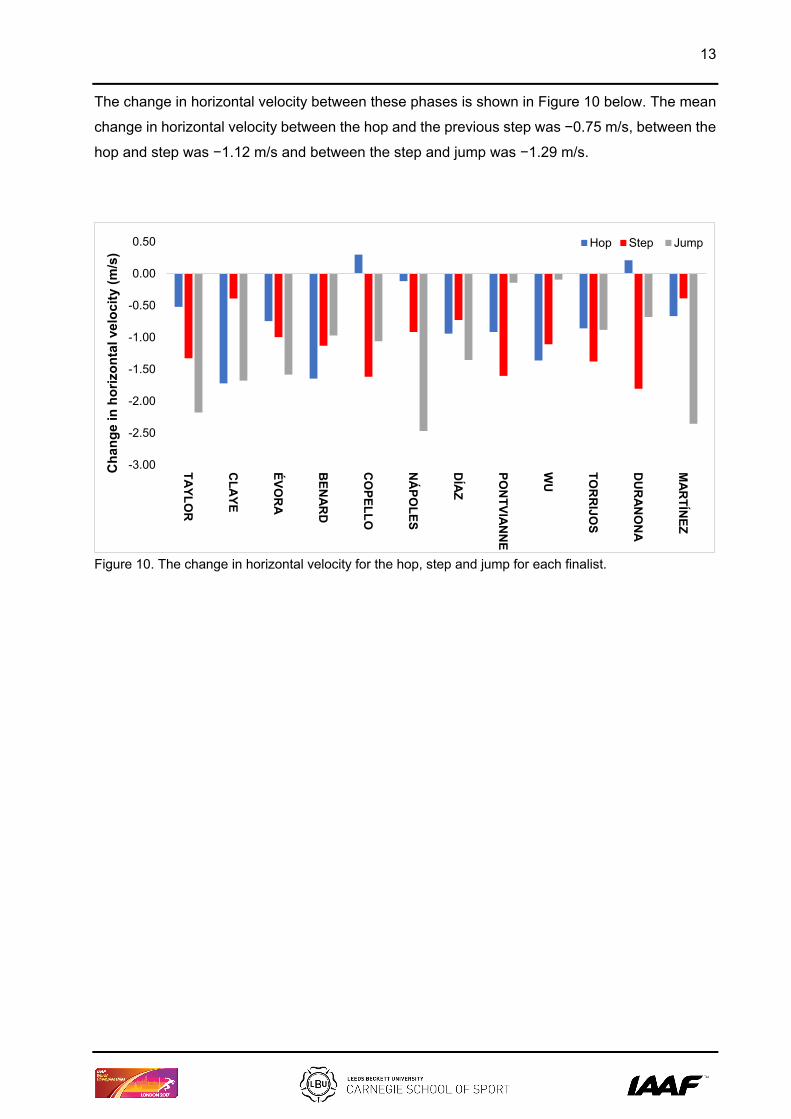
The change in horizontal velocity between these phases is shown in Figure 10 below. The mean
change in horizontal velocity between the hop and the previous step was −0.75 m/s, between the
hop and step was −1.12 m/s and between the step and jump was −1.29 m/s.
Figure 10. The change in horizontal velocity for the hop, step and jump for each finalist.
-3.00
-2.50
-2.00
-1.50
-1.00
-0.50
0.00
0.50
TAYLOR
CLAYE
ÉVOR
A
BEN
ARD
CO
PELLO
NÁ
POLES
DÍAZ
PON
TVIANN
E
WU
TOR
RIJO
S
DU
RA
NO
NA
MAR
TÍNEZ
Cha
nge
in h
oriz
onta
l vel
ocity
(m/s
)
Hop Step Jump

14
Figures 11 and 12 below show the change in take-off angle of the hop, step and jump take-off
phases. The mean take-off angle for the hop was 17.4°, for the step was 15.4° and for the jump
was 22.3°.
Figure 11. Take-off angle in the hop, step and jump for the top 6 finalists.
Figure 12. Take-off angle in the hop, step and jump for the bottom 6 finalists.
Hop Step JumpTAYLOR 15.7 15.4 21.0CLAYE 16.2 15.1 22.3ÉVORA 18.0 19.3 23.7BENARD 20.0 15.6 26.8COPELLO 16.5 14.7 25.1NÁPOLES 17.3 19.3 29.1
14
16
18
20
22
24
26
28
30
Take
-off
angl
e (°
)
Hop Step JumpDÍAZ 19.7 16.4 20.8PONTVIANNE 17.8 13.7 19.3WU 13.8 7.6 19.0TORRIJOS 17.4 16.2 19.7DURANONA 18.1 17.7 18.4MARTÍNEZ 18.7 14.1 22.3
5
7
9
11
13
15
17
19
21
23
25
Take
-off
angl
e (°
)

15
Table 9 below presents the minimum knee angle during the contact phases of the hop, step and
jump. Table 10 shows the change in trunk angle from touchdown to take-off of the hop, step and
jump.
Table 9. Minimum knee angle during the contact phases of hop, step and jump.
Athlete Hop (°) Step (°) Jump (°)
TAYLOR 151.5 125.1 135.6
CLAYE 144.1 120.0 126.4
ÉVORA 128.1 129.7 128.9
BENARD 133.1 141.6 136.8
COPELLO 146.1 119.1 131.0
NÁPOLES 119.7 130.2 137.0
DÍAZ 115.9 129.6 131.1
PONTVIANNE 139.4 137.7 120.8
WU 143.6 133.4 129.1
TORRIJOS 148.2 128.5 133.9
DURANONA 127.7 121.3 133.9
MARTÍNEZ 128.3 124.2 127.4
Table 10. Changes in trunk angle during touchdown (TD) and take-off (TO) of the hop, step and jump.
Hop Step Jump
Athlete TD (°) TO (°) TD (°) TO (°) TD (°) TO (°)
TAYLOR 87.8 83.4 89.1 85.6 92.7 75.1
CLAYE 88.3 89.1 87.5 84.2 92.4 74.8
ÉVORA 92.6 90.2 89.0 80.2 89.9 69.8
BENARD 93.3 93.9 94.4 84.9 86.3 86.3
COPELLO 89.1 89.4 84.9 85.6 88.1 72.1
NÁPOLES 88.5 80.9 89.3 80.8 95.8 76.4
DÍAZ 89.9 79.6 85.9 77.7 89.2 78.1
PONTVIANNE 86.4 91.0 93.7 83.3 98.2 85.0
WU 90.8 92.6 92.2 85.8 88.8 80.3
TORRIJOS 85.1 87.6 94.6 77.1 81.1 79.3
DURANONA 88.0 96.3 94.8 79.1 91.0 68.0
MARTÍNEZ 92.3 86.7 88.8 90.7 91.4 76.5

16
Table 11 shows the thigh angle (relative to the horizontal plane) at take-off along with the thigh
angular velocity of the swing leg during the contact phase of the hop, step and jump. The mean
thigh angle for the hop, step and jump was −22.6°, −25.7° and −20.3°, respectively. The mean
thigh angular velocity of the swing leg for the hop, step and jump was 516 °/s, 350 °/s and 346
°/s, respectively.
Table 11. Thigh angle at take-off and mean thigh angular velocity of the swing leg (during the contact phase) for the hop, step and jump.
Hop Step Jump
Athlete Thigh angle (°)
Mean thigh
angular velocity
(°/s)
Thigh angle (°)
Mean thigh
angular velocity
(°/s)
Thigh angle (°)
Mean thigh
angular velocity
(°/s)
TAYLOR −24.3 439 −16.9 392 −12.7 351
CLAYE −21.5 542 −16.9 337 −27.5 277
ÉVORA −26.7 528 −30.5 331 −14.1 326
BENARD −22.1 505 −28.8 372 −27.4 333
COPELLO −15.1 582 −28.6 346 −22.4 347
NÁPOLES −26.9 445 −19.5 355 −11.8 360
DÍAZ −20.1 530 −22.7 372 −23.0 322
PONTVIANNE −23.4 556 −39.5 241 −11.1 434
WU −18.0 538 −29.2 363 −24.6 407
TORRIJOS −34.3 436 −24.4 358 −37.4 279
DURANONA −14.8 573 −17.2 378 −15.9 367
MARTÍNEZ −24.1 570 −34.7 312 −15.1 337 Note: A negative lead thigh angle means the thigh is below the horizontal.

17
Landing analysis
Table 12 shows the angles of the trunk, hip and knee on landing with the sand. The loss in landing
is also shown. The largest landing loss was by Copello at 0.26 metres. Six other athletes also
recorded a loss on landing. The mean hip angle at landing was 78.4°. The mean knee angle was
131.2°, while the mean trunk angle was 64.6°. Figure 13 shows the landing distance by each
athlete. The mean landing distance was 0.50 metres.
Table 12. Landing characteristics in the men's triple jump final.
Athlete Hip angle (°) Knee angle (°) Trunk angle (°) Landing loss (m)
TAYLOR 81.6 128.5 71.7 0.02 CLAYE 69.9 163.7 30.7 0.11 ÉVORA 83.7 124.5 66.9 0.00 BENARD 61.3 114.4 66.9 0.06 COPELLO 72.1 101.3 78.9 0.26 NÁPOLES 83.6 121.2 74.9 0.21 DÍAZ 95.7 131.9 60.6 0.00 PONTVIANNE 64.7 141.0 60.2 0.00 WU 69.7 134.2 50.9 0.18 TORRIJOS 79.3 136.8 80.2 0.10 DURANONA 64.0 115.8 62.3 0.00 MARTÍNEZ 115.4 161.3 71.0 0.00
Figure 13. The landing distances for each finalist in the men’s triple jump.
0.51
0.55
0.39
0.68
0.40
0.49
0.56
0.54
0.42
0.45
0.54
0.49
0.00 0.10 0.20 0.30 0.40 0.50 0.60 0.70
TAYLOR
CLAYE
ÉVORA
BENARD
COPELLO
NÁPOLES
DÍAZ
PONTVIANNE
WU
TORRIJOS
DURANONA
MARTÍNEZ
Landing distance (m)

18
COACH’S COMMENTARY
Unlike other field events, in which a single, maximal effort is required, success in the triple jump
demands a series of two submaximal efforts and one maximal effort. In these efforts, athletes
must trade-off the maintenance of horizontal velocity against the generation of vertical velocity in
the hop, step and jump.
During the phases of hop, step and jump some athletes favour different approaches in terms of
effort distribution. Most of the finalists were considered to have a “balanced” technique but Taylor
displayed a “jump-dominated” technique as he is known to have, along with two others
(Pontvianne and Wu). Duranona was the only finalist have a “hop-dominated” technique. Where
Taylor had the biggest gain relative to the other finalists was in the step and jump distances. He
had the longest step (5.56 metres) and second-longest jump (6.40 metres).
The run-up to the take-off board is obviously important for creating speed. The mean velocities of
the second-last and last step before the take-off board were 9.78 m/s and 9.81 m/s, respectively.
Interestingly, the gold medallist was the only athlete to exceed 10 m/s in the last step before the
take-off board, apart from the ninth-placed Wu. Taylor had the highest hop velocity of all the
finalists at 9.89 m/s and even though he lost some velocity to the take-off of the hop (Table 7), he
had the highest value for the step distance at 5.56 metres (Figure 4).
In the hop, step and jump it is important for the athlete to maintain a stable, upright body position
overall from contact with the ground to take-off from the ground to avoid any loss in overall velocity
because of over rotation. In the men’s final, it was apparent that there was a relationship
(correlation of −0.63) between the change in trunk angle during the hop support phase and the
subsequent loss in velocity to the step. In general, those who tended to flex their trunk (angle less
than 90°) more during the hop contact had a smaller loss compared with those who extended
their trunk (Table 10). Interestingly, Claye had a very small change in trunk angle (increase of
0.8°) meaning he became slightly more upright and this led to a small loss in horizontal velocity
to the step. This might mean the strategy of extending the trunk on contact is a better ploy to
prevent an over rotation or loss of control that can lead to potential decreases in horizontal
velocity. Interestingly, some athletes choose to bring their trunk back further on initial contact to
avoid any loss of control. An example of this is when taking off for the jump phase, the top four
finishers had relatively high levels of trunk rotation (Taylor 17.6°, Claye 17.6°, Évora 20.1° and
Nápoles 19.4°) during this contact to prevent loss of velocity and also increase the angle of take-
off (the mean increase in take-off angle for these athletes between the step and jump was 10.3°).
Increasing the extension of the trunk backwards on contact to prevent over rotation is something
that the world record holder, Jonathon Edwards, said he prioritised during his record-breaking
jump in 1995.

19
Control on landing is also crucial to maximising the distance achieve in the triple jump. The landing
analysis shows that the Claye lost 11 centimetres on landing from falling back. He landed in a
position that was very flexed at the trunk (30.7°) compared with the other medallists of Taylor
(71.7°) and Évora (66.9°). This loss of control on landing could have cost Claye a gold medal
given he was only 5 centimetres back from Taylor overall. The largest loss on landing was by
fifth-placed Copello with a loss of 26 centimetres meaning a potential loss of a medal position for
him. This is something for him to work on in ensuring that. Perhaps increasing his hip flexion on
landing will help him avoid this loss of forward momentum.

20
CONTRIBUTORS
Dr Catherine Tucker is a Senior Lecturer in Sport and
Exercise Biomechanics at Leeds Beckett University.
Catherine graduated with First Class Honours in Sport and
Exercise Sciences from the University of Limerick and
subsequently completed a PhD in sports biomechanics, also
at the University of Limerick. Catherine’s main research
interests centre on the biomechanics of striking movements,
particularly golf. She is also interested in movement
variability with respect to gait and how it relates to movement
outcome / injury reduction.
Dr Gareth Nicholson is a Senior Lecturer in Sport and
Exercise Biomechanics at Leeds Beckett University and is
Course Leader for the MSc Sport & Exercise Biomechanics
pathway. Gareth has First Class Honours in BSc Sport and
Exercise Science as well as an MSc in Sport & Exercise
Science and a PhD from Leeds Beckett University. Gareth’s
research interests are in the measurement and development
of strength and power. Gareth currently supervises a range
of health and performance-related research projects.
Mark Cooke is a Lecturer in Sport and Exercise
Biomechanics at Leeds Beckett University. Mark has First
Class Honours in BSc Sport and Exercise Science and is
currently doing a PhD at Leeds Beckett University evaluating
the use of intermittent normobaric hypoxia as a means of pre-
acclimatisation. Mark’s research interests also include the
design and development of equipment to enable participation
in outdoor and adventures activities for individuals with
movement difficulties.

21
Dr Athanassios Bissas is the Head of the Biomechanics
Department in the Carnegie School of Sport at Leeds Beckett
University. His research includes a range of topics but his
main expertise is in the areas of biomechanics of sprint
running, neuromuscular adaptations to resistance training,
and measurement and evaluation of strength and power. Dr
Bissas has supervised a vast range of research projects
whilst having a number of successful completions at PhD
level. Together with his team he has produced over 100
research outputs and he is actively involved in research
projects with institutions across Europe.
Toni Minichiello is a coach for British Athletics. He has
worked with a number of elite and senior athletes, most
notably Olympic gold medallist and triple World Champion
Jessica Ennis-Hill, whom he coached from the age of 15
years old. In 2012, Toni won the BBC Sports Personality of
the Year Coach Award. Toni has also been awarded the
accolade of UK Sports Coach of the Year and was inducted
into the Fellowship of Elite Coaches in 2014.