for personal use only...the redcliffe, perth property, with its single term of 20 years not expiring...
TRANSCRIPT
ANNUAL REPORT
2019
For
per
sona
l use
onl
y
1
For
per
sona
l use
onl
y

2
Coventry Group Ltd and its controlled entities
Contents
Chairman's Report 3
Chief Executive Officer's Report 5
Consolidated statement of profit or loss 9
Consolidated statement of comprehensive income 10
Consolidated statement of financial position 11
Consolidated statement of changes in equity 12
Consolidated statement of cash flows 13
Notes to the consolidated financial statements:
1. Significant accounting policies 14
2. Operating segments 20
3. Business Combination 21
4. Discontinued operation 23
5. Auditor's remuneration 24
6. Employment costs 24
7. Finance income and finance expenses 24
8. Taxes 24
9. Earnings per share 25
10. Cash and cash equivalents 25
11. Trade and other receivables 26
12. Inventories 26
13. Parent entity disclosures 26
14. Property, plant and equipment 27
15. Intangible assets 27
16. Impairment of non-financial assets 27
17. Trade and other payables 28
18. Interest-bearing loans and borrowings 28
19. Share-based payments 28
20. Capital and reserves 28
21. Financial risk management 29
22. Operating leases 32
23. Controlled entities 33
24. Reconciliation of cash flows from operating activities 33
25. Related parties 33
26. Change in accounting policies 34
27. Events occurring after the reporting period 36
Directors' Report 37
Directors' Declaration 47
Auditor's Independence Declaration 48
Auditor's Report 49
Shareholder Information 54
Corporate Directory 55
For
per
sona
l use
onl
y

3
Chairman’s Report
Two years into a turnaround under the stewardship of our CEO and Managing Director, Robert Bulluss, I am pleased to report a return to underlying profitability for the Group. This is the first time I have been able to do so during my tenure as Chairman. Getting us to this point in the turnaround Robert has not acted alone with the Group being well served by a professional and well credentialed Executive Leadership Team whose members are now, deservedly, beginning to experience the satisfaction of working in a business with momentum and with improving financial results. The improved financial performance in 2019 would not have been achieved without two transformational acquisitions which fast-tracked that improvement. On 26 September 2018 we announced a fully underwritten $15m equity raising to fund the acquisition of Torque Industries. On 5 February 2019 we announced a fully underwritten $27.6m equity raising in order to fund the acquisition of Nubco Proprietary Limited. We at Coventry have been greatly encouraged and motivated by the support demonstrated by a range of existing and new shareholders in both equity raisings. We are extremely grateful for the support we have received. The CEO will expand on the successful integration of Torque and Nubco into the broader Group in his report. An underlying EBIT of $1.1m in 2019 represents a turnaround in the order of $13.6m from our base year of 2017 and all our plans are geared to considerable improvement in 2020. The 2017 base year marked the pivotal appointment of our CEO in May 2017 but alsomarked very grim annual financial results with sales from continuing operations sinking to $151.0m and a statutory loss after tax of $37.7m. What a difference two years and a substantial strategy re-set under new leadership makes. A $13.6m EBIT turnaround in 2 years and a great business saved!!
Fluid Systems has performed strongly in 2019 and the addition of Torque Industries introduced revenue diversification outside the resources sector and identified a number of growth opportunities. Fluid Systems continues to be well led with a stable and experienced team which can now add a successful acquisition integration to its list of achievements.
Trade Distribution, comprises our Australian and New Zealand network of Konnect, Artia and newly acquired Nubco branches, which are serviced by a number of distribution centres.
Our New Zealand network is very well led and has performed strongly in 2019 producing year on year sales and contribution growth.
Our new Australian Nubco network has produced sales and profitability in line with expectations since acquisition.
Our Australian network of Konnect and Artia branches has improved year on year but it did not achieve the breakeven or better result we were looking for. It has been well documented previously how badly broken this business was but the $4.0m improvement in contribution achieved since 2017 reinforces that our strategy now is correct even if our timing was a little ambitious. All our plans are geared to a return to profitability in 2020. We have great expectations for this part of the business as in our opinion it provides the single biggest internal growth opportunity. This network has been reinvigorated by our new General Manager, Peter Shaw who brings to the Group wisdom and experience gained at Worksense Workwear & Safety, Wesfarmers Industrial & Safety and Total Fasteners. In addition, we have been fortunate in the calibre of people recruited into, and in some cases re-joining, the business. This is all part of the momentum I mentioned earlier in this report and, speaking from personal experience, it is motivating, stimulating and rewarding to be part of a well led dynamic business. It remains our number one priority to restore profitability to this part of the business and in time restore it as a material contributor to the profitability of the Group.
As evidenced with Torque and Nubco in 2019, acquisitions form part of our growth strategy for the Group. Opportunities continue to arise and they are assessed, initially by our CEO and CFO against strict criteria. Into the foreseeable future acquisitions will be funded by debt and cash flow.
The Executive and Director Incentive Plan approved at the 2017 Annual General Meeting of the Company provides for the granting or issuing of performance rights to eligible Executives in accordance with its terms and subject to the terms and performance hurdles set by the Board. Mr Bulluss’s total remuneration includes a Plan award and, as required by the ASX Listing Rules, the Company will seek shareholder approval to grant him Performance Rights for his participation in the Plan for 2020. Full particulars will be published in the Notice of Annual General Meeting for the meeting to be held on 25 October 2019.
The Redcliffe, Perth property, with its single term of 20 years not expiring until 2027, is not fully sub-let. This matter continues to be actively managed by our experienced Property Manager, supported by local real estate resources.
The Group continues to have a strong working capital position with Current Assets exceeding Current Liabilities by $50.8m. Net debt at financial year end was $4.1m. The Group has substantial Australian tax losses in the order of $71.9m for which no deferred tax asset is recognised in its Statement of Financial Position.
On behalf of the Board my sincere thanks go to the CEO, the Executive Leadership Team and all our colleagues throughout the business for their commitment to our values and the impact their efforts are having on the turnaround efforts in progress at Coventry.
For
per
sona
l use
onl
y

4
Outlook
All our plans are geared to sustainable profitable growth for the Group with expectations for EBITDA in 2020 of greater than $10m. That outcome will require continuation of the current momentum, effective execution of our plans and the markets in which we operate to remain buoyant.
The board has determined that no final dividend will be paid. Looking ahead the Board will assess the Company’s ability to pay dividends against earnings and the financial position of the business. If EBITDA guidance is met for 2020 the board expects the Company will be in a position to pay a dividend in relation to that period.
Neil G. Cathie Chairman of the Board of Directors
For
per
sona
l use
onl
y

5
Chief Executive Officer’s Report
The Group’s performance improved in FY19 and is largely progressing to plan towards sustainable profitable growth. We are pleased to report that the Group has returned to a profitable position in FY19 for EBITDA and EBIT. This is proof that our strategic plan, people, strong value proposition and dedication to our core values are delivering results. Combined with two excellent acquisitions, the Group has produced an EBIT turnaround of $13.6m in two years.
The health, safety and wellbeing of our people is our number one priority. During the year, we had 8 Lost Time Injuries (LTI’s) and whilst the people returned to work in a short time frame, we are disappointed in this result. Our reporting systems are providing us with valuable insights into the root causes of these incidents and action is being taken to prevent future occurrences. Our aspiration is for zero LTI’s.
Along with our customers and suppliers we focus on our people. Delivering on our core values of Respect, Fairness, Teamwork,Professionalism and Integrity, is improving our culture and turning Coventry into a satisfying and rewarding environment in which to work. I am proud that the Group has an unwavering commitment to human rights, equality, diversity, anti-discrimination and flexibility in the workplace. Diversity in our business without doubt delivers better overall commercial and financial outcomes. Our employee Net Promotor Score improved again during the year to +16.1 (-31.2 FY17). Our voluntary employee turnover has reduced significantly to sustainable levels. These KPI’s provide evidence of an improved culture and progress towards becoming an employer of choice. The higher employee retention rates are a critical success factor for delivering sustainable profitable growth. We are building training and development capability and this year Fluid Systems (FS) launched Cooper Built learning. Together with Outsource Institute Technology (OIT) we are a delivering a Certificate IV in engineering – Fluid Power to a number of our people. Many other initiatives are being implemented to improve our culture and work environment.
During the year we added additional capability into our experienced Executive Leadership Team (ELT) with the appointments of Peter Shaw (General Manager – Konnect and Artia Australia), Ken Lam (Chief Information Officer) and Paul Krawczyk (General Manager – Nubco). The ELT work closely together to develop and deliver the Group’s strategic plan for sustainable profitable growth.
Our focus on the customer by providing service excellence through quality products, stock availability, expertise, agility and our geographic coverage is delivering sales growth. Margin improvement programs, supplier engagement and cost reductions from theDistribution Centre (DC) optimisation project have also contributed to improved financial performance.
We engage closely with our suppliers to ensure we grow profitably together with aligned strategies. Our supplier relationships continue to improve and in many cases we have been able to negotiate improved trading terms.
During the year the Information Technology function was relocated to Melbourne from Perth under Ken Lam’s guidance. The new team is delivering on business optimisation projects and is playing a key role in the delivery of our Digital Customer Engagement (DCE) project. DCE will provide on-line and mobility solutions for customers as well as a Customer Relationship Management (CRM) system and a user-friendly Point of Sale (POS) module. Legacy hardware and software concerns are also being resolved.
Our central services teams (HR and Safety, Finance, Accounts Payable and Accounts Receivable) have built capability to support the business divisions as the Group returns to sustainable profitable growth.
Trade Distribution (TD) comprises Konnect and Artia Australia (KAA), Konnect and Artia New Zealand (KANZ) and Nubco.
We are making steady progress with the turnaround of the KAA business. Our aim is to achieve sustainable profitable growth through sales development on the back of our quality service and value proposition, building strong sales capability, improving the branch network, margin improvements, reducing the size and cost of our Distribution Centres and introducing marketing and other strategies employed in the Nubco business. Significant investment has been made in people, inventory, delivery capability and the branches over the last two years. We are far from satisfied with the slow rate of recovery in KAA sales but remain committed to our strategy. Green shoots are appearing and we are optimistic about our prospects for returning KAA to break even or better in FY20. KAA is our largest opportunity for profit growth over the next few years.
KANZ had an excellent year for the second year in a row with strong sales growth delivering a positive increase in their contribution to the Group.
Nubco performed in line with expectations in the four months post acquisition. We have delivered buying benefits into KAA following the acquisition and these will be fully realised in FY20.
Fluid Systems (FS), which comprises our Cooper Fluid Systems (CFS) and Torque Industries (Torque) businesses, performed very strongly and is well positioned for further growth in coming years as we expect their core markets of mining and resources, defence and agriculture to perform well.
We were delighted to acquire both the Torque and Nubco businesses during the year. Both businesses met our strict acquisition criteria and have immediately had a positive impact on our profit and cash flow results. It was pleasing to have market and shareholder support for two capital raises during the period which secured $42.6m to fund these acquisitions.
With strong results from FS, Nubco and KANZ, and with KAA’s performance improving, our focus continues to be on additional opportunities for growth. Our markets are performing well, and we are confident that both divisions have organic growth and acquisition opportunities.
We remain fully focussed on our Customers, People and our Suppliers, and applying our values of Respect, Fairness, Teamwork, Professionalism and Integrity.
For
per
sona
l use
onl
y
6
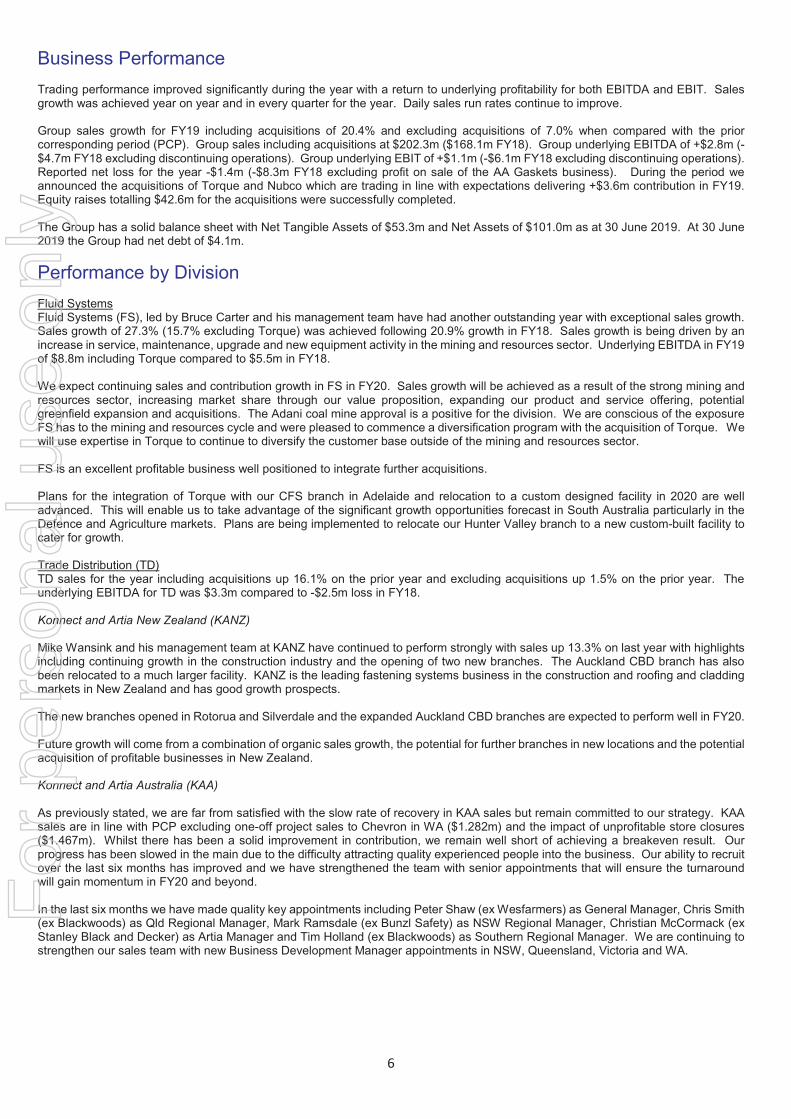
Business Performance
Trading performance improved significantly during the year with a return to underlying profitability for both EBITDA and EBIT. Sales growth was achieved year on year and in every quarter for the year. Daily sales run rates continue to improve.
Group sales growth for FY19 including acquisitions of 20.4% and excluding acquisitions of 7.0% when compared with the prior corresponding period (PCP). Group sales including acquisitions at $202.3m ($168.1m FY18). Group underlying EBITDA of +$2.8m (-$4.7m FY18 excluding discontinuing operations). Group underlying EBIT of +$1.1m (-$6.1m FY18 excluding discontinuing operations). Reported net loss for the year -$1.4m (-$8.3m FY18 excluding profit on sale of the AA Gaskets business). During the period we announced the acquisitions of Torque and Nubco which are trading in line with expectations delivering +$3.6m contribution in FY19. Equity raises totalling $42.6m for the acquisitions were successfully completed.
The Group has a solid balance sheet with Net Tangible Assets of $53.3m and Net Assets of $101.0m as at 30 June 2019. At 30 June 2019 the Group had net debt of $4.1m.
Performance by Division
Fluid Systems Fluid Systems (FS), led by Bruce Carter and his management team have had another outstanding year with exceptional sales growth. Sales growth of 27.3% (15.7% excluding Torque) was achieved following 20.9% growth in FY18. Sales growth is being driven by an increase in service, maintenance, upgrade and new equipment activity in the mining and resources sector. Underlying EBITDA in FY19 of $8.8m including Torque compared to $5.5m in FY18.
We expect continuing sales and contribution growth in FS in FY20. Sales growth will be achieved as a result of the strong mining and resources sector, increasing market share through our value proposition, expanding our product and service offering, potential greenfield expansion and acquisitions. The Adani coal mine approval is a positive for the division. We are conscious of the exposure FS has to the mining and resources cycle and were pleased to commence a diversification program with the acquisition of Torque. We will use expertise in Torque to continue to diversify the customer base outside of the mining and resources sector.
FS is an excellent profitable business well positioned to integrate further acquisitions.
Plans for the integration of Torque with our CFS branch in Adelaide and relocation to a custom designed facility in 2020 are well advanced. This will enable us to take advantage of the significant growth opportunities forecast in South Australia particularly in the Defence and Agriculture markets. Plans are being implemented to relocate our Hunter Valley branch to a new custom-built facility to cater for growth.
Trade Distribution (TD)TD sales for the year including acquisitions up 16.1% on the prior year and excluding acquisitions up 1.5% on the prior year. The underlying EBITDA for TD was $3.3m compared to -$2.5m loss in FY18.
Konnect and Artia New Zealand (KANZ)
Mike Wansink and his management team at KANZ have continued to perform strongly with sales up 13.3% on last year with highlights including continuing growth in the construction industry and the opening of two new branches. The Auckland CBD branch has also been relocated to a much larger facility. KANZ is the leading fastening systems business in the construction and roofing and cladding markets in New Zealand and has good growth prospects.
The new branches opened in Rotorua and Silverdale and the expanded Auckland CBD branches are expected to perform well in FY20.
Future growth will come from a combination of organic sales growth, the potential for further branches in new locations and the potential acquisition of profitable businesses in New Zealand.
Konnect and Artia Australia (KAA)
As previously stated, we are far from satisfied with the slow rate of recovery in KAA sales but remain committed to our strategy. KAA sales are in line with PCP excluding one-off project sales to Chevron in WA ($1.282m) and the impact of unprofitable store closures ($1.467m). Whilst there has been a solid improvement in contribution, we remain well short of achieving a breakeven result. Our progress has been slowed in the main due to the difficulty attracting quality experienced people into the business. Our ability to recruit over the last six months has improved and we have strengthened the team with senior appointments that will ensure the turnaround will gain momentum in FY20 and beyond.
In the last six months we have made quality key appointments including Peter Shaw (ex Wesfarmers) as General Manager, Chris Smith (ex Blackwoods) as Qld Regional Manager, Mark Ramsdale (ex Bunzl Safety) as NSW Regional Manager, Christian McCormack (ex Stanley Black and Decker) as Artia Manager and Tim Holland (ex Blackwoods) as Southern Regional Manager. We are continuing to strengthen our sales team with new Business Development Manager appointments in NSW, Queensland, Victoria and WA.
For
per
sona
l use
onl
y

7
The key to success is having the right people. In addition to getting the right people our other key strategies are:Improving our value proposition, specifically:
o Sale of quality products from our local suppliers and own brand imported range. Relationships with our key suppliers are continuing to strengthen and we are improving trading terms
o Ensuring our stock availability and DIFOT levels in the branch network remain high and each branch stocks what it sells based on the markets the branch operates in
o Increasing our capability in the branch network by ensuring we have an appropriate level of qualified resources and service delivery agility
o Increasing the level of expertise in the business through recruitment and trainingo Improving service agility with the introduction of branch delivery vehicles
Opening new stores. During the year we opened a branch in Kalgoorlie and a “pop up store” in Mount Gambier. We have advanced plans for two additional new branches.
Margin improvement programs including:o Taking advantage of buying synergies as a result of the Nubco acquisitiono Improving trading terms with overseas supplierso Introducing rebate plans with local supplierso Sales of our higher margin categories and productso Reducing freight costs and increasing freight recovery
The Distribution Centre cost savings highlighted in this report last year of $3.0m have been delivered in FY19 and we expect to deliver a further $1.5m in savings over FY20 and FY21. As this project progresses the supply chain across KAA is becomingmore efficient improving our ability to deliver high stock availability and agile service to our customers.
The Nubco acquisition presents us with opportunities to improve KAA including:o Buying benefitso Product range extensiono Marketing, store merchandising and promotional expertise
A Digital Customer Engagement project is aimed at increasing on-line sales, improving our understanding of our customers, increasing electronic digital marketing activity and introducing a quality CRM system.
As a result of the Nubco acquisition we have closed the Konnect branches in Launceston and Burnie with the majority of their business transferred to Nubco branches.
We are expecting stronger sales growth in FY20 with the strengthening of the management and business development teams that has occurred in the second half of FY19.
Nubco
Nubco had a positive start with the Group recording sales and earnings in line with expectations for the four months post acquisition. Nubco are well poised to take advantage of the strong Tasmanian economy and significant infrastructure and construction spend planned in the state. As previously noted, the Nubco acquisition is also assisting us to improve KAA’s value proposition and fast tracking its return to profitability.
Corporate Costs
Corporate costs increased during the year due to the strengthening of the Finance, Human Resources and IT teams so that they can support a rapidly growing business. Moving forward we will deliver productivity gains using technology so that as sales grow, only modest additional corporate costs are required. Corporate costs are currently running at 4.8% of sales (5.1% FY18). We expect this to reduce to 4.2% of sales in FY20.
The property at Redcliffe remains a concern with the need to replace the sub tenant in the warehouse from the start of next calendar year. We have a comprehensive marketing program in to place to maximise our ability to deliver a new sub tenant. All other tenants are locked in for the medium term.
Working Capital
Net assets of $101.0m compared to $60.6m in FY18 in the main due to the acquisitions. Reducing working capital to maximise cash generation remains a key focus area for the Group. The new Accounts Receivable team in Melbourne has had a positive impact ondebtor days outstanding. Inventory reductions have been modest, with our main priority being high stock availability to ensure we can deliver on our value proposition to achieve sales growth. Detailed inventory reduction plans for FY20 have been developed.
The Group has minimal capital expenditure requirements.
For
per
sona
l use
onl
y

8
Outlook
The outlook for our end markets (commercial construction / infrastructure and mining) is positive. The Group has negligible exposure to the residential construction market.
A significant improvement in profitability is forecast for FY20 with the inclusion of recent acquisitions for a full 12 months, continued sales growth, procurement savings and continued optimisation of the distribution footprint. We are forecasting FY20 EBITDA of $10m+ assuming the continuation of current trends and no adverse broader market developments. The medium term target of 7.5% Group EBITDA margin remains.
We are actively assessing acquisition opportunities that are presented to us. We are seeking to sensibly increase debt facilities to fund acquisitions along with cash generated by the Group. The Group has significant tax losses available to offset future profits ensuring a high profit to cash conversion rate for the foreseeable future.
Overall, we remain positive about the outlook for the Group.
I would like to acknowledge the support we have received from the Board and thank the Executive Leadership team and every person in the Group for their contribution during the year. In two years we have transformed a large loss making company in financial distress into one that is profitable with excellent future prospects. We remain confident that we will fully deliver on our five year strategy and in doing so restore shareholder value.
Robert J BullussChief Executive Officer and Managing Director
For
per
sona
l use
onl
y
9
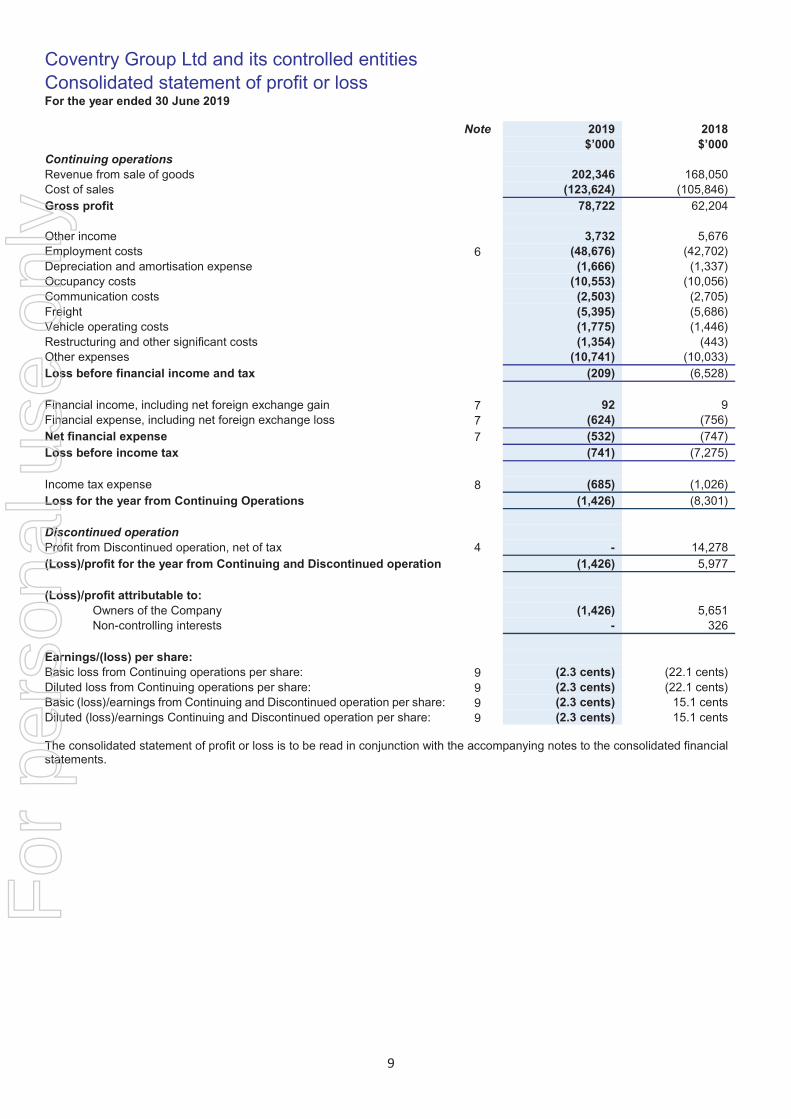
Coventry Group Ltd and its controlled entitiesConsolidated statement of profit or loss For the year ended 30 June 2019
Note 2019 2018$’000 $’000
Continuing operationsRevenue from sale of goods 202,346 168,050Cost of sales (123,624) (105,846)Gross profit 78,722 62,204
Other income 3,732 5,676Employment costs 6 (48,676) (42,702)Depreciation and amortisation expense (1,666) (1,337)Occupancy costs (10,553) (10,056)Communication costs (2,503) (2,705)Freight (5,395) (5,686)Vehicle operating costs (1,775) (1,446)Restructuring and other significant costs (1,354) (443)Other expenses (10,741) (10,033)Loss before financial income and tax (209) (6,528)
Financial income, including net foreign exchange gain 7 92 9Financial expense, including net foreign exchange loss 7 (624) (756)Net financial expense 7 (532) (747)Loss before income tax (741) (7,275)
Income tax expense 8 (685) (1,026)Loss for the year from Continuing Operations (1,426) (8,301)
Discontinued operationProfit from Discontinued operation, net of tax 4 - 14,278(Loss)/profit for the year from Continuing and Discontinued operation (1,426) 5,977
(Loss)/profit attributable to:Owners of the Company (1,426) 5,651Non-controlling interests - 326
Earnings/(loss) per share:Basic loss from Continuing operations per share: 9 (2.3 cents) (22.1 cents)Diluted loss from Continuing operations per share: 9 (2.3 cents) (22.1 cents)Basic (loss)/earnings from Continuing and Discontinued operation per share: 9 (2.3 cents) 15.1 centsDiluted (loss)/earnings Continuing and Discontinued operation per share: 9 (2.3 cents) 15.1 cents
The consolidated statement of profit or loss is to be read in conjunction with the accompanying notes to the consolidated financial statements.
For
per
sona
l use
onl
y
10
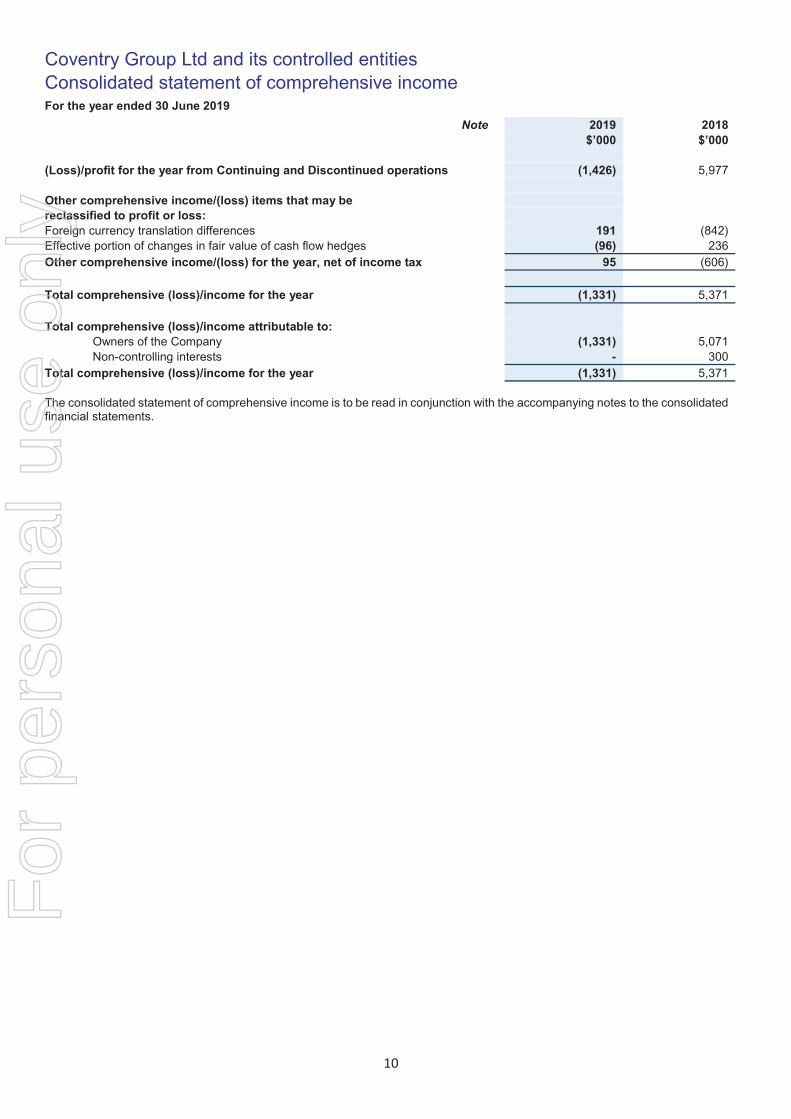
Coventry Group Ltd and its controlled entitiesConsolidated statement of comprehensive income For the year ended 30 June 2019
Note 2019 2018$’000 $’000
(Loss)/profit for the year from Continuing and Discontinued operations (1,426) 5,977
Other comprehensive income/(loss) items that may be reclassified to profit or loss:Foreign currency translation differences 191 (842)Effective portion of changes in fair value of cash flow hedges (96) 236Other comprehensive income/(loss) for the year, net of income tax 95 (606)
Total comprehensive (loss)/income for the year (1,331) 5,371
Total comprehensive (loss)/income attributable to:Owners of the Company (1,331) 5,071Non-controlling interests - 300
Total comprehensive (loss)/income for the year (1,331) 5,371
The consolidated statement of comprehensive income is to be read in conjunction with the accompanying notes to the consolidated financial statements.
For
per
sona
l use
onl
y

11
Coventry Group Ltd and its controlled entitiesConsolidated statement of financial positionAs at 30 June 2019
Note 2019 2018$’000 $’000
AssetsCash and cash equivalents 10 5,314 4,966Trade and other receivables 11 35,833 30,504Inventories 12 59,886 46,444Other financial assets at amortised cost 11 2,023 -Other current assets 11 1,487 -Derivative financial instrument 136 -Total current assets 104,679 81,914
Deferred tax assets 8 1,185 6,120Property, plant and equipment 14 5,864 4,581Intangible assets 15 46,562 6,071Total non-current assets 53,611 16,772
Total assets 158,290 98,686
LiabilitiesTrade and other payables 17 38,204 30,522Employee benefits 5,734 3,701Interest-bearing loans and borrowings 18 9,411 -Income tax payable 526 416Provisions - 90Total current liabilities 53,875 34,729
Employee benefits 157 146Other payables 17 3,228 3,197Total non-current liabilities 3,385 3,343
Total liabilities 57,260 38,072
Net assets 101,030 60,614
EquityIssued capital 149,517 107,770Reserves (4,874) (4,969)Retained earnings (43,613) (42,187)Total equity 101,030 60,614
The consolidated statement of financial position is to be read in conjunction with the accompanying notes to the consolidated financial statements.
For
per
sona
l use
onl
y

12
Coventry Group Ltd and its controlled entitiesConsolidated statement of changes in equityFor the year ended 30 June 2019
Share-based payments
reserveHedge
reserveTranslation
reserveOther
reserveTotal
reservesShare
capitalRetained earnings
Total for owners of the
Company
Non-controlling
interestsTotal
equity
$’000 $’000 $’000 $’000 $’000 $’000 $’000 $’000 $’000 $’000
Balance at 1 July 2018 - 192 (1,587) (3,574) (4,969) 107,770 (42,187) 60,614 - 60,614
Total comprehensive (loss)/income for the year(Loss) for the year - - - - - - (1,426) (1,426) - (1,426)Other comprehensive (loss)/income:Foreign currency translation differences - - 191 - 191 - - 191 - 191Effective portion of changes in fair value of cash flow hedges - (96) - - (96) - - (96) - (96)
Total other comprehensive (loss)/income - (96) 191 - 95 - - 95 - 95
Total comprehensive (loss)/income for the year - (96) 191 - 95 - (1,426) (1,331) - (1,331)
Transactions with owners, recorded directly in equity
Share issue - - - - - 44,641 - 44,641 - 44,641
Share issue costs - - - - - (2,894) - (2,894) - (2,894)
Balance at 30 June 2019 - 96 (1,396) (3,574) (4,874) 149,517 (43,613) 101,030 - 101,030
Amounts are stated net of tax
Share-basedpayments
reserveHedge
reserveTranslation
reserveOther
reserveTotal
reservesShare
capitalRetained earnings
Total for ownersof the
Company
Non-controlling
interestsTotal
equity
$’000 $’000 $’000 $’000 $’000 $’000 $’000 $’000 $’000 $’000
Balance at 1 July 2017 - (44) (771) - (815) 108,063 (47,838) 59,410 2,165 61,575
Total comprehensive income for the yearProfit for the year - - - - - - 5,651 5,651 326 5,977Other comprehensive (loss)/income:Foreign currency translation differences - - (816) - (816) - - (816) (26) (842)Effective portion of changes in fair value of cash flow hedges - 236 - - 236 - - 236 - 236
Total other comprehensive income/(loss) - 236
(816) - (580) - - (580) (26) (606)
Total comprehensive income/(loss) for the year - 236
(816) - (580) - 5,651 5,071 300 5,371
Transactions with owners, recorded directly in equity Acquisition of non-controlling interest - - - (3,574) (3,574) - - (3,574) (2,327) (5,901)Conversion of performance rights (89) - - - (89) 80 - (9) - (9)
Share buy-back - - - - - (373) - (373) - (373)
Dividend to equity holders - - - - - - - - (138) (138)Share based payment transactions 89 - - - 89 - - 89 - 89
Balance at 30 June 2018 - 192 (1,587) (3,574) (4,969) 107,770 (42,187) 60,614 - 60,614
Amounts are stated net of tax
For
per
sona
l use
onl
y

13
Coventry Group Ltd and its controlled entitiesConsolidated statement of cash flowsFor the year ended 30 June 2019
Note 2019 2018$’000 $’000
Cash flows from operating activitiesCash receipts from customers 217,522 183,487Cash paid to suppliers and employees (220,872) (186,827)Cash used in operations (3,350) (3,340)Interest paid (624) (509)Income taxes paid (396) (230)Net cash used in operating activities 24 (4,370) (4,079)
Cash flows from investing activitiesProceeds from Discontinued operation 4 - 21,012Proceeds from sale of property, plant and equipment 85 527Payment for acquisitions of business, net of cash acquired 3 (43,208) -Interest received 34 9Acquisition of property, plant and equipment 14 (1,092) (1,782)Acquisition of intangible assets 15 (393) (324)Net cash (used in)/from investing activities (44,574) 19,442
Cash flows from financing activitiesProceeds from Borrowings 194,597 68,896Repayment of Borrowings (185,186) (76,941)Proceeds from issue of shares 42,673 -Share issue costs (2,894) -Share buy-back - (373)Dividends paid to non-controlling interests - (138)Transactions with non-controlling interests - (5,927)Net cash from/(used in) financing activities 49,190 (14,483)
Net increase/(decrease) in cash and cash equivalents 246 880Cash and cash equivalents at 1 July 4,966 5,149Effect of movements in exchange rates on cash and cash equivalents 102 (1,063)Cash and cash equivalents at 30 June 10 5,314 4,966
The consolidated statement of cash flows is to be read in conjunction with the accompanying notes to the consolidated financialstatements.
For
per
sona
l use
onl
y

Coventry Group Ltd and its controlled entitiesNotes to the consolidated financial statementsFor the year ended 30 June 2019
14
1. Significant accounting policies
Coventry Group Ltd (the “Company”) is a for profit company domiciled in Australia. The address of the Company’s registered office is 235 Settlement Road Thomastown VIC 3074 Australia. The consolidated financial statements ("financial report" or "consolidated financial report") of the Company for the financial year ended 30 June 2019 comprises the Company and its controlled entities (together referred to as the “Group”).
The financial report was authorised for issue by the Directors on 23 August 2019.
(a) Statement of compliance
This financial report is a general purpose financial report which has been prepared in accordance with Australian Accounting Standards (AASBs) (including Australian Interpretations) adopted by the Australian Accounting Standards Board (AASB) and the Corporations Act 2001. The consolidated financial report of the Group complies with the International Financial Reporting Standards (IFRSs) and interpretations adopted by the International Accounting Standards Board (IASB).
(b) Basis of preparation
The financial report is presented in Australian dollars, which is the Company’s functional currency. The financial report is prepared on the historical cost basis except for certain financial assets and liabilities (including share based payments and derivative financial instruments) which are stated at their fair value.
The Group is of a kind referred to in ASIC Corporations (Rounding in Financial/Directors’ Reports) Instrument 2016/191 dated 24 March 2016 and in accordance with that Instrument, amounts in the financial report have been rounded off to the nearest thousand dollars, unless otherwise stated.
The Group has consistently applied the accounting policies (as set out in Note 1(d) – 1(v)) to all years presented in this consolidated financial report. Certain prior year figures have been reclassified to conform with the presentation in the current year.
Going ConcernIn preparing the financial report, the Directors have made an assessment of the ability of the Group to continue as a going concern, which contemplates the continuity of business operations, realisation of assets and settlement of liabilities in the ordinary course of business and at the amounts stated in the financial report. The Directors have a reasonable expectation that the Group will have adequate resources to continue to meet its obligations as they fall due.
(c) New and amended standards adopted by the Group
The Group has applied the following standards and amendments for the first time for their annual reporting period commencing 1 July 2018:
AASB 9 Financial Instruments AASB 15 Revenue from Contracts with CustomersAASB 2016-5 Amendments to Australian Accounting Standards – Classification and Measurement of Share-based Payment TransactionsAASB 2017-1 Amendments to Australian Accounting Standards – Transfer to Investment Property, Annual Improvements 2014 – 2016 Cycle and Other AmendmentsAASB Interpretation 22 Foreign Currency Transactions and Advance Consideration
The impact of the adoption of AASB 9 and AASB 15 and new accounting policies is disclosed in note 26.
The other amendments listed above did not have a material or significant impact on the Group’s consolidated financial report.
(d) Basis of consolidation
Business combinationsBusiness combinations are accounted for using the acquisition method as at the acquisition date. In assessing control, the Group takes into consideration potential voting rights that currently are exercisable.
The Group measures goodwill at the acquisition date as:the fair value of the consideration transferred; plusthe recognised amount of any non-controlling interests in the acquiree; plusif the business combination is achieved in stages, the fair value of the existing equity interest in the acquiree; lessthe net recognised amount (generally fair value) of the identifiable assets acquired and liabilities assumed.
For
per
sona
l use
onl
y

Coventry Group Ltd and its controlled entitiesNotes to the consolidated financial statementsFor the year ended 30 June 2019
15
1. Significant accounting policies (continued)
(d) Basis of consolidation (continued)
When the excess is negative, a bargain purchase gain is recognised immediately in profit or loss.
Transaction costs, other than those associated with the issue of debt or equity securities, that the Group incurs in connection with a business combination are expensed as incurred.
Controlled entitiesControlled entities are entities controlled by the Company. Control exists when the Company is exposed to, or has rights to, variable returns from its involvement with the entity and has the ability to affect those returns through its power over the entity. Investments in controlled entities are carried at their cost of acquisition in the Company’s financial statements, net of impairment write downs. Intra-group balances and transactions, and any unrealised income and expenses arising from intra-group transactions, are eliminated in preparing the consolidated financial statements.
Non-controlling interestsNCI are measured initially at their proportionate share of the acquiree’s identifiable net assets at the date of acquisition.
Changes in the Group’s interest in a subsidiary that do not result in a loss of control are accounted for as equity transactions.
Loss of controlWhen the Group loses control over a subsidiary, it derecognises the assets and liabilities of the subsidiary, and any related NCI and other components of equity. Any resulting gain or loss is recognised in profit or loss. Any interest retained in the former subsidiary is measured at fair value when control is lost.
(e) Foreign currency
Foreign currency transactionsTransactions in foreign currencies are translated to the respective functional currencies of the Group entities at exchange rates at the dates of the transactions. Monetary assets and liabilities denominated in foreign currencies are translated to the functional currency at the exchange rate at the reporting date. Non-monetary assets and liabilities that are measured based on historical cost in a foreign currency are translated using the exchange rate at the date of the transaction. Non-monetary assets and liabilities that are measured at fair value in a foreign currency are translated into the functional currency at the exchange rate when the fair value was determined. Foreign currency differences arising on translation are recognised in the statement of profit or loss.
Foreign operationsThe assets and liabilities of foreign operations, including goodwill and fair value adjustments arising on acquisition, are translated to Australian dollars at exchange rates at the reporting date. The revenues and expenses of foreign operations are translated to Australian dollars at rates approximating the foreign exchange rates at the dates of the transactions.
Foreign currency differences are recognised in other comprehensive income, and presented in the translation reserve in equity. However, if the operation is a non-wholly owned subsidiary, then the relevant proportionate share of the translation difference is allocated to the non-controlling interests.
(f) Discontinued operation
A Discontinued operation is a component of the Group’s business, the operations and cash flows of which can be clearly distinguished from the rest of the Group and which:
represents a separate major line of business or geographic area of operations;is part of a single co-ordinated plan to dispose of a separate major line of business or geographic area of operations; oris a subsidiary acquired exclusively with a view to re-sale.
Classification as a Discontinued operation occurs at the earlier of disposal or when the operation meets the criteria to be classified as held-for-sale.
(g) Cash and cash equivalents
Cash and cash equivalents comprise cash balances and short term deposits with a maturity of three months or less at inception date.
(h) Inventories
Inventories are measured at the lower of cost and net realisable value. The cost of inventories is based on weighted average cost. In the case of manufactured inventories and work in progress, cost includes an appropriate share of overheads. An impairment allowance is made for obsolete, damaged and slow moving inventories.
For
per
sona
l use
onl
y
Coventry Group Ltd and its controlled entitiesNotes to the consolidated financial statementsFor the year ended 30 June 2019
16
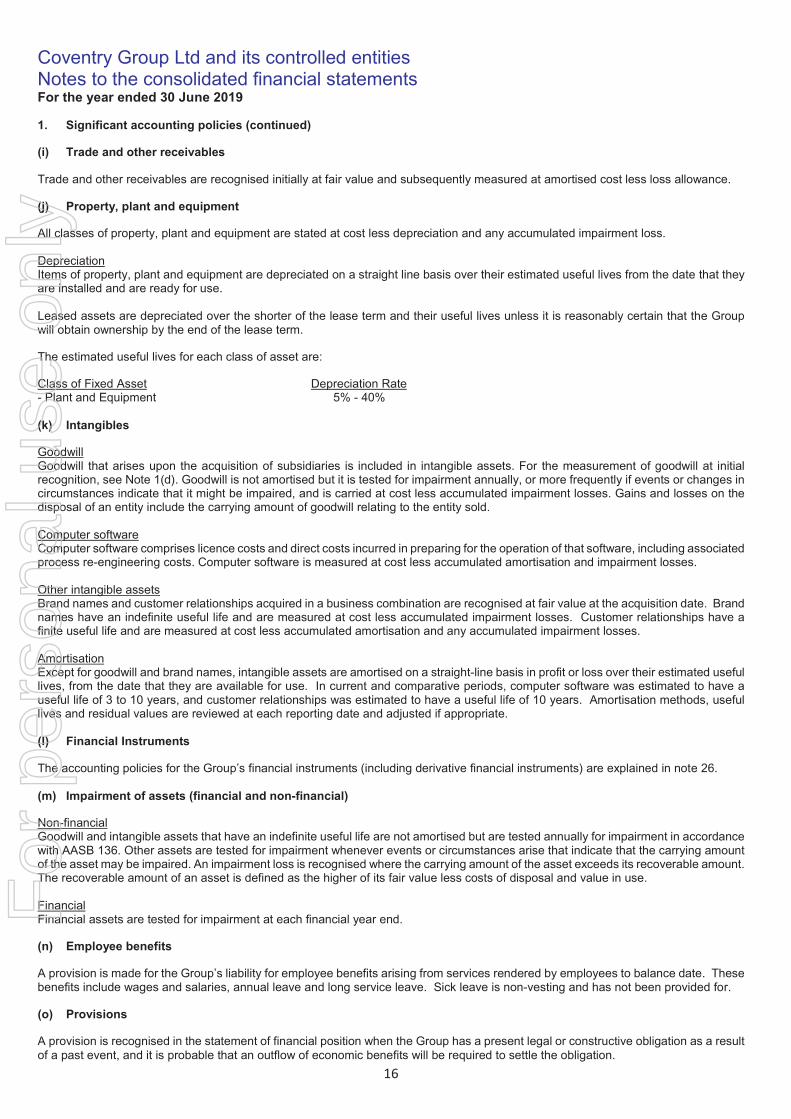
1. Significant accounting policies (continued)
(i) Trade and other receivables
Trade and other receivables are recognised initially at fair value and subsequently measured at amortised cost less loss allowance.
(j) Property, plant and equipment
All classes of property, plant and equipment are stated at cost less depreciation and any accumulated impairment loss.
DepreciationItems of property, plant and equipment are depreciated on a straight line basis over their estimated useful lives from the date that they are installed and are ready for use.
Leased assets are depreciated over the shorter of the lease term and their useful lives unless it is reasonably certain that the Group will obtain ownership by the end of the lease term.
The estimated useful lives for each class of asset are:
Class of Fixed Asset Depreciation Rate- Plant and Equipment 5% - 40%
(k) Intangibles
GoodwillGoodwill that arises upon the acquisition of subsidiaries is included in intangible assets. For the measurement of goodwill at initial recognition, see Note 1(d). Goodwill is not amortised but it is tested for impairment annually, or more frequently if events or changes in circumstances indicate that it might be impaired, and is carried at cost less accumulated impairment losses. Gains and losses on the disposal of an entity include the carrying amount of goodwill relating to the entity sold.
Computer softwareComputer software comprises licence costs and direct costs incurred in preparing for the operation of that software, including associated process re-engineering costs. Computer software is measured at cost less accumulated amortisation and impairment losses.
Other intangible assetsBrand names and customer relationships acquired in a business combination are recognised at fair value at the acquisition date. Brand names have an indefinite useful life and are measured at cost less accumulated impairment losses. Customer relationships have a finite useful life and are measured at cost less accumulated amortisation and any accumulated impairment losses.
AmortisationExcept for goodwill and brand names, intangible assets are amortised on a straight-line basis in profit or loss over their estimated useful lives, from the date that they are available for use. In current and comparative periods, computer software was estimated to have a useful life of 3 to 10 years, and customer relationships was estimated to have a useful life of 10 years. Amortisation methods, useful lives and residual values are reviewed at each reporting date and adjusted if appropriate.
(l) Financial Instruments
The accounting policies for the Group’s financial instruments (including derivative financial instruments) are explained in note 26.
(m) Impairment of assets (financial and non-financial)
Non-financialGoodwill and intangible assets that have an indefinite useful life are not amortised but are tested annually for impairment in accordance with AASB 136. Other assets are tested for impairment whenever events or circumstances arise that indicate that the carrying amount of the asset may be impaired. An impairment loss is recognised where the carrying amount of the asset exceeds its recoverable amount. The recoverable amount of an asset is defined as the higher of its fair value less costs of disposal and value in use.
FinancialFinancial assets are tested for impairment at each financial year end.
(n) Employee benefits
A provision is made for the Group’s liability for employee benefits arising from services rendered by employees to balance date. These benefits include wages and salaries, annual leave and long service leave. Sick leave is non-vesting and has not been provided for.
(o) Provisions
A provision is recognised in the statement of financial position when the Group has a present legal or constructive obligation as a result of a past event, and it is probable that an outflow of economic benefits will be required to settle the obligation.
For
per
sona
l use
onl
y

Coventry Group Ltd and its controlled entitiesNotes to the consolidated financial statementsFor the year ended 30 June 2019
17
1. Significant accounting policies (continued)
(p) Trade and other payables
Trade and other payables are stated at amortised cost.
(q) Revenue and other income
The accounting policies for the Group’s revenue from contracts with customers are explained in note 26.
Rental incomeRental income is recognised in the statement of profit or loss on a straight line basis over the term of the lease. Rental income from subleased property is recognised as other income.
(r) Leases
Leased assetsAssets held by the Group under leases which transfer to the Group substantially all the risks and rewards of ownership are classified as finance leases. Assets held under other leases are classified as operating leases and are not recognised in the Group’s statement of financial position.
Lease paymentsPayments made and material incentives received under operating leases are recognised in profit or loss on a straight-line basis over the term of the lease. Lease incentives received are recognised as an integral part of the total lease expense, over the term of the lease.
(s) Finance income and finance costs
Finance income comprises interest income on funds invested. Interest income is recognised as it accrues in profit or loss, using the effective interest method.
Finance costs comprise interest expense on borrowings and finance leases.
Borrowing costs that are not directly attributable to the acquisition, construction or production of a qualifying asset are recognised in profit or loss using the effective interest method.
Foreign currency gains and losses on financial assets and financial liabilities are reported on a net basis as either finance income or finance cost depending on whether foreign currency movements are in a net gain or net loss position.
(t) Income tax
Income tax on the profit or loss for the year comprises current and deferred tax. Income tax is recognised in the statement of profit or loss except to the extent that it relates to items recognised directly in equity, in which case it is recognised in equity.
Current tax is the expected tax payable on the taxable income for the year, using tax rates enacted or substantively enacted at the balance sheet date, and any adjustment to tax payable in respect of previous years.
Deferred tax is provided using the balance sheet liability method, providing for temporary differences between the carrying amounts of assets and liabilities for financial reporting purposes and the amounts used for taxation purposes. The following temporary differences are not provided for: initial recognition of goodwill, the initial recognition of assets or liabilities that affect neither accounting nor taxable profit, and differences relating to investments in subsidiaries to the extent that they will probably not reverse in the foreseeable future. The amount of deferred tax provided is based on the expected manner of realisation or settlement of the carrying amount of assets and liabilities, using tax rates enacted or substantively enacted at the balance sheet date.
Deferred tax assets are recognised for unused tax losses, unused tax credits and deductible temporary differences only to the extent that it is probable that future taxable profits will be available against which they can be used. Future taxable profits are determined based on the reversal of relevant taxable temporary differences. If the amount of taxable temporary differences is insufficient to recognise a deferred tax asset in full, then future taxable profits, adjusted for reversals of existing temporary differences, are considered, based on the business plans for the Group.
Additional income taxes that arise from the distribution of dividends are recognised at the same time as the liability to pay the related dividend.
For
per
sona
l use
onl
y

Coventry Group Ltd and its controlled entitiesNotes to the consolidated financial statementsFor the year ended 30 June 2019
18
1. Significant accounting policies (continued)
(t) Income tax (continued)
Tax consolidationThe Company and its wholly owned Australian resident entities have formed a tax consolidated group with effect from 1 November2002 and are therefore taxed as a single entity from that date. The head entity within the tax consolidated group is Coventry Group Ltd.
Current tax expense/income, deferred tax liabilities and deferred tax assets arising from temporary differences of the members of the tax consolidated group are recognised in the separate financial statements of the members of the tax consolidated group using the ‘separate taxpayer within group’ approach by reference to the carrying amounts of assets and liabilities in the separate financial statements of each entity and the tax values applying under tax consolidation.
Any current tax liabilities (or assets) and deferred tax assets arising from unused tax losses of the controlled entities is assumed by the head entity in the tax consolidated group and recognised by the Company as an equity contribution or distribution.The Company recognises deferred tax assets arising from unused tax losses of the tax consolidated group to the extent that it is probable that future taxable profits of the tax consolidated group will be available against which the asset can be utilised.
Any subsequent period adjustments to deferred tax assets arising from unused tax losses as a result of revised assessments of the probability of recoverability is recognised by the head entity only.
(u) Goods and services tax
Revenue, expenses and assets are recognised net of the amount of goods and services tax (“GST”), except where the amount of GST incurred is not recoverable from the taxation authority. In these circumstances, the GST is recognised as part of the cost of acquisition of the asset or as part of the expense.
Receivables and payables in the statement of financial position are stated with the amount of GST included. Cash flows are included in the statement of cash flows on a gross basis.
(v) Accounting estimates and judgements
In preparing these consolidated financial statements, management has made judgements, estimates and assumptions that affect the application of the Group's accounting policies and the reported amounts of assets, liabilities, income and expense. The estimates and associated assumptions are based on historical experience and on other factors it believes to be reasonable under the circumstances, the results of which form the basis of the reported amounts that are not readily apparent from other sources. Actual results may differ from these estimates under different assumptions and conditions.
Estimates and underlying assumptions are reviewed on an ongoing basis. Revisions to estimates are recognised prospectively.
In particular, information about significant areas of estimation uncertainty and critical judgements in applying accounting policies that have the most significant effect on the amounts recognised in the financial statements are:
estimation of current tax payable, current tax expense and recovery of deferred tax assets – note 1(t) and note 8estimated useful life of intangible assets – note 1(k)estimated impairment of non-financial assets and measurement of the recoverable amount of cash generating units – note 16estimation of impairment of inventories – note 1(h)
(w) New standards and interpretations not yet adopted
Australian Accounting Standards and Interpretations that have recently been issued or amended but are not yet effective and have not been adopted by the Group for the annual reporting period ended 30 June 2019 are outlined below.
AASB 16 Leases
The Group is required to adopt AASB 16 Leases from 1 July 2019. The Group has substantially completed the assessment of the new standard on its consolidated financial statements, as described below.
AASB 16 will have a significant impact on the consolidated financial statements of the Group. The standard will affect primarily the accounting for the Group’s non-cancellable operating lease commitments as disclosed in note 22.
TransitionThe Group will apply AASB 16 initially on 1 July 2019, using the modified retrospective approach. Therefore, the cumulative effect of adopting AASB 16 will be recognised as an adjustment to the opening balance of retained earnings at 1 July 2019, with no restatement of comparative information.
For
per
sona
l use
onl
y

Coventry Group Ltd and its controlled entitiesNotes to the consolidated financial statementsFor the year ended 30 June 2019
19
1. Significant accounting policies (continued)
(w) New standards and interpretations not yet adopted (continued)
Leases in which the Group is a lesseeAASB 16 will result in higher assets and liabilities on the statement of financial position. On 1 July 2019, the Group will recognise a right-of-use asset and a lease liability for its operating leases of rental premises, branches and motor vehicles. Right-of-use assets will be measured at the amount of the lease liability on adoption (adjusted for any prepaid or accrued lease expenses).
The Group also expects to retain the classification of existing contracts as leases under current accounting standards (‘grandfathering’) instead of reassessing whether existing contracts are or contain a lease at the date of application of the new standard. Further, the Group does not currently intend to bring short term leases (12 months or fewer to run as at 1 July 2019 including reasonably certain options to extend) or low value leases on the statement of financial position.
In addition, the nature of expenses related to those leases will now change as AASB 16 replaces the straight-line operating lease expense with a depreciation charge for right-of-use assets and interest expense on lease liabilities. The impact will likely cause some movements in overall expenses in the consolidated statement of profit or loss broadly in line with contract renewal dates. Operating cash flow will increase under AASB 16 as the element of cash paid attributable to the repayment of principal will be included in financing cash flow. The net increase/decrease in cash and cash equivalents will remain the same.
As at reporting date, the Group has non-cancellable operating lease commitments with a nominal value of $47,418,000 (refer to note 22). Of these commitments, approximately $1 million relate to short-term leases which will be recognised on a straight-line base as an expense in profit and loss. For the remaining lease commitments, the preliminary assessment concluded that the Group may be required to recognise a right-of-use asset and lease liability of between $31 million to $37 million on its statement of financial position on adoption of the standard on 1 July 2019. This preliminary assessment excludes lease extension options which the Group are currently assessing the likelihood of extension of each option. Amounts recognised in the consolidated statement of financial position at 30 June 2019 (i.e. straight-line lease liabilities and onerous lease provisions) of $3.2 million are derecognised and offset against the right-of-use asset on transition.
Leases in which the Group is a lessor The Group has reassessed the classification of sub-leases in which the Group is a lessor. The Group expects that it will reclassify all sub-leases as a finance lease, resulting in recognition of an Investment in a sub-lease asset as at 1 July 2019 and de-recognition of the related right-of-use asset of the head lease previously recognised.
Other standardsThe following amended standards and interpretations are not expected to have a significant impact on the Group’s consolidated financial statements.
AASB 2018-1 Amendments to Australian Accounting Standards – Annual Improvements 2015-2017 Cycle. AASB Interpretation 23 Uncertainty over Income Tax Treatments. AASB 2018-2 Amendments to Australian Accounting Standards – Plan Amendment, Curtailment of Settlement (AASB 119).AASB 2017-7 Amendments to Australian Accounting Standards – Long-term Interests in Associates and Joint Ventures (AASB 128).AASB 2017-6 Amendments to Australian Accounting Standards – Prepayment Features with Negative Compensation (AASB 9).
For
per
sona
l use
onl
y
Coventry Group Ltd and its controlled entitiesNotes to the consolidated financial statementsFor the year ended 30 June 2019
20
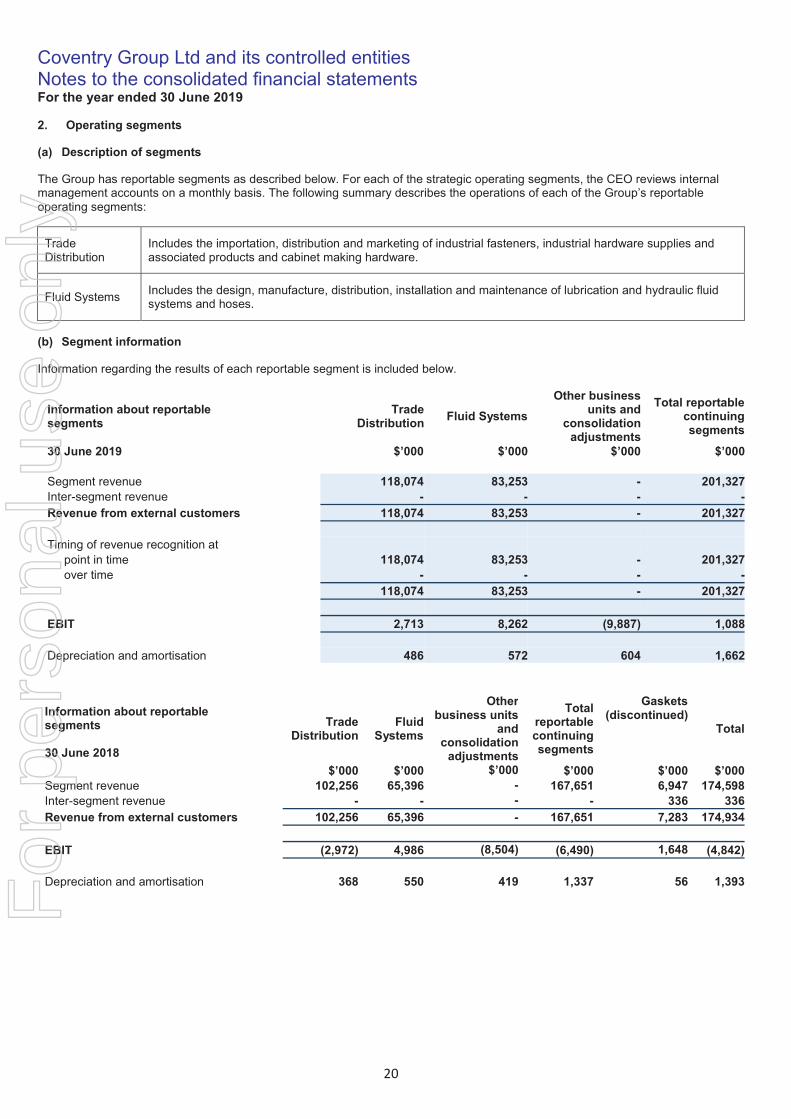
2. Operating segments
(a) Description of segments
The Group has reportable segments as described below. For each of the strategic operating segments, the CEO reviews internal management accounts on a monthly basis. The following summary describes the operations of each of the Group’s reportable operating segments:
Trade Distribution
Includes the importation, distribution and marketing of industrial fasteners, industrial hardware supplies and associated products and cabinet making hardware.
Fluid SystemsIncludes the design, manufacture, distribution, installation and maintenance of lubrication and hydraulic fluid systems and hoses.
(b) Segment information
Information regarding the results of each reportable segment is included below.
Information about reportable segments
TradeDistribution
Fluid Systems
Other business units and
consolidation adjustments
Total reportable continuing segments
30 June 2019 $’000 $’000 $’000 $’000
Segment revenue 118,074 83,253 - 201,327Inter-segment revenue - - - -Revenue from external customers 118,074 83,253 - 201,327
Timing of revenue recognition atpoint in time 118,074 83,253 - 201,327over time - - - -
118,074 83,253 - 201,327
EBIT 2,713 8,262 (9,887) 1,088
Depreciation and amortisation 486 572 604 1,662
Information about reportable segments Trade
DistributionFluid
Systems
Otherbusiness units
and consolidation
adjustments
Total reportable continuing segments
Gaskets(discontinued)
Total
30 June 2018
$’000 $’000 $’000 $’000 $’000 $’000Segment revenue 102,256 65,396 - 167,651 6,947 174,598Inter-segment revenue - - - - 336 336Revenue from external customers 102,256 65,396 - 167,651 7,283 174,934
EBIT (2,972) 4,986 (8,504) (6,490) 1,648 (4,842)
Depreciation and amortisation 368 550 419 1,337 56 1,393For
per
sona
l use
onl
y

Coventry Group Ltd and its controlled entitiesNotes to the consolidated financial statementsFor the year ended 30 June 2019
21
2. Operating segments (continued)
(c) Other segment information
i. Segment RevenueA reconciliation of segment revenue to total revenue from the sale of goods in the Statement of Profit or Loss is provided as follows:
2019 2018$’000 $’000
Total segment revenue from continuing operations 201,327 167,651
Foreign exchange translation variance 1,019 399
Total revenue from continuing operations 202,346 168,050
ii. Segment Operating Profit/(Loss)The ELT measures the performance of the Group’s reportable segments based on EBIT (Earnings before Interest and Tax). This measurement basis excludes the effects of interest on external borrowings and income tax expense. A reconciliation of EBIT to operating profit/(loss) from continuing operations in the Statement of Profit or Loss is provided as follows:
Note 2019 2018$’000 $’000
Total segment EBIT from continuing operations 1,088 (6,490)
Foreign exchange translation variance 57 (43)Significant expenses (1,354) -Net financing expense 7 (532) (747)Income tax expense 8 (685) (1,026)Other - 5
Total operating loss from continuing operations (1,426) (8,301)
(d) Geographic information
Revenue from continuing operations based on the geographic location of customers were Australia $168,360,000 (2018: $138,066,000) and New Zealand $33,986,000 (2018: $29,984,000).
3. Business Combination
(a) Torque Acquisition
On the 31 October 2018, the Group acquired the business and assets of Torque Industries Pty Ltd, a South Australian based diversified engineering services provider trading under the name Torque Industries.
Details of the purchase consideration, the net assets acquired and goodwill are as follows:
Purchase consideration $’000Cash paid 8,522Deferred consideration (ii) 895Total purchase consideration 9,417
For
per
sona
l use
onl
y

Coventry Group Ltd and its controlled entitiesNotes to the consolidated financial statementsFor the year ended 30 June 2019
22
3. Business Combination (continued)
(a) Torque Acquisition (continued)
The provisional fair value of the identifiable assets and liabilities recognised at acquisition date are as follows:
Provisionalfair value
$’000Inventories 1,302Prepayments 45Property, plant and equipment (note 14) 353Other creditors (44)Employee benefit obligations (614)Net deferred tax assets 184Net identifiable assets acquired (iii) 1,226
Add: Goodwill on acquisition (note 15) (iv) 8,191Purchase consideration 9,417
(i) Acquisition Related costs
The total of transaction costs directly attributable to the issue of shares of $1,147,000 was deducted from share capital. Acquisition-related costs were insignificant and included in restructuring and other significant expenses in profit or loss and in operating cash flows in the statement of cash flows.
(ii) Deferred consideration
The deferred consideration arrangement required the Group to pay Torque Industries a maximum of $1.05 million 2 years from the acquisition date. The deferred amount acts as a security for future warranty claims.
The fair value of the deferred consideration arrangement of $895,000 was estimated as the present value of the future cash flows. The estimates are based on the Group’s incremental borrowing rate of 8.32%.
(iii) Provisional assessment
The net assets recognised in the financial statements are based on a provisional assessment of fair value at reporting date.
(iv) Goodwill
The goodwill is attributable to Torque Industries’ strong profitability and a number of identified growth opportunities. The acquisition provides the Group with a large and fully equipped South Australian based facility that will generate a more diversified and de-risked revenue stream, also allowing the Group to gain a more stable footing in the South Australian market. It has been allocated to the FluidSystems business segment. Refer to note 15 for the changes in goodwill as a result of the acquisition.
(b) Nubco Acquisition
On the 1 March 2019, the Group acquired 100% of the issued share capital of Nubco Proprietary Limited (“Nubco”), a Tasmanian based independent supplier of industrial and hardware products.
Details of the purchase consideration, the net assets acquired and goodwill are as follows:
Purchase consideration $’000Cash paid 34,686Ordinary shares issued (ii) 1,968Total purchase consideration 36,654F
or p
erso
nal u
se o
nly

Coventry Group Ltd and its controlled entitiesNotes to the consolidated financial statementsFor the year ended 30 June 2019
23
3. Business Combination (continued)
(b) Nubco Acquisition (continued)
The provisional fair value of the identifiable assets and liabilities recognised at acquisition date are as follows:
Provisionalfair value
$’000Cash and cash equivalents 5Trade Receivables 4,174Inventory 9,489Prepayments 257Deferred tax assets 303Property, plant and equipment (note 14) 1,089Intangible assets: brand name (note 15) 11,376Intangible assets: customer relationships (note 15) 6,102Trade Payables (3,996)Employee benefit obligations (1,104)Other payables (675)Deferred tax liability (5,243)Net identifiable assets acquired (iii) 21,777
Add: Goodwill on acquisition (note 15) (iv) 14,877
Purchase consideration 36,654
(i) Acquisition related costs
The total of transaction costs directly attributable to the issue of shares of $1,747,000 was deducted from share capital. Acquisition-related costs were insignificant and included in restructuring and other significant expenses in profit or loss and in operating cash flows in the statement of cash flows.
(ii) Ordinary shares issued
The fair value of the 2,400,000 shares issued as part of the consideration paid for Nubco ($1.968m) was based on the published share price on 28 February 2019 of $0.82 per share.
The shares issued were issued and placed in escrow for a 2-year period from the acquisition date until 28 February 2021.
(iii) Provisional assessment
The net assets recognised in the financial statements are based on a provisional assessment of fair value at reporting date.
(iv) Goodwill
The goodwill is attributable to Nubco’s historic strong profit performance and the strategic compliment to the Group. This acquisition of Nubco offers tangible synergies that will benefit Coventry Group’s Australian-wide business, including procurement cost savings and knowledge transfer.
(c) Revenue and profit contribution
The acquisition of Torque contributed revenues of $7,608,000 and net profit of $1,237,000 to the Group for the period from 31 October 2018 to 30 June 2019 (eight months trading). The acquisition of Nubco contributed revenues of $14,926,000 and net profit of $2,282,000 to the Group for the period from 1 March 2019 to 30 June 2019 (four months trading).
If both acquisitions had occurred on 1 July 2018, Group consolidated revenue and consolidated profit after tax for the year ended 30 June 2019 would have been $234,326,000 and $3,299,000 respectively.
4. Discontinued operation
On 20 November 2017 the Group announced the sale of the AA Gaskets business assets in Australia and New Zealand to GUD Holdings Limited. The AA Gaskets business, sold on 1 December 2017, was reported in the financial statements for the year ended 30 June 2018 as a discontinued operation.
For
per
sona
l use
onl
y

Coventry Group Ltd and its controlled entitiesNotes to the consolidated financial statementsFor the year ended 30 June 2019
24
5. Auditor's remuneration 2019 2018$ $
Audit servicesAuditors of the GroupKPMG Australia:Engagement of audit and review of financial reports 220,000 195,000Prior year additional charges and out of scope audit services 7,000 39,819
227,000 234,819Other servicesAuditors of the GroupKPMG Australia:Transaction services 110,575 -KPMG New Zealand:Tax services 10,300 11,100
120,875 11,100
6. Employment costs 2019 2018$’000 $’000
Wages and salaries 38,175 33,090Liability for annual leave and long service leave 3,629 3,369Contributions to superannuation funds 3,425 2,993Payroll taxes 2,165 1,806Other associated personnel expenses 1,282 1,444
48,676 42,702
7. Finance income and finance expenses 2019 2018$’000 $’000
Interest income from other entities 34 9Net foreign exchange gain 58 -Financial income 92 9
Interest expense (624) (509)Net foreign exchange loss - (247)Financial expenses (624) (756)Net financial (expense)/income (532) (747)
8. Taxes 2019 2018$’000 $’000
Current tax expense/(benefit)Current year 470 796Underprovision/(overprovision) prior year 36 (19)Tax recognised in the profit or loss 506 777
Deferred tax expenseOrigination and reversal of temporary differences 179 629Total deferred tax expense/(benefit) 179 629
Total income tax expense/(benefit) 685 1,406
For
per
sona
l use
onl
y
Coventry Group Ltd and its controlled entitiesNotes to the consolidated financial statementsFor the year ended 30 June 2019
25
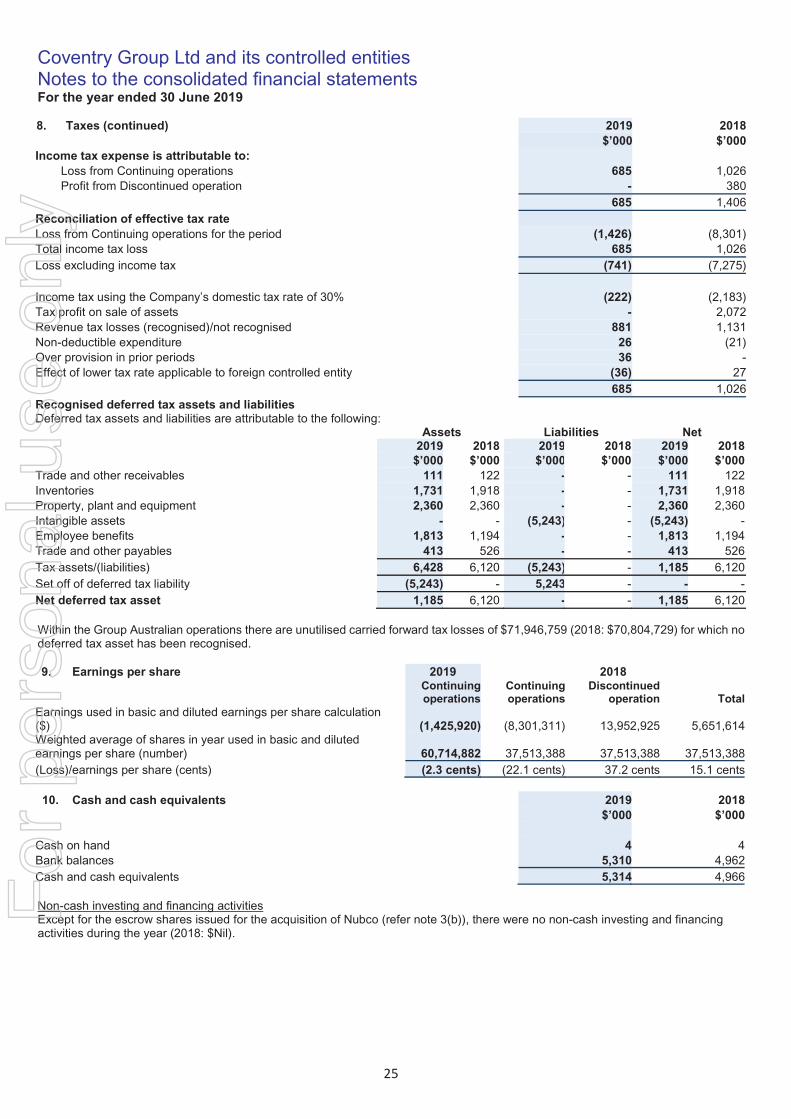
8. Taxes (continued) 2019 2018$’000 $’000
Income tax expense is attributable to:Loss from Continuing operations 685 1,026Profit from Discontinued operation - 380
685 1,406Reconciliation of effective tax rateLoss from Continuing operations for the period (1,426) (8,301)Total income tax loss 685 1,026Loss excluding income tax (741) (7,275)
Income tax using the Company’s domestic tax rate of 30% (222) (2,183)Tax profit on sale of assets - 2,072Revenue tax losses (recognised)/not recognised 881 1,131Non-deductible expenditure 26 (21)Over provision in prior periods 36 -Effect of lower tax rate applicable to foreign controlled entity (36) 27
685 1,026Recognised deferred tax assets and liabilities Deferred tax assets and liabilities are attributable to the following:
Assets Liabilities Net2019 2018 2019 2018 2019 2018
$’000 $’000 $’000 $’000 $’000 $’000Trade and other receivables 111 122 - - 111 122Inventories 1,731 1,918 - - 1,731 1,918Property, plant and equipment 2,360 2,360 - - 2,360 2,360Intangible assets - - (5,243) - (5,243) -Employee benefits 1,813 1,194 - - 1,813 1,194Trade and other payables 413 526 - - 413 526Tax assets/(liabilities) 6,428 6,120 (5,243) - 1,185 6,120Set off of deferred tax liability (5,243) - 5,243 - - -Net deferred tax asset 1,185 6,120 - - 1,185 6,120
Within the Group Australian operations there are unutilised carried forward tax losses of $71,946,759 (2018: $70,804,729) for which no deferred tax asset has been recognised.
9. Earnings per share 2019 2018Continuingoperations
Continuing operations
Discontinuedoperation Total
Earnings used in basic and diluted earnings per share calculation($) (1,425,920) (8,301,311) 13,952,925 5,651,614Weighted average of shares in year used in basic and diluted earnings per share (number) 60,714,882 37,513,388 37,513,388 37,513,388(Loss)/earnings per share (cents) (2.3 cents) (22.1 cents) 37.2 cents 15.1 cents
10. Cash and cash equivalents 2019 2018$’000 $’000
Cash on hand 4 4Bank balances 5,310 4,962Cash and cash equivalents 5,314 4,966
Non-cash investing and financing activitiesExcept for the escrow shares issued for the acquisition of Nubco (refer note 3(b)), there were no non-cash investing and financing activities during the year (2018: $Nil).
For
per
sona
l use
onl
y

Coventry Group Ltd and its controlled entitiesNotes to the consolidated financial statementsFor the year ended 30 June 2019
26
10. Cash and cash equivalents (continued)
Net debt reconciliation 2019 2018Financingliabilities Other assets
Financingliabilities Other assets
Borrowings(included
finance leases) Cash
Borrowings(included finance
leases) CashNet debt Net debt$’000 $’000 $’000 $’000 $’000 $’000
Analysis of changes in net debtOpening balance at the beginning of the financial year
- (4,966) (4,966)8,045 (5,149) 2,896
Foreign exchange adjustment - 11 11 - 1,063 1,063Cash movements excluding exchange movements 9,411 (359) 9,052 (8,045) (880) (8,925)Closing balance 9,411 (5,314) 4,097 - (4,966) (4,966)
The Group’s exposure to interest rate risk and a sensitivity analysis for financial assets and liabilities are disclosed in Note 21.
11. Trade and other receivables 2019 2018Current $’000 $’000Trade receivables 36,206 28,235Loss allowance (note 21) (373) (407)
35,833 27,828
Other receivables 2,023 1,464Prepayments 1,487 1,212
3,510 2,676Total trade and other receivables 39,343 30,504
Information about the Group’s exposure to credit risk, foreign currency risk and interest rate risk is disclosed in note 21.
12. Inventories 2019 2018$’000 $’000
Finished goods 65,723 52,821Provision for obsolescence (5,837) (6,377)Net Inventory balance 59,886 46,444
$1,058,334 (2018: $387,000) of inventory write-downs were recognised during the year.
13. Parent entity disclosures
As at, and throughout, the financial year ending 30 June 2019 the parent company of the Group was Coventry Group Ltd.Company
Results of the parent entity 2019 2018$’000 $’000
Loss for the period (5,046) (8,945)Other comprehensive income (116) 236Total comprehensive loss for the period after tax (5,162) (8,709)
Financial position of parent entity at year endCurrent assets 72,936 68,361Total assets 160,325 91,434
Current liabilities 43,817 29,719Total liabilities 47,201 36,085
Total equity of the parent entity comprising of:Issued capital 149,517 107,770Reserves 75 192Retained earnings (36,468) (52,613)Total equity 113,124 55,349
For
per
sona
l use
onl
y

Coventry Group Ltd and its controlled entitiesNotes to the consolidated financial statementsFor the year ended 30 June 2019
27
16. Impairment of non-financial assets
For the purpose of impairment testing, goodwill and indefinite life intangible assets are allocated to the Group's operating divisions. The aggregate carrying amounts of goodwill and indefinite life intangible assets allocated to each CGU are as follows.
2019 2018$’000 $’000
Fluid Systems 11,518 3,327Trade Distribution 26,253 -
37,771 3,327
The key assumptions used in the value in use calculations include projected sales growth, projected gross margins, terminal value, improvements in working capital and the discount rate. These assumptions are based on historical experience and projected performance incorporating in the company's restructure programme.
The Group assessed the carrying value of its assets as follows:
Trade Distribution For the year ended 30 June 2019, the Group's value in use model indicated no evidence of the requirement for impairment in the carrying amount of the assets of this business. Value in use was based on the following key assumptions:
Sales growth at 32.5% (includes full financial year sales growth for Nubco) for FY20 and 4.8% thereafter Terminal growth 2.5%
Pre-tax WACC of 14.95%
14. Property, plant and equipment
NotePlant and
equipment$’000
Cost at 1 July 2018 41,582Accumulated Depreciation at 1 July 2018 (37,001)Carrying amounts at 1 July 2018 4,581Additions 1,092Acquisition through business combination 3 1,442Depreciation charge for the year (1,218)Disposals (36)Effect of movements in foreign exchange 3Carrying amounts at 30 June 2019 5,864
Cost at 1 July 2017 40,500Accumulated Depreciation at 1 July 2017 (35,802)Carrying amounts at 1 July 2017 4,698Additions 1,782Depreciation charge for the year (1,205)Discontinued operation (407)Disposals (293)Effect of movements in foreign exchange 6Carrying amounts at 30 June 2018 4,581
15. Intangible assets
Note GoodwillBrand name
Customerrelationships
Computersoftware
Total
$’000 $’000 $’000 $’000 $’000Carrying amounts at 1 July 2018 3,327 - - 2,744 6,071Acquisition through business combination 3 23,068 11,376 6,102 - 40,546Additions - - - 393 393Amortisation for the year - - (203) (245) (448)
Carrying amounts at 30 June 2019 26,395 11,376 5,899 2,892 46,562
Carrying amounts at 1 July 2017 3,327 - - 2,608 5,935Additions - - - 324 324Amortisation for the year - - - (188) (188)
Carrying amounts at 30 June 2018 3,327 - - 2,744 6,071
For
per
sona
l use
onl
y

Coventry Group Ltd and its controlled entitiesNotes to the consolidated financial statementsFor the year ended 30 June 2019
28
16. Impairment of non-financial assets (continued)
Fluid SystemsFor the year ended 30 June 2019, the Group's value in use model showed the recoverable amount exceeded the carrying amount of the Fluid Systems CGU. The values assigned to the key assumptions were:
Sales growth at 7.3% (includes full financial year sales growth for Torque) for FY20 and 4.8% thereafterTerminal growth 2.5%
Pre-tax WACC of 14.95%
Any adverse change in the key assumptions may result in impairment. 17. Trade and other payables 2019 2018
$’000 $’000Trade payables 31,070 24,882Non trade payables and accrued expenses 10,362 8,837Total trade and other payables 41,432 33,719
Current 38,204 30,522Non-current 3,228 3,197Total trade and other payables 41,432 33,719
The Group's exposure to currency and liquidity risk related to trade and other payables is disclosed in Note 21. 18. Interest-bearing loans and borrowings 2019 2018
$’000 $’000CurrentDebtor Financing Facility 9,411 -Total interest-bearing loans and borrowings 9,411 -
Details about the Group’s financing facilities, exposure to interest rate, foreign currency and liquidity risks is provided in note 21.
19. Share-based payments
Executive and Director Incentive PlanAn Executive and Director Incentive Plan was approved by shareholders in 2017. The Plan governs the future granting of performance rights and issue of shares based on annual Company performance. Vesting of performance rights varies with the extent that performance hurdles have been met. On vesting, the performance rights entitle the recipient to receive fully paid shares in the Company.
20. Capital and reserves
Share capital Ordinary shares Ordinary shares2019 2018‘000 ‘000
On issue at 1 July 2018 37,380 37,636Conversion of performance rights (i) - 80Share buyback – unmarketable parcels (ii) - (336)Share buyback (iii) - -Share issue (iv) 13,084 -Share issue (v) 36,836 -Share issue (vi) 2,400 -On issue at 30 June 2019 89,700 37,380
(i) On 8 December 2017, 80,000 performance rights issued in accordance with the Executive and Director Incentive Plan were converted to ordinary shares.
(ii) In December 2017, the Group announced a buyback of ordinary shares for holders of unmarketable parcels of shares. On 23 January 2018, the Company completed its unmarketable parcel minimum holding share buyback, where 336,075 ordinary shares wereacquired and cancelled at a price of $1.1108 per share.
(iii) In March 2019, the Group announced an on-market share buyback of up to 10% of its issued ordinary shares. The 12 month buy-back period commenced on 1 March 2019 and will end on 11 March 2020.
For
per
sona
l use
onl
y

Coventry Group Ltd and its controlled entitiesNotes to the consolidated financial statementsFor the year ended 30 June 2019
29
20. Capital and reserves (continued)
(iv) On 26 September 2018 the Company announced an underwritten $15m equity raising to fund the acquisition of Torque Industries. The raising successfully completed in October 2018 with the issue of 13,083,533 ordinary shares at $1.15 from a 1 for 5 accelerated non-renounceable pro-rata entitlement offer and an institutional placement.
(v) On 5 February 2019 the Company announced an underwritten $27.6m equity raising to fund the acquisition of Nubco Proprietary Ltd. The raising successfully completed in February 2019 with the issue of 36,835,730 ordinary shares at $0.75 from a 1 for 1.37 accelerated non-renounceable pro-rate entitlement offer.
(vi) On 1 March 2019, the Company issued 2,400,000 shares in escrow as part of the purchase price consideration for the acquisition of Nubco Proprietary Limited (refer note 3(b)).
Ordinary sharesThe holders of ordinary shares are entitled to receive dividends as declared from time to time and are entitled to one vote per share at meetings of the Company. All shares rank equally with regard to the Company’s residual assets.
Nature and purpose of reserves
Translation reserveThe translation reserve comprises all foreign exchange differences arising from the translation of the financial statements of foreign operations where their functional currency is different to the functional currency of the reporting entity, as well as from the translation of liabilities that hedge the Company’s net investment in a foreign subsidiary.
Share based payments reserveThe share based payment reserve comprises the fair value of shares and options that are yet to vest under share based payment arrangements.
Hedge reserveThe hedging reserve comprises the effective portion of the cumulative net change in the fair value of hedging instruments used in cash flow hedges pending subsequent recognition in profit or loss as the hedged cash flows affect profit or loss.
DividendsNo dividends have been declared or paid for the year ended 30 June 2019 (2018: $Nil).
Company2019 2018
$’000 $’000Dividend franking account30 per cent franking credits available to shareholders of the Company for subsequent financial years
10,843 6,009
21. Financial risk management
The Group has exposure to the following risks from their use of financial instruments:
Credit riskLiquidity riskMarket risk
The Board of Directors has overall responsibility for the establishment and oversight of the risk management framework.
(a) Credit risk
Credit risk is the risk of financial loss to the Group if a customer or counterparty to a financial instrument fails to meet its contractual obligations, and arises principally from the Group’s cash and cash equivalents and receivables from customers. F
or p
erso
nal u
se o
nly

Coventry Group Ltd and its controlled entitiesNotes to the consolidated financial statementsFor the year ended 30 June 2019
30
21. Financial risk management (continued)
(a) Credit risk (continued)
Exposure to credit riskThe carrying amount of the Group’s financial assets represents the maximum credit exposure. The maximum exposure to credit risk at the reporting date was:
Note Carrying amount2019 2018
$’000 $’000Cash and cash equivalents 10 5,314 4,966Trade and other receivables 11 37,856 29,292
43,170 34,258
Trade and other receivablesThe Group’s exposure to credit risk is influenced mainly by the individual characteristics of each customer. The demographics of the Group’s customer base, including the default risk of the industry and country in which customers operate, has less of an influence on credit risk. The Group has no significant concentration of customer base.
Management has established a credit policy under which each new customer is analysed individually for creditworthiness before the Group’s standard payment and delivery terms and conditions are offered.
Goods are sold subject to retention of title clauses, so that in the event of non-payment the Group may have a secured claim. The Group's terms and conditions of trade have been amended to incorporate the Personal Property Security legislation. The Group does not normally require collateral in respect of trade and other receivables.
The Group’s maximum exposure to credit risk for trade receivables at the reporting date by geographic region was Australia $33,449,000 (2018: $24,993,000) and New Zealand $4,407,000 (2018: $4,299,000).
Cash at bank and short or long term deposits are held with Australian and New Zealand banks with acceptable credit ratings.
Impairment of Trade Receivables The Group applies the AASB 9 simplified approach to measuring expected credit losses which uses a lifetime expected loss allowance for all trade receivables.
To measure the expected credit losses, trade receivables have been grouped based on shared credit risk characteristics and the days past due.
The expected loss rates are based on the payment profiles of sales over a period of five years before 1 July 2018 respectively and the corresponding historical credit losses experienced within this period.
On that basis, the loss allowance as at 30 June 2019 was determined as follows for trade receivables:
Current More than 30days past
due
More than 60days past
due
More than 120 days past due
Total
30 June 2019AustraliaExpected loss rate (%) 0.0% 0.1% 1.2% 47.8%Gross carrying amount ($’000) / balance outstanding as reporting date 28,833 1,772 681 629 31,915Loss allowance ($’000) 0 1 8 301 310New ZealandExpected loss rate (%) 0.0% 0.1% 1.2% 45.1%Gross carrying amount ($’000) / balance outstanding at reporting date 3,988 119 47 137 4,291Loss allowance ($’000) 0 0 1 62 63
For
per
sona
l use
onl
y
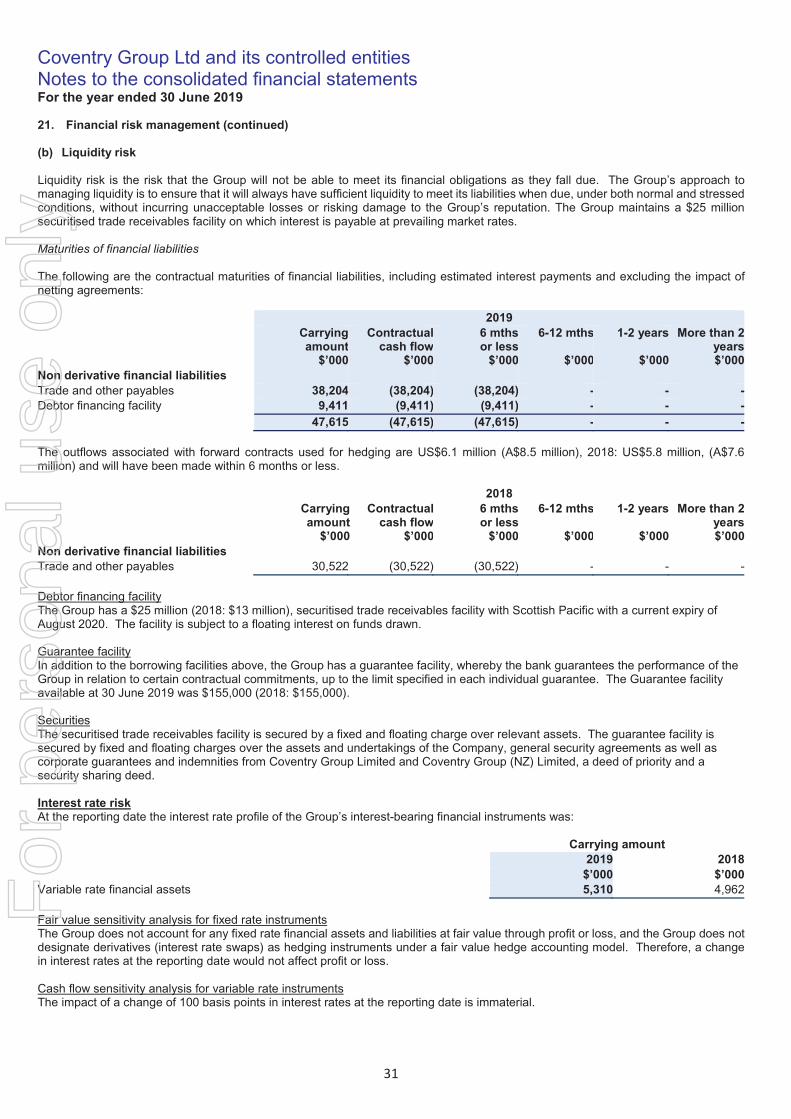
Coventry Group Ltd and its controlled entitiesNotes to the consolidated financial statementsFor the year ended 30 June 2019
31
21. Financial risk management (continued)
(b) Liquidity risk
Liquidity risk is the risk that the Group will not be able to meet its financial obligations as they fall due. The Group’s approach to managing liquidity is to ensure that it will always have sufficient liquidity to meet its liabilities when due, under both normal and stressed conditions, without incurring unacceptable losses or risking damage to the Group’s reputation. The Group maintains a $25 million securitised trade receivables facility on which interest is payable at prevailing market rates.
Maturities of financial liabilities
The following are the contractual maturities of financial liabilities, including estimated interest payments and excluding the impact of netting agreements:
2019Carryingamount
Contractualcash flow
6 mthsor less
6-12 mths 1-2 years More than 2years
$’000 $’000 $’000 $’000 $’000 $’000Non derivative financial liabilitiesTrade and other payables 38,204 (38,204) (38,204) - - -Debtor financing facility 9,411 (9,411) (9,411) - - -
47,615 (47,615) (47,615) - - -
The outflows associated with forward contracts used for hedging are US$6.1 million (A$8.5 million), 2018: US$5.8 million, (A$7.6 million) and will have been made within 6 months or less.
2018Carryingamount
Contractualcash flow
6 mthsor less
6-12 mths 1-2 years More than 2years
$’000 $’000 $’000 $’000 $’000 $’000Non derivative financial liabilitiesTrade and other payables 30,522 (30,522) (30,522) - - -
Debtor financing facilityThe Group has a $25 million (2018: $13 million), securitised trade receivables facility with Scottish Pacific with a current expiry of August 2020. The facility is subject to a floating interest on funds drawn.
Guarantee facilityIn addition to the borrowing facilities above, the Group has a guarantee facility, whereby the bank guarantees the performance of the Group in relation to certain contractual commitments, up to the limit specified in each individual guarantee. The Guarantee facility available at 30 June 2019 was $155,000 (2018: $155,000).
SecuritiesThe securitised trade receivables facility is secured by a fixed and floating charge over relevant assets. The guarantee facility is secured by fixed and floating charges over the assets and undertakings of the Company, general security agreements as well ascorporate guarantees and indemnities from Coventry Group Limited and Coventry Group (NZ) Limited, a deed of priority and a security sharing deed.
Interest rate riskAt the reporting date the interest rate profile of the Group’s interest-bearing financial instruments was:
Carrying amount2019 2018
$’000 $’000Variable rate financial assets 5,310 4,962
Fair value sensitivity analysis for fixed rate instrumentsThe Group does not account for any fixed rate financial assets and liabilities at fair value through profit or loss, and the Group does not designate derivatives (interest rate swaps) as hedging instruments under a fair value hedge accounting model. Therefore, a change in interest rates at the reporting date would not affect profit or loss.
Cash flow sensitivity analysis for variable rate instrumentsThe impact of a change of 100 basis points in interest rates at the reporting date is immaterial.
For
per
sona
l use
onl
y
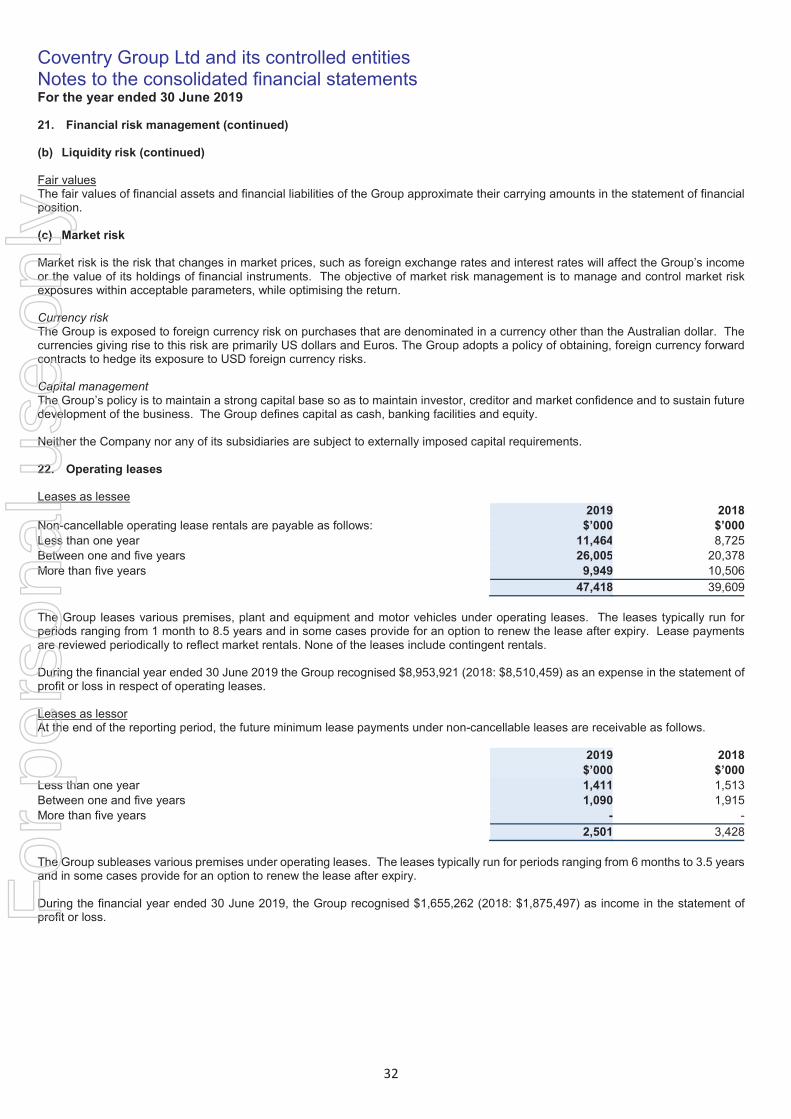
Coventry Group Ltd and its controlled entitiesNotes to the consolidated financial statementsFor the year ended 30 June 2019
32
21. Financial risk management (continued)
(b) Liquidity risk (continued)
Fair valuesThe fair values of financial assets and financial liabilities of the Group approximate their carrying amounts in the statement of financial position.
(c) Market risk
Market risk is the risk that changes in market prices, such as foreign exchange rates and interest rates will affect the Group’s income or the value of its holdings of financial instruments. The objective of market risk management is to manage and control market riskexposures within acceptable parameters, while optimising the return.
Currency riskThe Group is exposed to foreign currency risk on purchases that are denominated in a currency other than the Australian dollar. The currencies giving rise to this risk are primarily US dollars and Euros. The Group adopts a policy of obtaining, foreign currency forward contracts to hedge its exposure to USD foreign currency risks.
Capital managementThe Group’s policy is to maintain a strong capital base so as to maintain investor, creditor and market confidence and to sustain future development of the business. The Group defines capital as cash, banking facilities and equity.
Neither the Company nor any of its subsidiaries are subject to externally imposed capital requirements.
22. Operating leases
Leases as lessee2019 2018
Non-cancellable operating lease rentals are payable as follows: $’000 $’000Less than one year 11,464 8,725Between one and five years 26,005 20,378More than five years 9,949 10,506
47,418 39,609
The Group leases various premises, plant and equipment and motor vehicles under operating leases. The leases typically run for periods ranging from 1 month to 8.5 years and in some cases provide for an option to renew the lease after expiry. Lease payments are reviewed periodically to reflect market rentals. None of the leases include contingent rentals.
During the financial year ended 30 June 2019 the Group recognised $8,953,921 (2018: $8,510,459) as an expense in the statement of profit or loss in respect of operating leases.
Leases as lessorAt the end of the reporting period, the future minimum lease payments under non-cancellable leases are receivable as follows.
2019 2018$’000 $’000
Less than one year 1,411 1,513Between one and five years 1,090 1,915More than five years - -
2,501 3,428
The Group subleases various premises under operating leases. The leases typically run for periods ranging from 6 months to 3.5 years and in some cases provide for an option to renew the lease after expiry.
During the financial year ended 30 June 2019, the Group recognised $1,655,262 (2018: $1,875,497) as income in the statement of profit or loss.F
or p
erso
nal u
se o
nly

Coventry Group Ltd and its controlled entitiesNotes to the consolidated financial statementsFor the year ended 30 June 2019
33
23. Controlled entitiesCountry of
IncorporationOwnership interest
2019 2018% %
COV Holdings (Aust) Pty Ltd Australia 100 100Coventry Group (NZ) Limited New Zealand 100 100COV Holdings (NZ) Pty Ltd (i) New Zealand 100 100Nubco Proprietary Limited (ii) Australia 100 -
The ultimate parent entity is Coventry Group Ltd.
(i) The company is a 100% controlled entity of COV Holdings (Aust) Pty Ltd and operates in New Zealand.(ii) On 1 March 2019, the Company acquired 100% of the issued capital of Nubco Proprietary Limited. Refer to note 3(b).
24. Reconciliation of cash flows from operating activities
Note 2019 2018Cash flows from operating activities $’000 $’000Profit/(loss) for the period (1,426) 5,977Adjustments for:Gain on sale of discontinued operation - (13,094)Provision for stock obsolescence (540) (1,993)Depreciation and amortisation 1,666 1,337Other non-cash or non-operating exceptional items (4) 441Interest income from other entities (34) (9)Interest expense 7 624 509Dividend received - (362)Net (gain) on disposal of property, plant and equipment (50) (234)Income tax expense/(benefit) 8 685 1,026Operating profit/(loss) before changes in working capital and provisions
921 (6,402)
Change in trade and other receivables (4,499) (5,077)Change in inventories (2,111) 71Change in trade and other payables 2,103 6,824Change in provisions and employee benefits 236 1,244
(3,350) (3,340)Interest paid (624) (509)Income taxes paid (396) (230)Net cash used in operating activities (4,370) (4,079)
25. Related parties
Transactions with key management personnel
Key management personnel compensation Key management personnel compensation comprised the following:
2019 2018$ $
Short-term employee benefits 908,797 866,281Post-employment benefits 62,895 59,345Other long-term benefits 76,369 69,447Termination benefits 5,723 -Share-based payments - 88,800
1,053,784 1,083,873
Apart from the details disclosed in this note, no director has entered into a material contract with the Group since the end of the previous financial year and there were no material contracts involving directors’ interests existing at year-end.
Key management personnel transactionsFrom time to time, key management personnel may purchase goods from companies within the Group on the same terms as apply to other employees of the Group. The value of these transactions is insignificant.
For
per
sona
l use
onl
y
Coventry Group Ltd and its controlled entitiesNotes to the consolidated financial statementsFor the year ended 30 June 2019
34
25. Related parties (continued)
Transactions with other related parties
The Group has a related party relationship with its controlled entities (see Note 23). Transactions between the parent entity and its controlled entities are eliminated on consolidation and are not disclosed.
26. Change in accounting policies
This note explains the impact of the adoption of AASB 9 Financial Instruments and AASB 15 Revenue from Contracts with Customers on the Group’s financial statements and also discloses the new accounting policies applied from 1 July 2018.
AASB 9 Financial Instruments
(i) Accounting policies applied effective 1 July 2018
Investments and other financial assets
From 1 July 2018, the Group classifies its financial assets in the following measurement categories:Those to be measured subsequently at fair value (either through other comprehensive income (“OCI”), or through profit or loss), andThose to be measured at amortised cost.
The classification depends on the entity’s business model for managing the financial assets and the contractual terms of the cash flows.
At initial recognition, the Group measures a financial asset at its fair value plus, in the case of a financial asset not at fair value through profit or loss (“FVPL”), transaction costs that are directly attributable to the acquisition of the financial asset. Transactions costs of financial assets carried at FVPL are expensed in profit or loss.
Impairment of financial assets
From 1 July 2018, the Group assesses on a forward looking basis the expected credit losses associated with its instruments carried at amortised costs and fair value through OCI. The impairment methodology applied depends on whether there has been a significant increase in credit risk.
For trade receivables, the Group applies the simplified approach permitted by AASB 9, which required expected lifetime losses to be recognised from initial recognition of the receivables.
To measure the expected credit losses, trade receivables and contract assets have been grouped based on shared credit risk characteristics and the days past due. The contract assets relate to unbilled work in progress and have substantially the same risk characteristics as the trade receivables for the same type of contract. The Group has concluded that the expected loss rates of trade receivables are a reasonable approximation to the loss rates for the contract assets.
Trade receivables and contract assets are written off when there is no reasonable expectation of recovery. Indicators that there is no reasonable expectation of recovery include, amongst others, the failure to make a contractual payment for a period of greater than 120 days past due.
Derivative and hedging
The Group uses forward foreign exchange contracts to hedge the variability in cash flows arising from changes in the foreign exchange rates relating to foreign currency borrowing, receivables, and sales. The Group designates only the change in fair value of the spot element of the forward exchange contract as the hedging instrument in cash flow hedging relationship.
The effective portion of changes in the fair value of derivatives that are designated and qualify as cash flow hedges is recognised in the cash flow hedge reserve as a separate component of equity. The gain or loss relating to the ineffective portion is recognised immediately in the profit or loss.
(ii) Accounting policies applied for comparative reporting period ended 30 June 2018
Financial assets that are measured at amortised cost are assessed to determine whether there is objective evidence that an impairment has been incurred but not yet identified. For these receivables the estimated impairment losses are recognised in a separate provision for impairment.
For
per
sona
l use
onl
y

Coventry Group Ltd and its controlled entitiesNotes to the consolidated financial statementsFor the year ended 30 June 2019
35
26. Change in accounting policies (continued)
AASB 9 Financial Instruments (continued)
(iii) Impact on adoption on 1 July 2018
The Group has adopted AASB 9 using the retrospective approach to implementation (with practical expedients) with the effect of initially applying the standard recognised at the date of initial application which is 1 July 2018. The practical expedients allow for differences in the carrying amounts of financial assets and financial liabilities to be recognised in retained earnings and reserves at 1 July 2018. Accordingly, the information presented for comparative periods has not been restated.
On transition to AASB 9, there was no impact on retained earnings or reserves at 1 July 2018. As such, there was no impact on basic or diluted earnings per share.
Classification and Presentation
On 1 July 2018, the Group’s management has reassessed and reclassified its financial assets instruments into the appropriate AASB9 categories based on the entity’s business model.
The Group’s financial assets remain classified as amortised cost. There is no impact on the Group’s accounting for financial liabilities. The foreign exchange forwards and foreign exchange swap in place at 30 June 2018 qualified as cash flow hedges under AASB 9.
(iv) Impact on the financial statements for year ended 30 June 2019
There was no impact for the year ended 30 June 2019 in the loss allowance for trade receivables and contract assets compared with the amount that would have been reflected under AASB 139.
The Group has also changed the presentation of certain amounts in the statement of financial position to reflect the terminology of AASB 9 as follows:
Other current receivables, prepayments and derivative financial instruments were previously presented together with trade receivables but are now presented as other financial assets at amortised cost (receivables), other current assets (prepayments) and derivative financial instruments respectively in the statement of financial position, to reflect their different nature.
AASB 15 Revenue from Contracts with Customers
(v) Accounting policies applied effective 1 July 2018
Under AASB 15, revenue is recognised when control of a good or service transfers to a customer. Determining the timing of the transfer of control – at a point in time or over time - requires judgement. The following amended revenue recognition accounting policies have been applied from 1 July 2018:
Sale of goods – revenue recognised at a point in time
Revenue from the sale of goods that are not subject to contract manufacturing arrangements is measured at the fair value of the consideration received or receivable, net of returns, rebates and goods and services tax payable to the taxation authority.
Revenue is recognised when a customer obtains control of the promised goods and the Group has satisfied its performance obligation in relation to the promised goods. In determining when control of promised goods passes to the customer, the Group considers the transfer of significant risk and rewards of ownership of the goods to the customer to indicate that the customer has the ability to direct the use of and obtain substantially all of the remaining benefits from the goods. The timing of the transfer of risk and reward to the customers for the sale of goods occurs either:
When the goods are despatched or delivered in line with the Incoterms as detailed in the relevant contract of sale or purchaseorder for the goods. The Group sells a significant proportion of its products on Free-In-Store (“FIS”) / Delivered at Place (“DAP”) Incoterms. This means the Groups control of the goods passes when the product is delivered to the agreed destination. When they are made available to the customer and ownership transfers prior to despatch as detailed in the relevant contract of sale or purchase order for the goodsOn notification (following stocktake) that the product has been used when the goods are consignment products located at customers’ premises.
Where cash consideration has been received but the revenue recognition criteria has not been met, such amounts have been recorded on the consolidated statement of financial position as a contract liability.
Sale of goods – contract manufacturing and supply revenue recognised over time
For
per
sona
l use
onl
y
Coventry Group Ltd and its controlled entitiesNotes to the consolidated financial statementsFor the year ended 30 June 2019
36
26. Change in accounting policies (continued)
AASB 15 Revenue from Contracts with Customers (continued)
The Group has determined that for bundled contract manufacturing comprising design, build, install and service elements, the customer controls the goods once the goods are finished and installed on premises in accordance with the relevant contract. This is because under the contract, goods are manufactured to a customer’s specification, and if a firm order that is placed by the customer in accordance with the agreement is terminated, the Group is entitled to a reimbursement of the costs incurred in manufacturing the goods, including a reasonable margin. Therefore, revenue for the agreements and the associated costs are recognised over time. That is, before the goods are delivered to the customer’ premises. Invoices issued according to contractual terms and amounts not yet invoiced are presented as contract assets.
(i) Accounting policies applied for comparative reporting period ended 30 June 2018
Sale of goods
Revenue from sale of goods is measured at the fair value of the consideration received or receivable, net of returns, rebates and goods and services tax payable to the taxation authority.
Revenue is recognised when the significant risks and rewards of ownership have been transferred to the buyer, recovery of the consideration is probably, the associated costs and possible return of goods can be estimated reliably, there is no continuingmanagement involvement with the goods, and the amount of revenue can be measured reliably.
(ii) Impact on adoption on 1 July 2018
The Group has adopted AASB 15 using the cumulative approach to implementation (with practical expedients) with the effect of initially applying the standard recognised at the date of initial application which is 1 July 2018. The practical expedients allow the new standard to be applied only to contracts that remain in force at 1 July 2018. Accordingly, the information presented for comparative periods has not been restated.
On transition to AASB 15, there was no impact on retained earnings at 1 July 2018. That is, because there were no contracts that remain in force at 30 June 2018 for the fluids business. As such, there was no impact on basic or diluted earnings per share.
(iii) Impact on the financial statements for year ended 30 June 2019
There was no impact for the year ended 30 June 2019.
The Group has disaggregated revenue from contracts with customers using existing segments and the timing of the transfer of goods and services (at a point in time vs over time) in accordance with AASB 15. Refer to note 2.
27. Events occurring after the reporting period
Other than the matters outlined elsewhere in the Group’s financial statements, no matters or circumstances have arisen since the end of the financial year that have significantly affected, or may significantly affect, the operations, results of operations or state of affairs on the Group in subsequent accounting periods.
For
per
sona
l use
onl
y
Coventry Group Ltd Directors’ Report For the year ended 30 June 2019
37
The directors present their report together with the consolidated financial report of the Group comprising Coventry Group Ltd (the “Company”) and its controlled entities for the year ended 30 June 2019.
Contents of Directors' Report Page
1. Directors 38
2. Principal activities 39
3. Consolidated results 40
4. Dividends 40
5. Review of operations and results 40
6. Earnings per share 41
7. Significant change in the company's affairs 41
8. Events subsequent to reporting date 41
9. Likely developments 41
10. Remuneration report - audited
10.1 Key Management Personnel (KMPs) 41
10.2 Principles used to determine the nature and amount of compensation 41
10.3 Details of compensation 44
10.4 Service contracts 45
10.5 Director share movement 45
11. Environmental regulation 45
12. Insurance of officers 45
13. Corporate governance 45
14. Non-audit services 46
15. Lead auditor's independence declaration 46
16. Company secretary 46
17. Rounding off 46
Directors' Declaration 47
Lead Auditor’s Declaration under S307C of the Corporations Act 2001 48
Independent Auditor’s Report 49
Shareholder Information 54
Corporate Directory 55
For
per
sona
l use
onl
y
Coventry Group Ltd Directors’ Report For the year ended 30 June 2019
38
1. Directors
Information on DirectorsThe directors of the Company at any time during or since the end of the financial year and up to the date of this report are:
Name, qualifications, independence status and special responsibilities
Experience and other directorships
Neil George CathieFCPA, GAICD, FCISIndependent non-executive ChairmanChairman of Remuneration Committee Member Audit and Risk committee
Mr Cathie was appointed as a director of the Company in September 2014 and as Chairman in January 2015. He has extensive experience in very relevant areas including having a 27 year career at Australia’s largest and most successful plumbing and bathroom distributor, ASX listed Reece Limited, during which time he served as its Chief Financial Officer, Company Secretary and General Manager, Finance and IT. He is currently a director of and advisor to a number of private companies.
Mr Cathie was a non-executive director of Millennium Services Group Ltd from 16 October 2018 to 7 March 2019.
He held no other listed company directorships during the past three financial years.
Robert James BullussFCPA, GAICD, B Bus (Acc)Managing DirectorChief Executive Officer
Mr Bulluss was appointed Chief Executive Officer on 3 May 2017 and Managing Director and Chief Executive Officer on 29 August 2017. He was previously Chief Finance Officer (CFO) of the Company from October 2016 to April 2017. Prior to joining the Company he was CFO for over 15 years for the Australasian division of Bunzl plc.
He held no other listed company directorships during the past three financial years.
Andrew William NisbetGAICDIndependent non-executive DirectorMember of Audit and Risk Committee Member of Remuneration Committee
Mr Nisbet was appointed as a director of the Company in October 2017.
During his extensive career at ASX listed Reece Limited he held a variety of senior leadership roles, from Marketing to Merchandising, IT, Supply Chain Transformation, Innovation and the management of a number of Strategic Business Units, including the Reece expansion into New Zealand.
Mr Nisbet is a graduate of the Australian Institute of Company Directors. he continues to consult to businesses on strategy and works with SME’s in setting up their advisory boards.
He held no other listed company directorships during the past three financial years.
James Scott Charles ToddB.Comm, LLB, FFin, MAICDIndependent non-executive DirectorChairman of Audit and Risk CommitteeMember of Remuneration Committee
Mr Todd was appointed as a director of the Company on 3 September 2018.
Mr Todd is an experienced company director, corporate adviser and investor. Hecommenced his career in investment banking, and has taken active roles with, and invested in, a range of public and private companies. He was until recently Managing Director of Wolseley Private Equity, an independent private equity firm which he co-founded in 1999.
He is also a Non-executive Director of two other ASX listed companies, IVE Group Ltd (director since June 2015) and HRL Holdings Ltd (director since March 2018).
He has held no other listed company directorships during the past three financial years.
For
per
sona
l use
onl
y

Coventry Group Ltd Directors’ Report For the year ended 30 June 2019
39
1. Directors (continued)
Directors’ Interests
As at the date of this report particulars of the relevant interest of each director in the securities of the Company are as follows:
Number of Ordinary Shares
NG Cathie 734,520
RJ Bulluss 300,000
AW Nisbet 119,885
JSC Todd 116,746
During the 2018/19 financial year and as at the date of this report no director has declared any interest in a contract or proposed contract with the Company, the nature of which would be required to be reported in accordance with subsection 300(11)(d) of the Corporations Act 2001.
Directors’ Meetings
The following table sets out the number of meetings of the Company’s board of directors and each board committee, held during the year ended 30 June 2019, and the number of meetings attended by each director.
Board of Directors Audit & Risk Committee Remuneration Committee
HeldEligible
to attendAttended Held
Eligible to attend
Attended HeldEligible to
attendAttended
NG Cathie 11 11 11 3 3 3 2 2 2RJ Bulluss 11 11 11 3 3 3 2 0 0AW Nisbet 11 11 11 3 3 3 2 2 2JSC Todd 11 9 9 3 2 2 2 1 1
Note: Directors may pass resolutions in writing without a formal meeting being convened. Such resolutions are deemed by the Company’s Constitution to be meetings. The above table does not include such meetings.
2. Principal activities
The principal activities of the Group during the financial year were:
Trade Distribution The importation, distribution and marketing of industrial fasteners, stainless steel fasteners, construction fasteners, specialisedfastener products and systems, industrial hardware and associated industrial tools and consumables.importation, distribution and marketing of hardware, components and finished products to the commercial cabinet making, joineryand shop fitting industries.
Fluid Systems design and installation of lubrication systemsdistribution of hose, connectors, fittings and hydraulic hose assembliesdesign and supply of service truck componentsinstallation of fire suppression systemsdesign and distribution of fluid handling systems, pneumatic component sales and sale of hydraulic associated products andconsumablesrock hammer service and repairs
For
per
sona
l use
onl
y

Coventry Group Ltd Directors’ Report For the year ended 30 June 2019
40
3. Consolidated results
Results of the Group for the year ended 30 June 2019 were as follows:2019 2018
$’000 $’000Revenue from sale of goods 202,346 168,050Loss before tax (741) (7,275)Income tax expense (685) (1,026)Loss for the year from Continuing operations (1,426) (8,301)
Profit from Discontinued operations, net of tax - 14,278(Loss)/profit for the year from Continuing and Discontinued operations (1,426) 5,977(Loss)/profit after tax for the year attributable to:
- Owners of the Company (1,426) 5,651- Non-controlling interests - 326
(Loss)/profit after tax for the year (1,426) 5,977
4. Dividends
There were no dividends paid or declared by the Group to members for the year ended 30 June 2019 (2018: $Nil).
5. Review of operations and results
People
The Group had 8 Lost Time Injuries (LTI’s) during the year which is a disappointing result. Our aspiration is for zero LTI’s and plans are being implemented to improve our safety systems to achieve this goal.
We remain fully focussed on our Customers, Suppliers and People, applying our values of Respect, Fairness, Teamwork, Professionalism and Integrity.
Financial performance
2019 2018 % change$M $M
Revenue from sale of goods 202.3 168.1 +20.4Underlying EBITDA +2.8 -4.7 n/mUnderlying EBIT +1.1 -6.1 n/mNPAT -1.4 -8.3 n/mNTA per share ($) 0.59 1.30 -54.2Net cash/debt -4.1 5.0 n/mShare price at year end ($) 0.91 1.35 -32.6
Excluding the discontinuing operations of AA GasketsExcluding the profit on sale of the AA Gaskets assets. n/m = not meaningful
Review of businesses
Fluid SystemsFluid Systems (FS), have had another outstanding year with exceptional sales growth. Sales growth of 27.3% (15.7% excluding Torque) was achieved following 20.9% achieved in FY18. Sales growth is being driven by an increase in service, maintenance, upgrade and new equipment activity in the mining and resources sector. Underlying EBITDA in FY19 of $8.8m including Torque compared to $5.5m in FY18.
Trade DistributionTrade Distribution (TD) sales for the year including acquisitions up 16.1% on the prior year and excluding acquisitions up 1.5% on the prior year. The underlying EBITDA for TD was $3.3m compared to -$2.5m loss in FY18.
KANZ have continued to perform strongly with sales up 13.3% on last year with highlights including continuing growth in the construction industry and the opening of two new branches. The Auckland CBD branch has also been relocated to a much larger facility. KANZ is the leading fastening systems business in the construction and roofing and cladding markets in New Zealand and has good growthprospects.
For
per
sona
l use
onl
y
Coventry Group Ltd Directors’ Report For the year ended 30 June 2019
41
5. Review of operations and results (continued)
KAA sales are in line with PCP excluding one-off project sales to Chevron in WA ($1.282m) and the impact of unprofitable store closures ($1.467m). Whilst a solid improvement in KAA contribution has been achieved, we remain well short of achieving a breakeven result. Our progress has been slowed in the main due to the difficulty attracting quality experienced people into the business.
In the last six months we have made quality key appointments including Peter Shaw (ex Wesfarmers) as General Manager, Chris Smith (ex Blackwoods) as Qld Regional Manager, Mark Ramsdale (ex Bunzl Safety) as NSW Regional Manager, Christian McCormack (ex Stanley Black and Decker) as Artia Manager and Tim Holland (ex Blackwoods) as Southern Regional Manager. We are continuing to strengthen our sales team with new Business Development Manager appointments in NSW, Queensland, Victoria and WA.
Nubco had a positive start with the Group recording sales and earnings in line with expectations for the four months post acquisition.
6. Earnings per share
Basic loss per share for the year ended 30 June 2019 was 2.3 cents. This compares to a basic earnings from continuing and discontinued operations per share of 15.1 cents for the previous year.
7. Significant change in the Company's affairs
Except for the capital raising, acquisition of Torque Industries and acquisition of Nubco Proprietary Limited, in the opinion of the Directors, there have been no other significant changes in the Group’s state of affairs during the financial year.
8. Events subsequent to reporting date
The directors are not aware of any matter or circumstance having arisen since the end of the financial year and the date of this report that has significantly affected, or may significantly affect the operations of the Group, the results of those operations, or the state of affairs of the Group, in future financial years.
9. Likely developments
The Group will continue to implement its 5 year strategy and continue to operate in the markets in which it currently participates.
10. Remuneration report - audited
Remuneration is referred to as compensation throughout this remuneration report.
10.1 Key Management Personnel (KMPs)
KMPs are the persons who have authority and responsibility for planning, directing and controlling the activities of the Company and the Group. The following were KMPs of the Group at any time during the reporting period and unless otherwise indicated were KMPs for the entire period:
Directors Key Management PersonnelNG Cathie RJ Jackson RJ Bulluss (CEO and Managing Director) A Donaldson (resigned 11 September 2018)AW Nisbet JSC Todd (appointed 3 September 2018)
10.2 Principles used to determine the nature and amount of compensation
Non-executive directorsNon-executive Directors receive cash fees for their board and committee work. They are eligible to participate in the Executive and Director Incentive Plan which was approved by shareholders at the Annual General Meeting of the Company in November 2017.
Non-executive directors’ cash fees are determined within an aggregate directors’ fees pool limit, which is periodically recommended for approval by shareholders. The total pool currently stands at $550,000 (2018: $550,000) per annum, which was last approved byshareholders in November 2004 with effect from 1 July 2004. The Board determines the allocation of the maximum amount approved by shareholders amongst the respective directors, having regard to their duties and responsibilities. Directors’ fees are not directly linked to Company performance. Non-executive directors do not receive termination benefits. There is no provision for retirement allowances to be paid to non-executive directors.
For
per
sona
l use
onl
y
Coventry Group Ltd Directors’ Report For the year ended 30 June 2019
42
10. Remuneration report – audited (continued)
10.2 Principles used to determine the nature and amount of compensation (continued)
As at 30 June 2019 the non-executive directors’ fees were allocated as follows (includes statutory superannuation contributions):
2019 2018$ $
Chairman (inclusive of Board and Committee work) 96,000 96,000Non-executive Directors (inclusive of Board and Committee work) 72,000 72,000
Executive pay
Remuneration policiesRemuneration of directors and senior executives is the responsibility of the Remuneration Committee. The Committee has resolved to set remuneration packages which are appropriate in the context of the company’s size, complexity and performance but which will attract the calibre of executive required to drive necessary change in order to enhance performance. The Committee seeks external advice in relation to these matters where necessary.
Remuneration for the CEO and senior executives currently comprises three elements:(1) Fixed, cash-based remuneration which includes salary, superannuation and benefits(2) Eligibility to participate in the Company’s short term incentive plan (STI Plan)(3) Eligibility to participate in the Company’s long term share based Executive and Director Incentive Plan (LTI Plan)
The CEO and senior executives have employment contracts with notice periods executable by either party. There are no arrangements in place to provide the CEO or any senior executive with a retirement benefit other than those which accrue by law. Superannuation contributions are paid at the superannuation guarantee rate.
Cash incentives under the STI Plan of up to 65% of fixed annual compensation are payable to the CEO and senior executives based on financial and non-financial measures framed around the Company’s trading performance and each individuals performance.
The LTI Plan was approved by shareholders at the 2017 annual general meeting. This share-based plan provides for the granting or issuing of performance rights in accordance with its terms and subject to the terms and performance hurdles set by the Board. Currently, the principal hurdle for both the STI Plan and the LTI Plan is EBIT growth. The targets are set by the Board at the beginning of the financial year.
Business Performance
The Board is pleased with the turnaround of the Group’s performance across 2018 and 2019. In considering the Group’s performance and benefits for shareholder wealth, the remuneration committee have regard to the following financial performance metrics in respect of the current financial year and the previous four financial years.
2019 2018 2017(i) 2016 2015$’000 $’000 $’000 $’000 $’000
Sales revenue 202,346 168,050 169,146 176,784 190,706EBITDA 2,811 (4,748) (5,790) 2,036 (2,266)EBIT 1,145 (6,085) (8,714) (1,291) (6,353)NPAT (ii) (1,426) (8,301) (35,539) (1,821) (24,616)Dividends paid - - - - -Share price at year end ($) 0.91 1.35 0.60 0.94 1.34
(i) Comparative information for the year ended 30 June 2017 has not been restated for the effects of the application of AASB 5 Non-Current Assets for sale and Discontinued Operations following the disposal of the AA Gaskets business.
(ii) Profit is one of the financial performance targets considered in setting the Short Term Incentive (STI). Profit amounts have beencalculated in accordance with Australian Accounting Standards (AASBs).
In relation to FY19, the CEO and Managing Director (R Bulluss) was granted 178,718 performance rights under the terms of the LTI Plan following the successful passing of a resolution at the 2018 Annual General Meeting of the Company. These performance rights had a performance period that ended on 30 June 2019 with performance hurdles relating principally to the EBIT of the Company. The Board has determined 67% of the performance rights granted will vest in accordance with the LTI Plan. The unvested balance will be forfeited. Although the Board is pleased with the turnaround progress made in FY19 and since Mr Bulluss’s appointment, Konnect and Artia Australia (KAA) did not return to profitability in FY19. For this reason, the percentage of vesting has been reduced to a level considered fair and which strikes a balance between motivation, reward, retention and outcomes. In the board’s view, missing the KAA hurdle in no way diminishes the broader and substantial turnaround achievements of FY19.
For
per
sona
l use
onl
y
Coventry Group Ltd Directors’ Report For the year ended 30 June 2019
43
10. Remuneration report – audited (continued)
10.2 Principles used to determine the nature and amount of compensation (continued)
In relation to FY19, an offer to participate in the LTI Plan was made to four other Company senior executives. The total performance rights granted was 310,574. The Board has determined 67% of the performance rights will vest in accordance with the LTI Plan in the same manner and for the same reasons as outlined for the CEO and Managing Director.
It is intended that the CEO and Managing Director will participate in the LTI Plan in relation to FY20. The maximum face value of the CEO’s FY20 grant is based on the LTI opportunity of 60% of his fixed annual remuneration. The number of performance rights to be granted is determined by dividing the maximum face value by the 10-day volume weighted average price (VWAP) of the Company’s shares preceding the start of the performance period, being the 10 trading days up to and including 30 June 2019. The performance rights will vest based principally on the EBIT achieved by the Company for FY20. An appropriate resolution will be put to the 2019 Annual General Meeting of the Company.
It is intended that six senior executives will participate in the LTI Plan in relation to FY20. The maximum face value of each senior executive’s FY20 grant is based on the LTI opportunity of 40% of his or her fixed annual remuneration. The number of performance rights to be granted is determined by dividing the maximum face value by the 10-day volume weighted average price (VWAP) of the Company’s shares preceding the start of the performance period, being the 10 trading days up to and including 30 June 2019. The performance rights will vest based principally on the EBIT achieved by the Company for FY20 and at the discretion of the Board.
For
per
sona
l use
onl
y

Co
ven
try
Gro
up
Ltd
D
ire
ctor
s’ R
ep
ort
F
or
the
year
ended
30 J
une 2
019
44
10
.R
em
un
era
tio
n r
ep
ort
– a
ud
ite
d(c
on
tin
ue
d)
10
.3D
eta
ils
of
co
mp
en
sati
on
The
fol
low
ing
tabl
e pr
ovid
es t
he d
etai
ls,
natu
re a
nd a
mou
nt o
f el
emen
ts o
f com
pens
atio
n fo
r th
e ke
y m
anag
emen
t pe
rson
nel o
f th
e C
ompa
ny a
nd t
he G
roup
for
the
year
end
ed 3
0 Ju
ne 2
019.
Sh
ort
-ter
mP
ost
-em
plo
ymen
tO
ther
lo
ng
-ter
mS
har
e-b
ased
pay
men
tP
rop
ort
ion
of
rem
un
erat
ion
p
erfo
rman
ce
rela
ted
Cas
h s
alar
y,
leav
e p
aid
an
d f
ees
ST
I ca
sh
bo
nu
s
No
n-
mo
net
ary
ben
efit
sT
ota
lS
up
er-
ann
uat
ion
(i)
Lo
ng
-ser
vice
&
ann
ual
leav
e p
rovi
sio
n
accr
ual
Ter
min
atio
n
ben
efit
s
Sh
are-
bas
ed
pay
men
t(i
ii)
To
tal
$$
$$
$$
$$
$D
irec
tors
NG
Cat
hie
-C
hairm
an20
1987
,671
--
87,6
718,
329
--
-96
,000
-2018
87,6
71
--
87,
671
8,3
29
--
55,5
00
151,5
00
-R
J B
ullu
ss (
appo
inte
d A
ugu
st 2
017
) (ii
)20
1937
9,46
9-
-37
9,46
920
,531
46,5
00-
-44
6,50
0-
2018
379,
951
--
379,
951
20,0
49
45,
097
--
445,0
97
-A
W N
isbet
(appo
inte
d O
ctober
201
7)20
1965
,753
--
65,7
536,
247
--
-72
,000
-2018
49,3
15
--
49,3
15
4,6
85
--
33,3
00
87,3
00
-JS
C T
odd
(app
oin
ted
Sep
tem
ber
201
8)
2019
55,2
33-
-55
,233
5,24
7-
--
60,4
80-
KR
Per
ry (
resi
gned
Nov
embe
r 2017)
2018
34,9
31
--
34,9
31
3,3
19
--
-38,2
50
-N
J W
illis
(re
signed
Augus
t 20
17)
2018
12,1
76
--
12,1
76
1,1
56
--
-13,3
32
-V
Pap
achris
tos
(res
igned
July
201
7)
2018
6,0
88-
-6,0
88578
--
-6,6
66-
To
tal
dir
ecto
rs' r
emu
ner
atio
n20
1958
8,12
6-
-58
8,12
640
,354
46,5
00-
-67
4,98
0-
2018
570,1
32
--
570,
132
38,1
16
45,
097
-88,8
00
742,1
45
-K
ey M
anag
emen
t P
erso
nn
elR
J Ja
ckso
n (a
ppo
inte
d S
epte
mber
2017)
2019
299,
517
--
299,
517
20,5
3129
,869
--
349,
917
-2018
230,
952
--
230,9
52
15,0
36
17,
997
--
263,9
85
-A
Dona
ldso
n (r
esig
ned
Sep
tem
ber
2018)
2019
21,1
54-
-21
,154
2,01
0-
5,72
3-
28,8
87-
2018
65,1
97
--
65,1
97
6,1
936,3
53-
-77,7
43
-
To
tal k
ey m
anag
emen
t p
erso
nn
el
rem
un
erat
ion
2019
320,
671
--
320,
671
22,5
4129
,869
5,72
3-
378,
804
-2018
296,
149
-
-
296
,149
21,2
29
24,
350
--
341,7
28
-
To
tal
dir
ecto
rs' a
nd
key
man
agem
ent
per
son
nel
rem
un
erat
ion
2019
908,
797
--
908,
797
62,8
9576
,369
5,72
3-
1,05
3,78
4-
2018
866,2
81
--
866,2
81
59,3
45
69,4
47
-88,8
00
1,0
83,8
73
-
Pre
miu
ms
in r
espe
ct o
f th
e D
irect
ors’
and
Off
icer
s’ in
sura
nce
polic
y ar
e no
t in
clud
ed a
bove
, as
the
polic
y do
es n
ot s
peci
fy t
he p
rem
ium
pai
d in
res
pect
of
indi
vidu
al d
irect
ors
and
offic
ers.
(i)In
clud
es s
tatu
tory
sup
eran
nuat
ion
cont
ribut
ions
and
add
ition
al v
olun
tary
con
trib
utio
ns.
(ii)
Tot
al r
emun
erat
ion
for
the
2019
yea
r is
incl
uded
and
the
201
8 re
mun
erat
ion
repr
esen
ts th
e re
mun
erat
ion
paid
as
a ke
y m
anag
emen
t pe
rson
nel f
or t
he p
erio
d of
app
oint
men
t.(ii
i)In
Nov
embe
r 20
17,
shar
es in
the
Com
pany
wer
e is
sued
to
NG
Cat
hie
(50,
000)
and
AW
Nis
bet
(30,
000)
pur
suan
t to
the
ir pa
rtic
ipat
ion
in t
he C
ompa
ny’s
Dire
ctor
and
Exe
cutiv
e In
cent
ive
Pla
n. A
ppro
val f
or t
he is
sue
was
obta
ined
und
er li
stin
g ru
le 1
0.14
at
the
Nov
embe
r 20
17 A
nnua
l Gen
eral
Mee
ting.
For
per
sona
l use
onl
y

Coventry Group Ltd Directors’ Report For the year ended 30 June 2019
45
10. Remuneration report – audited (continued)
10.4 Service contracts
Compensation and other terms of employment for the CEO and Managing Director and other key management personnel are formalisedin employment contracts. Major provisions of the contracts relating to compensation are set out below:
Robert Bulluss, CEO and Managing Director The contract has no fixed term.Fixed annual compensation to be reviewed annually by the Remuneration Committee.Long service leave is payable by the Company in accordance with relevant state legislation.The contract provides for participation in short-term and long-term incentive plans.Other than for an act that may have a serious detrimental effect on the Company, such as wilful disobedience, fraud or misconduct,termination of employment requires six months’ notice by the Company.
Rodney Jackson, Chief Financial Officer The contract has no fixed term.Fixed annual compensation to be reviewed annually by the Remuneration Committee.Long service leave is payable by the Company in accordance with relevant state legislation.The contract provides for participation in short-term and long-term incentive plans.Other than for an act that may have a serious detrimental effect on the Company, such as wilful disobedience, fraud or misconduct,termination of employment requires eighteen weeks’ notice by the Company.
10.5 Director share movement
The movement during the reporting period in the number of ordinary shares in the Company held, directly, indirectly or beneficially, by each key management person, including their related parties, is as follows:
Directors
Held at30 June
2018 Purchases
Conversion of
Performance Rights
Sales / Cancelled
Held at Resignation/
Retirement
Held at30 June
2019
NG Cathie 237,972 496,548 - - - 734,520AW Nisbet 57,750 62,135 - - - 119,885RJ Bulluss 40,000 260,000 - - - 300,000JSC Todd (appointed September 2018) N/A 116,746 - - - 116,746
No other key management person held shares, directly, indirectly or beneficially, in the Company at 30 June 2019 (2018: Nil).
11. Environmental regulation
The Group is not subject to any specific environmental regulation.
The Group mainly operates warehousing and distribution facilities throughout Australia and New Zealand which have general obligations under environmental legislation of the respective statutory authorities in relation to pollution prevention.
The Company has reviewed its obligations under the National Greenhouse & Energy Reporting Act 2007 (the Act). As the Group isunder the minimum greenhouse and energy thresholds stipulated in the Act, there are no registration and reporting requirements that have to be complied with as at the date of this report.
For the financial year ended 30 June 2019 and as at the date of this report, the Group has not been prosecuted nor incurred any infringement penalty for environmental incidents.
12. Insurance of officers
During the financial year the Company has paid premiums in respect of contracts insuring the directors and officers of the Company against certain liabilities incurred in those capacities. The contracts prohibit further disclosure of the nature of the liabilities and the amounts of the premiums.
13. Corporate governance
The Statement of Corporate Governance Practices is disclosed on the company's website.
For
per
sona
l use
onl
y

Coventry Group Ltd Directors’ Report For the year ended 30 June 2019
46
14. Non-audit services
During the year KPMG, the Company’s auditor, has performed certain other services in addition to their statutory duties. The Board has considered the non-audit services provided during the year by the auditor and is satisfied that the provision of those non-audit services during the year by the auditor is compatible with, and did not compromise, the auditor independence requirements of the Corporations Act 2001, for the following reasons:
all non-audit services were subject to the corporate governance procedures adopted by the Company and have been reviewed bythe Company’s Audit and Risk Committee to ensure they do not impact the integrity and objectivity of the auditor; andthe non-audit services provided do not undermine the general principles relating to auditor independence as set out in APES 110Code of Ethics for Professional Accountants, as they did not involve reviewing or auditing the auditor’s own work, acting in amanagement or decision making capacity for the Company, acting as an advocate for the Company or jointly sharing risks andrewards.
Details of the amounts paid to the auditor of the Company, KPMG, and its related practices for audit and non-audit services provided during the year are set out in Note 5 to the full financial report.
15. Lead Auditor’s independence declaration
The lead auditor’s independence declaration made in accordance with Section 307C of the Corporations Act 2001 forms part of this directors’ report.
16. Company Secretary
Mr Mark Licciardo and Ms Lisa Deramond of Mertons Corporate Services Pty Ltd have were appointed joint Company Secretaries on 11 September 2018. Ms. Angela Donaldson resigned from the position of Company Secretary on 11 September 2018. Ms Lisa Deramond resigned from the position of Company Secretary on 21 November 2018.
Mr Licciardo (B.Bus (Acc), GradDip CSP, FAICD, FGIA, FCIS) is the founder and Managing Director of Mertons Corporate Services Pty Ltd and a former company secretary of a number of ASX 50 companies. His expertise includes working with boards of directors in the areas of corporate governance, business management, administration, consulting and company secretarial matters.
17. Rounding off
The Group is of a kind referred to in ASIC Corporations (Rounding in Financial/Directors' Reports) Instrument 2016/191 and in accordance with that Instrument, amounts in the financial report and Directors’ Report have been rounded off to the nearest thousand dollars, unless otherwise stated.
Signed in accordance with a resolution of the directors.
N.G. CATHIEChairman
R.J. BULLUSS CEO and Managing Director
Melbourne23 August 2019
Melbourne23 August 2019
For
per
sona
l use
onl
y

Coventry Group Ltd and its controlled entitiesDirectors’ declaration
47
1. In the opinion of the directors of Coventry Group Ltd (“the Group”):
a) the financial statements and notes, and the remuneration report in the directors' report, set out on pages 38 to 46, are inaccordance with the Corporations Act 2001, including:
i. giving a true and fair view of the Group’s financial position as at 30 June 2019 and of their performance, for thefinancial year ended on that date; and
ii. complying with Australian Accounting Standards (including the Australian Accounting Interpretations) and theCorporations Regulations 2001;
b) the financial report also complies with International Financial Reporting Standards as disclosed in Note 1(a) of the full financialreport;
c) there are reasonable grounds to believe that the Group will be able to pay its debts as and when they become due andpayable.
2. The directors have been given the declarations by the chief executive officer and chief financial officer for the financial year ended30 June 2019 pursuant to Section 295A of the Corporations Act 2001.
Signed in accordance with a resolution of the directors.
N.G. CATHIEChairman
R.J. BULLUSS CEO and Managing Director
Melbourne23 August 2019
Melbourne23 August 2019
For
per
sona
l use
onl
y

48
KPMG, an Australian partnership and a member firm of the KPMG network of independent member firms affiliated with KPMG International Cooperative (“KPMG International”), a Swiss entity.
Liability limited by a scheme approved under Professional Standards Legislation.
Lead Auditor’s Independence Declaration under
Section 307C of the Corporations Act 2001
To the Directors of Coventry Group Ltd
I declare that, to the best of my knowledge and belief, in relation to the audit of Coventry Group Ltd for the financial year ended 30 June 2019 there have been:
i. no contraventions of the auditor independence requirements as set out in theCorporations Act 2001 in relation to the audit; and
ii. no contraventions of any applicable code of professional conduct in relation to the audit.
K
KPMG J Carey
Partner
Melbourne
23 August 2019
For
per
sona
l use
onl
y

49
KPMG, an Australian partnership and a member firm of the KPMG network of independent member firms affiliated with KPMG International Cooperative (“KPMG International”), a Swiss entity.
Liability limited by a scheme approved under Professional Standards Legislation.
Independent Auditor’s Report
To the shareholders of Coventry Group Ltd
Report on the audit of the Financial Report
Opinion
We have audited the Financial Report of Coventry Group Ltd (the Company).
In our opinion, the accompanying Financial Report of the Company is in accordance with the Corporations Act 2001, including:
giving a true and fair view of theGroup’s financial position as at 30June 2019 and of its financialperformance for the year ended onthat date; and
complying with Australian AccountingStandards and the CorporationsRegulations 2001.
The Financial Report comprises:
Consolidated statement of financial position as at 30June 2019
Consolidated statement of profit or loss,Consolidated statement of comprehensive income,Consolidated statement of changes in equity, andConsolidated statement of cash flows for the yearthen ended
Notes including a summary of significant accountingpolicies
Directors’ Declaration.
The Group consists of the Company and the entities it controlled at the year-end or from time to time during the financial year.
Basis for opinion
We conducted our audit in accordance with Australian Auditing Standards. We believe that the audit evidence we have obtained is sufficient and appropriate to provide a basis for our opinion.
Our responsibilities under those standards are further described in the Auditor’s responsibilities for the audit of the Financial Report section of our report.
We are independent of the Group in accordance with the Corporations Act 2001 and the ethical requirements of the Accounting Professional and Ethical Standards Board’s APES 110 Code of Ethics for Professional Accountants (the Code) that are relevant to our audit of the Financial Report in Australia. We have fulfilled our other ethical responsibilities in accordance with the Code. F
or p
erso
nal u
se o
nly
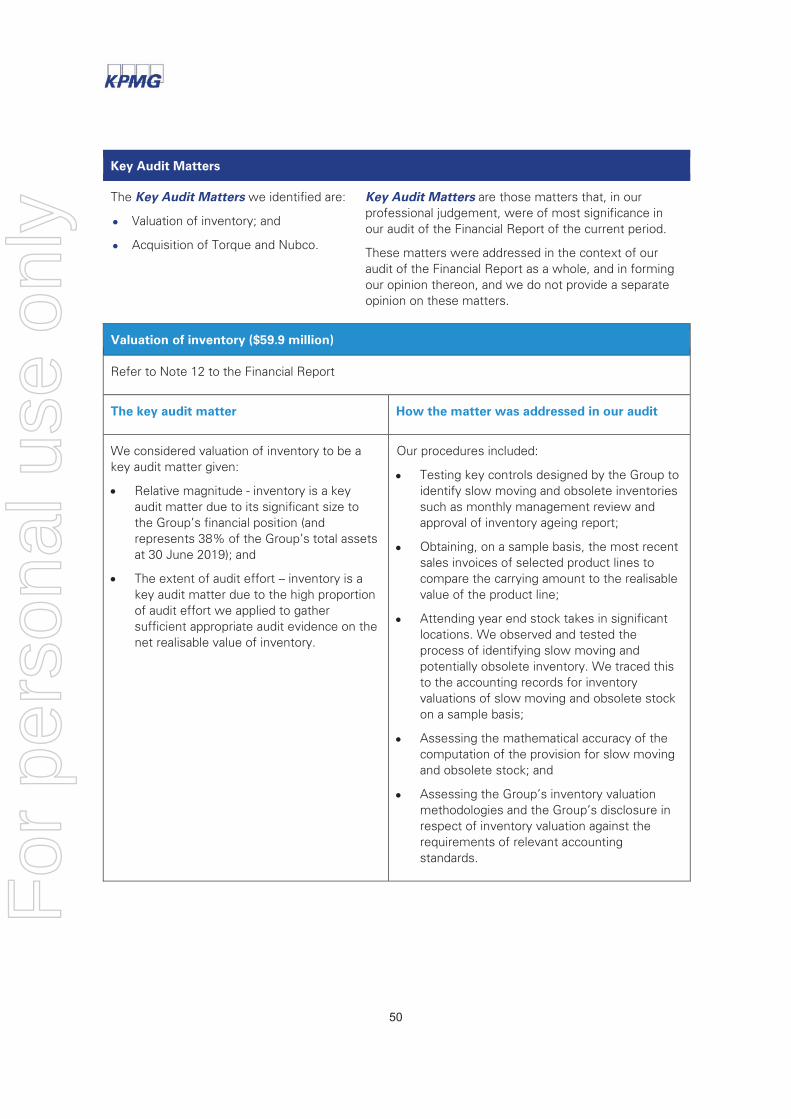
50
Key Audit Matters
The Key Audit Matters we identified are:
Valuation of inventory; and
Acquisition of Torque and Nubco.
Key Audit Matters are those matters that, in our professional judgement, were of most significance in our audit of the Financial Report of the current period.
These matters were addressed in the context of our audit of the Financial Report as a whole, and in forming our opinion thereon, and we do not provide a separate opinion on these matters.
Valuation of inventory ($59.9 million)
Refer to Note 12 to the Financial Report
The key audit matter How the matter was addressed in our audit
We considered valuation of inventory to be a key audit matter given:
Relative magnitude - inventory is a keyaudit matter due to its significant size tothe Group’s financial position (andrepresents 38% of the Group’s total assetsat 30 June 2019); and
The extent of audit effort – inventory is akey audit matter due to the high proportionof audit effort we applied to gathersufficient appropriate audit evidence on thenet realisable value of inventory.
Our procedures included:
Testing key controls designed by the Group toidentify slow moving and obsolete inventoriessuch as monthly management review andapproval of inventory ageing report;
Obtaining, on a sample basis, the most recentsales invoices of selected product lines tocompare the carrying amount to the realisablevalue of the product line;
Attending year end stock takes in significantlocations. We observed and tested theprocess of identifying slow moving andpotentially obsolete inventory. We traced thisto the accounting records for inventoryvaluations of slow moving and obsolete stockon a sample basis;
Assessing the mathematical accuracy of thecomputation of the provision for slow movingand obsolete stock; and
Assessing the Group’s inventory valuationmethodologies and the Group’s disclosure inrespect of inventory valuation against therequirements of relevant accountingstandards.
For
per
sona
l use
onl
y

51
Acquisition of Torque and Nubco
Refer to Note 3 to the Financial Report
The key audit matter How the matter was addressed in our audit
On 31 October 2018, the Group acquired the business and assets of Torque Industries Pty Ltd (Torque) for a consideration of $9.4m.
On 1 March 2019, the Group acquired 100% of the issued share capital of Nubco Proprietary Limited (Nubco) for a consideration of $36.7m.
These acquisitions are a key audit matter due to:
The size of the acquisitions and theirpervasive impact on the financialstatements. The acquisitions resulted in anincrease in non-current assets of $42.0m,including $23.1m of goodwill; and
The Group’s judgement involved inestablishing the fair value of assetsacquired and liabilities assumed, inparticular the identifiable intangible assetssuch as brand name and customerrelationships.
We involved our valuation specialists to supplement our senior team members in assessing this key audit matter.
Our procedures included:
Review of the transaction documents tounderstand the key terms and conditions ofthe acquisitions, assessing the acquisitionsagainst the criteria of a business combinationin the accounting standards, and assessing thedate of acquisition.
Review of consideration transferred andassessing the completeness of the totalpurchase consideration.
Working with our valuation specialists,challenging the assumptions, judgments andmethodologies used by the Group and theirexternal expert in fair value determination ofassets acquired and liabilities assumed by:
- Assessing the scope, competence andobjectivity of the external expert;
- Assessing the valuation and purchaseprice allocation methodology applied forconsistency with observed valuationpractices and criteria set out in theaccounting standards; and
- Comparing relevant inputs used by theexternal expert to external observableinformation.
Assessing the adequacy of the Group’sdisclosures in respect of the acquisitionsbased on accounting standard requirements.
For
per
sona
l use
onl
y

52
Other Information
Other Information is financial and non-financial information in Coventry Group Ltd’s annual reporting which is provided in addition to the Financial Report and the Auditor’s Report. The Directors are responsible for the Other Information.
Our opinion on the Financial Report does not cover the Other Information and, accordingly, we do not express an audit opinion or any form of assurance conclusion thereon, with the exception of the Remuneration Report and our related assurance opinion.
In connection with our audit of the Financial Report, our responsibility is to read the Other Information. In doing so, we consider whether the Other Information is materially inconsistent with the Financial Report or our knowledge obtained in the audit, or otherwise appears to be materially misstated.
We are required to report if we conclude that there is a material misstatement of this Other Information, and based on the work we have performed on the Other Information that we obtained prior to the date of this Auditor’s Report we have nothing to report.
Responsibilities of the Directors for the Financial Report
The Directors are responsible for:
preparing the Financial Report that gives a true and fair view in accordance with AustralianAccounting Standards and the Corporations Act 2001
implementing necessary internal control to enable the preparation of a Financial Report thatgives a true and fair view and is free from material misstatement, whether due to fraud orerror
assessing the Group and Company’s ability to continue as a going concern and whether theuse of the going concern basis of accounting is appropriate. This includes disclosing, asapplicable, matters related to going concern and using the going concern basis of accountingunless they either intend to liquidate the Group and Company or to cease operations, or haveno realistic alternative but to do so.
Auditor’s responsibilities for the audit of the Financial Report
Our objective is:
to obtain reasonable assurance about whether the Financial Report as a whole is free frommaterial misstatement, whether due to fraud or error; and
to issue an Auditor’s Report that includes our opinion.
Reasonable assurance is a high level of assurance, but is not a guarantee that an audit conducted in accordance with Australian Auditing Standards will always detect a material misstatement when it exists.
Misstatements can arise from fraud or error. They are considered material if, individually or in the aggregate, they could reasonably be expected to influence the economic decisions of users taken on the basis of the Financial Report.
A further description of our responsibilities for the audit of the Financial Report is located at the Auditing and Assurance Standards Board website at: http://www.auasb.gov.au/auditors_responsibilities/ar1.pdf This description forms part of our Auditor’s Report.
For
per
sona
l use
onl
y
53
Report on the Remuneration Report
Opinion
In our opinion, the Remuneration Report of Coventry Group Ltd for the year ended 30 June 2019, complies with Section 300A of the Corporations Act 2001.
Directors’ responsibilities
The Directors of the Company are responsible for the preparation and presentation of the Remuneration Report in accordance with Section 300A of the Corporations Act 2001.
Our responsibilities
We have audited the Remuneration Report included in the Directors’ report for the year ended 30 June 2019.
Our responsibility is to express an opinion on the Remuneration Report, based on our audit conducted in accordance with Australian Auditing Standards.
KPMG J Carey
Partner
Melbourne
23 August 2019
For
per
sona
l use
onl
y
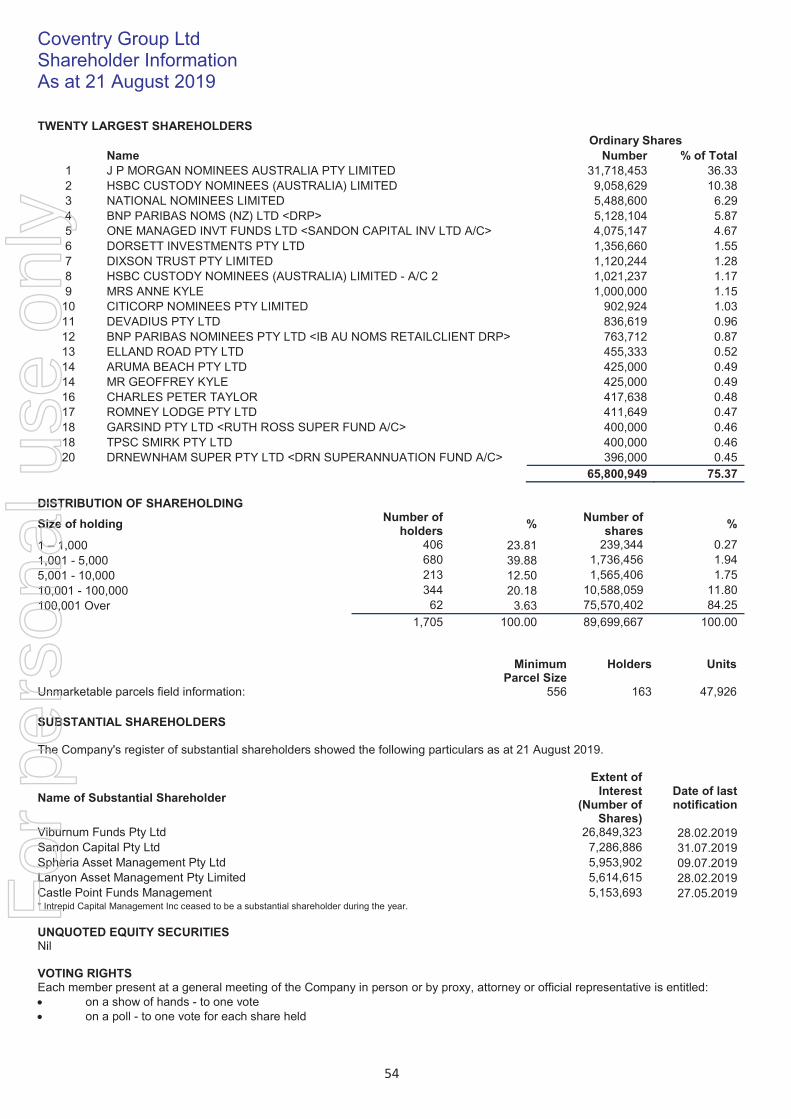
Coventry Group LtdShareholder InformationAs at 21 August 2019
54
TWENTY LARGEST SHAREHOLDERSOrdinary Shares
Name Number % of Total1 J P MORGAN NOMINEES AUSTRALIA PTY LIMITED 31,718,453 36.332 HSBC CUSTODY NOMINEES (AUSTRALIA) LIMITED 9,058,629 10.383 NATIONAL NOMINEES LIMITED 5,488,600 6.294 BNP PARIBAS NOMS (NZ) LTD <DRP> 5,128,104 5.875 ONE MANAGED INVT FUNDS LTD <SANDON CAPITAL INV LTD A/C> 4,075,147 4.676 DORSETT INVESTMENTS PTY LTD 1,356,660 1.557 DIXSON TRUST PTY LIMITED 1,120,244 1.288 HSBC CUSTODY NOMINEES (AUSTRALIA) LIMITED - A/C 2 1,021,237 1.179 MRS ANNE KYLE 1,000,000 1.15
10 CITICORP NOMINEES PTY LIMITED 902,924 1.0311 DEVADIUS PTY LTD 836,619 0.9612 BNP PARIBAS NOMINEES PTY LTD <IB AU NOMS RETAILCLIENT DRP> 763,712 0.8713 ELLAND ROAD PTY LTD 455,333 0.5214 ARUMA BEACH PTY LTD 425,000 0.4914 MR GEOFFREY KYLE 425,000 0.4916 CHARLES PETER TAYLOR 417,638 0.4817 ROMNEY LODGE PTY LTD 411,649 0.4718 GARSIND PTY LTD <RUTH ROSS SUPER FUND A/C> 400,000 0.4618 TPSC SMIRK PTY LTD 400,000 0.4620 DRNEWNHAM SUPER PTY LTD <DRN SUPERANNUATION FUND A/C> 396,000 0.45
65,800,949 75.37
DISTRIBUTION OF SHAREHOLDING
Size of holdingNumber of
holders%
Number of shares
%
1 – 1,000 406 23.81 239,344 0.271,001 - 5,000 680 39.88 1,736,456 1.945,001 - 10,000 213 12.50 1,565,406 1.7510,001 - 100,000 344 20.18 10,588,059 11.80100,001 Over 62 3.63 75,570,402 84.25
1,705 100.00 89,699,667 100.00
Minimum Parcel Size
Holders Units
Unmarketable parcels field information: 556 163 47,926
SUBSTANTIAL SHAREHOLDERS
The Company's register of substantial shareholders showed the following particulars as at 21 August 2019.
Name of Substantial Shareholder
Extent of Interest
(Number of Shares)
Date of last notification
Viburnum Funds Pty Ltd 26,849,323 28.02.2019Sandon Capital Pty Ltd 7,286,886 31.07.2019Spheria Asset Management Pty Ltd 5,953,902 09.07.2019Lanyon Asset Management Pty Limited 5,614,615 28.02.2019Castle Point Funds Management 5,153,693 27.05.2019* Intrepid Capital Management Inc ceased to be a substantial shareholder during the year.
UNQUOTED EQUITY SECURITIESNil
VOTING RIGHTS Each member present at a general meeting of the Company in person or by proxy, attorney or official representative is entitled:
on a show of hands - to one voteon a poll - to one vote for each share held
For
per
sona
l use
onl
y

Coventry Group Ltd Corporate Directory
55
Coventry Group ABN 37 008 670 102
Registered and Principal Administrative Office235 Settlement Road,Thomastown, Victoria 3074
Postal Address P O Box 526Thomastown, Victoria 3074
Website www.cgl.com.au
SecretaryMark Licciardo
Bankers Australian and New Zealand Banking Group LimitedScottish Pacific Business Finance Pty Ltd
AuditorsKPMG Tower TwoCollins Square 727 Collins Street Melbourne, Victoria 3008
Share Registry Computershare Limited Yarra Falls452 Johnston Street, AbbotsfordMelbourne Victoria 3067
or
GPO Box 2975 Melbourne, Victoria 3000
Telephone from within Australia: 1300 763 414Telephone from outside Australia: (+61) 3 9415 5000Facsimile: +(61) 3 9473 2500Email: [email protected] Website: www.investorcentre.com
Securities Exchange ListingThe Company's shares are listed on the ASX Limited and trade under the code CYG. The home exchange is Melbourne.
Shareholder Enquiries/Change of AddressShareholders wishing to enquire about their shareholdings, dividend payments, or change their address should contact the Company's share registry.
For
per
sona
l use
onl
y