for personal use only - asx2016/09/30 · the 2016 financial year marked a significant inflection...
TRANSCRIPT

ANNUAL REPORT 2016
For
per
sona
l use
onl
y

GROWTH |grəʊθ| The process of increasing in size.
COMMUNITY |kəˈmjuːnɪti| The condition of sharing or having certain attitudes and interests in common.
Credit Corp Group Limited is Australia’s largest provider of sustainable financial services operating in the credit impaired consumer segment.
14 per cent increase in dividends for the year
to 50 cents per share
14%
Strong consumer lending segment
NPAT of $6.1 million
$6.1m
2 CHAIRMAN’S REPORT4 CHIEF EXECUTIVE OFFICER’S REPORT8 REVIEW OF OPERATIONS14 BOARD OF DIRECTORS16 GROWTH WITH COMMUNITY22 FINANCIAL STATEMENTS81 CORPORATE DIRECTORY
20 per cent growth in Net Profit After Tax
(NPAT) to $45.9 million
20%
Cover: Louise Esler, Team Performance Manager – Lending | Right: Monica Craig, Senior Customer Relationship Manager – Debt Purchase
For
per
sona
l use
onl
y

CREDIT CORP ANNUAL REPORT 2016 | HIGHLIGHTS
1
$1 billion of consumer obligations restructured into sustainable long‑term arrangements
$1bn
Consumer loan book reaches $100 million milestone
$100m
Financial inclusion responsibly delivered to 65,000 Australians through market‑leading loan products
65K
CREDIT CORP ANNUAL REPORT 2016 | HIGHLIGHTS
1
Financial inclusion responsibly delivered to 100,000 Australians
through market‑leading loan products
100k
Almost $1.2 billion of consumer obligations
restructured into sustainable long‑term
arrangements
Consumer loan book reaches $135 million
$1.2b
$135m
Cover: Louise Esler, Team Performance Manager – Lending | Right: Monica Craig, Senior Customer Relationship Manager – Debt Purchase
For
per
sona
l use
onl
y

2
CHAIRMAN’S REPORT
2016During 2016 we provided
unique statistical insights to guide reform and have played a leading role in assisting with the development of improved regulation and oversight for the benefit of consumers.
For
per
sona
l use
onl
y

CREDIT CORP ANNUAL REPORT 2016 | CHAIRMAN’S REPORT
3
The 2016 financial year marked a significant inflection point for Credit Corp. The company surpassed expectations by accelerating earnings growth and achieving significant business development milestones. These have produced an outlook for higher levels of growth in the near term. At the same time Credit Corp increased its commitment to sustainability and financial inclusion, which gives the company a unique competitive advantage. This focus on growing long-term shareholder wealth by combining strong business results with sustainable practices and compliance leadership is encapsulated by the theme ‘growth with community’.
The company’s foresight in emphasising corporate responsibility in all of its activities has been borne out by developments in the external environment. Higher standards of social responsibility are being demanded from corporations all around the world. In particular, scrutiny of the financial services industry intensified over the year. While the majority of media and political attention has focused on the business practices of large institutions and their dealings with mainstream consumers and small businesses, much of the substantial change to date has been directed towards the credit impaired consumer segment in which Credit Corp operates.
Regulatory activity has been considerable. In the US, new rules were announced for high cost short-term loans and consultation commenced on draft changes to laws regulating debt collection and debt buying. In Australia, a government review of laws relating to ‘payday loans’ made recommendations which, if enacted, will have implications for the viability of many providers of such products. A new legislative regime commenced in New Zealand. Enforcement activity has also stepped up, with announcements of prosecutions and settlements across many jurisdictions.
Other stakeholders have also been active in supporting these measures. Financiers, service providers and media companies have either withdrawn or restricted services to certain segments of consumer
lending. The targets of such measures have been business models which incorporate predatory or exploitative features to generate high returns.
In Australia, the products that have attracted scrutiny fall within certain legislative definitions, including Small Amount Credit Contracts (SACC), Medium Amount Credit Contracts (MACC) and Consumer Leases (CL). These products are subject to interest rate caps that are much higher than the general limit applicable to all other consumer finance. Credit Corp does not offer any of these products. Our consumer lending is undertaken at interest and fee rates well below the general cap applicable to mainstream finance.
Credit Corp’s approach not only serves to insulate the company from adverse stakeholder measures but also creates opportunities for growth. Restrictions on the activities of competitors should improve Credit Corp’s ability to attract customers to its sustainable, market-leading loan products. The position that the company now occupies is a source of growing competitive advantage.
It is particularly pleasing that these developments will see the company bring inclusion to an increasing number of people. Unlike the predatory alternatives subject to stakeholder action, Credit Corp provides genuine solutions for consumers facing a degree of financial exclusion.
At the end of the 2016 financial year we had a portfolio of almost $1.2 billion of defaulted consumer credit obligations restructured into sustainable ongoing repayment arrangements across 147,000 individual customer accounts. And in our lending business, we had responsibly delivered financial inclusion to 100,000 Australians through our affordable loan products.
While successfully navigating changes in the external environment and delivering on its commitment to financial inclusion, in 2016 Credit Corp produced strong results for shareholders. Net Profit After Tax grew by 20 per cent to $45.9 million. The company maintained its Return on Equity at a level above its required rate of return.
All of Credit Corp’s businesses are on a profit growth trajectory. In 2016 we increased market share in our core debt purchasing business and have a solid pipeline of contracted purchases for the year ahead. A key feature of 2016 was achieving critical mass in the lending business. This will drive another year of robust lending segment earnings. Operational improvement and increased purchasing have put our US business in a better position. Early signs are that these efforts will be supplemented with improved market conditions.
Credit Corp’s strategy and operational execution are driven by core values of discipline, accountability and transparency. We operate with the discipline to follow through with our actions. We take accountability for performance and regularly measure ourselves against objective standards. We are open and transparent in all our dealings.
During 2016 we applied these values to our engagement with consumer groups and government to advocate for better regulation and financial inclusion. We provided unique statistical insights to guide reform and have played a leading role in assisting with the development of improved regulation and oversight for the benefit of consumers.
After a very successful year I thank my fellow directors, our CEO Thomas Beregi and his management team for their leadership. Credit Corp continues to deliver sustainable growth in value for shareholders. The company’s key asset is its increasingly diverse group of more than 1,300 people who invest their personal energy to consistently exceed expectations. On behalf of the Board and shareholders, I thank all our employees for their contribution and commitment to the success of the company.
Donald McLay Chairman
The 2016 financial year marked a significant inflection point for Credit Corp. The company surpassed expectations by accelerating earnings growth and achieving significant business development milestones.
For
per
sona
l use
onl
y

4
In 2016 Credit Corp’s increased commitment to corporate responsibility, sound long-term growth strategies and operational improvements produced impressive financial results.
CHIEF EXECUTIVE OFFICER’S REPORT
CORPORATE RESPONSIBILITY
Credit Corp appreciates that corporations have responsibilities to the broader societies within which they operate. This is important when providing financial services, which are a basic need in the modern market economy. Credit Corp works with a section of consumers who are suffering a degree of financial exclusion. Our objective is to improve their circumstances as a pathway to mainstream financial inclusion.
In our core debt purchasing business we work with consumers who have, for various reasons, found themselves in default of their credit obligations. We ensure that all customer interactions are respectful and understanding. Across all our operations we set standards of behaviour at levels significantly above minimum legal requirements. Our respectful culture is supported by an effective control framework to ensure that we adhere to our high standards. We continually monitor customer interactions with a view to improving the customer experience. We seek feedback from customers, consumer groups and regulators for continuous improvement.
Our achievements confirm our leadership in sustainable practice. At the end of the 2016 financial year we had a portfolio of almost $1.2 billion of defaulted consumer credit obligations restructured into sustainable ongoing repayment arrangements across 147,000 individual customer accounts. Despite being the largest and longest-established debt purchaser in Australia, Credit Corp has never been the subject of a regulatory order or undertaking. Credit Corp has a very low rate of External Dispute Resolution (EDR) complaints with only 1.3 complaints for each one million dollars collected. Half of these complaints are unrelated to our conduct because they contest credit bureau listings placed by the original credit issuer. Credit Corp has never incurred a reportable EDR systemic issue and has never engaged an EDR provider in litigation.
Credit Corp’s lending business is focused on responsibly delivering sustainable financial inclusion to consumers who are excluded from access to credit from mainstream issuers. Many of our customers are affected by an impaired credit record.
Credit Corp has led disruption of this segment of the consumer lending market to the benefit of consumers. We responsibly deliver an affordable lending solution to consumers who might otherwise be users of unsustainable loans provided by competitors. Credit Corp does not offer ‘payday’ loans or other predatory products. Nor do we offer loans for terms of less than four months. All of our products have effective interest rates below the legislated cap applicable to mainstream credit.
Credit Corp is committed to delivering the lowest cost financial products to its customers.
We have implemented a purely online and call centre lending model supported by automated technology to maximise efficiency. We leverage our infrastructure to marginally cost overheads to the lending business. All efficiency gains are returned to customers through lower pricing.
We apply responsible lending practices. Financial capacity is examined by verification of income and expenses and comparisons with recognised cost of living benchmarks. Any inconsistencies are resolved by discussion with applicants and further substantiation where appropriate.
Our lending approach puts us in a unique position. Mainstream pricing and responsible practices mean that Credit Corp will not be adversely affected by regulatory reviews or stakeholder scrutiny. We are the only lender in the credit impaired consumer segment acquiring new customers through referrals from prime lenders. We are also the only major operator in the segment able to obtain efficient and conventional bank funding. Already, more than 100,000 consumers have experienced sustainable financial inclusion as a consequence of Credit Corp’s lending activity.
GROWTH STRATEGY
Credit Corp’s strategy is to realise opportunities to leverage the strengths we have developed in our core business of Australian and New Zealand debt purchasing. This business is a clear leader. Annual collections, profits and returns on equity are more than twice those of our nearest competitor. In achieving this position, we have built strengths in data analytics to support disciplined risk management, operational excellence as a source of competitive advantage and compliance to ensure a sustainable business model.
The lending business makes use of each of these strengths. With our sophisticated understanding of the credit impaired consumer, we have built strong models to assess the risk associated with lending to such individuals. Our robust operations minimise costs and credit losses through the application of automation and effective collection activity. Control systems and an overriding commitment to sustainable customer outcomes positively differentiate Credit Corp from its lending competitors.
The opportunity for the lending business is large. Credit Corp’s research suggests that the cash lending component of the credit impaired consumer lending segment alone represents $1.2 billion of loans annually to more than 500,000 Australians. The company is pursuing other sizeable opportunities in the segment, including motor vehicle lending.
We entered the US debt purchasing market with the objective of applying our strengths to the largest debt purchasing market in the world. The US market is more than ten times the size of Australia’s.F
or p
erso
nal u
se o
nly

CREDIT CORP ANNUAL REPORT 2016 | CHIEF EXECUTIVE OFFICER’S REPORT
5
2016The company took its
theme of delivering ‘growth with community’ to a new level, with the prospect of delivering stronger stakeholder
results in the years ahead.
For
per
sona
l use
onl
y

6
In 2016 Credit Corp produced impressive financial results. Net Profit after Tax (NPAT) grew by 20 per cent over the prior year to $45.9 million. There was substantial investment in future growth with a record outlay of $231.9 million for PDLs and record net funding of consumer loan receivables of $55.1 million. We comfortably exceeded our required rate of return. While borrowings necessarily increased to meet the record level of investment, the company’s overall gearing remains among the lowest in the industry and affords substantial financial capacity to seize further growth opportunities as they arise.
The outlook for sustained financial performance is very positive. The core Australian and New Zealand debt purchasing business will benefit from strong purchasing in 2016 and an increased pipeline of contracted purchases for 2017. The consumer lending business produced $6.1 million in NPAT for the 2016 year, including $4.7 million in the second half. The lending earnings growth trajectory is expected to continue into 2017. Improved operations in the US are projected to combine with reduced PDL pricing to reduce annual losses and bring this part of Credit Corp’s business to monthly breakeven during the second half of 2017.
These impressive results and the outlook for sustained performance would not be possible without the dedication and energy of the 1,300 people who work at Credit Corp. The success of our business is defined by the quality of the conversations we have with our customers and clients. Thanks must go to all the dedicated management and staff for bringing our values of discipline, accountability and transparency to their work each day.
The entire Credit Corp team will continue to work hard for all our stakeholders and build leading businesses capable of delivering returns for shareholders and sustainable outcomes for our communities. We will be guided by the desire to improve the situations of our customers by establishing pathways to mainstream financial inclusion that realise our enduring theme of ‘growth with community’.
Thomas BeregiChief Executive Officer
Recent indications are that PDL prices are starting to fall to more rational levels. After several years of industry consolidation, it appears that demand is easing. Major debt buyers have started to report lower prices for charged-off debts and improved returns. At the same time the federal regulator has provided some clarity on the proposed rules for the industry. This should be a catalyst for increased supply as sellers who previously withdrew return to the market. Credit Corp’s US business is well positioned to benefit from improved conditions and is capable of scaling up to take advantage of any attractive purchasing opportunities that arise.
OPERATIONAL IMPROVEMENTS
In our debt buying business our clients are the major banks, finance companies, telecommunications and utility providers. These blue chip organisations are looking to maximise returns from their charged-off receivables and minimise overheads while enhancing their brand reputations.
In 2016 Credit Corp delivered superior outcomes for its clients in this highly competitive market. We have maintained our program of continuous improvements over several years. Despite vigorous competition, Credit Corp was able to leverage these improvements to increase its purchasing by 63 per cent over the prior year.
In the lending business Credit Corp improved the efficiency of its operations. This included further automation, upgraded credit risk models and improved early-stage collection activity. The benefits of these initiatives have been invested in making our products more attractive and sustainable for consumers, with a reduction in the overall effective interest rate applicable to our loan book. These measures contributed to 35 per cent growth in the gross loan book to $135 million over the year.
FINANCIAL RESULTS AND OUTLOOK
Credit Corp aims to consistently grow earnings by investing capital at an acceptable rate of return for a given level of operational and financial risk. We have determined that an acceptable return for a business operating in our sector represents an annual Return on Equity in the range of 16 to 18 per cent at a modest level of gearing.
At the time of entry the returns available from US debt purchasing were very compelling. The company’s initial purchases provided rates of return well in excess of those available in Australia. The market was dominated by financial groups and intermediaries using third party service providers to undertake collection activity. We could see the opportunity for sophisticated internalised operators like Credit Corp to successfully compete with these relatively inefficient business models.
Subsequent to our market entry, however, a combination of cheap and readily available capital for larger public buyers and regulatory uncertainty produced rapid rises in the price of Purchased Debt Ledgers (PDLs). Cheap debt and equity stimulated demand from larger buyers. At the same time a new federal regulator began to target the activities of both debt sellers and buyers, which dramatically reduced PDL supply as three larger sellers and several smaller ones withdrew from debt sale altogether. This pushed the market into disequilibrium, to the point where it has not been possible to make adequate returns over the past three years.
Credit Corp recognised that this period was unsustainable. We have used the past three years to refine our operations in advance of an inevitable pricing correction. In particular, we have worked hard at adapting our collection approach to local market conditions. This has culminated in a 35 per cent improvement in collection efficiency on our 2016 US purchases when compared with purchases in prior years. While our primary focus remains on voluntarily agreed repayment plans, in accordance with market norms we have established a strong legal collection function. Legal collections have now started to track in line with internal targets. These improvements mean that we now expect the US operation to achieve monthly breakeven during the second half of the 2017 financial year.
Credit Corp has also used the period to establish a positive profile with the major US credit issuers. Increased regulatory attention has heightened the importance of compliance and sustainability. Our solid control framework and resulting low complaint rate is valued by these major institutions. We have been admitted to debt buying panels of several sellers and are in a favourable position to take advantage of any improvement in market conditions.
CHIEF EXECUTIVE OFFICER’S REPORT CONTINUEDF
or p
erso
nal u
se o
nly

CREDIT CORP ANNUAL REPORT 2016 | CHIEF EXECUTIVE OFFICER’S REPORT
7
2015
2013
2011
GROWTH PLATFORMAchievement of scale in consumer lending and continued focus on the core business provides
a platform for accelerated revenue growth.
2014
2010PROFITABLE GROWTH
Collection capacity expanded significantly while efficiency was maintained and clients
enjoyed superior pricing outcomes.
2012STRATEGIC EXPANSIONPresence in the core Australian debt purchasing business was applied to
expansion through global debt buying and Australian consumer lending.
LEADERSHIP POSITIONLeading in corporate responsibility for the
benefit of society while recording increased earnings growth and a stronger outlook.
2016
SUSTAINABLE MODELConfirmed as the sustainable promoter of financial inclusion through market-leading financial hardship programs and lending products.
ORGANIC TRANSFORMATIONTransformation from a mono-line Australian debt buyer into a diversified financial services operator with international growth potential.
ANALYTICS AND FLEXIBILITYInnovative in-house systems were combined with an offshore collection capability to transition Credit Corp to a more analytically-driven and flexible operating model.
For
per
sona
l use
onl
y

8
REVIEW OF OPERATIONS
Solid debt purchasing revenue and profit growth as a consequence of increased purchasing. The lending business accounted for the majority of Credit Corp’s earnings growth.
FINANCIAL RESULTS
FY16 FY15 $ Change % Change
Debt buying $173.2m $155.1m +$18.1m
Lending $53.5m $36.0m +$17.5m
Total revenue $226.7m $191.1m +$35.6m +19%
Debt buying $39.8m $37.4m +$2.4m
Lending $6.1m $1.0m +$5.1m
NPAT total $45.9m $38.4m +$7.5m +20%
EPS (basic) 98.4cps 83.0cps +15.4cps +19%
Dividend 50.0cps 44.0cps +6.0cps +14%
+15.4cpsEPS (BASIC)
+$35.6mTOTAL REVENUE
+$7.5mNPAT
2010 2011 2012 2013 2014 2011 2012 2013 2014 2015 20162015 2016 20102010 2011 2012 2013 2014 2015 2016
$m CPS$m 226.7 45.9
30.5
46.9
58.4
69.875.4
83.0
98.4
38.4
34.832.0
26.6
21.0
13.5
191.1174.0
142.6
124.6113.6
93.4For
per
sona
l use
onl
y

CREDIT CORP ANNUAL REPORT 2016 | REVIEW OF OPERATIONS
9
Oliver Priddin, Product Manager – Lending
Net Profit after Tax (NPAT) grew by 20 per cent to
$45.9 million
20%
For
per
sona
l use
onl
y

10
REVIEW OF OPERATIONS CONTINUED
The performance of the core Australian and New Zealand debt purchasing business in 2016 was supported by continued strength in key operational metrics.
Collection effectiveness is achieved when economic collections are maximised on each PDL. While the majority of collections are derived within the first two years subsequent to acquisition of a PDL, effectiveness is maximised when collections are sustained over the entire assumed six year collection life. In 2016 collections from PDLs held for more than two years increased by 21 per cent over the prior year, demonstrating strong collection effectiveness.
Effectiveness is supported by the creation and maintenance of recurring payment arrangements.
CORE BUSINESS PERFORMANCE
Credit Corp works with customers to agree regular repayments of outstanding amounts over time. Once in place these arrangements require ongoing maintenance to minimise delinquency. The likelihood of complete repayment is significantly increased once an arrangement is in place. The face value of accounts under arrangement increased by 12 per cent in 2016 to $1.17 billion.
To derive an appropriate return Credit Corp must also be efficient. Collection efficiency or productivity is measured in dollars collected per direct collection staff member hour. In 2016 collection staff productivity was in line with the prior year at $203 per hour.
Total portfolio FY16 FY15 FY14
Face value $5.3b $4.9b $4.7b
Number of accounts 673,000 703,000 744,000
Payment arrangements
Face value $1,171m $1,044m $909m
Number of accounts 147,000 133,000 120,000
% of PDL collections 78% 75% 73%
PAYMENT ARRANGEMENTS
21%Collections from PDLs held for more than two
years increased by 21 per cent over the prior year
12%The face value of accounts under
arrangement increased by 12 per cent in 2016
to $1.17 billion
For
per
sona
l use
onl
y

11
CREDIT CORP ANNUAL REPORT 2016 | REVIEW OF OPERATIONS
$0m
$30m
$60m
$90m
> 3 years 2-3 years 1-2 years < 1 year
48%
16%
13%
23%
Q1Sep 13
47%
17%
12%
24%
Q2Dec 13
44%
19%
12%
25%
Q3Mar 14
43%
20%
11%
26%
Q4Jun 14
38%
22%
12%
28%
Q1Sep 14
33%
25%
13%
29%
Q2Dec 14
32%
23%
14%
31%
Q3Mar 15
31%
22%
15%
32%
Q4Jun 15
34%
19%
17%
30%
Q1Sep 15
36%
15%
17%
32%
Q2Dec 15
38%
15%
15%
32%
Q3Mar 16
38%
16%
15%
31%
Q4Jun 16
Jul 15 Aug 15 Sep 15 Oct 15 Nov 15 Dec 15 Jan 16 Feb 16 Mar 16 Apr 16 May 16 Jun 16
$100
$150
$200
$250
$300
$350
FY15FY16
PDL collections per staff member hour
PDL COLLECTIONS BY DATE OF PURCHASE
DEBT PURCHASE PRODUCTIVITY (DIRECT COLLECTION STAFF ONLY)
12%Collections increased to
a record $322 million
For
per
sona
l use
onl
y

12
$ million FY16 FY15
Operating cash flow 229.0 189.1
PDL acquisitions (236.4) (139.4)
Net lending (55.1) (51.1)
Capex (2.0) (0.9)
Net operating (free) cash flow (64.5) (2.3)
PDL carrying value 253.3 164.9
Consumer loan net carrying value 110.4 79.3
Net borrowings 139.6 58.5
Net borrowings / carrying value (%) 38.4% 24.0%
In 2016 Credit Corp invested heavily with record levels of Purchased Debt Ledger (PDL) acquisitions and consumer loan originations. The company increased its net bank debt to $139.6 million over the year. This level remains a modest 38.4 per cent of the carrying value of its PDL and consumer loan assets.
CAPITAL AND CASHFLOW
Credit Corp maintains a banking facility of $180 million, which provides flexibility to realise purchasing and lending opportunities as they arise. In 2016 the company produced a Return on Equity (ROE) of over 20 per cent, exceeding its required rate of return. This return was achieved with modest levels of gearing, representing a low level of financial risk for shareholders.
Strong purchasing secured a record PDL acquisition outlay of $231.9 million. This represents a 63 per cent increase in purchasing over the prior year.
DISCIPLINED PURCHASING
On average, purchases made in 2016 are meeting ingoing projections and are on track to achieve the company’s required rate of return.
$0.0b
$0.5b
$1.0b
$1.5b
$2.0b
Jun 08 Jun 09 Jun 10 Jun 11 Jun 12 Jun 13 Jun 14 Jun 15 Jun 16
Cumulativecollections
Actual cash collections
Initial projections
REVIEW OF OPERATIONS CONTINUED
All forward flow contracts were renewed during the year and some new volume was secured.
A solid pipeline of purchases has already been secured for 2017.
For
per
sona
l use
onl
y

CREDIT CORP ANNUAL REPORT 2016 | REVIEW OF OPERATIONS
13
The consumer lending business grew strongly and profit growth has accelerated. The gross loan book reached $135 million. Credit Corp’s brands are well established, having been advertised consistently and have served more than 100,000 individual consumers.
AUSTRALIAN CONSUMER LENDING
Credit Corp’s offerings are uniquely sustainable for consumers with among the lowest effective interest rates in the credit impaired consumer lending segment. Credit Corp’s compliance regime is strong and, unlike many other operators in the segment, has not been the subject of any regulatory investigations or undertakings.
The loan book has now reached critical mass, which means that Credit Corp can look forward to very strong profits and returns from the lending business. The lending business produced $6.1 million in NPAT for the year, including $4.7 million in the second half. Lending segment returns are expected to continue to improve in 2017.
Strong progress has been made in the US. An upgraded operating approach for 2016 purchases produced a 35 per cent improvement in collection efficiency on those purchases. Legal collections have begun to track in line with internal targets. The improvements enabled a significant increase in purchasing and reduced losses by 10 per cent over the prior year. The US operation is now expected to achieve monthly breakeven during the second half of 2017.
US OPERATIONS
There are positive signs in the US market. Major debt buyers have recently reported lower prices for charged-off debts. Recent clarity provided by the federal regulator may stimulate supply, with the prospect that sellers who previously withdrew return to debt sale. Credit Corp is well positioned to benefit from these developments.
Jun 13Dec 12Jun 12 Dec 13 Jun 14 Dec 14 Jun 15 Dec 15 Jun 16
$57m
$6m
$19m$11m
$35m
$63m$72m
$100m
$121m
$135m
Annualised revenueGross loan book (excluding provisions)
35% Improvement in US
collection efficiency on 2016 purchases by 35 per cent
10% Reduced losses by 10 per cent over the
prior year in US business
For
per
sona
l use
onl
y

14
DONALD MCLAY Chairman
Board Committee memberships – Audit & Risk Committee – Remuneration Committee
Date appointed Appointed as a Non-Executive Director in March 2008 and Chairman on 30 June 2008.
Skills and experience Don has more than 35 years’ experience in financial markets, investment banking and broad business services. He has previously held executive roles at a number of local and overseas investment management and investment banking organisations, working in London, Singapore, Auckland and Sydney.
Directorships and other current appointments Currently Don is Chairman of Torres Industries Pty Limited, an unlisted public investment group. Don was appointed Chairman of Clime Investment Management Limited on 1 March 2015.
Qualifications Don holds a Bachelor of Commerce degree, is a Chartered Accountant, a Chartered Secretary and a Senior Fellow of the Financial Services Institute of Australasia.
RICHARD THOMAS Non‑Executive Director
Board Committee memberships – Audit & Risk Committee
Date appointed Appointed as a Non-Executive Director in September 2006.
Skills and experience Richard brings over 40 years management experience in banking, finance and related industry sectors to Credit Corp’s Board.
Richard is a professional Company Director and has previously held senior executive roles including Group Executive, Australian Banking Services with Westpac Banking Corporation, Managing Director of AGC Limited and Executive Vice President of US-based Avco Financial Services.
Directorships and other current appointments Richard was Acting Chairman between 11 February and 30 June 2008.
Qualifications Richard is a Fellow of the Australian Institute of Company Directors.
BOARD OF DIRECTORS
Credit Corp continues to deliver sustainable growth in value for shareholders.
For
per
sona
l use
onl
y

ERIC DODD Non‑Executive Director
Board Committee memberships – Remuneration Committee, Chairman
Date appointed Appointed as a Non-Executive Director in July 2009.
Skills and experience Eric has extensive experience in the insurance, finance and banking sectors. Eric previously held the position of Managing Director and CEO of MBF Australia Limited for a six year period and was appointed as Managing Director of the combined organisation when MBF merged with BUPA Australia in June 2008.
Eric is also a past Managing Director and CEO of NRMA Insurance Limited and held numerous senior positions within the financial services industry.
Directorships and other current appointments Currently Eric is Chairman of First American Title Insurance Company of Australia Pty Limited and Chairman of ICON Cancer Care Australia.
Qualifications Eric holds a Bachelor of Economics degree, is a Fellow of the Institute of Chartered Accountants and is a Fellow of the Australian Institute of Company Directors.
CREDIT CORP ANNUAL REPORT 2016 | BOARD OF DIRECTORS
15
LESLIE MARTIN Non‑Executive Director
Board Committee memberships – Audit & Risk Committee – Remuneration Committee
Date appointed Appointed as a Non-Executive Director in March 2014.
Skills and experience Leslie has 30 years’ experience in commercial banking in a number of countries and is a specialist in payments and corporate cash management.
She has been in the start-up phase of businesses with Chase Manhattan (now JP Morgan Chase) in New York and Hong Kong. She joined Westpac in 1994 as a General Manager to establish its Transaction Banking capability and later led the Working Capital Services business at the Commonwealth Bank.
Directorships and other current appointments Currently Leslie is an independent Director of EFTPOS Payments Australia and a Director of IMA Asia, an independent economics advisory firm. She has held Board positions with subsidiaries of the Commonwealth Bank and a variety of payment industry bodies.
Qualifications Leslie holds a Bachelor of Arts degree, a Master of Business Administration degree and is a Fellow of the Australian Institute of Company Directors.
ROBERT SHAW Non‑Executive Director
Board Committee memberships – Audit & Risk Committee, Chairman
Date appointed Appointed as a Non-Executive Director in March 2008.
Skills and experience Rob has extensive experience in business management in both an executive and non-executive capacity. Rob has specialist skills in financial analysis, audit committees and corporate governance.
Directorships and other current appointments Currently Rob is a Non-Executive Director of Magontec Limited where he chairs the Finance, Audit and Compliance Committee and is a member of the Remuneration and Appointments Committee. Former Board roles include Insearch Limited and The Rugby Club Limited.
Qualifications Rob holds a Bachelor of Industrial Engineering degree, a Master of Business Administration degree, a Master of Professional Accounting degree and is a Fellow of the Australian Institute of Company Directors as well as a Justice of the Peace.
For
per
sona
l use
onl
y

16
Debt buyingOur core business is debt buying. Banks, finance companies, telecommunications and utility providers all have customers who have failed to meet their credit obligations. Once these debts reach an advanced stage of delinquency, collections activity can become an expensive and specialised activity. The providers sell such outstandings to a debt buyer to realise an immediate return.
Credit Corp purchases these debts from the original credit provider with the objective of working with customers to agree an affordable repayment solution to resolve financial difficulty and provide a pathway to financial inclusion.
Consumer lendingCredit Corp began offering consumer loans in 2012. Credit Corp has disrupted this segment of the consumer lending market to the benefit of consumers. The consumer lending business has a range of loan products at market-leading fee and interest rates, which are often significantly lower than any legislated caps that apply.
Credit Corp provides loans to consumers who are suffering financial exclusion and are unable to obtain credit from mainstream lenders. These consumers may have defaulted on their credit obligations in the past and the alternatives available are often unaffordable and unsustainable. Credit Corp provides these consumers with a highly differentiated and affordable solution.
GROWTH WITH COMMUNITY
GROWTH WITH COMMUNITY Credit Corp is the largest provider of financial services to the credit impaired consumer segment. We focus on delivering pathways to mainstream financial inclusion for consumers.
DELIVERING FINANCIAL INCLUSION INDUSTRY LEADERSHIP
Credit Corp maintains a strong compliance regime and impeccable record in the heavily-regulated consumer finance industry. We utilise some of the best available technology in call recording and contact logging to monitor adherence to all applicable laws and standards. Even though we are the largest and longest-established debt buyer in Australia, we have never been subject to a regulatory order or undertaking.
Credit Corp is open and transparent in its interactions with regulators and consumer stakeholders and works productively with those groups for the benefit of society as a whole. The principal regulator, the Australian Securities and Investments Commission (ASIC), meets regularly with us to discuss our compliance regime, complaint statistics, lending products and any emerging trends.
Credit Corp also advocates for the rights of consumers and assists consumer groups and government to improve regulation and oversight of the industry.
Chris Chen, Senior Analyst – Debt Purchase Analytics
For
per
sona
l use
onl
y

CREDIT CORP ANNUAL REPORT 2016 | GROWTH WITH COMMUNITY
17
UNABLE TO REPAY DEBT— DEFAULT
WE BUY DEBT AT SUPERIOR PRICES
REPAYING DEBTS WE OFFER FLEXIBLE ARRANGEMENTS TO REPAY ACCOUNTS
ABILITY TO BORROW WE OFFER MARKET‑LEADING CASH AND CAR LOANS
FINANCIAL DIFFICULTY
DELIVERING PATHWAYS TO MAINSTREAM FINANCIAL
INCLUSION
FINANCIAL INCLUSION
CR
ED
IT C
OR
P
CU
ST
OM
ER
INDUSTRY LEADERSHIP
Chris Chen, Senior Analyst – Debt Purchase Analytics
For
per
sona
l use
onl
y

18
MATTHEW STOKES Head of Collections
CHRIS MIDLAM Head of Business Services
MATTHEW ANGELL Chief Operating Officer
GROWTH WITH COMMUNITY CONTINUED
Credit Corp’s leadership team is essential to our success. Our leaders demonstrate their motivation, enthusiasm and commitment to maintaining our positive culture.
EXECUTIVE LEADERSHIP TEAM
For
per
sona
l use
onl
y

CREDIT CORP ANNUAL REPORT 2016 | GROWTH WITH COMMUNITY
19
MICHAEL MIFSUD Head of Analytics
TEGAN PEARSON Head of Human Resources
TIM CULLEN Chief Information Officer
Our approach is to provide our people with appropriate training, technology and support while recognising personal engagement as the key element which will ensure consistent, high quality conversations.
MICHAEL EADIE Chief Financial Officer
For
per
sona
l use
onl
y

20
Credit Corp works constructively with hundreds of thousands of Australians experiencing financial hardship.
GROWTH WITH COMMUNITY CONTINUED
78%78% of total collections
received pursuant to an ongoing payment
arrangement
COMMITMENT TO OUR CUSTOMERS
Credit Corp’s debt buying operation enables us to work constructively with hundreds of thousands of Australians experiencing financial hardship. Our aim is to structure repayment plans which allow our customers to remain active in the community, while continuing to recognise their credit obligations. Once we establish contact with a new customer, we commit ourselves to working with them to understand their financial situation.
In our experience, people suffering financial hardship are assisted most effectively through open dialogue. Customers are shown respect and treated with dignity by our collections staff, who liaise with each customer to develop a repayment plan that does not compromise their other financial commitments.
This way of dealing with individuals has proven over many years that customers can overcome financial difficulty and comply with their credit obligations when they work with an understanding and flexible creditor. It is our view that this constructive approach supports customers in resolving their financial difficulty and provides a pathway to improved financial inclusion. At the end of the 2016 financial year, over 147,000 customers were repaying their accounts over a longer-term, flexible repayment arrangement.
We apply our unique knowledge of working with credit impaired consumers in our lending business by responsibly delivering sustainable financial inclusion. Consumers have responded positively to our approach and have successfully avoided higher-cost and less sustainable products offered by competitors.
Over 100,000 customers have benefited from our market-leading loans with fees and interest rates set well below legislated caps since 2012.
New loan applicants undergo a thorough assessment of their financial capacity including verification and comparison to recognised cost of living benchmarks.
Customer grievances are resolved through our internal dispute resolution function and any customers who remain dissatisfied may escalate their dispute to an external dispute resolution scheme. In the lending business Credit Corp receives a significantly lower number of complaints per 100,000 loans compared to the credit card and personal loan averages reported by the external dispute resolution provider to mainstream credit issuers. And for the 2016 financial year, we received only 1.3 external dispute resolution complaints for each one million dollars collected in our debt buying business. Half of these were unrelated to our conduct as they contested credit bureau listings placed by the original credit issuers.
DRIVING THE ECONOMY
Credit Corp is a limited purpose business with low overheads. By focusing on efficient operational execution we are able to achieve strong collection outcomes at low cost-to-income ratios. We then pass these savings on to lenders in the form of superior prices paid for debts. Lenders receive higher and more timely returns on credit arrears.
Debt buying plays an important role in the economy. Debt sale is an efficient way to deal with credit arrears and serves to reduce the price of credit and promotes its wide availability to the society in which we operate. Lenders are relieved from the time and expense associated with the collection process.
The majority of debt sales are conducted through ‘forward flow’ agreements where the buyer agrees to acquire debts at a specified stage of delinquency at a fixed percentage of the amount outstanding for periods up to 24 months ahead. A forward flow agreement effectively provides a lender with a form of insurance over future credit losses, while providing the buyer with a guaranteed portfolio to collect. This insurance enables the seller to continue to lend with enhanced confidence, even in times of economic uncertainty. Increased lending volume contributes to consumer demand and economic growth.
For
per
sona
l use
onl
y

CREDIT CORP ANNUAL REPORT 2016 | GROWTH WITH COMMUNITY
21
92 employees have graduated from
recognised accredited programs in 2016
92
INVESTMENT IN OUR PEOPLE
We are committed to internal promotion. All of our operational management positions are filled internally. As our business expands we have provided opportunities for our people to work in leadership positions overseas in our US and Philippines operations. Our lending business has given staff the opportunity to increase their exposure to the credit industry.
Credit Corp’s leadership team is essential to our success. Our leaders demonstrate their motivation, enthusiasm and commitment to maintaining our positive culture. Each leader clearly demonstrates our principles in their roles, and through their behaviours they set the standards for their teams to follow.
Credit Corp provides internationally recognised in-house learning programs which not only develop skills that benefit the company but enhance individuals’ long-term career prospects.
50 internal promotions during 2016
50
147,000147,000 customer accounts on mutually
agreed payment arrangements
For
per
sona
l use
onl
y

22
FINANCIAL STATEMENTS
Francesca Giardino, Senior Customer Relationship Manager – Debt Purchase
For
per
sona
l use
onl
y

CREDIT CORP ANNUAL REPORT 2016 | FINANCIAL STATEMENTS
23
CONTENTS
Francesca Giardino, Senior Customer Relationship Manager – Debt Purchase
24 Corporate governance statement30 Directors’ report35 Directors’ report – audited remuneration report45 Auditor’s independence declaration46 Consolidated statement of profit or loss47 Consolidated statement of comprehensive income48 Consolidated statement of financial position49 Consolidated statement of changes in equity50 Consolidated statement of cash flows51 Notes to the consolidated financial statements51 1 Corporate information51 2 Significant accounting policies54 3 Revenue54 4 Income tax expense54 5 Earnings per share55 6 Dividends paid and proposed55 7 Auditor’s remuneration55 8 Cash and cash equivalents56 9 Trade and other receivables56 10 Consumer loans receivables57 11 Purchased debt ledgers57 12 Other assets57 13 Property, plant and equipment58 14 Tax assets and liabilities59 15 Intangible assets
59 16 Trade and other payables59 17 Provisions60 18 Borrowings60 19 Cash flow information61 20 Issued capital61 21 Capital management62 22 Reserves62 23 Subsidiaries63 24 Operating segments64 25 Contingent liabilities64 26 Leasing commitments64 27 Capital commitments64 28 Subsequent events64 29 Key management personnel compensation65 30 Related party transactions65 31 Share-based payments65 32 Financial risk management69 33 Cross guarantee71 34 Parent entity information72 Directors’ declaration73 Independent auditor’s report78 Five-year financial summary79 Shareholder information81 Corporate directory
For
per
sona
l use
onl
y

24
CORPORATE GOVERNANCE STATEMENT
This statement relates to the year under review.
Credit Corp Group Limited (the Group) maintains policies and practices to comply closely with the Corporate Governance Principles and Recommendations (3rd Edition) released by the ASX Corporate Governance Council.
CORPORATE GOVERNANCE OVERVIEWThe Board of Directors of the Group is responsible for the corporate governance of the Consolidated Group. The Board guides and monitors the business and affairs of the Group on behalf of the shareholders by whom they are elected and to whom they are accountable.
The Credit Corp Group Limited Corporate Governance Statement, which has been approved by the Board, is structured with reference to the ASX Corporate Governance Principles and Recommendations with 2014 amendments, and is summarised below.
PRINCIPLE ONE: LAY SOLID FOUNDATIONS FOR MANAGEMENT AND OVERSIGHTBoard responsibilitiesThe Board’s roles and responsibilities are formalised in the Board Charter, which is published on the Group’s website. The Board reserves to itself all functions that are likely to have a material impact on the performance and reputation of the Group.
The following functions are reserved to the Board:
– Providing leadership and setting the strategic objectives of the Group;
– Appointing the Chairperson;
– Appointing and where necessary replacing the Chief Executive Officer (CEO);
– Approving the appointment and when necessary the replacement of other senior executives;
– Monitoring senior management’s performance, implementation of strategy and allocation of resources;
– Overseeing management’s implementation of the Group’s strategic objectives and its performance generally;
– Overseeing the integrity of the Group’s accounting and corporate reporting systems, including external audit;
– Overseeing the Group’s process for making timely and balanced disclosure of all material information concerning the Group that a reasonable person would expect to have a material effect on the price or value of the Group’s securities;
– Ensuring the Group has in place an appropriate risk management framework and setting the risk appetite within which the Board expects management to operate;
– Approving the Group’s remuneration framework;
– Approving and monitoring the corporate governance of the Group; and
– Approving and monitoring operating budgets, major capital expenditure and financial and other reporting.
Management responsibilitiesThe Delegation of Authority Policy detailing functions delegated to management is published on the Group’s website. All matters not specifically reserved to the Board and necessary for the day-to-day operation of the Group are delegated to management.
The following functions are delegated to management:
– Formulating, recommending and implementing the strategic direction of the Group;
– Translating the approved Strategic Plan into operating budgets and performance objectives;
– Managing the Group’s human, physical and financial resources to achieve the Group’s objectives;
– Operating within the delegated authority limits set by the Board;
– Assuming the day-to-day responsibility for the Group’s conformance with relevant laws and regulations and its compliance framework and all other aspects of the day-to-day running of the Group;
– Performing against established Key Performance Indicators (KPIs) to deliver the objectives of the Group;
– Developing, implementing and managing the Group’s risk management and internal compliance and control systems and operating within the risk appetite set by the Board;
– Developing, implementing and updating policies and procedures;
– Advising the Board promptly of any material matters impacting or potentially impacting the Group’s operations;
– Providing the Board with accurate, timely and clear information to enable the Board to perform its responsibilities; and
– Keeping abreast of industry and economic trends in the Group’s operating environment.
Appointment of new directorsThe Board has the responsibility for the selection and nomination to shareholders of new or retiring directors. The Group’s Appointment of Directors Policy is published on its website and sets out the Group’s policy for the selection, appointment and re-election of directors.
Where a candidate is recommended by an independent executive search organisation, the Board will assess that candidate against a range of criteria, including skills, experience, expertise, personal qualities and cultural fit with the Board and the Group. If these criteria are met and the Board appoints the candidate as a director, that director will confirm his or her appointment at the next Annual General Meeting (AGM) and all material information in the Group’s possession that is relevant to a decision on whether or not to elect or re-elect the director is provided to shareholders.
New directors are provided with written agreement in the form of a formal letter of appointment setting out the key terms and conditions of employment, including their duties and responsibilities and requirement to disclose interests affecting independence.
Accountability of Company SecretaryThe Company Secretary is accountable directly to the Board, through the Chairman, on all matters to do with the proper functioning of the Board.
Diversity reportThe Group recognises the important contribution that people of various cultural backgrounds, ethnicity, experience, gender and age make to the Group. Diversity includes all characteristics that make individuals different from each other, including characteristics such as religion, race, ethnicity, language, gender, sexual orientation, disability, age or any other area of potential difference.
For
per
sona
l use
onl
y

25
CREDIT CORP ANNUAL REPORT 2016 | CORPORATE GOVERNANCE STATEMENT
The Group’s diverse workforce is in fact a key to continued growth and improved operating performance. In particular, employees of diverse backgrounds and experience are able to provide exceptional customer service to our equally diverse customer base.
In order to attract and retain a diverse workforce to service our diverse customer base, the Group is committed to providing an environment where employees are treated with fairness and respect, and have equal access to development and promotion opportunities within the Group.
The Group has established a Diversity Policy, which outlines the Board’s measurable objectives to achieve diversity. A summary of the policy is available on the Group’s website.
Measurement of progress against these diversity objectives occurs annually by the Board.
The table below sets out these diversity objectives and the progress made towards achieving them in 2016. The Board will review these objectives in the 2017 year and report on progress being made towards their achievement.
Objectives Progress in achieving objectives
Provide equal opportunities for candidates, regardless of their cultural, gender, or any other differences.
– The primary goal of the Group’s assessment centre is to maximise objectivity in the decision making process for frontline employees.
– The Group continues to assess and recruit all frontline candidates against a set of core competencies.
Retain and encourage a diverse workforce at all levels of the Group.
– The Group continues to reflect significant gender diversity, including within management levels. The percentage of females in the Group is as follows:
– Board 20%
– Executive management 17%
– Senior management 38%
– Frontline management 55%
– The Group’s workforce 52%
– Over the year a number of employees worked under flexible work arrangements to balance family and other commitments with their employment. During the reporting period 4% of the Group’s workforce utilised a flexible work arrangement.
Provide development opportunities for employees, regardless of cultural, gender or any other differences.
– The Group provides nationally recognised accredited training to all eligible employees.
– Leadership training was provided to all employees in management positions during the year.
– Documented career pathways were implemented for frontline supervisors to support their progression into management roles.
Promote an inclusive culture where all employees are treated with respect and fairness.
– Each year the Group reiterates its zero tolerance policy towards any discrimination, bullying or victimisation of employees with clear escalation channels through which any concerns can be raised.
– Annual online training promotes the Group’s expectations and educates employees on their part in creating the inclusive culture.
– The annual employee engagement survey was conducted, which enables the Group to gather data on issues relating specifically to equality, respect and fairness and in turn use this data to set measurable goals.
Ensure internal promotion decisions within the Group are merit-based in relation to each role.
– Recruitment procedures were implemented for selection into frontline supervisory and management development programs to maximise objectivity in the decision making process.
– This includes the introduction of a panel of senior management from HR and Operations to take part in the decision making process.
Board and committees’ performance reviewsThe Board reviews its performance on a regular basis, including Board documentation and process and committee performance, in accordance with the Performance Management Policy, which is available on the Group’s website. The Board uses surveys for the purpose of its internal Board and committee performance reviews. Those reviews are to ensure that individual directors and the Board work effectively in meeting their responsibilities as described in the Board and Committee Charters. The Board conducted an internal review in the 2016 financial year.
Executives’ performance reviewsThe performance of all key executives is reviewed annually against the Group’s performance and individual KPIs.
The performance review of the CEO is undertaken by the Chairman of the Board, reviewed by the Remuneration Committee and approved by the Board. The performance reviews of other executives are undertaken by the CEO and approved by the Remuneration Committee. Performance reviews for each executive were conducted in 2016.
For
per
sona
l use
onl
y

26
CORPORATE GOVERNANCE STATEMENT
The Board regularly reviews the independence of each director and requires directors to promptly advise of any change in circumstances that may affect their independence as a director. Any change in circumstances that materially affects their independence as a director will be disclosed promptly. There are procedures in place, agreed by the Board, to enable directors to seek independent professional advice in the carrying out of their duties, at the Group’s expense.
During the 2016 financial year, a majority of the Board members are considered to be independent and free from any business or other relationship that could materially interfere with, or could reasonably be perceived to materially interfere with, the unfettered exercise of their independent judgement.
Board skillsThe Board considers that the directors bring professional skills, knowledge and experience as well as personal attributes which enable the Board to operate effectively and meet its responsibilities to the Group and stakeholders. The skills and experience of each director are detailed in the Directors’ report and are also summarised in the following skills matrix:
PRINCIPLE TWO: STRUCTURE THE BOARD TO ADD VALUENomination CommitteeThe full Board performs the role of Nomination Committee as, in its opinion, only minimal benefit will accrue to the Group from having a separate committee.
Board compositionThe term held by each director in office at the date of this report is as follows:
Name Term in office Independent
Mr Donald McLay (Chairman) 8.5 years IndependentMr Simon Calleia (until 30 November 2015) 16 years Not independentMr Eric Dodd 7 years IndependentMs Leslie Martin 2.5 years IndependentMr Robert Shaw 8.5 years IndependentMr Richard Thomas 10 years Independent
The Chairman of the Board is Mr Donald McLay, an independent director. The CEO of the Group, Mr Thomas Beregi, is not a director of the Group.
Board skills matrix
Areas of substantial experience
Executive and non-executive experience
Directorship experience 5
Board Chair experience 5
Board Sub-committee Chair experience 5
Senior management experience 5
Offshore senior management experience 3
Industry experience Banking 5
Broader financial services, including insurance and funds management 4
Capital markets 3
Other industry experience 5
Strategy Experience in strategic planning and implementation of strategy 5
Mergers and acquisitions experience 4
Capital raising experience 4
Information technology, strategy and systems implementation 3
Governance Experience in establishing and monitoring / assessing effectiveness of governance structures
4
Professional industry qualifications 5
Risk management Experience in managing areas of major risk to the organisation, i.e. financial, environmental, regulatory, workplace health and safety, social and technology
5
Experience in managing sophisticated risk hedging strategies and products 3
People management and remuneration
Experience in remuneration and the associated legislative / governance framework 5
Experience in managing people 5
Finance and accounting Professional industry qualifications 3
Experience with accounting standards 3
Experience in reviewing and analysing financial statements 4
Experience in analysing financial drivers and business models 5
Induction of new directorsNew directors undergo an induction program which includes meetings with members of management, the Chairman of the Board and the Chairmen of each relevant committee to gain an insight into the Group’s business, values and culture.
For
per
sona
l use
onl
y

27
CREDIT CORP ANNUAL REPORT 2016 | CORPORATE GOVERNANCE STATEMENT
Financial statement approvalPrior to the approval of the Group’s financial statements for each reporting period, the CEO and the Chief Financial Officer (CFO) gave the Board a declaration that, in their opinion:
– The financial records have been properly maintained;
– The financial statements complied with the accounting standards and gave a true and fair view; and
– That opinion has been formed on the basis of a sound system of risk management and internal control which is operating effectively.
The Audit and Risk Committee reviews the Group’s interim and annual financial reports and makes recommendations to the Board on adopting financial statements. The committee provides additional assurance to the Board with regard to the quality and reliability of financial information.
Annual General Meeting (AGM)The AGM gives shareholders the opportunity to hear the CEO and Chairman provide updates on the Group’s performance, ask questions and to express a view and vote on the various matters of the Group business on the agenda.
Live webcasting of the AGM is also conducted to allow shareholders to view and hear the proceedings of the meeting online.
Shareholders also have the opportunity to ask questions of the Group’s external auditors at the meeting. The Group encourages shareholders to attend its AGM.
PRINCIPLE FIVE: MAKE TIMELY AND BALANCED DISCLOSUREContinuous disclosureThe Group’s Continuous Disclosure Policy, which is published on its website, is designed to ensure compliance with disclosure obligations under the ASX Listing Rules and to ensure accountability at senior executive level for that compliance.
This policy also allows the Group to ensure shareholders and the market are fully informed of its strategy, performance and details of any information or events that could have a material impact on the value of the Group’s shares.
The CEO and the Company Secretary, in consultation with the Board, are responsible for the review, authorisation and disclosure of information to the ASX and for overseeing and co-ordinating information disclosure to the ASX, shareholders, brokers, analysts, the media and the public.
PRINCIPLE THREE: ACT ETHICALLY AND RESPONSIBLYCode of ConductThe Code of Conduct adopted by the Group is a key element of the Group’s corporate governance framework and its purpose is to guide directors, executives and employees on the minimum standards of conduct expected of them in the performance of their duties, including their dealings with customers, clients, shareholders, employees and other stakeholders.
Compliance with the Code of Conduct is a condition of appointment as a director of, an employee of, or a contractor to, the Group.
This Code of Conduct is published on the Group’s website.
PRINCIPLE FOUR: SAFEGUARD INTEGRITY IN CORPORATE REPORTINGAudit and Risk CommitteeThe Board has formed an Audit and Risk Committee and has delegated responsibility for establishing and maintaining a framework of internal control and ethical standards to this committee as outlined in the Audit and Risk Committee Charter, which is published on the Group’s website.
The Audit and Risk Committee operates under its charter to ensure that an effective internal control framework exists within the Group. This includes internal controls to deal with both the effectiveness and efficiency of significant business processes, the safeguarding of assets, the mitigation of business risks, the maintenance of proper accounting records and the reliability of financial and operational information.
The Audit and Risk Committee also provides the Board with additional assurance regarding the reliability of financial information included in the financial reports.
All members of the Audit and Risk Committee are non-executive and independent directors and during the year were:
– Mr Robert Shaw (Chairman)
– Mr Richard Thomas
– Ms Leslie Martin (until 28 January 2016)
– Mr Donald McLay
The qualifications of the members and their attendance at meetings of the Audit and Risk Committee are disclosed in the Directors’ report.
For
per
sona
l use
onl
y

28
CORPORATE GOVERNANCE STATEMENT
PRINCIPLE SEVEN: RECOGNISE AND MANAGE RISKRisk managementThe Group has established a risk management policy to identify, assess, monitor and manage material business risks, both financial and non-financial, to minimise their impact on the achievement of organisational goals. Business risks comprise, but are not limited to, economic, technological, operational, legal, political and social risks. These specified risks are managed through the Group’s risk management system and insurance program which are approved by the Board.
As mentioned in Principle four, the Audit and Risk Committee provides oversight on the risk framework and aggregated risk profiles at the Consolidated Group level. Management has been given the responsibility for the establishment, implementation and maintenance of the system of risk management, including measures of its effectiveness. Internal control systems and procedures are monitored and reviewed by the Group’s compliance manager who reports his findings to the Audit and Risk Committee. The composition of the Audit and Risk Committee is detailed in Principle four and the attendance of members at the meetings of the committee is disclosed in the Directors’ report.
The Group’s Risk Management Policy is published on its website. The Audit and Risk Committee reviews the risk management framework annually to satisfy itself that it continues to be sound and reports to the Board on the result of the review. Such a review was conducted in the 2016 financial year and a report was provided to the Board.
The Group has an internal audit process within the Compliance function. This process tests compliance to the various standards for which the Group is accredited or is required to comply with as well as internal controls associated with the Group’s risk management framework.
The Group considers that, due to the nature of its activities, it has no material exposure to economic, environmental or social sustainability risks.
PRINCIPLE SIX: RESPECT THE RIGHTS OF SHAREHOLDERSCommunication with shareholdersThe Group recognises the rights of its shareholders and other interested stakeholders to have access to balanced, understandable and timely information concerning the operations of the Group. The CEO and the Company Secretary are primarily responsible for ensuring communications with shareholders are delivered in accordance with the rights of shareholders and the Group’s policy of continuous disclosure.
The Security Holders’ Rights and Communication Strategy Policy, available on the Group’s website, sets out the communication strategy of the Group and includes:
– Electronic facilities
The Group maintains a website that provides information on its services and its business in general, as well as an investor relations section that contains information for shareholders of the Group. The Group’s announcements are made on this website as well as the ASX website and there is a facility to lodge questions through the Group’s website.
– Formal reporting to shareholders
Formal reporting to shareholders is conducted through the interim report for the six months ended 31 December and the annual report for the financial year ended 30 June. The Group also releases market updates summarising the Group’s performance during each quarter of the financial year.
– AGMs
The Group invites and encourages shareholders to attend and participate in these meetings and also provides live webcasting of its AGM to allow security holders to view and hear the proceedings of the meeting.
In addition, shareholders may communicate with the share registry, Boardroom Pty Limited (Boardroom), electronically. The relevant contact details are disclosed in the Shareholder Information section of the annual report.
A direct voting facility is provided through the Boardroom website to allow security holders to vote ahead of the meeting. Details of this facility are included in the Notice of AGM.
Shareholders who do not currently receive electronic communications from Boardroom may update their communication options via a secure, online service offered by Boardroom at www.investorserve.com.au.
For
per
sona
l use
onl
y

CREDIT CORP ANNUAL REPORT 2016 | DIRECTORS’ REPORT
29
At any time outside the Blackout or Closed Periods, directors or employees may trade in Credit Corp shares where:
– Directors, excluding the Chairman, and KMP obtain the prior written clearance of the Chairman;
– The Chairman obtains prior written clearance from the Chairman of the Audit and Risk Committee and, in the event that person is not available, the Chairman of the Remuneration Committee; and
– Other employees obtain prior written clearance from the Compliance Manager.
The Group’s employees are only permitted to enter into margin loans secured against Credit Corp shares with the prior written approval of the Chairman. The Share Trading Policy is published on the Group’s website.
NON‑CONFORMANCEAll the best practice recommendations of the ASX Corporate Governance Council have been applied for the entire financial year ended 30 June 2016, except for the following:
1. Recommendation 2.1
The Board assumes the role of a Nomination Committee as it believes minimal benefit will accrue to the Group through having a separate committee.
2. Recommendation 8.1
Recommendation 8.1 states that the Remuneration Committee should be chaired by an independent director. The Group’s Remuneration Committee was formerly chaired by Mr Simon Calleia until his resignation as a director on 30 November 2015. Mr Simon Calleia’s independence was affected by his role as a former executive of the Group. However it was not considered that his ability to perform the role of Remuneration Committee Chairman was adversely affected by these circumstances because Mr Simon Calleia ceased to hold an executive position in April 2005, and the executives in place at that time are no longer employed by the Group.
WEBSITE DISCLOSUREFurther information relating to the Group’s corporate governance practices and policies has been made publicly available on the Group’s website at www.creditcorp.com.au/corporate/investors/corporate-governance.
PRINCIPLE EIGHT: REMUNERATE FAIRLY AND RESPONSIBLYRemuneration CommitteeThe Board has formed a Remuneration Committee to assist the Board in the design, implementation and monitoring of remuneration policies that meet the needs of the Group and enhance corporate and individual performance.
Its objective is to provide maximum stakeholder benefit from the retention of a high quality Board and executive team by remunerating the directors and key executives fairly and appropriately with reference to relevant employment market conditions. To assist in achieving this objective, the Remuneration Committee links the nature and amount of directors’ and key executives’ emoluments to the Group’s financial and operational performance. The expected outcomes of the remuneration structure are:
– Retention and motivation of key executives;
– Attraction of high quality personnel to the Group; and
– Performance incentives that allow executives to share in the success of the Group.
The Remuneration Committee Charter, which sets out its role and responsibilities, and the Remuneration Policy are published on the Group’s website.
The members of the Remuneration Committee during the year were:
– Mr Simon Calleia (Chairman until 30 November 2015)
– Mr Eric Dodd (Chairman from 28 January 2016)
– Mr Donald McLay
– Ms Leslie Martin (appointed to committee on 28 January 2016)
The amount of remuneration for all Key Management Personnel (KMP), qualifications of the members and their attendance at meetings of the Remuneration Committee, are disclosed in the remuneration section of the Directors’ report.
Share Trading PolicyThe Group’s Share Trading Policy governs when its directors and employees may deal in Credit Corp shares and the process which must be followed in respect of such dealings.
The Group’s directors and employees are not permitted to deal in Credit Corp shares during any Blackout or Closed Periods:
– Two months immediately preceding the preliminary announcement of the Group’s annual results until the commencement of the next trading day after the release of the annual results;
– Two months immediately preceding the announcement of the Group’s interim results until the commencement of the next trading day after the release of the interim results; and
– Any other periods that the Board determines, in its absolute discretion, to be a Blackout or Closed Period, including due to there being undisclosed price sensitive information.F
or p
erso
nal u
se o
nly

DIRECTORS’ REPORT
30
The directors present their report together with the financial report of the Group and its subsidiaries for the financial year ended 30 June 2016.
DIRECTORSThe directors of the Group at any time during the whole of the financial year and up to the date of this report are:
Mr Donald McLay Chairman, Director (Non‑Executive) Age 66
Qualifications Bachelor of Commerce, Chartered Accountant, Chartered Secretary and Fellow of the Financial Services Institute of Australasia.
Experience and expertise Appointed as a Non-Executive Director on 31 March 2008 and has been Chairman since 30 June 2008.
Mr McLay has more than 35 years’ experience in financial markets, investment banking and broad business services.
Directorship of listed entity Clime Investment Management Limited from 1 March 2015.
Special responsibilities Mr McLay is Chairman of the Board and is a member of the Remuneration and Audit and Risk Committees.
Interest in shares 1,663,884 ordinary shares of Credit Corp Group Limited.
Mr Simon Calleia Director (Non‑Executive) Age 48
Qualifications Bachelor of Commerce, Postgraduate Diploma in Applied Finance and Investment, Associate of Financial Services Institute of Australasia, member of the Australian Institute of Banking and Finance and Australian Institute of Company Directors.
Experience and expertise Appointed as Managing Director in March 2000 and became a Non-Executive Director after he stepped down from his executive role in April 2005.
Mr Calleia has extensive knowledge of the credit management industry. He has also held various roles in the banking, finance and insurance sectors.
Special responsibilities Mr Calleia was Chairman of the Remuneration Committee up until his date of resignation on 30 November 2015.
Interest in shares 613,119 ordinary shares of Credit Corp Group Limited at the time of resignation.
Mr Eric Dodd Director (Non‑Executive) Age 64
Qualifications Bachelor of Economics, Fellow of the Institute of Chartered Accountants Australia and New Zealand and Australian Institute of Company Directors.
Experience and expertise Appointed as a Non-Executive Director on 1 July 2009.
Mr Dodd has extensive experience in insurance, finance and banking.
Directorships of listed entities Ambition Group Limited from 18 March 2013 to 20 January 2014, SFG Australia Limited (previously named Snowball Group Limited) from 2 July 2010 to 21 August 2014 and Echoice Limited (previously named Firstfolio Limited) from 2 April 2012 to 27 March 2015.
Special responsibilities Mr Dodd was appointed as Chairman of the Remuneration Committee on 28 January 2016.
Interest in shares 5,000 ordinary shares of Credit Corp Group Limited.
Ms Leslie Martin Director (Non‑Executive) Age 61
Qualifications Bachelor of Arts, Master of Business Administration and Fellow of the Australian Institute of Company Directors.
Experience and expertise Appointed as a Non-Executive Director on 20 March 2014.
Ms Martin has 30 years’ experience in commercial banking in a number of countries and is a specialist in payments and corporate cash management.
Special responsibilities Ms Martin is a member of the Remuneration Committee.
Interest in shares 5,123 ordinary shares of Credit Corp Group Limited.
For
per
sona
l use
onl
y

31
CREDIT CORP ANNUAL REPORT 2016 | DIRECTORS’ REPORT
Mr Robert Shaw Director (Non‑Executive) Age 74
Qualifications Bachelor of Industrial Engineering, Master of Business Administration, Master of Professional Accounting, Justice of the Peace and Fellow of the Australian Institute of Company Directors.
Experience and expertise Appointed as a Non-Executive Director on 31 March 2008.
Mr Shaw has extensive knowledge in finance, financial analysis, audit committees and corporate governance.
Directorship of listed entity Magontec Limited (previously named Advanced Magnesium Limited) since 4 March 2011.
Special responsibilities Mr Shaw is Chairman of the Audit and Risk Committee.
Interest in shares 5,245 ordinary shares of Credit Corp Group Limited.
Mr Richard Thomas Director (Non‑Executive) Age 71
Qualifications Fellow of the Australian Institute of Company Directors.
Experience and expertise Appointed as a Non-Executive Director on 22 September 2006. He was Acting Chairman between 11 February 2008 and 30 June 2008.
Mr Thomas has more than 40 years’ experience in the banking and finance industry in Australia, New Zealand and the United States.
Special responsibilities Mr Thomas is a member of the Audit and Risk Committee.
Interest in shares 12,584 ordinary shares of Credit Corp Group Limited.
The above named directors held office during the whole financial year and since the end of the financial year, except for Mr Simon Calleia, who resigned on 30 November 2015.
COMPANY SECRETARIES The following persons held the position of Company Secretary during or since the end of the financial year:
Mr Thomas Beregi Company Secretary
Qualifications Bachelor of Economics, Bachelor of Laws (Hons) and Certified Practising Accountant.
Experience and expertise Mr Beregi joined the Group on 3 September 2007 in the role of Chief Financial Officer. He was subsequently appointed to his current position of Chief Executive Officer on 1 October 2008. Prior to joining the Group, he was the Chief Operating Officer of Jones Lang LaSalle Australia.
Mr Beregi was appointed as a Company Secretary on 21 September 2007.
Mr Michael Eadie Company Secretary
Qualifications Bachelor of Accounting, Master of Applied Finance, Certified Practising Accountant and Fellow of the Financial Services Institute of Australasia.
Experience and expertise Mr Eadie joined the Group on 4 May 2009 as Finance Manager and was subsequently appointed Chief Financial Officer on 19 November 2010. He has previously held senior finance roles within major financial services organisations, including Macquarie Bank Limited.
Mr Eadie was appointed as a Company Secretary on 17 March 2011.
Mr Geoffrey Templeton Company Secretary
Qualifications Member of the Australian Institute of Credit Management, Australian Institute of Mercantile Agents, Australian Institute of Human Resources and Governance Institute of Australia.
Experience and expertise Mr Templeton joined the Group in 1987 and has held roles in operations, administration, accounting, payroll and human resources. He is currently the Compliance Manager for the Group.
Mr Templeton was appointed as a Company Secretary on 5 May 2000.
For
per
sona
l use
onl
y

DIRECTORS’ REPORT
32
DIRECTORS’ MEETINGSThe number of directors’ meetings (including meetings of committees of directors) and number of meetings attended by each of the directors of the Group during the financial year were:
Directors’ Audit and Risk Remuneration meetings Committee Committee
Number Number Number eligible Number eligible Number eligible to Number to attend attended to attend attended attend attended
Mr Donald McLay 12 12 3 3 2 2Mr Simon Calleia 6 4 – – 1 1 Mr Eric Dodd 12 12 – – 2 2 Ms Leslie Martin 12 10 2 2 1 1 Mr Robert Shaw 12 11 3 3 – – Mr Richard Thomas 12 12 3 3 – –
PRINCIPAL ACTIVITIESThe principal activities of the Group during the course of the financial year were debt purchase and collection as well as consumer lending.
There were no significant changes in the nature of the Group’s activities during the financial year.
REVIEW OF THE OPERATIONSOverview The directors of the Group are pleased to report a strong performance for the year to 30 June 2016. Key highlights are as follows:
– 20 per cent growth in Net Profit After Tax (NPAT) to $45.9 million;
– Strong consumer lending segment NPAT of $6.1 million;
– Record investment of $287 million to sustain growth; and
– A positive outlook across all businesses with financial year 2017 NPAT growth guidance of 13 to 18 per cent.
A strong increase in Purchased Debt Ledger (PDL) collections combined with significant growth in the loan book produced a 19 per cent increase in revenue. Growth from core domestic debt buying and significantly higher earnings from the consumer lending business delivered a 20 per cent increase in NPAT.
The debt buying business has benefited from ongoing operational improvement and increased purchasing. Collections increased by 12 per cent to a record $322 million. Collection efficiency was maintained despite a 9 per cent increase in the productive workforce over the year. Collection effectiveness improved, with a 21 per cent increase over the prior year in the amount collected on PDLs purchased more than two years ago. Ongoing effectiveness will be underpinned by the recurring payment arrangement book, which grew by 12 per cent over the year to a face value of almost $1.2 billion.
The consumer lending business demonstrated its earnings potential, with segment NPAT increasing to $6.1 million from $1 million in the prior year.
Purchasing Operational improvement and the Group’s exemplary compliance record, combined with a moderation in price growth, facilitated increased market share. All forward flow contracts were renewed during the year and some new volume was secured, with the result that PDL acquisitions were 63 per cent higher than the prior year.
Consumer lending The consumer loan book grew by 35 per cent over the year to $135 million. The Group’s brands are well established, having been advertised consistently and served more than 100,000 individual consumers. As a consequence, new customer originations remain strong, while the enlarged customer base delivers increased lending to returning customers. Referral channels have also been established with prime lenders, providing another means of efficient customer acquisition.
The Group’s offerings are uniquely sustainable with the lowest effective interest rates in the credit-impaired consumer segment. The Group does not offer any contentious products such as Small Amount Credit Contracts (SACCs) or ‘payday loans’. The Group’s compliance regime is strong and, unlike many other operators in the segment, the Group has not been the subject of any regulatory investigations or undertakings. The Group’s products are unaffected by any current regulatory reviews or the impact of increased stakeholder scrutiny.
The loan book has now reached critical mass, which means that the Group can look forward to very strong profits and returns from the lending business. The lending business produced $6.1 million in NPAT for the year, including $4.7 million in the second half of the year. Lending segment return on assets (ROA) increased from 3 per cent in the first half to 9 per cent in the second half. Returns are expected to continue to improve in the 2017 financial year.
For
per
sona
l use
onl
y

CREDIT CORP ANNUAL REPORT 2016 | DIRECTORS’ REPORT
33
US operations Strong progress has been made in the United States. An upgraded operating approach for the 2016 financial year purchases produced a 35 per cent improvement in collection efficiency on those purchases. Legal collections have started to track in line with internal targets. These improvements enabled a significant increase in purchasing and reduced losses by 10 per cent over the prior year. The US operations are now expected to achieve monthly breakeven during the second half of the 2017 financial year.
While market conditions remain unchanged, with little indication that major issuers who withdrew from sale will return over the next six months, there are some positive signs for the Group. The market is increasingly compliance-focussed, resulting in further industry consolidation and the rationalisation of debt buying panels of credit issuers. In addition, major debt buyers have recently reported lower prices for charged off debts and improved returns. The Group is well-positioned to benefit from these developments.
2017 outlook A positive outlook across all businesses means that NPAT growth in the range of 13 to 18 per cent is expected for the 2017 financial year. Elevated purchasing in 2016 and a strong purchasing pipeline for financial year 2017 will drive increased collections and earnings from the debt buying business. In accordance with commentary provided above, NPAT from the lending segment is expected to grow significantly.
CHANGES IN STATE OF AFFAIRSDuring the financial year there were no significant changes in the state of affairs of the Group other than those referred to in the financial statements or notes thereto.
DIVIDENDS PAID OR RECOMMENDEDDividends paid or declared to shareholders since the end of the previous financial year were:
Cents Total Date of Declared and paid during the year 2016 per share $’000 payment
Interim 2016 ordinary 23.00 10,752 24 Mar 16Final 2015 ordinary 22.00 10,233 30 Oct 15
Total 20,985
After the balance date the following dividend was proposed by the directors:
Declared after end of year
Final 2016 ordinary 27.00 12,687 28 Oct 16
The financial effect of this dividend has not been brought to account in the consolidated financial statements for the year ended 30 June 2016 and will be recognised in the 2017 financial report.
EVENTS SUBSEQUENT TO REPORTING DATEIn the interval between the end of the financial year and the date of this report there has not been any item, transaction or event of a material and unusual nature that is likely, in the opinion of the directors of the Group, to significantly affect the operations of the Group, the results of those operations or the state of affairs of the Group in future financial years.
ENVIRONMENTAL REGULATIONSThe Group’s operations are minimally affected by environmental regulations.
INDEMNIFYING OFFICERS OR AUDITORThe Group has provided indemnities to the current directors (as named above), the company secretaries (Mr Thomas Beregi, Mr Michael Eadie and Mr Geoffrey Templeton) and all executives of the Group against liabilities incurred as a director, secretary or executive officer to the extent permitted by the Corporations Act 2001. The Group will meet the full amount of any such liabilities, including costs and expenses.
The Group has not otherwise, during or since the end of the financial year, except to the extent permitted by law, indemnified or agreed to indemnify an officer or auditor of the Group against a liability incurred by an officer or auditor.
These indemnities were in place both during and after the end of the financial year.
These potential liabilities are insured with the premiums paid by the Group. The insurance contract prohibits disclosure of any details of the policy and the premium paid.
For
per
sona
l use
onl
y

DIRECTORS’ REPORT
34
NON‑AUDIT SERVICESThe following non-audit services were provided by the Group’s auditor, Hall Chadwick. The directors are satisfied that the provision of non-audit services is compatible with the general standard of independence for auditors imposed by the Corporations Act 2001. The nature and scope of each type of non-audit service provided means that auditor independence was not compromised. All non-audit services are reviewed and approved by the Audit and Risk Committee prior to commencement of the audit to ensure they do not impact the impartiality and objectivity of the auditor.
Details of the amounts paid to Hall Chadwick for non-audit services provided during the year are set out below:
$
Services other than statutory audit:Other services:
– Taxation compliance services 11,000
– Other services 14,400
Total 25,400
PROCEEDINGS ON BEHALF OF THE GROUPNo person has applied for leave of the Court to bring proceedings on behalf of the Group or intervene in any proceedings to which the Group is a party for the purpose of taking responsibility on behalf of the Group for all or any part of those proceedings.
AUDITOR’S INDEPENDENCE DECLARATIONThe auditor’s independence declaration for the year ended 30 June 2016 has been received and can be found on page 27 of the financial statements.
ROUNDING OFFThe Group is an entity to which ASIC Class Order 98/100 applies and, accordingly, amounts in the financial statements and Directors’ report have been rounded to the nearest thousand dollars.
For
per
sona
l use
onl
y

35
This remuneration report sets out remuneration information for key management personnel (KMP), which includes directors and senior executives, for the year ended 30 June 2016 and is prepared and audited in accordance with section 300A of the Corporations Act 2001.
A. THE BOARD’S AND THE REMUNERATION COMMITTEE’S ROLES IN REMUNERATIONThe Board is responsible for the structure of directors’ and senior executives’ remuneration and maximising the effectiveness of remuneration in the creation of long-term shareholder value.
The Remuneration Committee is responsible for reviewing and developing remuneration policies and practices on behalf of the Board. Executive remuneration levels are reviewed annually by the Remuneration Committee in line with the Remuneration Policy and with reference to market movements.
The Remuneration Committee makes recommendations to the Board in respect of:
– Recruitment, retention and termination policies and procedures for senior executives;
– Senior executive remuneration packages, including annual incentive and long-term incentive plans; and
– Director remuneration levels and framework.
The performance review of the Chief Executive Officer (CEO) is undertaken by the Chairman of the Board, reviewed by the Remuneration Committee and approved by the Board. The performance reviews of other executives are undertaken by the CEO and approved by the Remuneration Committee.
B. KMPThe remuneration report sets out the remuneration details for the Group’s KMP. The table below outlines the KMP and their movements during the 2016 financial year:
Name Position Term as KMP
Non‑executive directorsMr Donald McLay Chairman Full financial yearMr Simon Calleia Non-Executive Director Ceased 30 November 2015Mr Eric Dodd Non-Executive Director Full financial yearMs Leslie Martin Non-Executive Director Full financial yearMr Robert Shaw Non-Executive Director Full financial yearMr Richard Thomas Non-Executive Director Full financial year
Senior executivesMr Thomas Beregi Chief Executive Officer Full financial yearMr Matthew Angell Chief Operating Officer Full financial yearMr Michael Eadie Chief Financial Officer Full financial year
C. SENIOR EXECUTIVE REMUNERATIONa) Remuneration PolicyThe Group’s Remuneration Policy is designed to ensure that remuneration outcomes are aligned with the long-term success of the Group. During the 2016 financial year, the remuneration structure was reviewed to ensure this objective would continue to be met in the context of an ASX 200 company.
While changes were made to the Long-Term Incentive (LTI) during the year, the overall remuneration structure remains broadly unchanged:
– Senior executive fixed remuneration packages in line with those paid for roles with equivalent responsibilities by companies of a similar market capitalisation;
– A Short-Term Incentive (STI) payable only on achievement of annual financial and strategic targets;
– An LTI paid in the form of performance rights potentially converting to deferred vesting shares, based on the following:
– 50 per cent based on exceeding financial targets over a three-year strategic planning cycle; and
– 50 per cent based on market performance relative to the ASX 200 over the same three-year cycle;
– No benefit under the LTI is payable if the Group’s hurdle return is not achieved each year; and
– There continues to be no termination benefits payable under any contract.
The remuneration structure ensures that if the Group underperforms its earnings and / or return targets, no STI will be payable to executives. Under-performance over the medium term will also result in no performance rights under the LTI converting to deferred vesting shares.
The Board believes that the Group’s remuneration framework encourages executives to maximise performance in the best interests of shareholders. Both STI and half of the LTI being linked directly to achieving earnings targets ensures that remuneration outcomes are substantially linked to earnings growth as the most direct driver of share price performance and shareholder returns. The other half of the LTI is directly linked to shareholder returns, based on market performance relative to the ASX 200.
DIRECTORS’ REPORT – AUDITED REMUNERATION REPORTF
or p
erso
nal u
se o
nly

DIRECTORS’ REPORT – AUDITED REMUNERATION REPORT
36
b) Contract detailsAll contracts with executives may be terminated by either party with agreed notice periods. Remuneration and other terms of employment are formalised in employment contracts. Details of these contracts are:
Name Title Term of agreement Details
Mr Thomas Beregi Chief Executive Officer (CEO) Ongoing, 3 months’ notice period
Fixed salary package of $700,000, consisting of base salary and superannuation, reviewed annually by the Remuneration Committee.
Mr Matthew Angell Chief Operating Officer (COO) Ongoing, 1 month notice period
Fixed salary package of $400,000, consisting of base salary and superannuation, reviewed annually by the Remuneration Committee.
Mr Michael Eadie Chief Financial Officer (CFO) Ongoing, 1 month notice period
Fixed salary package of $300,000, consisting of base salary and superannuation, reviewed annually by the Remuneration Committee.
c) Remuneration structure
FIXED REMUNERATION
BASE SALARY + SUPERANNUATION Set with reference to listed company benchmarks for equivalent roles determined by market capitalisation as well as breadth of operations.
VARIABLE REMUNERATION
The performance-based STI and LTI components are described in more detail below.
STI PLAN LTI PLAN
Annual cash payment Each performance right converts to deferred vesting shares upon the performance hurdles being met; these
shares will vest in a further 12 months Eligibility for payment depends on:
– The Group achieving its budgeted NPAT; and
– Achievement against individual objectives or Key Performance Indicators (KPIs) (includes strategic KPIs aligned to milestones in the three-year Strategic Plan)
The LTI performance hurdles consist of the following:
50% NPAT Compound Annual Growth Rate
(CAGR)
50% Total Shareholder Return (TSR) relative to
the ASX 200
For
per
sona
l use
onl
y

CREDIT CORP ANNUAL REPORT 2016 | AUDITED REMUNERATION REPORT
37
i) STI structureThe KPIs required to be achieved to be eligible for an STI award are annual operational and financial targets set before the start of each year. Targets are set at levels to achieve shorter-term financial and operational objectives aligned with the Group’s longer-term strategic goals.
The following table outlines the major features of the 2016 STI plan:
Features Description
Funding of STI pool The STI pool is funded if:
– The Group achieves its budgeted Net Profit before Tax (NPBT) before funding the STI; and
– The Group complies with its banking covenants.
Minimum criteria required to be achieved before any payments are made
If the STI pool is funded, the proportion of each individual’s targeted STI which is paid depends on:
– Satisfactory performance against individual KPIs; and
– Satisfactory performance against individual job accountabilities.
Maximum STI that can be earned The maximum amount varies and the range is between 54 per cent and 100 per cent of base salary. The amount is set at the start of the year by the Remuneration Committee and is approved by the Board.
KPIs – Individual KPIs are set annually; and
– Subject to funding of the STI pool, the maximum STI is eligible to be paid when satisfactory performance against KPIs is achieved.
Role accountabilities – Individual performance against role accountabilities is also assessed; and
– Subject to funding of the STI pool and achievement of KPIs, the maximum STI is eligible to be paid when satisfactory performance against role accountabilities is achieved.
Performance period 1 July 2015 to 30 June 2016
Approval Post the completion of the annual financial statement audit and performance review process, in September 2016 the proportion of the targeted STI payable to each executive will be determined by the Remuneration Committee and approved by the Board.
Payment timing September 2016
Form of payment Cash
Terminating executives There is no mandatory STI entitlement where an executive’s employment terminates prior to the payment date for the STI.
Performance of the Group against the 2016 STI NPAT hurdle is summarised as follows:
Budget Actual Change $’000 $’000 %
NPAT $41,434 $45,921 11%
The STI hurdle of a budgeted NPAT for 2016 of $41.4 million represented an 8 per cent increase on the NPAT achieved in 2015 of $38.4 million. The budget was exceeded by a further 11 per cent for an actual year-on-year increase in NPAT of 20 per cent.
As financial performance exceeded budget and banking covenants were complied with during 2016, the STI in respect of the 2016 year is eligible to be funded.
The remuneration report discloses the maximum STIs payable in respect of 2016. The actual STI payable to each executive will be a maximum of this amount and may reduce subject to the performance review process to occur in the first quarter of 2017. Each executive will be assessed on their individual performance against their KPIs and role accountabilities.F
or p
erso
nal u
se o
nly

DIRECTORS’ REPORT – AUDITED REMUNERATION REPORT
38
CEO’S KPIsA summary of the CEO’s KPIs for 2016 is as follows:
Category KPIs Method of assessment Weighting
Group performance NPAT Based upon the NPAT as per the Group’s audited financial statements for the 2016 financial year versus budget.
30%
Growth PDL acquisition targets Purchasing volumes for the 2016 financial year and committed purchases for the 2017 financial year, in accordance with Board approved return criteria.
20%
Consumer lending: business size and profitability metrics
Achievement of consumer loan book targets in the 2016 budget, maintenance of loan book loss rate and delivery of business cases for potential new lending products and markets.
25%
US operational performance
Purchases from new US clients, ensuring US compliance and achievement of budgeted operational metrics.
15%
Financing / strategy Progress of other strategic expansion initiatives
Review of adjacent market opportunities within lending and the core debt purchase business.
10%
The 2015 STI was paid during the 2016 financial year. No 2015 STIs were forfeited.
ii) LTI structureThe LTI is designed to align the interests of shareholders and executives by motivating and rewarding executives for achieving and exceeding 9 per cent compound annual earnings growth and producing strong shareholder returns over the medium to long term. The LTI aligns with the present three-year strategic planning cycle from 2016 to 2018.
The LTI is based on the following performance hurdles:
– Earnings-based hurdle (CAGR of NPAT); and
– Relative TSR against the performance of the ASX 200, excluding materials and energy shares.
Each hurdle operates independently and applies to 50 per cent of the potential LTI allocation. The earnings-based hurdle is subject to clawback conditions in the event of underperformance relative to the minimum 9 per cent NPAT CAGR required for any conversion of the performance rights to occur. Any deferred vesting shares will be clawed back based on their accounting or fair value at the time of the performance rights being issued. The clawback will be to the extent that the adjustment to NPAT is sufficient to result in a CAGR of 9 per cent either over the 2016 and 2017 financial years, or the three financial years from 2016 to 2018.
Relative TSR has been introduced as an additional LTI performance hurdle in line with the new strategic planning cycle from 2016 and represents 50 per cent of the potential LTI allocation. The Board believes this structure provides a balance between alignment of shareholder returns whilst mitigating the risk of excessive focus on share price performance.
For
per
sona
l use
onl
y

CREDIT CORP ANNUAL REPORT 2016 | AUDITED REMUNERATION REPORT
39
The detailed features of the LTI are listed below:
Features Description
Issue of performance rights Performance rights are issued to each participant at the start of the LTI plan in proportion to their level of participation in the LTI, as determined by the Remuneration Committee and the Board. The maximum fair value of the LTI pool is $7.5 million over 3 years ($2.5 million per year).
Performance rights are eligible for conversion and vesting based on achievement of performance hurdles. Performance rights will be allocated and converted into deferred vesting shares in November each year and are subject to a 12-month escrow period before vesting as well as the potential clawback provision outlined below. The conversion to deferred vesting shares is subject to Board approval.
Allocation The allocation of performance rights to senior executives, as set by the Remuneration Committee and the Board, for the 2016 to 2018 Strategic Plan period was as follows:
– CEO 40 per cent
– COO 22 per cent
– CFO 11 per cent
The remaining 27 per cent of performance rights issued were allocated to 7 other executives not considered KMP.
Performance conditions – The Group’s NPAT needs to exceed the Strategic Plan target in a given year. This is subject to the clawback provision described below;
– A minimum return on equity (ROE) of 15 per cent must be achieved; and
– Satisfactory performance by an executive against their job accountabilities as assessed in the annual performance review process described in the STI section above.
Vesting Relative TSR (50 per cent)The proportion of performance rights converting to deferred vesting shares is as follows:
– 50th percentile Nil
– 50th – 75th percentile Pro rata nil – 100 per cent
– 75th percentile 100 per cent vesting
The performance of the TSR is measured on a cumulative basis over the three-year LTI plan. The TSR for each performance period is calculated using the volume weighted average price (VWAP) during the testing period, in order to mitigate the impact of short-term price gyrations on the TSR calculation. The testing period is the 90 days to 31 October of each year of the Strategic Plan.
The TSR is compared to the TSR of the peer group for the purposes of determining the Group’s ranking. The peer group is comprised of the ASX 200 (excluding materials and energy shares).
NPAT CAGR (50 per cent)The proportion of awards vesting is as follows:
– 9 per cent CAGR 40 per cent
– >9 per cent, ≤13 per cent CAGR Pro rata 40 per cent – 100 per cent
– >13 per cent CAGR 100 per cent vesting
The NPAT CAGR performance condition is tested annually in September, following the conclusion of each financial year over the three-year Strategic Plan period.
The benefit of assessing earnings on a CAGR basis is that it represents sustained earnings growth over a three-year period from 2016 to 2018.
For
per
sona
l use
onl
y

DIRECTORS’ REPORT – AUDITED REMUNERATION REPORT
40
Features Description
Dividends An LTI participant has no entitlement to dividends until the performance rights have been converted into deferred vesting shares.
Clawback provision Unvested shares allocated for exceeding the NPAT CAGR hurdle of a minimum 9 per cent are subject to potential clawback, in the event of subsequent under-performance to the hurdle in either 2017 or 2018.
There is no clawback of any TSR-related allocation if under-performance occurs in subsequent years.
Forfeiture Forfeiture of an LTI participant’s account will occur should they resign, be terminated by the Group for any reason, remain employed but no longer form part of the leadership group or be terminated from the plan for any reason.
There is no mandatory LTI entitlement where an executive’s employment terminates prior to the vesting date of an LTI benefit.
Alignment The Group’s LTI plan aligns the interests of shareholders and executives by:
– 50 per cent of the potential award being based on achieving and exceeding target cumulative earnings growth, with earnings growth being a critical driver of shareholder returns; and
– 50 per cent of the potential award using TSR as a performance hurdle, which directly aligns the financial interests of executives and shareholders by linking their reward to the Group’s relative share price performance.
The Remuneration Committee and the Board believe that LTI hurdles based on achieving or exceeding the NPAT CAGR targeted in the Group’s TSR performance is a challenging objective for executives.
Relevant market data is consistent with this view:
1. Of the ASX 100 companies with an absolute earnings per share (EPS) performance measure in their executive LTI plan, the average CAGR hurdle in respect of the 2015 financial year was 4 to 6 per cent. Only 6 per cent of ASX 100 companies required minimum CAGR in NPAT in excess of the Group’s minimal NPAT CAGR of 9 per cent.
2. The median CAGR for ASX 200 companies from the 2013 to 2015 financial years was 4.6 per cent and the average CAGR for the three-year period was (8.5 per cent). The minimum NPAT CAGR threshold of 9 per cent for the Group’s earnings-based hurdle is well above this, setting a challenging target for the executives to achieve as a gateway.
There was an LTI program in place in respect of the 2013 to 2015 financial years, the details of which were previously disclosed. The final payments under this program in the form of cash and shares vested during the 2016 financial year.
LTI in respect of the 2014 and 2015 financial years Proportion vesting in Current allocation Minimum Maximum Proportion vesting during the 2017 financial year A future financial years A (% of pool) B value value
Year accrued 2014 2015 $ 2015 $ % $ $
Senior executivesMr Thomas Beregi 1/3 1/3 664,276 1/3 663,634 40.1% – 1,327,910Mr Matthew Angell 1/3 1/3 369,041 1/3 368,686 22.3% – 737,727Mr Michael Eadie 1/3 1/3 176,056 1/3 175,887 10.6% – 351,943
A The deferred vesting shares will vest equally in each of 2017 and 2018 financial years, subject to ongoing tenure as a company executive and continued performance.
B Each participant’s allocated percentage portion of the pool. The allocations are fixed and were determined by the Remuneration Committee as part of the approval of the LTI plan.
For
per
sona
l use
onl
y

CREDIT CORP ANNUAL REPORT 2016 | AUDITED REMUNERATION REPORT
41
d) Remuneration outcomesThe Board believes the Group’s remuneration structure, in particular the STI and LTI, have continued to ensure a significant proportion of remuneration is only payable as a result of the achievement of sustained earnings growth.
Details of the Group’s performance, share price and dividends over the past five years are summarised in the table below:
2016 2015 2014 2013 2012
EarningsTotal revenue ($’000) 226,742 191,049 173,998 142,577 124,590NPAT ($’000) 45,921 38,411 34,765 31,986 26,578
Change in NPAT (%) A 20% 10% 16% 12% 26%5-year NPAT CAGR (%) 15%
Shareholder valueShare price at the end of the year ($) 12.01 12.17 8.70 9.40 5.79Change in share price ($) (0.16) 3.47 (0.70) 3.61 1.04Total dividends paid / declared (cents) 50 44 40 37 29ROE (%) 23% 23% 23% 24% 23%
A Change in NPAT (%) refers to the movement in underlying NPAT.
D. DIRECTOR REMUNERATIONa) Remuneration PolicyThe Group’s Director Remuneration Policy is designed to provide fair remuneration that is appropriate to their responsibilities, performance, knowledge and skills that align with the business strategy to ensure the long-term success of the Group. Fees for directors are fixed and are not linked to the performance of the Group. This is to ensure the independence of the directors.
Remuneration levels of comparable companies are reviewed annually for benchmarking purposes and allowance is made for various factors, including demands on time, the level of commitment required and any special responsibilities. An annual aggregate cap of $0.9 million was approved by the shareholders at the 2012 AGM.
b) Contract detailsThe remuneration structure is set out below:
2016 2015 $ $
Chairman 190,000 190,000 Director and Committee Chairman 105,000 105,000 Director and Committee member 95,000 95,000Director 85,000 85,000
The above remuneration does not include the 9.5 per cent (2015: 9.5 per cent) statutory superannuation entitlement.
For
per
sona
l use
onl
y

DIRECTORS’ REPORT – AUDITED REMUNERATION REPORT
42
E. REMUNERATION TABLES AND DATAThe remuneration for each KMP of the Group during the year was: Post‑ employment Long‑term Short‑term benefits benefits benefits
Proportion of Non‑ remuneration Salary Short‑term monetary Super‑ Long‑term performance and fees incentive A benefits Total annuation incentive B Total related
$ $ $ $ $ $ $ %
DirectorsMr Donald McLayNon-Executive Director 2016 190,000 – 18,083 208,083 18,050 – 226,133 – Chairman 2015 190,000 – 16,892 206,892 18,050 – 224,942 –
Mr Simon CalleiaC
Non-Executive Director 2016 44,423 – – 44,423 4,220 – 48,643 – 2015 105,000 – – 105,000 9,975 – 114,975 –
Mr Eric DoddD
Non-Executive Director 2016 99,115 – – 99,115 9,416 – 108,531 – 2015 95,000 – – 95,000 9,025 – 104,025 –
Ms Leslie MartinNon-Executive Director 2016 95,000 – – 95,000 9,025 – 104,025 – 2015 91,115 – – 91,115 8,656 – 99,771 –
Mr Robert ShawNon-Executive Director 2016 105,000 – – 105,000 9,975 – 114,975 – 2015 105,000 – – 105,000 9,975 – 114,975 –
Mr Richard ThomasNon-Executive Director 2016 95,000 – – 95,000 9,025 – 104,025 – 2015 95,000 – – 95,000 9,025 – 104,025 –
Senior executivesMr Thomas BeregiChief Executive Officer 2016 636,615 490,500 18,083 1,145,198 31,663 877,315 2,054,146 67Company Secretary 2015 463,025 490,500 16,892 970,417 29,725 995,451 1,995,593 74
Mr Matthew AngellChief Operating Officer 2016 353,365 272,500 18,083 643,948 28,173 487,395 1,159,516 66 2015 250,000 272,500 16,892 539,392 23,750 553,028 1,116,170 74
Mr Michael EadieChief Financial Officer 2016 264,131 130,000 18,083 412,214 25,092 232,530 669,836 54Company Secretary 2015 210,000 130,000 16,892 356,892 19,950 263,830 640,672 61
Total remuneration 2016 1,882,649 893,000 72,332 2,847,981 144,609 1,597,240 4,598,830 54 2015 1,604,140 893,000 67,568 2,564,708 138,131 1,812,309 4,515,148 60
A The STI is prepared on an accrual basis and has been recorded above at 100 per cent of the maximum potential payment. Individual performance reviews to be conducted after the finalisation of the 2016 audited consolidated financial statements will determine the final entitlement.
B The LTI is prepared on an accrual basis. It is payable in the form of performance rights, convertible into deferred vesting shares upon achievement of the earnings-based and / or relative TSR performance hurdles.
C Mr Simon Calleia resigned as a director on 30 November 2015.
D Mr Eric Dodd was appointed Chair of the Remuneration Committee on 28 January 2016.
The salaries for the senior executives were reviewed by the Remuneration Committee and came into effect September 2015.
For
per
sona
l use
onl
y

CREDIT CORP ANNUAL REPORT 2016 | AUDITED REMUNERATION REPORT
43
The relative proportions of the elements of remuneration of each KMP that are linked to performance:
Remuneration Fixed linked to remuneration performance
2016 2015 2016 2015
DirectorsMr Donald McLay 100% 100% – – Mr Simon Calleia 100% 100% – – Mr Eric Dodd 100% 100% – – Ms Leslie Martin 100% 100% – – Mr Robert Shaw 100% 100% – – Mr Richard Thomas 100% 100% – –
Senior executivesMr Thomas Beregi 33% 26% 67% 74%Mr Matthew Angell 34% 26% 66% 74%Mr Michael Eadie 46% 39% 54% 61%
F. KMP EQUITY HOLDINGSa) Fully paid ordinary shares of Credit Corp Group LimitedThe movements during 2016 in the number of ordinary shares in Credit Corp Group Limited held directly, indirectly or beneficially by each KMP, including their related parties are:
Closing Opening Changes balance at balance at during 30 June 1 July 2015 the year A 2016
Number Number Number
DirectorsMr Donald McLay 1,708,308 (44,424) 1,663,884 Mr Simon Calleia B 612,152 967 613,119 Mr Eric Dodd 5,000 – 5,000 Ms Leslie Martin 5,000 123 5,123 Mr Robert Shaw 5,000 245 5,245 Mr Richard Thomas 9,984 2,600 12,584
2,345,444 (40,489) 2,304,955
Senior executivesMr Thomas Beregi 170,108 (93,210) 76,898 Mr Matthew Angell – – – Mr Michael Eadie 57,843 29,546 87,389 227,951 (63,664) 164,287
Total 2,573,395 (104,153) 2,469,242
A Other changes include shares granted via participation in the Deferred Employee Share Plan (DESP) and LTI plan, and shares purchased or sold directly on the ASX.
B Mr Simon Calleia resigned as a director on 30 November 2015. Closing balance is as at 30 November 2015.
For
per
sona
l use
onl
y

DIRECTORS’ REPORT – AUDITED REMUNERATION REPORT
44
Signed in accordance with a resolution of the Board of Directors.
Donald McLay Robert ShawChairman Director
Date: 2 August 2016
For
per
sona
l use
onl
y

45
AUDITOR’S INDEPENDENCE DECLARATION
This declaration is in respect of Credit Corp Group Limited and the entities it controlled during the year.
Hall Chadwick Level 40, 2 Park Street Sydney NSW 2000
David Kenney Partner
Date: 2 August 2016
CREDIT CORP GROUP LIMITED ABN 33 092 697 151
AND CONTROLLED ENTITIES
AUDITOR’S INDEPENDENCE DECLARATION UNDER SECTION 307C OF THE CORPORATIONS ACT 2001
TO THE DIRECTORS OF CREDIT CORP GROUP LIMITED AND CONTROLLED ENTITIES
I declare that, to the best of my knowledge and belief, during the year ended 30 June 2016 there have been no contraventions of:
i. the auditor independence requirements as set out in the Corporations Act 2001 in relation to the audit; and
ii. any applicable code of professional conduct in relation to the audit.
For
per
sona
l use
onl
y

46
CONSOLIDATED STATEMENT OF PROFIT OR LOSSFor the year ended 30 June 2016
2016 2015 Note $’000 $’000
Revenue 3 226,742 191,049 Finance costs (3,548) (1,332)Employee benefits expense (88,631) (80,784)Depreciation and amortisation expense (1,901) (947)Office facility expenses (12,644) (12,758)Collection expenses (13,895) (10,679)Consumer loan loss provision expense (23,705) (15,931)Marketing expenses (11,759) (9,243)Other expenses (4,923) (4,261)
Profit before income tax expense 65,736 55,114 Income tax expense 4 (19,815) (16,703)
Profit for the year 45,921 38,411
Earnings per share for profit attributable to owners of the CompanyBasic earnings per share (cents per share) 5 98.4 83.0Diluted earnings per share (cents per share) 5 97.0 83.0
The above financial statements should be read in conjunction with the accompanying notes.
For
per
sona
l use
onl
y

47
CONSOLIDATED STATEMENT OF COMPREHENSIVE INCOMEFor the year ended 30 June 2016
2016 2015 $’000 $’000
Profit for the year 45,921 38,411
Total comprehensive income for the year 45,921 38,411
The above financial statements should be read in conjunction with the accompanying notes.
For
per
sona
l use
onl
y

48
CONSOLIDATED STATEMENT OF FINANCIAL POSITIONAs at 30 June 2016
2016 2015 Note $’000 $’000
Current assetsCash and cash equivalents 8 2,542 6,301 Trade and other receivables 9 1,171 1,537 Consumer loans receivables 10 73,741 39,164 Purchased debt ledgers 11 115,203 65,720 Other assets 12 1,523 1,610
Total current assets 194,180 114,332
Non‑current assetsConsumer loans receivables 10 36,633 40,183 Purchased debt ledgers 11 138,112 99,207 Property, plant and equipment 13 6,277 1,874 Deferred tax assets 14 20,111 17,603 Intangible assets 15 800 800
Total non‑current assets 201,933 159,667
Total assets 396,113 273,999
Current liabilitiesTrade and other payables 16 19,320 18,056 Current tax liabilities 14 10,705 1,743 Provisions 17 4,936 3,701
Total current liabilities 34,961 23,500
Non‑current liabilitiesBorrowings 18 142,111 64,850 Provisions 17 4,943 5,539
Total non‑current liabilities 147,054 70,389
Total liabilities 182,015 93,889
Net assets 214,098 180,110
EquityIssued capital 20 55,561 48,697 Reserves 22 2,188 – Retained earnings 156,349 131,413
Total equity 214,098 180,110
The above financial statements should be read in conjunction with the accompanying notes.
For
per
sona
l use
onl
y

49
CONSOLIDATED STATEMENT OF CHANGES IN EQUITYFor the year ended 30 June 2016
Issued Retained Total capital Reserves earnings equity Note $’000 $’000 $’000 $’000
Balance at 1 July 2015 48,697 – 131,413 180,110
Total comprehensive income for the yearProfit for the year – – 45,921 45,921
Transactions with owners in their capacity as ownersShares issued net of transaction costs 20, 31B 2,477 – – 2,477 Performance rights issued net of transaction costs 22 – 2,188 – 2,188 Dividends paid or provided for 6 – – (20,985) (20,985)Dividend reinvestment plan net of transaction costs 20 4,387 – – 4,387
Transactions with owners in their capacity as owners 6,864 2,188 (20,985) (11,933)
Balance at 30 June 2016 55,561 2,188 156,349 214,098
Balance at 1 July 2014 47,109 – 112,446 159,555
Total comprehensive income for the yearProfit for the year – – 38,411 38,411
Transactions with owners in their capacity as ownersShares issued net of transaction costs 20, 31B 1,588 – – 1,588 Dividends paid or provided for 6 – – (19,444) (19,444)
Transactions with owners in their capacity as owners 1,588 – (19,444) (17,856)
Balance at 30 June 2015 48,697 – 131,413 180,110
The above financial statements should be read in conjunction with the accompanying notes.
For
per
sona
l use
onl
y

50
CONSOLIDATED STATEMENT OF CASH FLOWSFor the year ended 30 June 2016
2016 2015 Note $’000 $’000
Cash flows from operating activitiesReceipts from customers and debtors 377,857 326,290 Payments to suppliers and employees (131,961) (109,448)Interest received on bank deposits 40 97 Interest paid (3,548) (1,332)Income tax paid (13,363) (26,475)
Cash flows from operating activities before changes in operating assets 229,025 189,132
Changes in operating assets arising from cash flow movementsNet funding of consumer loans (55,077) (51,063)Acquisition of purchased debt ledgers (236,421) (139,446)
Changes in operating assets arising from cash flow movements (291,498) (190,509)
Net cash outflow from operating activities 19 (62,473) (1,377)
Cash flows from investing activitiesAcquisition of plant and equipment (1,970) (864)Proceeds from sale of plant and equipment – 38
Net cash outflow from investing activities (1,970) (826)
Cash flows from financing activitiesProceeds from borrowings 98,238 57,125 Repayment of borrowings (20,956) (31,959)Dividends paid (16,598) (19,444)
Net cash inflow from financing activities 60,684 5,722
Net (decrease) / increase in cash and cash equivalents (3,759) 3,519 Cash and cash equivalents at 1 July 6,301 2,782
Cash and cash equivalents at 30 June 8 2,542 6,301
The above financial statements should be read in conjunction with the accompanying notes.
For
per
sona
l use
onl
y

51
NOTE 1: CORPORATE INFORMATION
The consolidated financial statements of Credit Corp Group Limited and its subsidiaries (collectively, the Consolidated Group or the Group) for the year ended 30 June 2016 were authorised for issue in accordance with a resolution of the directors on 2 August 2016.
Credit Corp Group Limited is a for-profit company limited by shares incorporated in Australia whose shares are publicly traded. The address of its registered office and principal place of business is Level 15, 201 Kent Street, Sydney NSW 2000, Australia.
The Consolidated Group is primarily involved in operations within debt ledger purchasing, which includes mercantile collections and consumer lending. Further information on the nature of the operations and principal activities of the Group is provided in the Directors’ Report. Information on the Group’s structure is provided in Note 23: Subsidiaries. Information on other related party relationships of the Group is provided in Note 30: Related party transactions.
The parent entity, Credit Corp Group Limited, has not prepared separate financial statements in this financial report as permitted by the Corporations Act 2001. The financial information for the parent entity is disclosed in Note 34: Parent entity information.
NOTE 2: SIGNIFICANT ACCOUNTING POLICIES
a) Basis of preparationThe financial report is a general purpose financial report, which has been prepared in accordance with the requirements of the Corporations Act 2001, Australian Accounting Standards and other authoritative pronouncements of the Australian Accounting Standards Board.
Compliance with Australian Accounting Standards ensures that the financial report also complies with International Financial Reporting Standards (IFRS), as issued by the International Accounting Standards Board (IASB).
The consolidated financial statements have been prepared on a going concern basis using historical cost conventions, except for the cost of employee remuneration in the form of equity-settled transactions, which is determined by the fair value at the date when the grant is made using an appropriate valuation model.
Amounts in the financial report are presented in Australian dollars, which is the Group’s functional currency and are rounded off in accordance with ASIC Class Order 98/100 to the nearest thousand dollars, unless otherwise stated.
The accounting policies adopted are consistent with those of the previous financial year and corresponding interim period, unless otherwise stated.
b) Basis of consolidationThese consolidated financial statements incorporate the assets, liabilities and results of all subsidiaries at 30 June 2016. Subsidiaries are all entities over which the Group has control. The Group controls an entity when the Group is exposed to, or has rights to, variable returns from its involvement with the entity and has the ability to affect those returns through its power to direct the activities of the entity. Subsidiaries are fully consolidated from the date on which control is transferred to the Group. They are deconsolidated from the date control ceases.c) Use of accounting judgements, estimates and assumptions
The directors evaluate estimates and judgements incorporated into the financial statements based on historical knowledge and best available current information. Estimates assume a reasonable expectation of future events and are based on current trends and economic data, obtained both externally and within the Consolidated Group.
Key estimatesIn the application of the Group’s accounting policies, which are described in Note 2, the directors of the Consolidated Group are required to make judgements, estimates and assumptions about the carrying amounts of assets and liabilities that are not readily apparent from other sources. The estimates and associated assumptions are based on historical experience and other factors that are considered to be relevant. Estimates assume a reasonable expectation of future events and are based on current trends and economic data, obtained both externally and within the Consolidated Group. Actual results may differ from these estimates.
Estimates and underlying assumptions are reviewed on an ongoing basis. Revisions to accounting estimates are recognised in the period in which the estimates are revised and in any future periods affected.
Information about critical judgements in applying accounting policies that have the most significant effect on the amounts recognised in the financial statements are as follows:
i) PDLs PDLs are recognised at fair value (generally the
consideration paid) plus transaction costs and subsequently measured at amortised cost using the effective interest rate method. The interest rate method is applied at the level of individual PDLs by using an actuarially determined six-year cash collections forecast to determine an effective interest rate or implicit cash flow. This effective interest rate is used over the collection life cycle to apportion cash collections between the principal and interest components.
As a minimum, cash collections over the remainder of the six-year collection life cycle are actuarially reforecast each accounting period and any consequent adjustment to the carrying value is recognised in profit and loss on a net basis across all PDL tranches.
The appropriateness of the PDL carrying value is assessed by management and the Board by reviewing realised cash collections against ongoing forecasts and assessing cash flow generation more broadly. In 2016, the PDL asset turnover ratio (ratio of cash collections to average PDL carrying value) was 1.5x, significantly higher than other domestic and international listed company benchmarks. Refer to Note 11 for further details.
ii) Provisions The Consolidated Group utilises estimates of the probable
outflow of economic benefits based on contractual or expected legal obligations as a result of past events in recognising restructuring and employee benefit provisions. Loan provisions are based on estimated life of loan loss rates derived from a static pool analysis of the performance of loan products. These estimates are updated at each reporting date. Refer to Note 10 and Note 17 for more details.
iii) Share-based payments The cost of employee remuneration in the form of equity-
settled transactions in relation to the Group’s Long-Term Incentive plan (LTI) is determined by the fair value at the date when the grant is made using an appropriate valuation model. That cost is recognised in employee benefits expense, together with a corresponding increase in equity (reserve), over the period in which the service and, where applicable, the performance conditions are fulfilled. This estimate requires determination of the most appropriate inputs to the valuation model, including the expected life of the share option or appreciation right, volatility and dividend yield and making assumptions about them. The Group uses a binomial tree methodology and Monte-Carlo simulation for the LTI. Refer to Note 31 for more details.
NOTES TO THE CONSOLIDATED FINANCIAL STATEMENTSF
or p
erso
nal u
se o
nly

NOTES TO THE CONSOLIDATED FINANCIAL STATEMENTS
52
Impairment losses are recognised in the statement of profit or loss. Losses recognised in respect of CGUs are allocated first to reduce the carrying amount of any goodwill allocated to the CGU (or group of CGUs), and then to reduce the carrying amount of the other assets in the CGU (or group of CGUs) on a pro rata basis. An impairment loss in respect of goodwill is not reversed in subsequent periods.
g) Financial assets and liabilitiesThe Group’s financial assets and liabilities consist of non-derivative financial assets and liabilities and share capital.
i) Non-derivative financial assets Non-derivative financial assets mainly comprise cash and
cash equivalents, trade and other receivables, consumer loans receivables and PDLs.
Cash and cash equivalents Cash and cash equivalents comprise bank deposits with
maturities of less than three months and cash on hand that are subject to an insignificant risk of change in their fair value, and are used by the Consolidated Group in the management of its short-term commitments.
Trade and other receivables Trade and other receivables are initially recognised at fair
value and subsequently measured at amortised cost using the effective interest rate method, less any provision for doubtful debts. Refer to Note 9 for more details.
Consumer loans receivables Consumer loans receivables are initially recognised
at fair value of the loan written plus transaction costs and subsequently measured at amortised cost using the effective interest rate method, less provision for expected loan losses. Given the nature of loans written, a lifetime expected loan loss provision is taken up upon initial recognition of a consumer loan receivable. Refer to Note 10 for more details.
PDLs PDLs are recognised at fair value (generally the
consideration paid) plus transaction costs and subsequently measured at amortised cost using the effective interest rate method. The effective interest rate is adjusted for expected credit losses and at each reporting date all PDLs with similar characteristics are grouped and collectively assessed for any change in lifetime expected credit losses. Changes in expected credit losses are recognised in the profit or loss. Refer to Note 11 for further details.
ii) Non-derivative financial liabilities Financial liabilities mainly comprise loans and borrowings.
Such liabilities are recognised initially at fair value plus any directly attributable transaction costs. Subsequent to initial recognition, these financial liabilities are recognised at amortised cost, comprising the original debt less principal payments and amortisation.
iii) Share capital Ordinary shares Ordinary shares are classified as equity. Incremental costs
directly attributable to the issue of ordinary shares and share options are recognised as a deduction from equity, net of any tax effects.
h) Borrowing costsBorrowing costs consist of interest and other costs that an entity incurs in connection with the borrowing of funds. All borrowing costs are recognised in the statement of profit or loss in the period in which they are incurred.
d) Foreign currency transactions and balancesForeign currency transactions are translated into functional currency, being Australian dollars, using the exchange rates prevailing at the date of transaction. Foreign currency monetary items are translated at the year-end exchange rate. Non-monetary items measured at historical cost continue to be carried at the exchange rate at the date of the transaction. Non-monetary items measured at fair value are reported at the exchange rate at the date when fair values were determined.
Exchange differences arising on the translation of monetary items are recognised in the statement of profit or loss, except where deferred in equity as a qualifying cash flow or net investment hedge.
Exchange differences arising on the translation of non-monetary items are recognised directly in equity to the extent that the gain or loss is directly recognised in equity; otherwise the exchange difference is recognised in the statement of profit or loss.
e) Property, plant and equipmentPlant and equipment are measured at cost less accumulated depreciation and accumulated impairment losses. Subsequent costs are included in the asset’s carrying amount or recognised as a separate asset, as appropriate, only when it is probable that future economic benefits associated with the item will flow to the Consolidated Group and the cost of the item can be measured reliably. All other repairs and maintenance are charged to the statement of profit or loss during the financial period in which they are incurred.
The carrying amount of plant and equipment is reviewed annually by directors to ensure it is not in excess of the recoverable amount from these assets. The recoverable amount is assessed on the basis of the expected net cash flows that will be received from the asset’s employment and subsequent disposal. The expected net cash flows have been discounted to their present values in determining recoverable amounts. Any excess of the asset’s carrying value over its recoverable amount is expensed to the statement of profit or loss.
Depreciation is calculated on a straight-line basis over the estimated useful lives of the assets, as follows:
Class of fixed asset Years
Leasehold improvements Period of the leasePlant and equipment 2 to 5 yearsComputer software 2.5 to 4 years
The residual values, useful lives and methods of depreciation of property, plant and equipment are reviewed at each financial year end and adjusted prospectively, if appropriate.
f) Intangible assetsIntangible assets recognised by the Group consist of goodwill on consolidation and represent the excess of the cost of an acquisition over the fair value of the Group’s share of net identifiable assets of the acquired subsidiary at the date of acquisition. Goodwill with an indefinite useful life is not subject to amortisation and is tested annually for impairment, or more frequently if events or changes in circumstances indicate that they may be impaired. An impairment loss is recognised in the profit or loss for the amount by which the asset’s carrying value exceeds its recoverable amount. The recoverable amount is the higher of an asset’s fair value less costs to sell and value in use. For the purposes of assessing impairment, assets are grouped at the lowest levels for which there are separately identifiable cash inflows, which are largely independent of the cash inflows from other assets or groups of assets referred to as cash generating units (CGUs).
NOTE 2: SIGNIFICANT ACCOUNTING POLICIES (CONTINUED)
For
per
sona
l use
onl
y

CREDIT CORP ANNUAL REPORT 2016 | NOTES TO THE CONSOLIDATED FINANCIAL STATEMENTS
53
The carrying amount of deferred tax assets is reviewed at the end of each reporting period and reduced to the extent that it is no longer probable that sufficient taxable profits will be available to allow all or part of the asset to be recovered.
Deferred tax assets and liabilities are calculated at the tax rates that are expected to apply to the period when the assets are realised or the liabilities are settled, based on tax rates enacted or substantively enacted at balance date. Their measurement also reflects the manner in which management expects to recover or settle the carrying amount of the related assets or liabilities.
Deferred tax assets and liabilities are offset if there is a legally enforceable right to set off current tax assets against current tax liabilities and when they relate to income taxes levied by the same taxation authority and the Consolidated Group intends to settle its current tax assets and liabilities on a net basis.
The Consolidated Group operates in various tax jurisdictions, including Australia, New Zealand and the United States.
l) Tax consolidationCredit Corp Group Limited and its wholly-owned Australian subsidiaries have formed an income tax consolidated group under the tax consolidation legislation. The head entity, Credit Corp Group Limited, and its subsidiaries in the tax consolidated group account for their own current and deferred tax accounts. These tax amounts are measured as if each entity in the tax consolidated group continues to be a standalone taxpayer in its own right.
The Consolidated Group has entered a tax funding arrangement whereby each company in the Consolidated Group contributes to the income tax payable in proportion to their contribution to the Group’s taxable income. Any difference between the amounts assumed and amounts receivable or payable under the tax funding agreement is recognised as a contribution to (or distribution from) wholly-owned tax consolidated entities.
m) Goods and services tax (GST)Revenues, expenses and assets are recognised net of the amount of GST, unless the GST incurred is not recoverable from the Australian Taxation Office (ATO). In this case, it is recognised as part of the cost of acquisition of the asset or as part of the expense.
Receivables and payables are stated inclusive of the amount of GST receivable or payable. The net amount of GST recoverable from, or payable to, the ATO is included with other receivables or payables in the statement of financial position.
Cash flows are presented on a gross basis. The GST components of cash flows arising from investing or financing activities that are recoverable from, or payable to, the ATO are presented as operating cash flows.
n) RevenueThe major components of revenue are recognised as follows:
Interest revenue from PDLsRevenue from PDLs represents the component designated as interest income through the application of the effective interest method.
Interest and fee income from consumer lendingInterest income is recognised when the payments are received and fees are recognised as income over the life of the loan. Direct loan origination costs are netted against fee income over the life of the loan.
i) ProvisionsA provision is recognised if, as a result of a past event, the Consolidated Group has a present legal or constructive obligation that can be estimated reliably, and it is probable that an outflow of economic benefits will be required to settle the obligation.
j) Employee benefitsi) Short-term obligations Liabilities for wages and salaries expected to be settled
within 12 months represent present obligations resulting from employees’ services provided to the end of the reporting period. These are presented as payables and measured at the amounts expected to be paid when the liabilities are settled, plus on-costs.
ii) Long-term obligations The liability for long service leave and annual leave is
presented in employee benefits provisions and measured at the present value of the expected future payments to be made in respect of services provided by employees up to the end of the reporting period. Expected future payments are discounted using market yields on high quality corporate bonds at the end of the reporting period with terms to maturity and currency that match, as closely as possible, the estimated future payments.
iii) Equity-settled compensation The Consolidated Group provides benefits to employees
in the form of share-based payment transactions whereby employees render services in exchange for rights over shares.
The fair value determined at grant date of the equity-settled share-based payments is expensed on a straight-line basis over the vesting period at a maximum of three years, based on the Consolidated Group’s estimate of equity instruments that will eventually vest, with a corresponding increase in equity. The fair value of the performance rights is measured using a combination of binomial tree methodology and Monte-Carlo simulation. At the end of each reporting period, the Consolidated Group revises its estimate of the number of equity instruments expected to vest. The impact of the revision of the original estimates, if any, is recognised in the statement of profit or loss such that the cumulative expense reflects the revised estimate, with a corresponding adjustment to the equity-settled employee benefits reserve. Details regarding the determination of the fair value of share-based payments are set out in Note 31.
k) Income taxi) Current tax Current tax expense charged to the profit or loss is the
tax payable on taxable income calculated using applicable income tax rates enacted, or substantially enacted, as at reporting date. Current tax liabilities are therefore measured at the amounts expected to be paid to the relevant taxation authority.
ii) Deferred tax Deferred tax is on temporary differences arising between the
tax bases of assets and liabilities and their carrying amounts for financial reporting purposes at the reporting date.
Deferred tax assets are generally recognised for taxable temporary differences to the extent that it is probable that taxable profits will be available against which those deductible temporary differences can be utilised. No deferred income tax is recognised from the initial recognition of an asset or liability, excluding a business combination, where there is no effect on accounting or taxable profit or loss.
NOTE 2: SIGNIFICANT ACCOUNTING POLICIES (CONTINUED)
For
per
sona
l use
onl
y

NOTES TO THE CONSOLIDATED FINANCIAL STATEMENTS
54
2016 2015 $’000 $’000
NOTE 3: REVENUEInterest revenue from purchased debt ledgers 171,102 152,465Interest and fee income from consumer lending 53,418 35,862Other interest received 40 97Other income 2,182 2,625
Total 226,742 191,049
NOTE 4: INCOME TAX EXPENSEThe major components of income tax expense in the consolidated profit or loss statement at the end of the year are as follows:
A) Income tax expenseCurrent tax (22,363) (19,937)Deferred tax 2,508 3,306Overprovision / (underprovision) in respect of prior years 40 (72)
Total (19,815) (16,703)
B) Numerical reconciliation between tax expense and pre‑tax accounting profitProfit for the year 65,736 55,114Prima facie tax payable on profit from ordinary activities before income tax at 30% (2015: 30%) (19,721) (16,534)Tax effect of amounts that are not deductible (taxable) in calculating taxable income:Other non-deductible items (134) (97)
(19,855) (16,631)Overprovision / (underprovision) in respect of prior years 40 (72)
Income tax expense (19,815) (16,703)
Applicable weighted average effective tax rate 30% 30%
2016 2015
NOTE 5: EARNINGS PER SHAREBasic earnings per share (cents) 98.4 83.0Diluted earnings per share (cents) 97.0 83.0
Weighted average number of ordinary shares – basic (’000) 46,689 46,260Add: Adjustment for calculation of diluted earnings per share (performance rights) (’000) 639 –
Weighted average number of ordinary shares at 30 June – diluted (’000) 47,328 46,260
Basic and diluted earnings per share are calculated by dividing profit for the year by the weighted average number of shares on issue over the year.
Performance rightsPerformance rights first granted in the 2016 financial year under the Group’s LTI plan are considered to be potential ordinary shares and have been included in the determination of diluted earnings per share. The rights have not been included in the determination of basic earnings per share. Details relating to the rights are set out in the Remuneration Report and Note 31.
AASB 16 Leases (effective 1 January 2019)AASB 16 Leases provides a comprehensive model for the identification of lease arrangements and their treatment in the financial statements of both lessees and lessors.
The accounting model for lessees will require lessees to recognise all leases on balance sheet, except for short-term leases and leases of low value assets.
AASB 16 applies to annual periods beginning on or after 1 January 2019. The Group anticipates that the application of AASB 16 in the future may have a material impact on the amounts reported and disclosures made in the Group’s consolidated financial statements. However, it is not practicable to provide a reasonable estimate of the effect of AASB 16 until the Group performs a detailed review.
o) New standards and interpretations not yet adoptedCertain new accounting standards and interpretations have been published that are not mandatory for the 30 June 2016 reporting period. The Consolidated Group’s assessment of the impact of these new standards and interpretations is set out below:
AASB 15 Revenue from contracts with customers (effective 1 January 2018)AASB 15 Revenue from contracts with customers clarifies the principles for recognising revenue from contracts with customers. It applies to all contracts with customers except leases, financial instruments and insurance contracts. The Group intends to apply the standard from 1 July 2018 and does not expect any significant impacts.
NOTE 2: SIGNIFICANT ACCOUNTING POLICIES (CONTINUED)
For
per
sona
l use
onl
y

CREDIT CORP ANNUAL REPORT 2016 | NOTES TO THE CONSOLIDATED FINANCIAL STATEMENTS
55
Cents Total Franked / Date of per share $’000 unfranked payment
NOTE 6: DIVIDENDS PAID AND PROPOSEDThe following dividends were declared and paid by the Company:Year ended 30 June 2016Interim 2016 ordinary 23.00 10,752 Franked 24 Mar 16Final 2015 ordinary 22.00 10,233 Franked 30 Oct 15Total 20,985
Year ended 30 June 2015Interim 2015 ordinary 22.00 10,185 Franked 6 Mar 15Final 2014 ordinary 20.00 9,259 Franked 3 Oct 14
Total 19,444
After 30 June 2016 the following dividends were proposed by the directors. The dividends have not been provided for and there are no income tax consequences.
Final 2016 ordinary 27.00 12,687 Franked 28 Oct 16
2016 2015 $’000 $’000
Franking accountBalance of franking account at year end adjusted for franking credits arising from payment of provision for income tax and franking debits arising from payment of dividends 92,410 79,121Subsequent to year end, the franking account would be reduced by the proposed dividend (5,437) (4,365)
Total 86,973 74,756
2016 2015 $ $
NOTE 7: AUDITOR’S REMUNERATIONAudit servicesAudit and review of financial reports 181,000 170,000
Services other than statutory auditOther servicesTaxation compliance services 11,000 8,250Other services 14,400 7,700
Total 206,400 185,950
2016 2015 $’000 $’000
NOTE 8: CASH AND CASH EQUIVALENTSCash and cash equivalents 2,542 6,301
The Consolidated Group’s exposure to interest rate risk and a sensitivity analysis of financial assets and liabilities are disclosed in Note 32.
For
per
sona
l use
onl
y

NOTES TO THE CONSOLIDATED FINANCIAL STATEMENTS
56
2016 2015 $’000 $’000
NOTE 9: TRADE AND OTHER RECEIVABLESCurrentTrade receivables 506 949Less: Provision for impairment (1) (25)
505 924
Other receivables 734 719Less: Provision for impairment (68) (106)
666 613
Total 1,171 1,537
Provision for impairmentA provision for impairment is recognised when there is objective evidence that an individual trade receivable is impaired. These amounts have been included in other expenses.
Movement in the provision for impairmentOpening balance (131) (128)Charge for the year 62 (3)
Closing balance (69) (131)
Trade receivables that remain within initial trade terms are considered to be of high credit quality. At balance date trade receivables of $0.13 million (2015: $0.16 million) were outside initial trade terms but not impaired. It is expected these past due amounts will be received.
No trade receivables are recognised at balance date that are past due and deemed impaired. The Consolidated Group has provided a loss allowance of $0.001 million at reporting date (2015: $0.025 million).
NOTE 10: CONSUMER LOANS RECEIVABLESCurrentConsumer loans receivables 89,700 48,736Less: Provision for expected loan losses (15,959) (9,572)
73,741 39,164
Non‑currentConsumer loans receivables 45,253 50,886Less: Provision for expected loan losses (8,620) (10,703)
36,633 40,183
Total 110,374 79,347
Provision for expected loan lossesMovement in the provision for expected loan lossesOpening balance (20,275) (16,601)Net movement for the year (4,304) (3,674)
Closing balance (24,579) (20,275)
Provision for expected loan losses are recognised based on life of loan loss rates derived from static pool analysis of the performance of loan products. These estimates are updated on an ongoing basis.
For
per
sona
l use
onl
y

CREDIT CORP ANNUAL REPORT 2016 | NOTES TO THE CONSOLIDATED FINANCIAL STATEMENTS
57
2016 2015 $’000 $’000
NOTE 11: PURCHASED DEBT LEDGERSCurrent 115,203 65,720Non-current 138,112 99,207
Total 253,315 164,927
PDLs are measured at amortised cost using the effective interest method in accordance with AASB 9 Financial Instruments.
The effective interest rate is the implicit interest rate based on forecast collections determined in the period of acquisition of an individual PDL and equates to the Internal Rate of Return (IRR) of the forecast cash flows without any consideration of collection costs.
NOTE 12: OTHER ASSETSPrepayments 1,144 1,328Inventory 379 282
Total 1,523 1,610
Plant & Computer Leasehold equipment software improvements Total $’000 $’000 $’000 $’000
NOTE 13: PROPERTY, PLANT AND EQUIPMENTA) Cost or valuationYear ended 30 June 2016Opening balance 3,149 788 203 4,140Additions 908 158 5,238 6,304Closing balance 4,057 946 5,441 10,444
Year ended 30 June 2015Opening balance 2,547 587 203 3,337Additions 663 201 – 864Disposals (61) – – (61)
Closing balance 3,149 788 203 4,140
B) Accumulated depreciation or amortisationYear ended 30 June 2016Opening balance (1,632) (483) (151) (2,266)Depreciation / amortisation for the year (876) (122) (903) (1,901)Closing balance (2,508) (605) (1,054) (4,167)
Year ended 30 June 2015Opening balance (876) (343) (121) (1,340)Depreciation / amortisation for the year (777) (140) (30) (947)Disposals 21 – – 21
Closing balance (1,632) (483) (151) (2,266)
C) Carrying amountsAt 1 July 2015 1,517 305 52 1,874At 30 June 2016 1,549 341 4,387 6,277
At 1 July 2014 1,671 244 82 1,997
At 30 June 2015 1,517 305 52 1,874For
per
sona
l use
onl
y
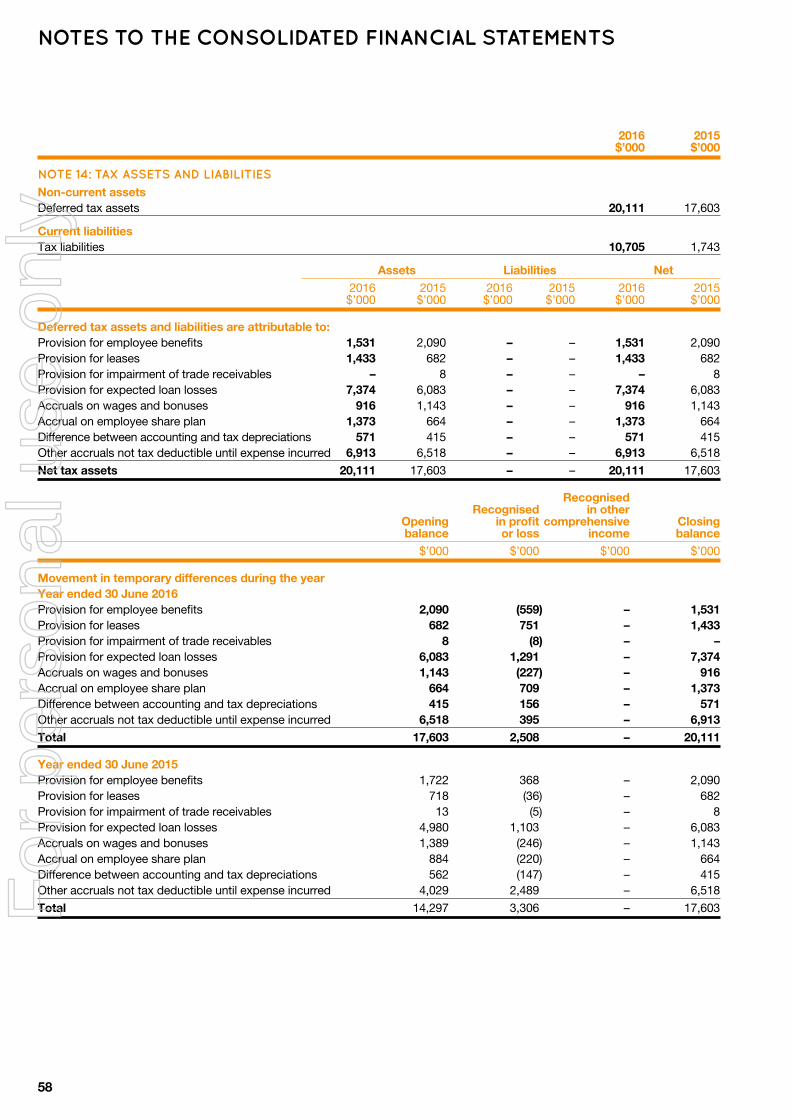
NOTES TO THE CONSOLIDATED FINANCIAL STATEMENTS
58
2016 2015 $’000 $’000
NOTE 14: TAX ASSETS AND LIABILITIESNon‑current assetsDeferred tax assets 20,111 17,603
Current liabilitiesTax liabilities 10,705 1,743
Assets Liabilities Net 2016 2015 2016 2015 2016 2015 $’000 $’000 $’000 $’000 $’000 $’000
Deferred tax assets and liabilities are attributable to:Provision for employee benefits 1,531 2,090 – – 1,531 2,090Provision for leases 1,433 682 – – 1,433 682Provision for impairment of trade receivables – 8 – – – 8Provision for expected loan losses 7,374 6,083 – – 7,374 6,083Accruals on wages and bonuses 916 1,143 – – 916 1,143Accrual on employee share plan 1,373 664 – – 1,373 664Difference between accounting and tax depreciations 571 415 – – 571 415Other accruals not tax deductible until expense incurred 6,913 6,518 – – 6,913 6,518
Net tax assets 20,111 17,603 – – 20,111 17,603
Recognised Recognised in other Opening in profit comprehensive Closing balance or loss income balance $’000 $’000 $’000 $’000
Movement in temporary differences during the yearYear ended 30 June 2016Provision for employee benefits 2,090 (559) – 1,531Provision for leases 682 751 – 1,433Provision for impairment of trade receivables 8 (8) – –Provision for expected loan losses 6,083 1,291 – 7,374Accruals on wages and bonuses 1,143 (227) – 916Accrual on employee share plan 664 709 – 1,373Difference between accounting and tax depreciations 415 156 – 571Other accruals not tax deductible until expense incurred 6,518 395 – 6,913Total 17,603 2,508 – 20,111
Year ended 30 June 2015Provision for employee benefits 1,722 368 – 2,090Provision for leases 718 (36) – 682Provision for impairment of trade receivables 13 (5) – 8Provision for expected loan losses 4,980 1,103 – 6,083Accruals on wages and bonuses 1,389 (246) – 1,143Accrual on employee share plan 884 (220) – 664Difference between accounting and tax depreciations 562 (147) – 415Other accruals not tax deductible until expense incurred 4,029 2,489 – 6,518
Total 14,297 3,306 – 17,603For
per
sona
l use
onl
y

CREDIT CORP ANNUAL REPORT 2016 | NOTES TO THE CONSOLIDATED FINANCIAL STATEMENTS
59
2016 2015 $’000 $’000
NOTE 15: INTANGIBLE ASSETSA) Carrying amountsOpening balance 800 800
Closing balance 800 800
B) Impairment testing for cash‑generating unit containing goodwillFor the purpose of impairment testing, goodwill is allocated wholly to the Consolidated Group’s mercantile collections operating unit, which represents the lowest level within the Consolidated Group at which the goodwill is monitored for internal management purposes. The Consolidated Group assesses for impairment at least semi-annually in accordance with the accounting policy as described in Note 2(f).
NOTE 16: TRADE AND OTHER PAYABLESCurrentUnsecured liabilitiesTrade payables 774 1,332Sundry payables and accrued expenses 18,546 16,724
Total 19,320 18,056
The Consolidated Group’s exposure to liquidity risk related to trade and other payables is disclosed in Note 32: Financial risk management.
NOTE 17: PROVISIONSCurrentEmployee benefits 3,888 3,392Lease provisions 1,048 309
4,936 3,701
Non‑currentEmployee benefits 1,216 3,574Lease provisions 3,727 1,965
4,943 5,539
Total 9,879 9,240
Employee Lease benefits provisions Total $’000 $’000 $’000
Year ended 30 June 2016Opening balance 6,966 2,274 9,240Additional provisions 1,695 4,708 6,403Amounts used (3,557) (2,207) (5,764)Closing balance 5,104 4,775 9,879
Nature of provisionsEmployee provisions include costs accrued for employee annual leave, long service leave and LTI.
Lease provisions include provisions raised for lease incentive accounting, make good requirements under operating leases of office space, straight-line allocation of lease expenses and onerous lease provisions.
For
per
sona
l use
onl
y

NOTES TO THE CONSOLIDATED FINANCIAL STATEMENTS
60
2016 2015 $’000 $’000
NOTE 18: BORROWINGSNon‑currentSecured liabilitiesBank loan 142,111 64,850
2016 2015 Facility Carrying Facility Carrying limit Fair value amount limit Fair value amount Expiry $’000 $’000 $’000 $’000 $’000 $’000
Secured bank loan 1 July 2020 150,000 142,111 142,111 75,000 64,850 64,850
The total facility is secured by a fixed and floating charge over the assets of a number of entities in the Consolidated Group.
The Consolidated Group entered into a new bank loan facility on 17 February 2016, with a total facility limit of $150 million expiring on 1 July 2020.
The amended facility requires compliance with various undertakings. These include compliance with minimum Tangible Net Worth (TNW) and maximum Loan to Valuation Ratio (LVR) requirements. The minimum TNW undertaking is set as the greater of $167.7 million and 85 per cent of the TNW at the end of the preceding financial year. The maximum LVR is 60 per cent of the carrying value of PDLs in the consolidated accounts and 60 per cent of the carrying value of eligible consumer loans.
All undertakings under the bank loan facilities, including the TNW and LVR requirements, were complied with.
2016 2015 Note $’000 $’000
NOTE 19: CASH FLOW INFORMATION A) Reconciliation of cash flow from operations with profit after income taxCash flows from operating activities Profit for the year 45,921 38,411Non-cash items– Foreign currency revaluation – (4)– Net loss on disposal of plant and equipment – 2– Leasehold incentive (4,334) –– Depreciation 1,901 947– Income tax expense 4 19,815 16,703– Share-based payments 4,665 1,588(Increase) / decrease in assets– Purchased debt ledgers (88,407) (6,506)– Consumer loans receivables (31,027) (32,866)– Trade and other receivables 366 (83)– Other assets 87 (135)Increase in liabilities– Trade and other payables 1,264 5,935– Provisions 639 1,106 (49,110) 25,098Income tax paid (13,363) (26,475)Net cash outflow from operating activities (62,473) (1,377)
B) Non‑cash investing and financing activitiesDuring the 2016 financial year, the Group entered into a lease agreement for its Sydney head office at 201 Kent Street. The Group elected to receive fit-out incentives in July 2015, and these were accounted for in accordance with Interpretation 115 Operating Leases – Incentives.
In accordance with the Group’s DRP offer, $4.39 million was reinvested by shareholders and not paid out in cash.
C) Reconciliation of cashCash and cash equivalents 8 2,542 6,301
For
per
sona
l use
onl
y

CREDIT CORP ANNUAL REPORT 2016 | NOTES TO THE CONSOLIDATED FINANCIAL STATEMENTS
61
2016 2015 Note $’000 $’000
NOTE 20: ISSUED CAPITAL46.99 million (2015: 46.30 million) fully paid ordinary shares 55,561 48,697
Issued capitalOpening balance 48,697 47,109Shares issued during the year:– LTI 31 2,477 1,588– DRP 4,387 –
Total 55,561 48,697
The Consolidated Group does not have a fixed authorised capital or par value for its issued shares. All issued shares are fully paid. Ordinary shares participate in dividends and the proceeds on winding up of the parent entity in proportion to the number of shares on issue.
2016 2015 Number Number ’000 ’000
Fully paid ordinary sharesOn issue at 1 July 46,297 46,132Shares issued during the year:– DRP 471 –– Employee share scheme 222 165
On issue at 30 June 46,990 46,297
The Consolidated Group issued 221,585 ordinary shares to the employee share trust in respect of the LTI plan in September 2015. The objectives of this form of remuneration are to encourage the retention of executives and ensure their interests are aligned with those of the shareholders in the creation of long-term shareholder value.
Refer to Note 31 for further details on the LTI plan.
NOTE 21: CAPITAL MANAGEMENTThe Consolidated Group manages its capital to ensure that entities in the Group will be able to continue as going concerns while maximising the return to stakeholders through the optimisation of the debt and equity balance. The Consolidated Group’s overall strategy for capital management based on the following principles remains unchanged from 2015:– Ensuring all capital is invested or reinvested to achieve the hurdle return on equity;– Ensuring sufficient capital is available to sustain the operations of the Group;– Gearing levels are maintained at relatively modest levels in line with the risk of the business and to provide headroom to grow
the business; and– Any excess cash that accumulates and is unable to be reinvested at the hurdle return is generally returned to shareholders.
The Consolidated Group’s bank loan facility requires compliance with various undertakings. These are described in Note 18. By maintaining gearing at a relatively modest level, the Consolidated Group generally maintains significant covenant headroom.
The composition of the capital of the Group and the gearing ratios for the years ended 30 June 2016 and 30 June 2015 are as follows:
2016 2015 Note $’000 $’000
Borrowings 18 142,111 64,850Less: Cash and cash equivalents 8 (2,542) (6,301)
Net debt 139,569 58,549
Total consumer loans and PDLs 363,689 244,274
Gearing ratio 38% 24%For
per
sona
l use
onl
y

NOTES TO THE CONSOLIDATED FINANCIAL STATEMENTS
62
2016 2015 $’000 $’000
NOTE 22: RESERVESEquity-settled employee benefits reserve 2,188 –
Reserves relate to performance rights granted by the Consolidated Group to executives and senior management under its LTI plan. Performance rights are issued to each participant and are eligible for conversion and vesting based on achievement of performance hurdles. Refer to Note 31 for further details on the LTI plan.
Percentage owned Country of incorporation 2016 2015
NOTE 23: SUBSIDIARIESInterests in subsidiaries are:Alpha Credit Pty Limited Australia 100 100Alupka Holdings Pty Limited Australia 100 100Car Start Pty Limited Australia 100 100Certus Partners Pty Limited Australia 100 100Creditcorp BPC Pty Limited Australia 100 100Credit Corp Australia Pty Limited Australia 100 100Credit Corp Brokering Services Pty Limited A Australia 100 –Credit Corp Collections Pty Limited Australia 100 100Credit Corp Collections Agency Inc. United States 100 100Credit Corp Collections Agency US Holdings Inc. United States 100 100Credit Corp Collections US Holdings Inc. United States 100 100Credit Corp Employee Share Administration Pty Limited Australia 100 100Credit Corp Facilities Pty Limited Australia 100 100Credit Corp Financial Services Pty Limited Australia 100 100Credit Corp Financial Services Holdings Inc. A United States 100 –Credit Corp Financial Services Inc. A United States 100 –Credit Corp Financial Solutions Pty Limited Australia 100 100Credit Corp Group US Collections GP United States 100 100Credit Corp Leasing Pty Limited A Australia 100 –Credit Corp Lending Pty Limited A Australia 100 –Credit Corp New Zealand Pty Limited Australia 100 100Credit Corp Queensland Pty Limited Australia 100 100Credit Corp Receivables Pty Limited Australia 100 100Credit Corp Recoveries Pty Limited Australia 100 100Credit Corp Services (NH) Pty Limited Australia 100 100Credit Corp Services Pty Limited Australia 100 100Credit Corp Services Malaysia Pty Limited Australia 100 100Credit Corp Services US Collections Inc. United States 100 100Credit Corp Services US Holdings Inc. United States 100 100Credit Corp Solutions Inc. United States 100 100Credit Corp US Collections Pty Limited Australia 100 100Credit Corp Western Australia Pty Limited Australia 100 100Credit Plan B Pty Limited Australia 100 100Malthiest Pty Limited Australia 100 100Personal Insolvency Management Pty Limited Australia 100 100Torbige Pty Limited Australia 100 100
A Incorporated during 2016.For
per
sona
l use
onl
y

CREDIT CORP ANNUAL REPORT 2016 | NOTES TO THE CONSOLIDATED FINANCIAL STATEMENTS
63
NOTE 24: OPERATING SEGMENTSA) Financial reporting by segmentsThe Consolidated Group has two main operations: debt ledger purchasing and consumer lending. The chief decision maker of the Group, the CEO, reviews the operating segments’ results on an ongoing basis to assess performance and allocate resources.
The reportable segments are as follows:
a) Debt ledger purchasingThe business purchases consumer debts at a discount to their face value from credit providers with the objective of recovering amounts in excess of the purchase price over the collection life cycle of the receivables.
b) Consumer lendingThe business offers various financial products to credit-impaired consumers.
Following is the information provided to the CEO: Total for Debt ledger Consumer continuing purchasing lending operations $’000 $’000 $’000
Year ended 30 June 2016Segment revenueExternal revenue 173,203 53,539 226,742Segment resultSegment profit 62,476 8,709 71,185Finance costs (3,548)Depreciation and amortisation expense (1,901)Profit before income tax expense 65,736Income tax expense (19,815)Profit after income tax expense 45,921
Other informationAcquisition of capital assets 1,809 161 1,970
Segment assets 315,541 60,461 376,002Unallocated assets 20,111Total assets 396,113
Segment liabilities 27,529 1,670 29,199Unallocated liabilities 152,816Total liabilities 182,015
Year ended 30 June 2015Segment revenueExternal revenue 155,040 36,009 191,049
Segment resultSegment profit 55,992 1,401 57,393Finance costs (1,332)Depreciation and amortisation expense (947)
Profit before income tax expense 55,114Income tax expense (16,703)
Profit after income tax expense 38,411
Other informationAcquisition of capital assets 687 177 864
Segment assets 177,049 79,347 256,396Unallocated assets 17,603
Total assets 273,999
Segment liabilities 25,501 1,795 27,296Unallocated liabilities 66,593
Total liabilities 93,889
For
per
sona
l use
onl
y

NOTES TO THE CONSOLIDATED FINANCIAL STATEMENTS
64
NOTE 24: OPERATING SEGMENTS (CONTINUED)B) Geographical informationThe Consolidated Group materially operates in one geographic segment, Australia.
2016 2015 $’000 $’000
NOTE 25: CONTINGENT LIABILITIESThe Group had contingent liabilities in respect of:
Licensure bonds 2,703 2,049
Licensure bonds are issued in the normal course of business to the State Boards of Collection Agencies in the United States to guarantee collected funds are remitted to clients under contracts.
NOTE 26: LEASING COMMITMENTSOperating lease commitmentsLeases as lesseeNon-cancellable operating leases contracted for but not capitalised in the financial statements:
PayableWithin one year 4,956 4,381Between one and five years 9,997 14,759Later than five years – –
Total 14,953 19,140
Operating leases are entered into to meet the business needs of entities of the Consolidated Group. Leases are primarily in respect of commercial premises and plant and equipment.
Lease rentals are determined in accordance with market conditions when leases are entered into.
NOTE 27: CAPITAL COMMITMENTSWithin one year 92,000 60,000
The Consolidated Group is committed, through existing arrangements, to acquire PDLs that will become available in the coming months. The details of these arrangements are commercially confidential, however, the estimated investment is expected to be $92 million (2015: $60 million). These purchases will be funded by existing cash flows and bank facilities currently in place.
NOTE 28: SUBSEQUENT EVENTSNo matters or circumstances have arisen since 30 June 2016 that significantly affected or may significantly affect in future years:– The operations of the Consolidated Group;– The results of those operations; or– The state of affairs of the Consolidated Group. 2016 2015 $ $
NOTE 29: KEY MANAGEMENT PERSONNEL COMPENSATIONThe aggregate compensation made to directors and other members of the KMP of the Consolidated Group is set out below:
Short-term employee benefits 2,847,981 2,564,708Post-employment benefits 144,609 138,131Other long-term benefits 1,597,240 1,812,309
Total 4,589,830 4,515,148
For
per
sona
l use
onl
y

CREDIT CORP ANNUAL REPORT 2016 | NOTES TO THE CONSOLIDATED FINANCIAL STATEMENTS
65
NOTE 30: RELATED PARTY TRANSACTIONSThe immediate parent and ultimate controlling party of the Consolidated Group is Credit Corp Group Limited.
Balances and transactions between the Company and its subsidiaries, which are related parties of the Company, have been eliminated on consolidation and are not disclosed in this note.
There were no transactions between the KMP and the Consolidated Group other than as disclosed in Note 29 and in the Directors’ report.
NOTE 31: SHARE-BASED PAYMENTSA) Employee share plansLTIThere was an LTI plan in place in respect of the 2013 to 2015 financial years, the details of which were previously disclosed. The final payments under this program in the form of cash and shares vested during the 2016 financial year.
Details of shares issued under this LTI plan during the year ended 30 June 2016 are as follows:
Fair value Number Issue date $ of shares
LTI 25 Sep 15 11.18 221,585
The Consolidated Group has a new LTI plan for executives and senior employees for the 2016 to 2018 financial years. In accordance with the plan, performance rights are issued to each participant at the start of the LTI plan in proportion to their level of participation in the LTI, as determined by the Remuneration Committee and the Board. The maximum fair value of the LTI pool is $7.5 million over 3 years ($2.5 million per year).
Performance rights are eligible for conversion and vesting based on achievement of performance hurdles. Performance rights will be allocated and converted into deferred vesting shares in November each year and are subject to a 12-month escrow period before vesting as well as the potential clawback provision. Please refer to the remuneration report for further details on the Group’s LTI plan. The aggregate amount recognised and included in the financial statements is disclosed in Note 22.
2016 2015 $’000 $’000
B) Share‑based payment transactionsShares granted during the yearLTI 2,477 1,588
NOTE 32: FINANCIAL RISK MANAGEMENTThe Consolidated Group’s financial assets and liabilities consist mainly of PDLs, consumer loans receivables, deposits with banks, trade and other receivables, payables and borrowings.
The Consolidated Group does not engage in the trading of derivative instruments.
The main risks the Consolidated Group is exposed to through its financial instruments are market risk (including foreign currency risk and interest rate risk), liquidity risk and credit risk.
The Board provides written principles for overall risk management, as well as policies covering specific areas, such as foreign exchange risk, interest rate risk, credit risk, use of derivative financial instruments and non-derivative financial instruments. They are managed and measured consistently year-on-year.
For
per
sona
l use
onl
y

NOTES TO THE CONSOLIDATED FINANCIAL STATEMENTS
66
NOTE 32: FINANCIAL RISK MANAGEMENT (CONTINUED)The Consolidated Group holds the following financial instruments:
2016 2015 Note $’000 $’000
Financial assetsCash and cash equivalents 8 2,542 6,301 Trade and other receivables 9 1,171 1,537 Consumer loans receivables 10 110,374 79,347 Purchased debt ledgers 11 253,315 164,927
Total 367,402 252,112
Financial liabilitiesTrade and other payables 16 19,320 18,056 Borrowings 18 142,111 64,850
Total 161,431 82,906
A) Market risk managementa) Currency riskOverseas operations expose the Consolidated Group to foreign exchange risk. This may result in the fair value of financial assets or liabilities fluctuating due to movements in foreign exchange rates of currencies in which the Consolidated Group holds overseas financial assets and liabilities.
Fluctuations in the United States dollar, New Zealand dollar and the Philippines peso relative to the Australian dollar may impact the Consolidated Group’s financial results.
As at balance date, had the Australian dollar weakened or strengthened by 5 per cent against any or all of the above currencies, the impact on both profit for the year and equity would have been immaterial. This assumes all other variables remain constant.
b) Interest rate riskThe Consolidated Group is exposed to interest rate risk as it borrows funds at floating interest rates.
i) ProfileAt balance date the interest rate profiles of the Consolidated Group’s interest-bearing and non-interest-bearing financial instruments were:
Fixed Floating Non‑interest interest rate interest rate bearing Total 2016 2015 2016 2015 2016 2015 2016 2015 Note $’000 $’000 $’000 $’000 $’000 $’000 $’000 $’000
Financial assetsCash and cash equivalents 8 – – 2,542 6,301 – – 2,542 6,301Trade and other receivables 9 – – – – 1,171 1,537 1,171 1,537Consumer loans receivables 10 110,374 79,347 – – – – 110,374 79,347Purchased debt ledgers 11 253,315 164,927 – – – – 253,315 164,927
Total 363,689 244,274 2,542 6,301 1,171 1,537 367,402 252,112
Financial liabilitiesTrade and other payables 16 – – – – 19,320 18,056 19,320 18,056Borrowings 18 – – 142,111 64,850 – – 142,111 64,850
Total – – 142,111 64,850 19,320 18,056 161,431 82,906
For
per
sona
l use
onl
y

CREDIT CORP ANNUAL REPORT 2016 | NOTES TO THE CONSOLIDATED FINANCIAL STATEMENTS
67
NOTE 32: FINANCIAL RISK MANAGEMENT (CONTINUED)ii) Sensitivity analysis for variable rate instrumentsA change of two percentage points in interest rates at balance date would have increased or decreased the Consolidated Group’s equity and profit or loss by the amounts shown below. These sensitivities assume all other variables remain constant.
2016 2015 $’000 $’000
Change in net profit after taxIncrease in interest rates by two percentage points (1,990) (908)Decrease in interest rates by two percentage points 1,990 908
Change in equityIncrease in interest rates by two percentage points (1,990) (908)Decrease in interest rates by two percentage points 1,990 908
B) Liquidity risk managementLiquidity risk arises from the possibility that the Consolidated Group might encounter difficulties in settling its debts or otherwise meeting its obligations relating to financial liabilities. Ultimate responsibility for liquidity risk management rests with the Board, which has established an appropriate liquidity risk management framework for the management of the Consolidated Group’s short-, medium-, and long-term funding and liquidity management requirements. The Consolidated Group manages this risk through the following mechanisms:– Preparing forward-looking cash flow analysis in relation to its operating, investing and financing activities;– Monitoring undrawn credit facilities;– Maintaining a reputable credit profile;– Managing credit risk related to its financial assets;– Investing surplus cash only with major financial institutions; and– Comparing the maturity profile of financial liabilities with the realisation profile of financial assets.
The following tables reflect an undiscounted contractual maturity analysis for financial liabilities. The timing of cash flows represented in the table to settle financial liabilities reflects the earliest contractual settlement dates and does not reflect management’s expectation that banking facilities will be rolled forward.
< 1 year 1 – 2 years > 2 years Total 2016 2015 2016 2015 2016 2015 2016 2015 Note $’000 $’000 $’000 $’000 $’000 $’000 $’000 $’000
Non‑derivative financial liabilitiesTrade and other payables 16 19,320 18,056 – – – – 19,320 18,056 Borrowings 18 – – – – 142,111 64,850 142,111 64,850
Total 19,320 18,056 – – 142,111 64,850 161,431 82,906
For
per
sona
l use
onl
y

NOTES TO THE CONSOLIDATED FINANCIAL STATEMENTS
68
NOTE 32: FINANCIAL RISK MANAGEMENT (CONTINUED)C) Credit risk managementCredit risk refers to the risk that a counterparty will default on its contractual obligations resulting in financial loss to the Group. The maximum exposure to credit risk, excluding the value of any collateral or other security at balance date, for recognised financial assets is the net of any provisions for impairment or losses, as disclosed in the statement of financial position and notes to the financial statements.
The Consolidated Group does not have any material credit risk exposure to any single debtor or group of debtors. Management has a Credit Policy in place and the exposure to credit risk is monitored on an ongoing basis.
2016 2015 Note $’000 $’000
Exposure to credit riskThe carrying amount of the Group’s financial assets represents the maximum credit exposure.Cash and cash equivalents 8 2,542 6,301 Trade and other receivables 9 1,171 1,537 Consumer loans receivables 10 110,374 79,347 Purchased debt ledgers 11 253,315 164,927
Total 367,402 252,112
AA-rated counterparties 2,542 6,301 Counterparties not rated 364,860 245,811
Total 367,402 252,112
The Consolidated Group’s maximum exposure to credit risk on the above financial assets at the balance date by type of counterparty was:
Government 85 158 Banks 2,791 6,827 Other 364,526 245,127
Total 367,402 252,112
D) Fair value versus carrying amountsFor all assets and liabilities, the fair value approximates the carrying value.
For
per
sona
l use
onl
y

CREDIT CORP ANNUAL REPORT 2016 | NOTES TO THE CONSOLIDATED FINANCIAL STATEMENTS
69
NOTE 33: CROSS GUARANTEEPursuant to ASIC Class Order 98/1418 dated 13 August 1998, the wholly-owned subsidiaries listed below are relieved from the Corporations Act 2001 requirements for preparation, audit and lodgement of financial statements and Directors’ report.
It is a condition of the Class Order that the Company and each of the participating subsidiaries enter into a Deed of Cross Guarantee. The effect of the Deed is that the Company guarantees to each creditor payment in full of any debt in the event of winding up of any of the subsidiaries under certain provisions of the Corporations Act 2001.
The subsidiaries subject to the Deed are:– Alpha Credit Pty Limited– Alupka Holdings Pty Limited– Car Start Pty Limited– Certus Partners Pty Limited– Credit Corp Australia Pty Limited– Credit Corp Brokering Services Pty Limited (entered during the 2016 financial year)– Credit Corp Collections Pty Limited– Credit Corp Employee Share Administration Pty Limited– Credit Corp Facilities Pty Limited– Credit Corp Financial Services Pty Limited– Credit Corp Leasing Pty Limited (entered during the 2016 financial year)– Credit Corp Lending Pty Limited (entered during the 2016 financial year)– Credit Corp New Zealand Pty Limited– Credit Corp Queensland Pty Limited– Credit Corp Receivables Pty Limited– Credit Corp Recoveries Pty Limited– Credit Corp Services Pty Limited– Credit Corp Services (NH) Pty Limited– Credit Corp Services Malaysia Pty Limited– Credit Corp US Collections Pty Limited– Credit Corp Western Australia Pty Limited– Credit Plan B Pty Limited– Creditcorp BPC Pty Limited– Malthiest Pty Limited– Personal Insolvency Management Pty Limited– Torbige Pty Limited
NOTE 33: CROSS GUARANTEE (CONTINUED) Set out below is the statement of profit or loss and the statement of financial position comprising the Company and its subsidiaries that are parties to the Deed, after eliminating all transactions between these parties, at balance date.
2016 2015 $’000 $’000
A) Statement of profit or lossRevenue 219,260 186,817Finance costs (3,548) (1,332)Employee benefits expense (78,739) (73,747)Depreciation and amortisation expense (1,712) (748)Office facility expenses (11,509) (11,374)Collection expenses (11,340) (9,098)Consumer loan loss provision expense (23,705) (15,931)Marketing expenses (11,759) (9,243)Other expenses (3,501) (4,413)Profit before income tax expense 73,447 60,931Income tax expense (22,146) (18,372)Profit for the year 51,301 42,559 B) Other comprehensive incomeProfit for the year 51,301 42,559Total comprehensive income for the year 51,301 42,559 C) Movements in retained earningsOpening balance 88,924 65,809Dividends recognised during the year (20,985) (19,444)Net profit attributable to parties in the Deed of Cross Guarantee 51,301 42,559Closing balance 119,240 88,924
For
per
sona
l use
onl
y

NOTES TO THE CONSOLIDATED FINANCIAL STATEMENTS
70
2016 2015 $’000 $’000
NOTE 33: CROSS GUARANTEE (CONTINUED) D) Statement of financial positionCurrent assets Cash and cash equivalents 2,353 5,760Trade and other receivables 957 1,252Consumer loans receivables 73,901 39,164Purchased debt ledgers 68,577 65,489Other assets 1,471 1,462Total current assets 147,259 113,127 Non‑current assets Consumer loans receivables 36,472 40,183Purchased debt ledgers 160,573 91,712Property, plant and equipment 6,023 1,497Deferred tax assets 18,343 17,603Intangible assets 800 800Total non‑current assets 222,211 151,795
Total assets 369,470 264,922 Current liabilities Trade and other payables 31,620 51,588Current tax liabilities 8,937 1,743Provisions 4,870 3,581Total current liabilities 45,427 56,912 Non‑current liabilities Borrowings 142,111 64,850Provisions 4,943 5,539Total non‑current liabilities 147,054 70,389
Total liabilities 192,481 127,301
Net assets 176,989 137,621 EquityIssued capital 55,561 48,697Reserves 2,188 –Retained earnings 119,240 88,924Total equity 176,989 137,621
For
per
sona
l use
onl
y

CREDIT CORP ANNUAL REPORT 2016 | NOTES TO THE CONSOLIDATED FINANCIAL STATEMENTS
71
2016 2015 $’000 $’000
NOTE 34: PARENT ENTITY INFORMATIONA) Statement of comprehensive incomeProfit for the year 42,580 40,277Other comprehensive income – –Total comprehensive income for the year 42,580 40,277 B) Statement of financial positionAssetsCurrent assets 179,781 102,388Non-current assets 145,579 107,017Total assets 325,360 209,405 Liabilities Current liabilities 30,607 21,964Non-current liabilities 147,054 70,389Total liabilities 177,661 92,353
Net assets 147,699 117,052 EquityIssued capital 55,561 48,697Reserves 2,188 –Retained earnings 89,950 68,355Total equity 147,699 117,052
C) Contractual commitmentsAt balance date the parent entity has not entered into any material contractual agreements for the acquisition of property, plant or equipment other than as separately noted in the financial statements (2015: nil).
For
per
sona
l use
onl
y

DIRECTORS’ DECLARATION
72
In accordance with a resolution of the directors of Credit Corp Group Limited, the directors of the Company declare that:
A) The financial statements and notes, as set out on pages 24 to 71 are in accordance with the Corporations Act 2001, and:
a) Give a true and fair view of the Consolidated Group’s financial position as at 30 June 2016 and of its performance for the year ended on that date; and
b) Comply with Australian Accounting Standards, which, as stated in Accounting Policy Note 2 to the financial statements, constitute explicit and unreserved compliance with International Financial Reporting Standards.
B) In the directors’ opinion, there are reasonable grounds to believe that the Company will be able to pay its debts as and when they become due and payable.
C) The directors have been given the declarations required by section 295A of the Corporations Act 2001 from the Chief Executive Officer and Chief Financial Officer.
At the date of this declaration, the Company is within the class of companies affected by ASIC Class Order 98/1418. The nature of the Deed of Cross Guarantee is such that each company party to the Deed guarantees to each creditor payment in full of any debt in accordance with the Deed of Cross Guarantee.
In the directors’ opinion, there are reasonable grounds to believe that the Company and the companies to which the ASIC Class Order applies, as detailed in Note 33 to the financial statements, will, as a group, be able to meet any obligations or liabilities to which they are, or may become, subject to by virtue of the Deed of Cross Guarantee.
Donald McLay Robert ShawChairman Director
Date: 2 August 2016
For
per
sona
l use
onl
y

CREDIT CORP ANNUAL REPORT 2016 | AUDITOR’S REPORT
73
CREDIT CORP GROUP LIMITED ABN 33 092 697 151 AND CONTROLLED ENTITIES
INDEPENDENT AUDITOR’S REPORT TO THE MEMBERS OF CREDIT CORP GROUP LIMITED AND CONTROLLED ENTITITES
Opinion We have audited the accompanying financial report of Credit Corp Group Limited (the Company), which comprises the consolidated statement of financial position as at 30 June 2016, the consolidated statement of profit or loss, consolidated statement of comprehensive income, the consolidated statement of changes in equity, the consolidated statement of cash flows for the year then ended and notes comprising a summary of significant accounting policies and other explanatory information, and the directors’ declaration of the Consolidated Entity comprising the Company and the entities it controlled at the year’s end or from time to time during the financial year. In our opinion:
(a) the accompanying financial report of the Consolidated Entity is in accordance with the Corporations Act 2001, including: i. giving a true and fair view of the Consolidated Entity’s financial position
as at 30 June 2016and of its performance for the year ended on that date; and
ii. complying with Australian Accounting Standards and the Corporations Regulations 2001
(b) the financial report also complies with International Financial Reporting Standards as disclosed in Note 2(a).
Basis of Opinion We conducted our audit in accordance with Australian Auditing Standards. Those standards require that we comply with relevant ethical requirements relating to audit engagements and plan and perform the audit to obtain reasonable assurance about whether the financial report is free from material misstatement. Our responsibilities under those standards are further described in the Auditor’s responsibility section of our report. We are independent of the Consolidated Entity in accordance with the Corporations Act 2001 and the ethical requirements of the Accounting Professional and Ethical Standards Board’s APES 110 Code of Ethics for Professional Accountants (the Code) that are relevant to our audit of the financial report in Australia. We have also fulfilled our other ethical responsibilities in accordance with the Code. We believe that the audit evidence we have obtained is sufficient and appropriate to provide a basis for our opinion. Key Audit Matters Key audit matters are those matters that, in our professional judgement, were of most significance in our audit of the financial report of the current period. These matters were addressed in the context of our audit of the financial report as a whole, and in forming our opinion thereon, and we do not provide a separate opinion on these matters.
INDEPENDENT AUDITOR’S REPORTF
or p
erso
nal u
se o
nly

74
CREDIT CORP GROUP LIMITED ABN 33 092 697 151 AND CONTROLLED ENTITIES
INDEPENDENT AUDITOR’S REPORT TO THE MEMBERS OF
CREDIT CORP GROUP LIMITED AND CONTROLLED ENTITITES
Carrying value of purchased debt ledgers $253.3 Million Refer to Note 11 Purchased Debt Ledgers The carrying value of purchased debt ledgers is mainly dependent on the forecast collections and the internal rate of return that determines the net realisable value of the debt ledgers. We focussed on this area as a key audit matter due to amounts involved being material; the inherent subjectivity of the key assumptions and the difficulties in reliably measuring these assumptions included the estimated internal rate of return and forecast cash collections. Our procedures included, amongst others: We have tested the mathematical accuracy of the model used to calculate the carrying value of purchased debt ledgers. We have checked and validated that the determined internal rate of return remains unchanged over the life of the debt. We have assessed, challenged and compared to historical actuals, key forward looking assumptions including forecast cash collections. We have performed sensitivity analysis in relation to the key forward looking assumptions. We have assessed the adequacy of the disclosures outlining the uncertainty relating to forecast cash collections. Provision for expected losses on the consumer loans ($24.6 Million) Refer to Note 10 Consumer Loans Receivables The net carrying value of consumer loans receivables is measured at amortised cost after providing for expected losses. Past arrears and write-offs are analysed to determine an expected loss curve by product which is used to determine the estimated life of loan and expected loss levels to be provided against each product. Levels of provisions are updated for the most recent expected life of loan loss estimates at each reporting date. We focussed on this area as a key audit matter due to amounts involved being material; the inherent subjectivity and difficulties in reliably measuring the key forward looking assumptions being a deterioration in credit risk and future loan defaults. Our procedures included, amongst others: We have tested the mathematical accuracy of the expected credit loss model. We have assessed the application of the Group’s model for impairment that considers the past arrears and write offs and the expected life of loan loss estimates. We have assessed, compared to historical actuals and challenged management’s view of credit risk that impacts the recognition of expected losses upon initial recognition over the life of the loans. We have performed sensitivity analysis in relation to the key forward looking assumptions. We have assessed the adequacy of the disclosures outlining the uncertainty relating to expected loan losses.
INDEPENDENT AUDITOR’S REPORTF
or p
erso
nal u
se o
nly

CREDIT CORP ANNUAL REPORT 2016 | AUDITOR’S REPORT
75
INDEPENDENT AUDITOR’S REPORT
CREDIT CORP GROUP LIMITED ABN 33 092 697 151 AND CONTROLLED ENTITIES
INDEPENDENT AUDITOR’S REPORT TO THE MEMBERS OF CREDIT CORP GROUP LIMITED AND CONTROLLED ENTITITES
Other Information The directors are responsible for the other information. The other information comprises the information in the Consolidated Entity’s annual report for the year ended 30 June 2016, but does not include the financial report and the auditor’s report thereon.
Our opinion on the financial report does not cover the other information and we do not express any form of assurance conclusion thereon.
In connection with our audit of the financial report, our responsibility is to read the other information and, in doing so, consider whether the other information is materially inconsistent with the financial report or our knowledge obtained in the audit or otherwise appears to be materially misstated. If, based on the work we have performed, we conclude that there is a material misstatement of the other information, we are required to report that fact. We have nothing to report in this regard.
Director’s Responsibility for the Financial Report The directors of the Company are responsible for the preparation of the financial report that gives a true and fair view in accordance with Australia Accounting Standards and the Corporations Act 2001 and for such internal control as directors determine is necessary to enable the preparation of the financial report that gives a true and fair view and is free from material misstatement, whether due to fraud or error. In Note 2(a), the directors also state, in accordance with Australian Accounting Standards AASB 101 Presentation of Financial Statements, that the financial report complies with International Financial Reporting Standards.
In preparing the financial report, the directors are responsible for assessing the Consolidated Entity’s ability to continue as a going concern, disclosing, as applicable, matters related to going concern and using the going concern basis of accounting unless the directors either intend to liquidate the Consolidated Entity or to cease operations, or have no realistic alternative but to do so.
Auditor’s Responsibility
Our responsibility is to express an opinion on the financial report based on our audit. Our objectives are to obtain reasonable assurance about whether the financial report as a whole is free from material misstatement, whether due to fraud or error, and to issue an auditor’s report that includes our opinion. Reasonable assurance is a high level of assurance, but is not a guarantee that an audit conducted in accordance with Australian Auditing Standards will always detect a material misstatement when it exists. Misstatements can arise from fraud or error and are considered material if, individually or in the aggregate, they could reasonably be expected to influence the economic decisions of users taken on the basis of this financial report.
As part of an audit in accordance with Australian Auditing Standards, we exercise professional judgement and maintain professional scepticism throughout the audit.
CREDIT CORP GROUP LIMITED ABN 33 092 697 151 AND CONTROLLED ENTITIES
INDEPENDENT AUDITOR’S REPORT TO THE MEMBERS OF CREDIT CORP GROUP LIMITED AND CONTROLLED ENTITITES
Other Information The directors are responsible for the other information. The other information comprises the information in the Consolidated Entity’s annual report for the year ended 30 June 2016, but does not include the financial report and the auditor’s report thereon.
Our opinion on the financial report does not cover the other information and we do not express any form of assurance conclusion thereon.
In connection with our audit of the financial report, our responsibility is to read the other information and, in doing so, consider whether the other information is materially inconsistent with the financial report or our knowledge obtained in the audit or otherwise appears to be materially misstated. If, based on the work we have performed, we conclude that there is a material misstatement of the other information, we are required to report that fact. We have nothing to report in this regard.
Director’s Responsibility for the Financial Report The directors of the Company are responsible for the preparation of the financial report that gives a true and fair view in accordance with Australia Accounting Standards and the Corporations Act 2001 and for such internal control as directors determine is necessary to enable the preparation of the financial report that gives a true and fair view and is free from material misstatement, whether due to fraud or error. In Note 2(a), the directors also state, in accordance with Australian Accounting Standards AASB 101 Presentation of Financial Statements, that the financial report complies with International Financial Reporting Standards.
In preparing the financial report, the directors are responsible for assessing the Consolidated Entity’s ability to continue as a going concern, disclosing, as applicable, matters related to going concern and using the going concern basis of accounting unless the directors either intend to liquidate the Consolidated Entity or to cease operations, or have no realistic alternative but to do so.
Auditor’s Responsibility
Our responsibility is to express an opinion on the financial report based on our audit. Our objectives are to obtain reasonable assurance about whether the financial report as a whole is free from material misstatement, whether due to fraud or error, and to issue an auditor’s report that includes our opinion. Reasonable assurance is a high level of assurance, but is not a guarantee that an audit conducted in accordance with Australian Auditing Standards will always detect a material misstatement when it exists. Misstatements can arise from fraud or error and are considered material if, individually or in the aggregate, they could reasonably be expected to influence the economic decisions of users taken on the basis of this financial report.
As part of an audit in accordance with Australian Auditing Standards, we exercise professional judgement and maintain professional scepticism throughout the audit. F
or p
erso
nal u
se o
nly

76
CREDIT CORP GROUP LIMITED ABN 33 092 697 151 AND CONTROLLED ENTITIES
INDEPENDENT AUDITOR’S REPORT TO THE MEMBERS OF CREDIT CORP GROUP LIMITED AND CONTROLLED ENTITITES
An audit involves performing procedures to obtain audit evidence about the amounts and disclosures in the financial report.
The procedures selected depend on the auditor’s judgement, including the assessment of the risks of material misstatement of the financial report, whether due to fraud or error. In making those risk assessments, the auditor considers internal control relevant to the entity’s preparation of the financial report that gives a true and fair view in order to design audit procedures that are appropriate in the circumstances, but not for the purpose of expressing an opinion on the effectiveness of the entity’s internal control.
The risk of not detecting a material misstatement resulting from fraud is higher than for one resulting from error, as fraud may involve collusion, forgery, intentional omissions, misrepresentations or the override of internal control.
An audit also includes evaluating the appropriateness of accounting policies used and the reasonableness of accounting estimates made by the directors, as well as evaluating the overall presentation of the financial report.
We conclude on the appropriateness of the directors’ use of the going concern basis of accounting and, based on the audit evidence obtained, whether a material uncertainty exists related to events or conditions that may cast significant doubt on the Consolidated Entity’s ability to continue as a going concern. If we conclude that a material uncertainty exists, we are required to draw attention in our auditor’s report to the related disclosures in the financial report or, if such disclosures are inadequate, to modify our opinion. Our conclusions are based on the audit evidence obtained up to the date of our auditor’s report. However, future events or conditions may cause the Consolidated Entity to cease to continue as a going concern.
We evaluate the overall presentation, structure and content of the financial report, including the disclosures, and whether the financial report represents the underlying transactions and events in a matter that achieves fair presentation.
We obtain sufficient appropriate audit evidence regarding the financial information of the entities or business activities within the Consolidated Entity to express an opinion on the financial report. We are responsible for the direction, supervision and performance of the Consolidated Entity audit. We remain solely responsible for our audit opinion.
We communicate with the directors regarding, amongst other matters, the planned scope and timing of the audit and significant audit findings, including any significant deficiencies in internal control that we identify during our audit.
The Auditing Standards require that we comply with relevant ethical requirements relating to audit engagements. We also provide the directors with a statement that we have complied with relevant ethical requirements regarding independence, and to communicate with them all relationships and other matters that may reasonably be thought to bear on our independence, and where applicable, related safeguards.
INDEPENDENT AUDITOR’S REPORTF
or p
erso
nal u
se o
nly

77
CREDIT CORP ANNUAL REPORT 2016 | AUDITOR’S REPORT
INDEPENDENT AUDITOR’S REPORT
CREDIT CORP GROUP LIMITED ABN 33 092 697 151 AND CONTROLLED ENTITIES
INDEPENDENT AUDITOR’S REPORT TO THE MEMBERS OF CREDIT CORP GROUP LIMITED AND CONTROLLED ENTITITES
Hall Chadwick Level 40, 2 Park Street Sydney NSW 2000
DAVID KENNEY Partner Dated: 2 August 2016
From the matters communicated with the directors, we determine those matters that were of most significance in the audit of the consolidated financial report of the current period and are therefore key audit matters. We describe these matters in our auditor’s report unless law or regulation precludes public disclosure about the matter or when, in extremely rare circumstances, we determine that a matter should not be communicated in our report because the adverse consequences of doing so would reasonably be expected to outweigh the public interest benefits of such communication.
Report on the Remuneration Report We have audited the remuneration report included in pages 35 to 44 of the directors’ report for the year ended 30 June 2016.
The directors of the company are responsible for the preparation and presentation of the remuneration report in accordance with s 300A of the Corporations Act 2001. Our responsibility is to express an opinion on the remuneration report, based on our audit conducted in accordance with Australian Auditing Standards.
Opinion In our opinion the remuneration report of Credit Corp Group Limited for the year ended 30 June 2016 complies with section 300A of the Corporations Act 2001.
For
per
sona
l use
onl
y

78
2016 2015 2014 2013 2012 $’000 $’000 $’000 $’000 $’000
Income and expenditurePurchased debt ledgers collections 321,989 288,186 288,106 250,369 230,442 Less: Purchased debt ledgers amortisation (150,887) (135,721) (136,242) (119,451) (108,439)
Interest revenue from purchased debt ledgers 171,102 152,465 151,864 130,918 122,003 Interest and fee income from consumer lending 53,418 35,862 19,104 4,954 750 Other revenue 2,222 2,722 3,030 6,705 1,837
Total revenue 226,742 191,049 173,998 142,577 124,590
NPAT 45,921 38,411 34,765 31,986 26,578
Financial positionCurrent assets 194,180 114,332 76,881 64,060 60,689 Non-current assets 201,133 158,867 148,837 116,168 85,492 Intangible assets 800 800 800 800 800
Total assets 396,113 273,999 226,518 181,028 146,981
Current liabilities 34,961 23,500 23,339 25,229 17,926 Non-current liabilities 147,054 70,389 43,624 16,007 7,073
Total liabilities 182,015 93,889 66,963 41,236 24,999
Net assets 214,098 180,110 159,555 139,792 121,982 Borrowings 142,111 64,850 38,497 9,537 – Shares on issue (’000) 46,990 46,297 46,132 45,933 45,571
Cash flowsFrom operating activities (62,473) (1,377) (11,413) 10,420 38,739 From investing activities (1,970) (826) (1,556) (726) (1,879)From financing activities 60,684 5,722 11,121 (7,895) (35,717)
Net (decrease) / increase in cash (3,759) 3,519 (1,848) 1,799 1,143
Key statisticsEarnings per share– Basic (cents) 98.4 83.0 75.4 69.8 58.4– Diluted (cents) 97.0 83.0 75.4 69.8 58.4Dividends per share (cents) 50.0 44.0 40.0 37.0 29.0NPAT / revenue (%) 20% 20% 20% 22% 21%ROE (%) 23% 23% 23% 24% 23%NTA backing per share (cents) 453.9 387.3 344.1 302.6 265.9
FIVE-YEAR FINANCIAL SUMMARYF
or p
erso
nal u
se o
nly

CREDIT CORP ANNUAL REPORT 2016 | DIRECTORS REPORT
79
SHAREHOLDER INFORMATION
Additional information required by the ASX Limited Listing Rules and not disclosed elsewhere in this report is set out below:
Ordinary shares
Twenty largest shareholders as at 31 August 2016 Number %
BNP Paribas Nominees Pty Limited 6,043,573 12.86HSBC Custody Nominees (Australia) Limited 5,946,124 12.65J P Morgan Nominees Australia Limited 4,800,073 10.22Citicorp Nominees Pty Limited 3,712,748 7.90RBC Investor Services Australia Nominees Pty Limited 2,750,596 5.85National Nominees Limited 2,181,375 4.64Torres Industries Pty Limited 1,538,569 3.27Dixson Trust Pty Limited 852,000 1.81Australian Executor Trustees Limited 655,819 1.40Slima Pty Limited 479,153 1.02Uptons Salvage Trading Pty Limited 296,289 0.63AMP Life Limited 253,127 0.54Bond Street Custodians Limited 205,637 0.44Zero Nominees Pty Limited 150,000 0.32Mr Frederick Benjamin Warmbrand 140,242 0.30Gladart Pty Limited 125,000 0.27CS Fourth Nominees Pty Limited 123,668 0.26Garrett Smythe Limited 119,118 0.25Mr Peter Upton 115,014 0.24Candide Investments Pty Limited 111,000 0.24
Total 30,599,125 65.11
Total ordinary shares as at 31 August 2016 46,990,429 100.00
SUBSTANTIAL SHAREHOLDERSAt 31 August 2016 the following shareholders were registered by the Company as a substantial holder, having declared a relevant interest in accordance with the Corporations Act 2001, in the voting shares below:
Ordinary Date of Holder shares % notice
National Australia Bank 5,272,608 11.22 19 Aug 2016Wilson Asset Management Group 2,976,317 6.33 9 Aug 2016Challenger Limited 2,744,807 5.84 17 Nov 2015Novaport Capital Pty Ltd 2,744,807 5.84 17 Nov 2015
DETAILS OF ORDINARY SHAREHOLDINGSDetails of the spread of ordinary shareholdings at 31 August 2016 are:
Number of Number of Category shareholders shares %
1 – 1,000 2,861 1,332,256 2.841,001 – 5,000 2,186 5,208,420 11.085,001 – 10,000 354 2,550,888 5.4310,001 – 100,000 299 7,646,560 16.27100,001 and over 25 30,252,305 64.38
Total 5,725 46,990,429 100.00
167 shareholders (representing 700 fully paid ordinary shares) held less than a marketable parcel.
For
per
sona
l use
onl
y

80
OTHER INFORMATIONThe Group does not have a current on-market buy-back program.
DIVIDEND REINVESTMENT PLANThe dividend reinvestment plan is currently suspended.
VOTING RIGHTSEach person who is a voting shareholder and who is present at a general meeting or by proxy, attorney or official representative is entitled:
– On a show of hands – to one vote; and
– On a poll – to one vote for each share held or represented.
If a shareholder is entitled to cast two or more votes at the general meeting, the shareholder may appoint not more than two proxies to attend and vote on the shareholder’s behalf.
If a shareholder appoints two proxies, each proxy should be appointed to represent a specified proportion or number of the shareholder’s votes.
ENQUIRIESBoardroom Pty LimitedLevel 12, 225 George StreetSydney NSW 2000Australia
Telephone +61 2 9290 9600 Fax +61 2 9279 0664 Email [email protected] Website www.boardroomlimited.com.au
SHAREHOLDER INFORMATIONF
or p
erso
nal u
se o
nly

81
CREDIT CORP GROUP LIMITEDABN 33 092 697 151
The shares of Credit Corp Group Limited are listed on the Australian Securities Exchange under the trade symbol CCP, with Sydney being the home exchange.
Directors
Mr Donald McLayMr Eric DoddMs Leslie MartinMr Robert ShawMr Richard Thomas
Company secretaries
Mr Thomas BeregiMr Michael EadieMr Geoffrey Templeton
Head office and registered office
Level 15, 201 Kent StreetSydney NSW 2000Australia
GPO Box 4475Sydney NSW 2001Australia
Telephone +61 2 8651 5000Fax 1300 483 012Email [email protected] www.creditcorp.com.au
Share registry
Boardroom Pty LimitedLevel 12, 225 George StreetSydney NSW 2000Australia
Telephone +61 2 9290 9600Fax +61 2 9279 0664Email [email protected] www.boardroomlimited.com.au
Auditor
Hall ChadwickLevel 40, 2 Park StreetSydney NSW 2000Australia
Telephone +61 2 9263 2600Fax +61 2 9263 2800Website www.hallchadwick.com.au
CORPORATE DIRECTORYD
ES
IGN
DA
VE
Y.C
OM
.AU
For
per
sona
l use
onl
y

CREDITCORP.COM.AU
For
per
sona
l use
onl
y