for montgomery county, maryland c2.0 mathematics algebra 1€¦ · · 2017-11-10bold text =...
TRANSCRIPT

Algebra 1 ©2018
for
Montgomery County, Maryland C2.0 Mathematics Algebra 1

enVision A|G|A – Algebra 1 for Montgomery County C2.0 Algebra 1
Copyright ©2017 Pearson Education, Inc. or its affiliate(s). All rights reserved
Introduction
enVision A|G|A ©2018 is a brand-new high school mathematics program. enVision A|G|A helps students look at math in new ways, with engaging, relevant, and adaptive content. For teachers, the program offers a flexible choice of options and resources. Customize instruction, practice, and assessments. Re-energize students and help them become more self-directed and independent learners. This document provides a concise alignment of enVision A|G|A Algebra 1 to the concepts of the Montgomery County C2.0 Mathematics Algebra 1 Unit Course Outlines with the fundamental lesson(s) for each concept denoted in bold text. Also provided is a correlation of enVision A|G|A Algebra 1 to the Maryland Common Core State Curriculum Framework - Algebra 1.
Personalized by Design Mathematical modeling, adaptive practice, and individual study plans make learning more personal and relevant.
Embedded interactives powered by Desmos Mathematical modeling in 3 acts Student Companion interactive worktext Adaptive practice powered by Knewton
Learning for What’s Next Create critical thinkers, problem solvers, and collaborators for future jobs and careers. enVision A|G|A balances conceptual understanding, procedural skills, and application. Harness the Possibilities Leverage technology and save hours of time on administrative tasks. Use ready-made assessments, practice, remediation, and reports. enVision A|G|A makes it easy to customize everything.

enVision A|G|A – Algebra 1 for Montgomery County C2.0 Algebra 1
Copyright ©2017 Pearson Education, Inc. or its affiliate(s). All rights reserved
Table of Contents
Montgomery County C2.0 Algebra 1 ............................................................................................................... 1
Maryland Common Core State Curriculum Framework - Algebra 1 ......................................................... 18
A Concise Alignment of enVision A|G|A – Algebra 1 to the Concepts of the Montgomery County C2.0 Algebra 1
Unit Course Outlines
1 Bold Text = Fundamental Lesson
Montgomery County C2.0 Algebra 1 Unit 1 Course Outline
Relationships Between Quantities and Reasoning with Equations
enVision A|G|A Algebra 1 Lessons
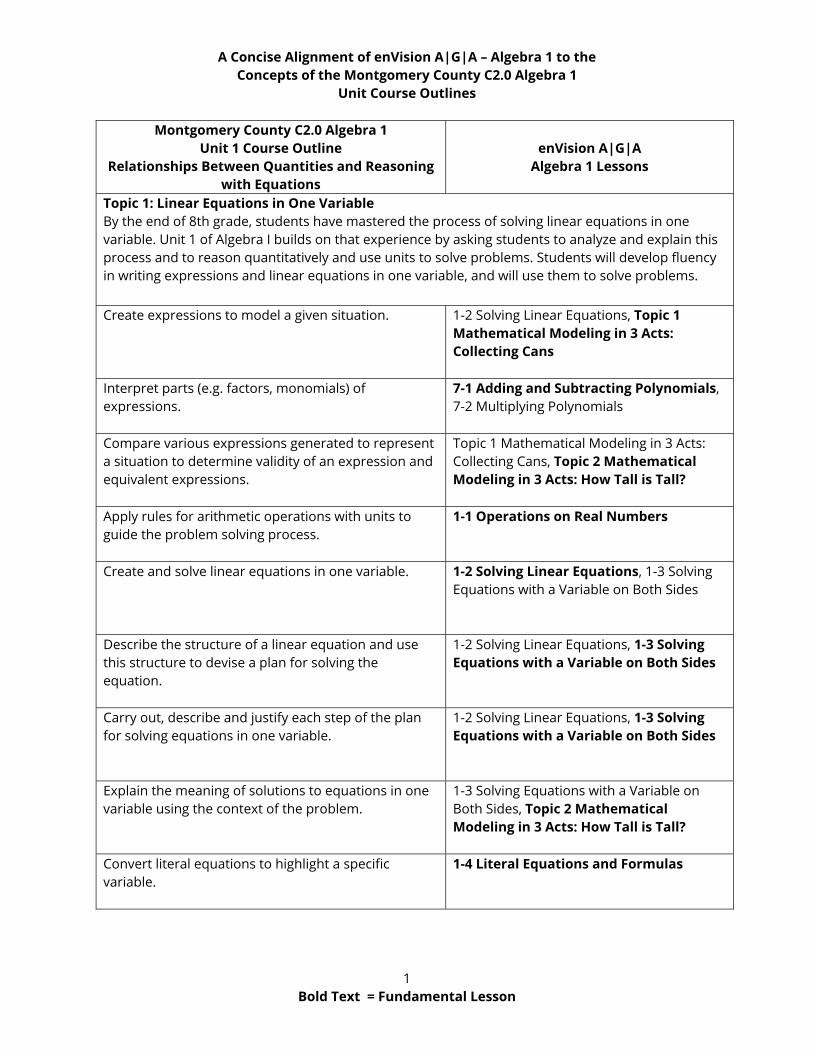
Topic 1: Linear Equations in One Variable By the end of 8th grade, students have mastered the process of solving linear equations in one variable. Unit 1 of Algebra I builds on that experience by asking students to analyze and explain this process and to reason quantitatively and use units to solve problems. Students will develop fluency in writing expressions and linear equations in one variable, and will use them to solve problems.
Create expressions to model a given situation. 1-2 Solving Linear Equations, Topic 1 Mathematical Modeling in 3 Acts: Collecting Cans
Interpret parts (e.g. factors, monomials) of expressions.
7-1 Adding and Subtracting Polynomials, 7-2 Multiplying Polynomials
Compare various expressions generated to represent a situation to determine validity of an expression and equivalent expressions.
Topic 1 Mathematical Modeling in 3 Acts: Collecting Cans, Topic 2 Mathematical Modeling in 3 Acts: How Tall is Tall?
Apply rules for arithmetic operations with units to guide the problem solving process.
1-1 Operations on Real Numbers
Create and solve linear equations in one variable. 1-2 Solving Linear Equations, 1-3 Solving Equations with a Variable on Both Sides
Describe the structure of a linear equation and use this structure to devise a plan for solving the equation.
1-2 Solving Linear Equations, 1-3 Solving Equations with a Variable on Both Sides
Carry out, describe and justify each step of the plan for solving equations in one variable.
1-2 Solving Linear Equations, 1-3 Solving Equations with a Variable on Both Sides
Explain the meaning of solutions to equations in one variable using the context of the problem.
1-3 Solving Equations with a Variable on Both Sides, Topic 2 Mathematical Modeling in 3 Acts: How Tall is Tall?
Convert literal equations to highlight a specific variable.
1-4 Literal Equations and Formulas

A Concise Alignment of enVision A|G|A – Algebra 1 to the Concepts of the Montgomery County C2.0 Algebra 1
Unit Course Outlines
2 Bold Text = Fundamental Lesson
Montgomery County C2.0 Algebra 1 Unit 1 Course Outline
Relationships Between Quantities and Reasoning with Equations
enVision A|G|A Algebra 1 Lessons
Interpret the meaning of expressions by attending to the units associated with each of the variables of a literal equation.
1-4 Literal Equations and Formulas
Topic 2: Linear Inequalities in One Variable Students apply their knowledge of linear equations to inequalities. Students develop fluency and master writing, interpreting, and translating inequalities in one variable. They will then use these inequalities to solve problems. Create inequalities in one variable to represent a given context.
1-5 Solving Inequalities in One Variable, Topic 1 Mathematical Modeling in 3 Acts: Collecting Cans
Solve inequalities for one variable. 1-5 Solving Inequalities in One Variable, Topic 1 Mathematical Modeling in 3 Acts: Collecting Cans
Construct arguments to justify their reasoning in solving inequalities.
1-5 Solving Inequalities in One Variable, 1-6 Compound Inequalities
Articulate the differences and similarities in solving equations and solving inequalities.
1-5 Solving Inequalities in One Variable, 1-6 Compound Inequalities
Topic 3: Exponential Equations in One Variable Students will extend their knowledge from linear equations and inequalities to solve simple exponential equations that rely only on the application of the laws of exponents. Solve simple exponential equations. 6-1 Rational Exponents and Properties of
Exponents, 6-2 Exponential Functions
Construct arguments to justify their reasoning in problems involving exponential expressions and equations.
6-3 Exponential Growth and Decay, Topic 6 Mathematical Modeling in 3 Acts: Big Time Pay Back
Articulate the differences and similarities in solving linear and exponential equations.
6-1 Rational Exponents and Properties of Exponents, 6-2 Exponential Functions

A Concise Alignment of enVision A|G|A – Algebra 1 to the Concepts of the Montgomery County C2.0 Algebra 1
Unit Course Outlines
3 Bold Text = Fundamental Lesson
Montgomery County C2.0 Algebra 1 Unit 2 Course Outline
Linear and Exponential Relationships
enVision A|G|A Algebra 1 Lessons
Topic 1: Characteristics of Functions Unit two focuses on linear and exponential relationships in two variables, beginning with developing a solid understanding of functions. In this topic, students learn function notation and develop the concepts of domain and range. Students learn to determine and interpret a function’s rate of change. Identify the independent and dependent variables in a functional relationship.
3-6 Analyzing Lines of Fit (p. 127), 10-7 Inverse Functions (p. 453)
Define a function, use function notation, and write functions using verbal, tabular, graphical, and symbolic models.
3-1 Relations and Functions, 3-2 Linear Functions
Classify variables as continuous or discrete. 3-1 Relations and Functions (p. 90)
Represent continuous domains or ranges using inequalities.
3-1 Relations and Functions, 3-2 Linear Functions
Understand that each element within a domain has exactly one corresponding element in the range.
3-1 Relations and Functions, 3-2 Linear Functions
Determine whether a situation is a function and justify the answer.
3-1 Relations and Functions, 3-2 Linear Functions
Describe the characteristics of functions such as domain, range, increasing, decreasing, intercepts, discrete and continuous.
3-1 Relations and Functions, 3-2 Linear Functions
Distinguish between the domain of a function and the domain of a situation.
3-1 Relations and Functions, 3-2 Linear Functions
Use function notation to interpret the meaning of the situation.
3-1 Relations and Functions, 3-2 Linear Functions

A Concise Alignment of enVision A|G|A – Algebra 1 to the Concepts of the Montgomery County C2.0 Algebra 1
Unit Course Outlines
4 Bold Text = Fundamental Lesson
Montgomery County C2.0 Algebra 1 Unit 2 Course Outline
Linear and Exponential Relationships
enVision A|G|A Algebra 1 Lessons
Interpret key features of a graph when given a brief description of real world events.
3-1 Relations and Functions, 3-3 Transforming Linear Functions
Sketch a graph based on a real-world situation. 3-1 Relations and Functions, Topic 3 Mathematical Modeling in 3 Acts: The Express Lane
Create a real-world situation for a given graph. 3-1 Relations and Functions
Determine the key features of a graph and table. 3-1 Relations and Functions, 3-2 Linear Functions
Compare and contrast the key features of a function when presented in different forms.
3-1 Relations and Functions, 3-2 Linear Functions
Understand that a table of values may look like a discrete function but actually only shows some of the solution points for a continuous function.
3-1 Relations and Functions , 3-2 Linear Functions
Compare discrete and continuous situations. 3-1 Relations and Functions (p. 90)

A Concise Alignment of enVision A|G|A – Algebra 1 to the Concepts of the Montgomery County C2.0 Algebra 1
Unit Course Outlines
5 Bold Text = Fundamental Lesson
Montgomery County C2.0 Algebra 1 Unit 2 Course Outline
Linear and Exponential Relationships
enVision A|G|A Algebra 1 Lessons
Topic 2: Constructing and Comparing Linear and Exponential Functions Students continue their learning through the exploration of many examples of functions, including sequences. Students interpret arithmetic sequences as linear functions and geometric sequences as exponential functions. They also describe key features of both linear and exponential functions. Students interpret functions given graphically, numerically, symbolically, and verbally, translate between representations, and understand the limitations of various representations. Analyze patterns to determine the next figure in a sequence.
3-4 Arithmetic Sequences, 6-4 Geometric Sequences
Identify and articulate the relationships between different methods to solve a problem.
Mathematical Modeling lessons are included in each topic. "3 Acts" refers to 1) identifying the question, 2) modeling the problem with mathematics, and 3) finding and verifying the solution. Students identify and articulate their problem-solving strategies. For examples, see Topic 3 Mathematical Modeling in 3 Acts: The Express Lane and Topic 6: Mathematical Modeling in 3 Acts: Big Time Pay Back
Construct an arithmetic sequence. 3-4 Arithmetic Sequences
Construct recursive and explicit equations from an arithmetic sequence.
3-4 Arithmetic Sequences
Construct a geometric sequence. 6-4 Geometric Sequences
Construct recursive and explicit equations from a geometric sequence.
6-4 Geometric Sequences
Identify and articulate the relationship between arithmetic and geometric sequences with increasing and decreasing common differences and common ratios.
3-4 Arithmetic Sequences, 6-4 Geometric Sequences

A Concise Alignment of enVision A|G|A – Algebra 1 to the Concepts of the Montgomery County C2.0 Algebra 1
Unit Course Outlines
6 Bold Text = Fundamental Lesson
Montgomery County C2.0 Algebra 1 Unit 2 Course Outline
Linear and Exponential Relationships
enVision A|G|A Algebra 1 Lessons
Represent arithmetic and geometric sequences in a variety of ways including recursive and explicit functions.
3-4 Arithmetic Sequences, 6-4 Geometric Sequences
Analyze patterns to determine the next term in a sequence.
3-4 Arithmetic Sequences, 6-4 Geometric Sequences
Construct recursive and explicit equations from a table.
3-4 Arithmetic Sequences, 6-4 Geometric Sequences
Analyze patterns to determine the “arithmetic means” in an arithmetic sequence.
3-4 Arithmetic Sequences
Analyze patterns to determine the “geometric means” in a geometric sequence.
6-4 Geometric Sequences
Identify and state differences between discrete and continuous functions.
3-1 Relations and Functions (p. 90)
Identify and classify linear and exponential functions based on their pattern of growth.
3-2 Linear Functions, 6-2 Exponential Functions
Identify and classify linear and exponential functions based on different representations of functions.
3-2 Linear Functions, 6-2 Exponential Functions
Compare and contrast similarities and differences between linear and exponential functions.
3-2 Linear Functions, 6-2 Exponential Functions
Categorize linear and exponential functions by their graphs, tables and equations.
3-2 Linear Functions, 6-2 Exponential Functions
Create linear and exponential functions based on real-life situations.
3-2 Linear Functions, 6-2 Exponential Functions
Compare the forms of linear and exponential equations to determine which is most effective for the given situation.
3-2 Linear Functions, 6-2 Exponential Functions
Determine an exponential equation from different representations of the real world function.
6-2 Exponential Functions, 6-3 Exponential Growth and Decay

A Concise Alignment of enVision A|G|A – Algebra 1 to the Concepts of the Montgomery County C2.0 Algebra 1
Unit Course Outlines
7 Bold Text = Fundamental Lesson
Montgomery County C2.0 Algebra 1 Unit 2 Course Outline
Linear and Exponential Relationships
enVision A|G|A Algebra 1 Lessons
Apply the exponential growth and decay formulas to real-life situations.
6-2 Exponential Functions, 6-3 Exponential Growth and Decay
Solve equations using a table, graph or equation. 1-2 Solving Linear Equations, 9-1 Solving Quadratic Equations Using Graphs and Tables
Topic 3: Systems of Equations and Inequalities in Two Variables Students develop methods to write and solve systems of equations and linear inequalities. They will be able to represent constraints as inequalities. Students continue to achieve fluency writing, interpreting, and translating between various forms of linear equations and inequalities in two variables, and use them to solve problems. Develop a problem-solving strategy and model to solve a mathematical situation, given the characteristics of the problem.
Algebra students apply problem-solving strategies to solve application problems in the exercise set of every lesson. Additionally, each topic includes Mathematical Modeling in 3 Acts: 1) identifying the question, 2) modeling the problem with mathematics, and 3) finding and verifying the solution. For examples, please see Topic 1 Mathematical Modeling in 3 Acts: Collecting Cans and Topic 2 Mathematical Modeling in 3 Acts: How Tall Is Tall?
Determine whether ordered pairs are viable or non-viable solutions to an equation and/or inequality.
4-1 Solving Systems of Equations by Graphing, 4-4 Linear Inequalities in Two Variables
Graph solutions sets to inequalities in two variables based on determined solutions and non-solutions.
4-4 Linear Inequalities in Two Variables, 4-5 Systems of Linear Inequalities
Recognize, analyze, and graph a linear function written in standard form and slope-intercept form.
2-1 Slope-Intercept Form, 2-3 Standard Form
Change real world linear functions from standard form to slope intercept form and vice versa.
2-3 Standard Form, 2-4 Parallel and Perpendicular Lines
Graph linear equations using intercepts. 2-3 Standard Form, 4-1 Solving Systems of Equations by Graphing

A Concise Alignment of enVision A|G|A – Algebra 1 to the Concepts of the Montgomery County C2.0 Algebra 1
Unit Course Outlines
8 Bold Text = Fundamental Lesson
Montgomery County C2.0 Algebra 1 Unit 2 Course Outline
Linear and Exponential Relationships
enVision A|G|A Algebra 1 Lessons
Write a system of linear inequalities to demonstrate a specific constraint.
4-5 Systems of Linear Inequalities
Graph the system of linear inequalities to determine solutions to a problem.
4-5 Systems of Linear Inequalities
Analyze graphically, numerically from a table, and algebraically, the solution to a system of equations.
4-1 Solving Systems of Equations by Graphing, 4-3 Solving Systems of Equations by Elimination
Use substitution to solve a system of equations. 4-2 Solving Systems of Equations by Substitution
Develop an informal method for solving a system of equations in which the coefficient of one of the variables is the same in both equations.
4-2 Solving Systems of Equations by Substitution, 4-3 Solving Systems of Equations by Elimination
Create a system of equations, with two unknown variables.
4-3 Solving Systems of Equations by Elimination, Topic 4 Mathematical Modeling in 3 Acts: Get Up There!
Obtain equivalent systems of equations by substitution.
4-2 Solving Systems of Equations by Substitution
Formally solve a system of equations by substitution to determine the values of both variables.
4-2 Solving Systems of Equations by Substitution
Write and solve a system of linear inequalities by graphing the boundary lines and shading the appropriate half-plane represented by the constraints.
4-5 Systems of Linear Inequalities
Identify parallel lines when written in standard form. 2-4 Parallel and Perpendicular Lines, 4-1 Solving Systems of Equations by Graphing
Graph and solve systems of inequalities using real-life applications.
4-5 Systems of Linear Inequalities
Formulate conclusions to a real-life application based on graphs of linear inequalities.
4-4 Linear Inequalities in Two Variables, 4-5 Systems of Linear Inequalities

A Concise Alignment of enVision A|G|A – Algebra 1 to the Concepts of the Montgomery County C2.0 Algebra 1
Unit Course Outlines
9 Bold Text = Fundamental Lesson
Montgomery County C2.0 Algebra 1 Unit 3 Course Outline Descriptive Statistics
enVision A|G|A Algebra 1 Lessons
Topic 1: Analyzing Data Representations This unit builds upon students’ prior experiences with center, variability, scatterplots, and linear trends in data, by providing more formal means of assessing how a model fits data. Students use regression techniques to describe approximately linear relationships between quantities and look at residuals to analyze the goodness of fit. Calculate measures of central tendency and determine which measure of central tendency best represents the average of the data.
11-1 Analyzing Data Displays, 11-2 Comparing Data Sets
Represent data in a box plot and to discuss shape, center, and spread in the context of the problem.
11-1 Analyzing Data Displays, 11-3 Interpreting the Shapes of Data Displays
Recognize extreme data points (outliers) and to explain their impact on the data.
11-1 Analyzing Data Displays, 11-2 Comparing Data Sets
Analyze data represented in different formats (histograms and box plots).
11-1 Analyzing Data Displays, 11-3 Interpreting the Shapes of Data Displays
Compare the shape, center, and spread of two or more sets of data.
11-2 Comparing Data Sets
Calculate the deviations from the mean for two symmetrical data sets that have the same means.
11-2 Comparing Data Sets, 11-4 Standard Deviation
Determine that a larger deviation from the mean signifies the data distribution has a greater spread and vice-versa.
11-2 Comparing Data Sets, 11-4 Standard Deviation
Calculate the standard deviation for a set of data with and without technology.
11-4 Standard Deviation
Interpret the standard deviation as a typical distance from the mean.
11-4 Standard Deviation

A Concise Alignment of enVision A|G|A – Algebra 1 to the Concepts of the Montgomery County C2.0 Algebra 1
Unit Course Outlines
10 Bold Text = Fundamental Lesson
Montgomery County C2.0 Algebra 1 Unit 3 Course Outline Descriptive Statistics
enVision A|G|A Algebra 1 Lessons
Derive the formula for computing the standard deviation.
11-4 Standard Deviation
Compare the relative variability of distributions using standard deviations.
11-4 Standard Deviation
Create and interpret two-way frequency tables and charts.
11-5 Two-Way Frequency Tables
Interpret data and use it to effectively communicate information being presented based on the context.
11-1 Analyzing Data Displays, Topic 11 Mathematical Modeling in 3 Acts: Text Message
Interpret different types of relative frequency tables. 11-5 Two-Way Frequency Tables
Analyze data based on the relative frequency of a row, column, or whole table.
11-5 Two-Way Frequency Tables
Understand and communicate the benefits of representing data in different formats.
3-6 Analyzing Lines of Best Fit
Describe the difference between correlation and causation given graphs and tables.
3-6 Analyzing Lines of Best Fit
Use technology to determine the linear regression equation of given data and make connections between the slope of the equation and the correlation of the data.
3-5 Scatter Plots and Lines of Fit, 3-6 Analyzing Lines of Fit
Use technology to determine the correlation coefficient given a table.
3-5 Scatter Plots and Lines of Fit, 3-6 Analyzing Lines of Fit
Explore the relationship between scatter plots and correlation coefficients.
3-5 Scatter Plots and Lines of Fit, 3-6 Analyzing Lines of Fit
Create scatter plots from a given set of data. 3-5 Scatter Plots and Lines of Fit, 3-6 Analyzing Lines of Fit
Analyze data to determine the correlation coefficient and utilize lines of best fit; those estimated by hand and those calculated using technology.
3-5 Scatter Plots and Lines of Fit, 3-6 Analyzing Lines of Fit

A Concise Alignment of enVision A|G|A – Algebra 1 to the Concepts of the Montgomery County C2.0 Algebra 1
Unit Course Outlines
11 Bold Text = Fundamental Lesson
Montgomery County C2.0 Algebra 1
Unit 4 Course Outline Quadratic Relationships
enVision A|G|A Algebra 1 Lessons
Topic 1: Quadratic Functions In this unit, students extend their knowledge of linear and exponential functions to quadratic functions. They compare the key characteristics of quadratic functions to those of linear and exponential functions and select from among these functions to model phenomena. They will interpret quadratic functions and write quadratic functions given context. Analyze quadratic patterns numerically, graphically, and symbolically.
8-1 Key Features of Graphs of Quadratic Functions
Recognize quadratic functions by analyzing the rates of change.
8-1 Key Features of Graphs of Quadratic Functions, 8-5 Comparing Linear, Exponential, and Quadratic Models
Describe the functional characteristics of a quadratic function.
8-2 Quadratic Functions in Vertex Form, 8-3 Quadratic Functions in Standard Form
Recognize the growth of a linear function and the growth of a quadratic function by looking at first and second differences, respectively.
8-5 Comparing Linear, Exponential, and Quadratic Models
Use equations, both recursive and explicit, graphs, and tables to model linear and quadratic relationships.
3-4 Arithmetic Sequences, 8-4 Modeling with Quadratic Functions
Determine a linear pattern from a model based on first differences and define recursive and explicit formulas to make predictions.
3-4 Arithmetic Sequences
Determine a quadratic pattern from a model by recognizing that first differences are linear and define its recursive and explicit formulas to make predictions.
8-5 Comparing Linear, Exponential, and Quadratic Models
Calculate the maximum area of a rectangle with a fixed perimeter using graph paper, tables, and/or graphs.
8-1 Key Features of Graphs of Quadratic Functions, 8-4 Modeling with Quadratic Functions
Discover that the relationship between the length and area of a rectangle is quadratic by examining the graph of area, A(L), versus length, L and its table.
8-1 Key Features of Graphs of Quadratic Functions, 8-4 Modeling with Quadratic Functions

A Concise Alignment of enVision A|G|A – Algebra 1 to the Concepts of the Montgomery County C2.0 Algebra 1
Unit Course Outlines
12 Bold Text = Fundamental Lesson
Montgomery County C2.0 Algebra 1 Unit 4 Course Outline
Quadratic Relationships
enVision A|G|A Algebra 1 Lessons
Develop tables and write formulas to represent quadratic relationships between quantities in context.
8-4 Modeling with Quadratic Functions, Topic 8 Mathematical Modeling in 3 Acts: The Long Shot
Compare and contrast graphs of quadratic functions that open upward and downward.
8-1 Key Features of Graphs of Quadratic Functions, 8-2 Quadratic Functions in Vertex Form
Compare and contrast quadratic and exponential functions.
8-5 Comparing Linear, Exponential, and Quadratic Models
Calculate and compare average speed over an interval for quadratic and exponential functions.
6-3 Exponential Growth and Decay, 8-1 Key Features of Graphs of Quadratic Functions
Determine if a relation is a function. 3-1 Relations and Functions
Determine if a function is linear, quadratic, or exponential.
8-5 Comparing Linear, Exponential, and Quadratic Models
Describe the growth of linear, quadratic, and exponential functions.
8-5 Comparing Linear, Exponential, and Quadratic Models
Create alternate representations of a linear, quadratic, or exponential function.
8-5 Comparing Linear, Exponential, and Quadratic Models
Topic 2: Structure of Quadratic Expressions Students will graph quadratic equations and show and analyze key features of the function. Students will formalize and become fluent in strategies for factoring trinomials and finding zeroes. Investigate the effects of transformations on the equation y = x2 , more specifically y = x2 + k, y = ax2 , and y = (x + h)2
8-1 Key Features of Graphs of Quadratic Functions, 8-2 Quadratic Functions in Vertex Form
Determine the value of a, h, and k given representations of y = x2 + k, y = ax2, and y = (x + h)2
8-1 Key Features of Graphs of Quadratic Functions, 8-2 Quadratic Functions in Vertex Form
Write perfect square trinomials in standard and factored form.
7-3 Multiplying Special Cases, 7-7 Factoring Special Cases
Complete the square to find an equivalent form of a quadratic equation.
9-5 Completing the Square, 9-6 The Quadratic Formula and the Discriminant

A Concise Alignment of enVision A|G|A – Algebra 1 to the Concepts of the Montgomery County C2.0 Algebra 1
Unit Course Outlines
13 Bold Text = Fundamental Lesson
Montgomery County C2.0 Algebra 1 Unit 4 Course Outline
Quadratic Relationships
enVision A|G|A Algebra 1 Lessons
Multiply two binomials and make the connection to determine new areas in a real-world context.
7-2 Multiplying Polynomials, 7-3 Multiplying Special Cases
Apply what they know about multiplying binomials to develop a strategy to factor trinomials.
7-5 Factoring x2 + bx + c, 7-6 Factoring ax2 + bx + c
Use what they know about area to factor quadratic trinomials symbolically.
7-5 Factoring x2 + bx + c, 7-6 Factoring ax2 + bx + c
Develop symbolic processes to factor “difference of squares” binomials and perfect square trinomials.
7-6 Factoring ax2 + bx + c, 7-7 Factoring Special Cases
Multiply expressions to create quadratic expressions.
7-2 Multiplying Polynomials, 7-3 Multiplying Special Cases
Add and subtract quadratic expressions. 7-1 Adding and Subtracting Polynomials
Graph quadratic functions given a quadratic function in factored form.
9-1 Solving Quadratic Equations Using Graphs and Tables, 9-2 Solving Quadratic Equations by Factoring
Identify the intercepts, vertex, line of symmetry, and vertical stretch of a quadratic function.
8-1 Key Features of Graphs of Quadratic Functions, 8-2 Quadratic Functions in Vertex Form
Investigate the relationship between intercepts of two linear functions and the intercepts of the product of those linear functions.
9-2 Solving Quadratic Equations by Factoring
Determine possible linear factors of a quadratic function given a graph.
9-2 Solving Quadratic Equations by Factoring
Translate among standard, vertex, and factored forms of quadratic equations and their tables and graphs.
8-2 Quadratic Equations in Vertex Form, 8-3 Quadratic Equations in Standard Form

A Concise Alignment of enVision A|G|A – Algebra 1 to the Concepts of the Montgomery County C2.0 Algebra 1
Unit Course Outlines
14 Bold Text = Fundamental Lesson
Montgomery County C2.0 Algebra 1 Unit 4 Course Outline
Quadratic Relationships
enVision A|G|A Algebra 1 Lessons
Identify functional characteristics of quadratic equations given an equation, table, or graph.
9-1 Solving Quadratic Equations Using Graphs and Tables, 9-2 Solving Quadratic Equations by Factoring
Topic 3: Solving Quadratic Equations Students will solve quadratic equations through various methods and will apply these methods strategically to solve problems most efficiently. They will derive the quadratic formula and will use apply their knowledge of quadratic functions to explain the Pythagorean Theorem. Solve quadratic equations using the zero product property.
9-2 Solving Quadratic Equations by Factoring
Solve quadratic equations in vertex form by factoring, by square roots, and by graphing.
9-1 Solving Quadratic Equations Using Graphs and Tables, 9-4 Solving Quadratic Equations Using Square Roots
Derive the quadratic formula to find the x-intercepts of the graph of a quadratic function.
9-6 The Quadratic Formula and the Discriminant
Solve quadratic equations by applying techniques for transforming quadratic equations.
9-4 Solving Quadratic Equations Using Square Roots, 9-5 Completing the Square
Solve quadratic equations using different methods (tables, factoring, completing the square, quadratic formula, and graphing) and determine when one method would work better than another.
9-2 Solving Quadratic Equations by Factoring, 9-6 The Quadratic Formula and the Discriminant
Solve systems of quadratic and linear equations symbolically or by graphing.
9-7 Solving Nonlinear Systems of Equations
Derive the Pythagorean Theorem using algebraic manipulation.
Knowledge of the Pythagorean Theorem is assumed prior to algebra; students using the Algebra 1 textbook apply the Pythagorean Theorem to write (and solve) quadratic equations to find unknown side lengths in right triangles: 9-2 Solving Quadratic Equations by Factoring (p. 369 #36), 9-4 Solving Quadratic Equations Using Square Roots (p. 378)

A Concise Alignment of enVision A|G|A – Algebra 1 to the Concepts of the Montgomery County C2.0 Algebra 1
Unit Course Outlines
15 Bold Text = Fundamental Lesson
Montgomery County C2.0 Algebra 1 Unit 4 Course Outline
Quadratic Relationships
enVision A|G|A Algebra 1 Lessons
Calculate lengths of sides and measures of angles in right triangles.
9-2 Solving Quadratic Equations by Factoring (p. 369 #36), 9-4 Solving Quadratic Equations Using Square Roots (p. 378)
Apply the Pythagorean Theorem to calculate a missing length in a right triangle.
9-2 Solving Quadratic Equations by Factoring (p. 369 #36), 9-4 Solving Quadratic Equations Using Square Roots (p. 378)
Apply the Pythagorean Theorem to determine a length in three dimensions.
Students using Algebra 1 apply the Pythagorean Theorem to solve real-world problems: 9-2 Solving Quadratic Equations by Factoring (p. 369 #36), 9-4 Solving Quadratic Equations Using Square Roots (p. 378)
Calculate the distance between two points on a coordinate plane.
Students using Algebra 1 solve problems by manipulating the formula distance=rate*time and by using quadratic models to represent distances. 1-4 Literal Equations and Formulas, 9-4 Solving Quadratic Equations Using Square Roots
Derive the distance formula. Students using Algebra 1 solve problems by manipulating the formula distance=rate*time and by using quadratic models to represent distances. 1-4 Literal Equations and Formulas, 9-4 Solving Quadratic Equations Using Square Roots

A Concise Alignment of enVision A|G|A – Algebra 1 to the Concepts of the Montgomery County C2.0 Algebra 1
Unit Course Outlines
16 Bold Text = Fundamental Lesson
Montgomery County C2.0 Algebra 1 Unit 5 Course Outline
Generalizing Function Properties
enVision A|G|A Algebra 1 Lessons
Topic 1: Function Families Students expand their experience with linear, quadratic, and exponential functions to include more specialized functions—absolute value, step, and those that are piecewise-defined. They select from among these models to model phenomena and solve problems. Create a story context given the graph of a piecewise function using knowledge of domain and linear functions.
5-2 Piecewise-Defined Functions, 5-4 Transformations of Piecewise-Defined Functions
Write a set of equations given a graph of a piecewise function.
5-2 Piecewise-Defined Functions, 5-4 Transformations of Piecewise-Defined Functions
Interpret the slope of each piece of a piecewise function.
5-2 Piecewise-Defined Functions, 5-4 Transformations of Piecewise-Defined Functions
Evaluate piecewise functions for specific values of the domain in context.
5-2 Piecewise-Defined Functions, 5-4 Transformations of Piecewise-Defined Functions
State the domain and the range of a function in context of the problem.
5-2 Piecewise-Defined Functions, 5-4 Transformations of Piecewise-Defined Functions
Graph a piecewise function given the equation. 5-2 Piecewise-Defined Functions, 5-4 Transformations of Piecewise-Defined Functions
Write a step function and graph a step function given a verbal description.
5-3 Step Functions, 5-4 Transformations of Piecewise-Defined Functions
Evaluate a step function in context. 5-3 Step Functions, 5-4 Transformations of Piecewise-Defined Functions
Determine the domain and range of a step function in context.
5-3 Step Functions
Describe and evaluate the greatest integer function, the least integer function, and fractional part function verbally and symbolically.
5-3 Step Functions

A Concise Alignment of enVision A|G|A – Algebra 1 to the Concepts of the Montgomery County C2.0 Algebra 1
Unit Course Outlines
17 Bold Text = Fundamental Lesson
Montgomery County C2.0 Algebra 1 Unit 5 Course Outline
Generalizing Function Properties
enVision A|G|A Algebra 1 Lessons
Determine the domain and range of the greatest integer function, the least integer function, and fractional part function.
5-3 Step Functions
Write piecewise linear absolute value functions from a graph and from an absolute value function.
5-1 The Absolute Value Function, 10-3 Analyzing Functions Graphically
Graph absolute value functions given a piecewise or an absolute value equation.
5-1 The Absolute Value Function, 5-4 Transformations of Piecewise-Defined Functions
Write piecewise quadratic absolute value functions from a graph.
5-1 The Absolute Value Function, 10-3 Analyzing Functions Graphically
Graph absolute value functions given an absolute value equation.
5-1 The Absolute Value Function, 5-4 Transformations of Piecewise-Defined Functions
Compare the parent quadratic function, y = x2, to the square root function, y=√ , and do the same with cubic, y = x3, and cube root, y =∛ , functions.
10-1 The Square Root Function, 10-2 The Cube Root Function
Graph square root and cube root functions, taking into consideration any constraints on the domain and range.
10-1 The Square Root Function, 10-2 The Cube Root Function
Graph transformations of square root and cube root functions.
10-1 The Square Root Function, 10-2 The Cube Root Function
A Correlation of enVision A|G|A – Algebra 1 to the Maryland Common Core State Curriculum Framework for Mathematics Algebra 1
18 ★ Modeling Standard (+) indicates additional mathematics that students should learn to prepare for advanced courses
Maryland Common Core State Curriculum Framework - Algebra 1
enVision A|G|A Algebra 1 Lessons
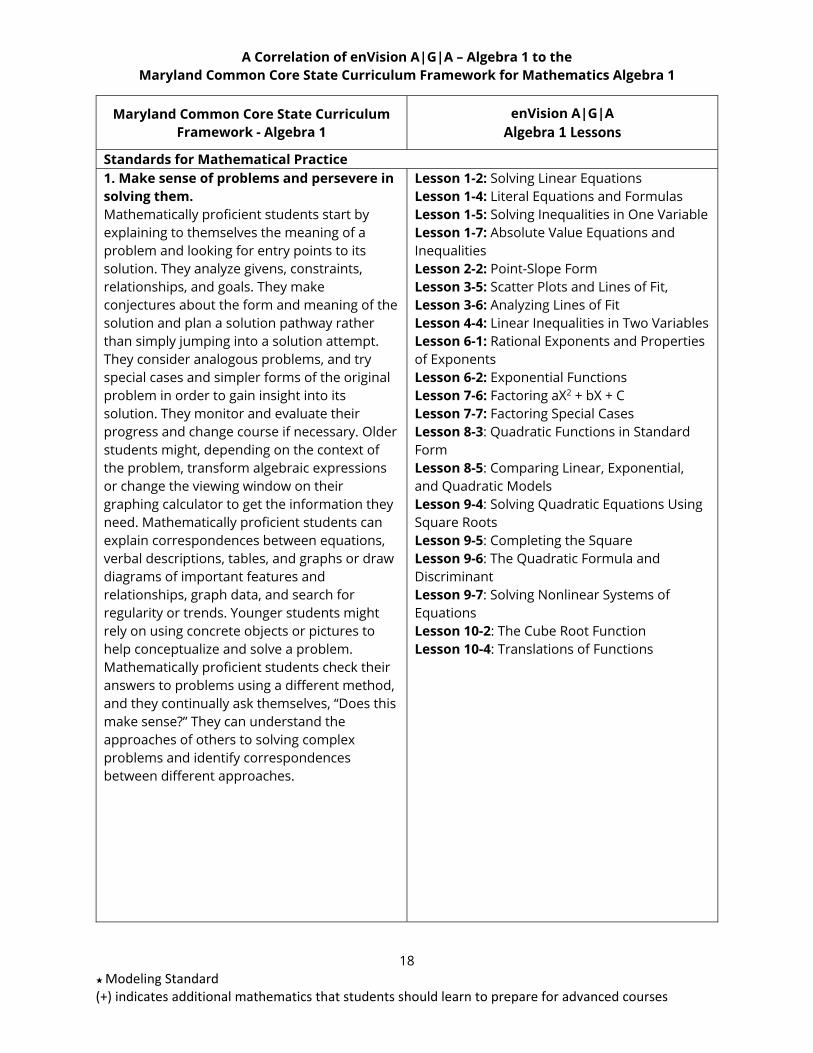
Standards for Mathematical Practice 1. Make sense of problems and persevere in solving them. Mathematically proficient students start by explaining to themselves the meaning of a problem and looking for entry points to its solution. They analyze givens, constraints, relationships, and goals. They make conjectures about the form and meaning of the solution and plan a solution pathway rather than simply jumping into a solution attempt. They consider analogous problems, and try special cases and simpler forms of the original problem in order to gain insight into its solution. They monitor and evaluate their progress and change course if necessary. Older students might, depending on the context of the problem, transform algebraic expressions or change the viewing window on their graphing calculator to get the information they need. Mathematically proficient students can explain correspondences between equations, verbal descriptions, tables, and graphs or draw diagrams of important features and relationships, graph data, and search for regularity or trends. Younger students might rely on using concrete objects or pictures to help conceptualize and solve a problem. Mathematically proficient students check their answers to problems using a different method, and they continually ask themselves, “Does this make sense?” They can understand the approaches of others to solving complex problems and identify correspondences between different approaches.
Lesson 1-2: Solving Linear Equations Lesson 1-4: Literal Equations and Formulas Lesson 1-5: Solving Inequalities in One Variable Lesson 1-7: Absolute Value Equations and Inequalities Lesson 2-2: Point-Slope Form Lesson 3-5: Scatter Plots and Lines of Fit, Lesson 3-6: Analyzing Lines of Fit Lesson 4-4: Linear Inequalities in Two Variables Lesson 6-1: Rational Exponents and Properties of Exponents Lesson 6-2: Exponential Functions Lesson 7-6: Factoring aX2 + bX + C Lesson 7-7: Factoring Special Cases Lesson 8-3: Quadratic Functions in Standard Form Lesson 8-5: Comparing Linear, Exponential, and Quadratic Models Lesson 9-4: Solving Quadratic Equations Using Square Roots Lesson 9-5: Completing the Square Lesson 9-6: The Quadratic Formula and Discriminant Lesson 9-7: Solving Nonlinear Systems of Equations Lesson 10-2: The Cube Root Function Lesson 10-4: Translations of Functions

A Correlation of enVision A|G|A – Algebra 1 to the Maryland Common Core State Curriculum Framework for Mathematics Algebra 1
19 ★ Modeling Standard (+) indicates additional mathematics that students should learn to prepare for advanced courses
Maryland Common Core State Curriculum Framework - Algebra 1
enVision A|G|A Algebra 1 Lessons
2. Reason abstractly and quantitatively. Mathematically proficient students make sense of quantities and their relationships in problem situations. They bring two complementary abilities to bear on problems involving quantitative relationships: the ability to decontextualize—to abstract a given situation and represent it symbolically and manipulate the representing symbols as if they have a life of their own, without necessarily attending to their referents—and the ability to contextualize, to pause as needed during the manipulation process in order to probe into the referents for the symbols involved. Quantitative reasoning entails habits of creating a coherent representation of the problem at hand; considering the units involved; attending to the meaning of quantities, not just how to compute them; and knowing and flexibly using different properties of operations and objects.
Lesson 1-1: Operations on Real Numbers Lesson 1-3: Solving Equations with A Variable on Both Side Lesson 2-3: Standard Form Lesson 2-4: Parallel and Perpendicular Lines Lesson 3-4: Arithmetic Sequences Lesson 3-5: Scatter Plots and Lines of Fit Lesson 4-1: Solving Systems of Equations by Graphing Lesson 4-2: Solving Systems of Equations by Substitution Lesson 4-3: Solving Systems of Equations by Elimination Lesson 5-1: The Absolute Value Function Lesson 5-2: Piecewise-Defined Functions Lesson 5-3: Step Functions Lesson 6-5: Transformations of Exponential Functions Lesson 7-1: Adding and Subtracting Polynomials Lesson 7-4: Factoring Polynomials Lesson 7-5: Factoring X2 + bX + C Lesson 7-6: Factoring aX2 + bX + C Lesson 7-7: Factoring Special Cases Lesson 8-1: Key Features of Graphs of Quadratic Functions Lesson 8-5: Comparing Linear, Exponential, and Quadratic Models Lesson 9-1: Solving Quadratic Equations Using Graphs and Tables Lesson 9-2: Solving Quadratic Equations by Factoring Lesson 9-3: Rewriting Radical Expressions Lesson 9-4: Solving Quadratic Equations Using Square Roots Lesson 9-5: Completing the Square Lesson 10-3: Analyzing Functions Graphically Lesson 10-5: Compressions and Stretches of Functions Lesson 11-2: Comparing Data Sets Lesson 11-3: Interpreting the Shapes of Data Displays Lesson 11-4: Standard Deviation Lesson 11-5: Two-Way Frequency Tables

A Correlation of enVision A|G|A – Algebra 1 to the Maryland Common Core State Curriculum Framework for Mathematics Algebra 1
20 ★ Modeling Standard (+) indicates additional mathematics that students should learn to prepare for advanced courses
Maryland Common Core State Curriculum Framework - Algebra 1
enVision A|G|A Algebra 1 Lessons
3. Construct viable arguments and critique the reasoning of others. Mathematically proficient students understand and use stated assumptions, definitions, and previously established results in constructing arguments. They make conjectures and build a logical progression of statements to explore the truth of their conjectures. They are able to analyze situations by breaking them into cases, and can recognize and use counterexamples. They justify their conclusions, communicate them to others, and respond to the arguments of others. They reason inductively about data, making plausible arguments that take into account the context from which the data arose. Mathematically proficient students are also able to compare the effectiveness of two plausible arguments, distinguish correct logic or reasoning from that which is flawed, and—if there is a flaw in an argument—explain what it is. Elementary students can construct arguments using concrete referents such as objects, drawings, diagrams, and actions. Such arguments can make sense and be correct, even though they are not generalized or made formal until later grades. Later, students learn to determine domains to which an argument applies. Students at all grades can listen or read the arguments of others, decide whether they make sense, and ask useful questions to clarify or improve the arguments.
Lesson 1-1: Operations on Real Numbers Lesson 1-3: Solving Equations with A Variable on Both Sides Lesson 1-4: Literal Equations and Formulas Lesson 1-5: Solving Inequalities in One Variable Lesson 2-1: Slope-Intercept Form Lesson 2-2: Point-Slope Form Lesson 2-3: Standard Form Lesson 3-1: Relations and Functions Lesson 3-2: Linear Functions Lesson 3-5: Scatter Plots and Lines of Fit Lesson 3-6: Analyzing Lines of Fit Lesson 4-3: Solving Systems of Equations by Elimination Lesson 6-1: Rational Exponents and Properties of Exponents Lesson 6-2: Exponential Functions Lesson 6-3: Exponential Growth and Decay Lesson 6-4: Geometric Sequences Lesson 6-5: Transformations of Exponential Functions Lesson 7-1: Adding and Subtracting Polynomials Lesson 7-2: Multiplying Polynomials Lesson 7-3: Multiplying Special Cases Lesson 7-6: Factoring aX2 + bX + C Lesson 8-1: Key Features of Graphs of Quadratic Functions Lesson 8-3: Quadratic Functions in Standard Form Lesson 9-1: Solving Quadratic Equations Using Graphs and Tables Lesson 9-2: Solving Quadratic Equations by Factoring Lesson 9-3: Rewriting Radical Expressions Lesson 10-2: The Cube Root Function Lesson 10-3: Analyzing Functions Graphically Lesson 10-5: Compressions and Stretches of Functions Lesson 10-6: Operations with Functions Lesson 10-7: Inverse Functions Lesson 11-5: Two-Way Frequency Tables

A Correlation of enVision A|G|A – Algebra 1 to the Maryland Common Core State Curriculum Framework for Mathematics Algebra 1
21 ★ Modeling Standard (+) indicates additional mathematics that students should learn to prepare for advanced courses
Maryland Common Core State Curriculum Framework - Algebra 1
enVision A|G|A Algebra 1 Lessons
4. Model with mathematics. Mathematically proficient students can apply the mathematics they know to solve problems arising in everyday life, society, and the workplace. In early grades, this might be as simple as writing an addition equation to describe a situation. In middle grades, a student might apply proportional reasoning to plan a school event or analyze a problem in the community. By high school, a student might use geometry to solve a design problem or use a function to describe how one quantity of interest depends on another. Mathematically proficient students who can apply what they know are comfortable making assumptions and approximations to simplify a complicated situation, realizing that these may need revision later. They are able to identify important quantities in a practical situation and map their relationships using such tools as diagrams, two-way tables, graphs, flowcharts and formulas. They can analyze those relationships mathematically to draw conclusions. They routinely interpret their mathematical results in the context of the situation and reflect on whether the results make sense, possibly improving the model if it has not served its purpose.
Lesson 1-4: Literal Equations and Formulas Lesson 1-7: Absolute Value Equations and Inequalities Lesson 2-1: Slope-Intercept Form Lesson 2-3: Standard Form Lesson 3-2: Linear Functions Lesson 4-3: Solving Systems of Equations by Elimination Lesson 4-5: Systems of Linear Inequalities Lesson 5-1: The Absolute Value Function Lesson 5-4: Transformations of Piecewise-Defined Functions Lesson 8-2: Quadratic Functions in Vertex Form Lesson 8-4: Modeling with Quadratic Functions Lesson 11-1: Analyzing Data Displays

A Correlation of enVision A|G|A – Algebra 1 to the Maryland Common Core State Curriculum Framework for Mathematics Algebra 1
22 ★ Modeling Standard (+) indicates additional mathematics that students should learn to prepare for advanced courses
Maryland Common Core State Curriculum Framework - Algebra 1
enVision A|G|A Algebra 1 Lessons
5. Use appropriate tools strategically. Mathematically proficient students consider the available tools when solving a mathematical problem. These tools might include pencil and paper, concrete models, a ruler, a protractor, a calculator, a spreadsheet, a computer algebra system, a statistical package, or dynamic geometry software. Proficient students are sufficiently familiar with tools appropriate for their grade or course to make sound decisions about when each of these tools might be helpful, recognizing both the insight to be gained and their limitations. For example, mathematically proficient high school students analyze graphs of functions and solutions generated using a graphing calculator. They detect possible errors by strategically using estimation and other mathematical knowledge. When making mathematical models, they know that technology can enable them to visualize the results of varying assumptions, explore consequences, and compare predictions with data. Mathematically proficient students at various grade levels are able to identify relevant external mathematical resources, such as digital content located on a website, and use them to pose or solve problems. They are able to use technological tools to explore and deepen their understanding of concepts.
Lesson 1-1: Operations on Real Numbers Lesson 3-3: Transforming Linear Functions Lesson 10-1: The Square Root Function Lesson 11-1: Analyzing Data Displays Lesson 11-2: Comparing Data Sets

A Correlation of enVision A|G|A – Algebra 1 to the Maryland Common Core State Curriculum Framework for Mathematics Algebra 1
23 ★ Modeling Standard (+) indicates additional mathematics that students should learn to prepare for advanced courses
Maryland Common Core State Curriculum Framework - Algebra 1
enVision A|G|A Algebra 1 Lessons
6. Attend to precision. Mathematically proficient students try to communicate precisely to others. They try to use clear definitions in discussion with others and in their own reasoning. They state the meaning of the symbols they choose, including using the equal sign consistently and appropriately. They are careful about specifying units of measure, and labeling axes to clarify the correspondence with quantities in a problem. They calculate accurately and efficiently, express numerical answers with a degree of precision appropriate for the problem context. In the elementary grades, students give carefully formulated explanations to each other. By the time they reach high school they have learned to examine claims and make explicit use of definitions.
Lesson 2-3: Standard Form Lesson 3-4: Arithmetic Sequences Lesson 5-2: Piecewise-Defined Functions Lesson 5-3: Step Functions Lesson 8-2: Quadratic Functions in Vertex Form Lesson 9-6: The Quadratic Formula and Discriminant Lesson 10-5: Compressions and Stretches of Functions Lesson 10-6: Operations with Functions Lesson 10-7: Inverse Functions
7. Look for and make use of structure. Mathematically proficient students look closely to discern a pattern or structure. Young students, for example, might notice that three and seven more is the same amount as seven and three more, or they may sort a collection of shapes according to how many sides the shapes have. Later, students will see 7 × 8 equals the well remembered 7 × 5+ 7 × 3, in preparation for learning about the distributive property. In the expression x2+ 9x + 14, older students can see the 14 as 2 × 7 and the 9 as 2 + 7. They recognize the significance of an existing line in a geometric figure and can use the strategy of drawing an auxiliary line for solving problems. They also can step back for an overview and shift perspective. They can see complicated things, such as some algebraic expressions, as single objects or as being composed of several objects. For example, they can see 5−3(x−y)2 as 5 minus a positive number times a square and use that to realize that its value cannot be more than 5 for any real numbers x and y.
Lesson 1-3: Solving Equations with A Variable on Both Sides Lesson 1-5: Solving Inequalities in One Variable Lesson 1-6: Compound Inequalities Lesson 1-7: Absolute Value Equations and Inequalities Lesson 2-1: Slope-Intercept Form Lesson 2-4: Parallel and Perpendicular Lines Lesson 3-1: Relations and Functions Lesson 3-2: Linear Functions Lesson 3-3: Transforming Linear Functions Lesson 3-4: Arithmetic Sequences Lesson 3-6: Analyzing Lines of Fit Lesson 4-1: Solving Systems of Equations by Graphing Lesson 4-4: Linear Inequalities in Two Variables Lesson 4-5: Systems of Linear Inequalities Lesson 5-1: The Absolute Value Function Lesson 5-2: Piecewise-Defined Functions Lesson 5-3: Step Functions Lesson 5-4: Transformations of Piecewise-Defined Functions Lesson 6-3: Exponential Growth and Decay Lesson 6-4: Geometric Sequences

A Correlation of enVision A|G|A – Algebra 1 to the Maryland Common Core State Curriculum Framework for Mathematics Algebra 1
24 ★ Modeling Standard (+) indicates additional mathematics that students should learn to prepare for advanced courses
Maryland Common Core State Curriculum Framework - Algebra 1
enVision A|G|A Algebra 1 Lessons
Continued 7. Look for and make use of structure.
Lesson 6-5: Transformations of Exponential Functions Lesson 7-1: Adding and Subtracting Polynomials Lesson 7-2: Multiplying Polynomials Lesson 7-3: Multiplying Special Cases Lesson 7-4: Factoring Polynomials Lesson 7-5: Factoring X2 + bX + C Lesson 7-6: Factoring aX2 + bX + C Lesson 7-7: Factoring Special Cases Lesson 8-1: Key Features of Graphs of Quadratic Functions Lesson 8-2: Quadratic Functions in Vertex Form Lesson 8-3: Quadratic Functions in Standard Form Lesson 8-5: Comparing Linear, Exponential, and Quadratic Models Lesson 9-1: Solving Quadratic Equations Using Graphs and Tables Lesson 9-2: Solving Quadratic Equations by Factoring Lesson 9-3: Rewriting Radical Expressions Lesson 9-4: Solving Quadratic Equations Using Square Roots Lesson 9-5: Completing the Square Lesson 9-7: Solving Nonlinear Systems of Equations Lesson 10-1: The Square Root Function Lesson 10-3: Analyzing Functions Graphically Lesson 10-4: Translations of Functions Lesson 10-6: Operations with Functions Lesson 10-7: Inverse Functions Lesson 11-1: Analyzing Data Displays Lesson 11-3: Interpreting the Shapes of Data Displays Lesson 11-5: Two-Way Frequency Tables

A Correlation of enVision A|G|A – Algebra 1 to the Maryland Common Core State Curriculum Framework for Mathematics Algebra 1
25 ★ Modeling Standard (+) indicates additional mathematics that students should learn to prepare for advanced courses
Maryland Common Core State Curriculum Framework - Algebra 1
enVision A|G|A Algebra 1 Lessons
8. Look for and express regularity in repeated reasoning. Mathematically proficient students notice if calculations are repeated, and look both for general methods and for shortcuts. Upper elementary students might notice when dividing 25 by 11 that they are repeating the same calculations over and over again, and conclude they have a repeating decimal. By paying attention to the calculation of slope as they repeatedly check whether points are on the line through (1, 2) with slope 3, middle school students might abstract the equation (y – 2)/(x – 1) = 3. Noticing the regularity in the way terms cancel when expanding (x – 1)(x + 1), (x – 1)(x2+x+1)and (x – 1)(x3+x2+x=1)might lead them to the general formula for the sum of a geometric series. As they work to solve a problem, mathematically proficient students maintain oversight of the process, while attending to the details. They continually evaluate the reasonableness of their intermediate results.
Lesson 1-6: Compound Inequalities Lesson 3-1: Relations and Functions Lesson 3-3: Transforming Linear Functions Lesson 3-4: Arithmetic Sequences Lesson 5-4: Transformations of Piecewise-Defined Functions Lesson 6-1: Rational Exponents and Properties of Exponents Lesson 6-2: Exponential Functions Lesson 6-3: Exponential Growth and Decay, Lesson 6-4: Geometric Sequences Lesson 7-3: Multiplying Special Cases Lesson 7-4: Factoring Polynomials Lesson 8-4: Modeling with Quadratic Functions Lesson 10-4: Translations of Functions Lesson 11-2: Comparing Data Sets Lesson 11-3: Interpreting the Shapes of Data Displays Lesson 11-4: Standard Deviation
Unit 1: Relationships between Quantities and Reasoning with Equations Reason quantitatively and use units to solve problems. N.Q.1 Use units as a way to understand problems and to guide the solution of multi-step problems; choose and interpret units consistently in formulas; choose and interpret the scale and the origin in graphs and data displays. ★
Lesson 1-4: Literal Equations and Formulas
N.Q.2 Define appropriate quantities for the purpose of descriptive modeling. ★
Lesson 1-3: Solving Equations with A Variable on Both Sides

A Correlation of enVision A|G|A – Algebra 1 to the Maryland Common Core State Curriculum Framework for Mathematics Algebra 1
26 ★ Modeling Standard (+) indicates additional mathematics that students should learn to prepare for advanced courses
Maryland Common Core State Curriculum Framework - Algebra 1
enVision A|G|A Algebra 1 Lessons
N.Q.3 Choose a level of accuracy appropriate to limitations on measurement when reporting quantities.★
This standard is addressed throughout the text. See, for example: Lesson 1-3: Solving Equations with A Variable on Both Sides, Lesson 1-5: Solving Inequalities in One Variable, Lesson 3-4: Arithmetic Sequences, Lesson 4-1: Solving Systems of Equations by Graphing, Lesson 6-4: Geometric Sequences, Lesson 6-5: Transformations of Exponential Functions, Lesson 7-1: Adding and Subtracting Polynomials, Lesson 7-2: Multiplying Polynomials, Lesson 7-3: Multiplying Special Cases, Lesson 9-1: Solving Quadratic Equations Using Graphs and Tables, Lesson 9-2: Solving Quadratic Equations by Factoring, Lesson 9-4: Solving Quadratic Equations Using Square Roots, Lesson 9-7: Solving Nonlinear Systems of Equations
Interpret the structure of expressions. (Cluster Note: Limit to linear expressions and to exponential expressions with integer exponents.) A.SSE.1 Interpret expressions that represent a quantity in terms of its context. ★
Lesson 7-5: Factoring X2 + bX + C, Lesson 7-6: Factoring aX2 + bX + C, Lesson 7-7: Factoring Special Cases
a. Interpret parts of an expression, such as terms, factors, and coefficients.
Lesson 7-5: Factoring X2 + bX + C, Lesson 7-6: Factoring aX2 + bX + C, Lesson 7-7: Factoring Special Cases
b. Interpret complicated expressions by viewing one or more of their parts as a single entity. For example, interpret P(1+r)n as the product of P and a factor not depending on P.
Lesson 6-3: Exponential Growth and Decay, Lesson 7-5: Factoring X2 + bX + C, Lesson 7-6: Factoring aX2 + bX + C, Lesson 7-7: Factoring Special Cases

A Correlation of enVision A|G|A – Algebra 1 to the Maryland Common Core State Curriculum Framework for Mathematics Algebra 1
27 ★ Modeling Standard (+) indicates additional mathematics that students should learn to prepare for advanced courses
Maryland Common Core State Curriculum Framework - Algebra 1
enVision A|G|A Algebra 1 Lessons
Create equations that describe numbers or relationships. A.CED.1 Create equations and inequalities in one variable and use them to solve problems. (Include equations arising from linear and quadratic functions, and simple rational and exponential functions.)
Lesson 1-2: Solving Linear Equations, Lesson 1-3: Solving Equations with A Variable on Both Sides, Lesson 1-4: Literal Equations and Formulas, Lesson 1-5: Solving Inequalities in One Variable, Lesson 1-6: Compound Inequalities, Lesson 1-7: Absolute Value Equations and Inequalities, Lesson 9-1: Solving Quadratic Equations Using Graphs and Tables, Lesson 9-2: Solving Quadratic Equations by Factoring, Lesson 9-4: Solving Quadratic Equations Using Square Roots, Lesson 9-6: The Quadratic Formula and Discriminant
A.CED.2 Create equations in two or more variables to represent relationships between quantities; graph equations on coordinate axes with labels and scales. Note: Limit to linear and exponential equations, and, in the case of exponential equations, limit to situations requiring evaluation of exponential functions at integer inputs.
Lesson 2-1: Slope-Intercept Form, Lesson 2-2: Point-Slope Form, Lesson 2-3: Standard Form, Lesson 2-4: Parallel and Perpendicular Lines, Lesson 6-3: Exponential Growth and Decay, Lesson 8-1: Key Features of Graphs of Quadratic Functions
A.CED.3 Represent constraints by equations or inequalities, and by systems of equations and/or inequalities, and interpret solutions as viable or non-viable options in a modeling context. For example, represent inequalities describing nutritional and cost constraints on combinations of different foods. Note: Limit to linear equations and inequalities.
Lesson 1-5: Solving Inequalities in One Variable, Lesson 1-6: Compound Inequalities, Lesson 2-3: Standard Form, Lesson 4-1: Solving Systems of Equations by Graphing, Lesson 4-3: Solving Systems of Equations by Elimination, Lesson 4-4: Linear Inequalities in Two Variables, Lesson 4-5: Systems of Linear Inequalities
A.CED.4 Rearrange formulas to highlight a quantity of interest, using the same reasoning as in solving equations. For example, rearrange Ohm’s law V = IR to highlight resistance R. Note: Limit to formulas which are linear in the variable of interest.
Lesson 1-4: Literal Equations and Formulas

A Correlation of enVision A|G|A – Algebra 1 to the Maryland Common Core State Curriculum Framework for Mathematics Algebra 1
28 ★ Modeling Standard (+) indicates additional mathematics that students should learn to prepare for advanced courses
Maryland Common Core State Curriculum Framework - Algebra 1
enVision A|G|A Algebra 1 Lessons
Understand solving equations as a process of reasoning and explain the reasoning. A.REI.1 Explain each step in solving a simple equation as following from the equality of numbers asserted at the previous step, starting from the assumption that the original equation has a solution. Construct a viable argument to justify a solution method. Note: Students should focus on and master A.REI.1 for linear equations and be able to extend and apply their reasoning to other types of equations in future courses.
Lesson 1-2: Solving Linear Equations, Lesson 1-3: Solving Equations with A Variable on Both Sides
Solve equations and inequalities in one variable. A.REI.3 Solve linear equations and inequalities in one variable, including equations with coefficients represented by letters. Note: Extend earlier work with solving linear equations to solving linear inequalities in one variable and to solving literal equations that are linear in the variable being solved for. Include simple exponential equations that rely only on application of the laws of exponents, such as 5x=125 or 2x=1/16.
Lesson 1-2: Solving Linear Equations, Lesson 1-3: Solving Equations with A Variable on Both Sides, Lesson 1-5: Solving Inequalities in One Variable, Lesson 1-6: Compound Inequalities, Lesson 4-4: Linear Inequalities in Two Variables
Unit 2: Linear and Exponential Relationships Solve systems of equations. A.REI.5 Prove that, given a system of two equations in two variables, replacing one equation by the sum of that equation and a multiple of the other produces a system with the same solutions. Note: Build on student experiences with graphing and solving systems of linear equations from middle school to focus on justification of the methods used. Include cases where the two equations describe the same line (yielding infinitely many solutions) and cases where two equations describe parallel lines (yielding no solution); connect to GPE.5 when it is taught in Geometry, which requires students to prove the slope criteria for parallel lines.
Lesson 4-3: Solving Systems of Equations by Elimination

A Correlation of enVision A|G|A – Algebra 1 to the Maryland Common Core State Curriculum Framework for Mathematics Algebra 1
29 ★ Modeling Standard (+) indicates additional mathematics that students should learn to prepare for advanced courses
Maryland Common Core State Curriculum Framework - Algebra 1
enVision A|G|A Algebra 1 Lessons
A.REI.6 Solve systems of linear equations exactly and approximately (e.g., with graphs), focusing on pairs of linear equations in two variables.
Lesson 4-1: Solving Systems of Equations by Graphing, Lesson 4-2: Solving Systems of Equations by Substitution
Represent and solve equations and inequalities graphically. A.REI.10 Understand that the graph of an equation in two variables is the set of all its solutions plotted in the coordinate plane, often forming a curve (which could be a line). Note: Focus on linear and exponential equations and be able to adapt and apply that learning to other types of equations in future courses.
Lesson 3-3: Transforming Linear Functions, Lesson 6-5: Transformations of Exponential Functions
A.REI.11 Explain why the x-coordinates of the points where the graphs of the equations y = f(x) and y = g(x) intersect are the solutions of the equation f(x) = g(x); find the solutions approximately, e.g., using technology to graph the functions, make tables of values, or find successive approximations. Include cases where f(x) and/or g(x) are linear, polynomial, rational, absolute value, exponential, and logarithmic functions. ★ Note: Focus on cases where f(x) and g(x) are linear or exponential.
Lesson 9-1: Solving Quadratic Equations Using Graphs and Tables, Lesson 9-7: Solving Nonlinear Systems of Equations
A.REI.12 Graph the solutions to a linear inequality in two variables as a half-plane (excluding the boundary in the case of a strict inequality), and graph the solution set to a system of linear inequalities in two variables as the intersection of the corresponding half-planes.
Lesson 4-4: Linear Inequalities in Two Variables, Lesson 4-5: Systems of Linear Inequalities

A Correlation of enVision A|G|A – Algebra 1 to the Maryland Common Core State Curriculum Framework for Mathematics Algebra 1
30 ★ Modeling Standard (+) indicates additional mathematics that students should learn to prepare for advanced courses
Maryland Common Core State Curriculum Framework - Algebra 1
enVision A|G|A Algebra 1 Lessons
Understand the concept of a function and use function notation. F.IF.1 Understand that a function from one set (called the domain) to another set (called the range) assigns to each element of the domain exactly one element of the range. If f is a function and x is an element of its domain, then f(x) denotes the output of f corresponding to the input x. The graph of f is the graph of the equation y = f(x). Note: Students should experience a variety of types of situations modeled by functions. Detailed analysis of any particular class of functions at this stage is not advised. Students should apply these concepts throughout their future mathematics courses. Draw examples from linear and exponential functions.
Lesson 3-1: Relations and Functions, Lesson 3-2: Linear Functions
F.IF.2 Use function notation, evaluate functions for inputs in their domains, and interpret statements that use function notation in terms of a context.
Lesson 3-2: Linear Functions, Lesson 8-4: Modeling with Quadratic Functions
F.IF.3 Recognize that sequences are functions, sometimes defined recursively, whose domain is a subset of the integers. For example, the Fibonacci sequence is defined recursively by f(0) = f(1) = 1, f(n+1) = f(n) + f(n-1) for n ≥ 1. Note: Draw connection to F.BF.2, which requires students to write arithmetic and geometric sequences. Emphasize arithmetic and geometric sequences as examples of linear and exponential functions.
Lesson 3-4: Arithmetic Sequences, Lesson 6-4: Geometric Sequences
Interpret functions that arise in applications in terms of a context. F.IF.4 For a function that models a relationship between two quantities, interpret key features of the graph and the table in terms of the quantities, and sketch the graph showing key features given a verbal description of the relationship. Key features include: intercepts; intervals where the function is increasing, decreasing, positive, or negative; relative maximums and minimums; symmetries; end behavior; and periodicity. ★ Note: Focus on linear and exponential functions.
Lesson 5-1: The Absolute Value Function, Lesson 5-2: Piecewise-Defined Functions, Lesson 5-3: Step Functions, Lesson 6-2: Exponential Functions, Lesson 6-5: Transformations of Exponential Functions, Lesson 8-3: Quadratic Functions in Standard Form, Lesson 10-1: The Square Root Function, Lesson 10-2: The Cube Root Function, Lesson 10-3: Analyzing Functions Graphically, Lesson 10-4: Translations of Functions

A Correlation of enVision A|G|A – Algebra 1 to the Maryland Common Core State Curriculum Framework for Mathematics Algebra 1
31 ★ Modeling Standard (+) indicates additional mathematics that students should learn to prepare for advanced courses
Maryland Common Core State Curriculum Framework - Algebra 1
enVision A|G|A Algebra 1 Lessons
F.IF.5 Relate the domain of a function to its graph and, where applicable, to the quantitative relationship it describes. For example, if the function h(n) gives the number of person-hours it takes to assemble n engines in a factory, then the positive integers would be an appropriate domain for the function. ★ Note: Focus on linear and exponential functions.
Lesson 3-2: Linear Functions, Lesson 3-3: Transforming Linear Functions, Lesson 6-2: Exponential Functions, Lesson 10-3: Analyzing Functions Graphically
F.IF.6 Calculate and interpret the average rate of change of a function (presented symbolically or as a table) over a specified interval. Estimate the rate of change from a graph. ★ Note: Focus on linear functions and exponential functions whose domain is a subset of the integers. Unit 5 in this course and the Algebra II course address other types of functions.
Lesson 5-1: The Absolute Value Function, Lesson 5-2: Piecewise-Defined Functions, Lesson 5-3: Step Functions, Lesson 6-2: Exponential Functions, Lesson 8-1: Key Features of Graphs of Quadratic Functions, Lesson 10-1: The Square Root Function, Lesson 10-2: The Cube Root Function, Lesson 10-4: Translations of Functions
Analyze functions using different representations. Cluster Note: For F.IF.7a, and 9 focus on linear and exponentials functions. Include comparisons of two functions presented algebraically. For example, compare the growth of two linear functions, or two exponential functions such as an y=3n and y=100n F.IF.7 Graph functions expressed symbolically and show key features of the graph, by hand in simple cases and using technology for more complicated cases. ★
Lesson 3-3: Transforming Linear Functions, Lesson 8-2: Quadratic Functions in Vertex Form
a. Graph linear and quadratic functions and show intercepts, maxima, and minima.
Lesson 8-3: Quadratic Functions in Standard Form
F.IF.9 Compare properties of two functions each represented in a different way (algebraically, graphically, numerically in tables, or by verbal descriptions).
Lesson 5-4: Transformations of Piecewise-Defined Functions, Lesson 6-5: Transformations of Exponential Functions, Lesson 8-3: Quadratic Functions in Standard Form

A Correlation of enVision A|G|A – Algebra 1 to the Maryland Common Core State Curriculum Framework for Mathematics Algebra 1
32 ★ Modeling Standard (+) indicates additional mathematics that students should learn to prepare for advanced courses
Maryland Common Core State Curriculum Framework - Algebra 1
enVision A|G|A Algebra 1 Lessons
Build a function that models a relationship between two quantities. Cluster Note: Limit F.BF.1a to linear and exponential functions F.BF.1 Write a function that describes a relationship between two quantities. ★
Lesson 3-3: Transforming Linear Functions, Lesson 3-4: Arithmetic Sequences
a. Determine an explicit expression, a recursive process, or steps for calculation from a context.
Lesson 3-4: Arithmetic Sequences
Build new functions from existing functions. F.BF.3 Identify the effect on the graph of replacing f(x) by f(x) + k, k f(x), f(kx), and f(x + k) for specific values of k (both positive and negative); find the value of k given the graphs. Experiment with cases and illustrate an explanation of the effects on the graph using technology. Note: Focus on vertical translations of graphs of linear and exponential functions. Relate the vertical translation of a linear function to its y-intercept. While applying other transformations to a linear graph is appropriate at this level, it may be difficult for students to identify or distinguish between the effects of the other transformations included in this standard.
Lesson 3-3: Transforming Linear Functions, Lesson 5-4: Transformations of Piecewise-Defined Functions, Lesson 6-5: Transformations of Exponential Functions, Lesson 8-1: Key Features of Graphs of Quadratic Functions, Lesson 8-2: Quadratic Functions in Vertex Form, Lesson 10-5: Compressions and Stretches of Functions
Construct and compare linear, quadratic, and exponential models and solve problems. F.LE.1 Distinguish between situations that can be modeled with linear functions and with exponential functions.
Lesson 6-2: Exponential Functions, Lesson 6-3: Exponential Growth and Decay
a. Prove that linear functions grow by equal differences over equal intervals; and that exponential functions grow by equal factors over equal intervals.
Lesson 3-2: Linear Functions, Lesson 8-5: Comparing Linear, Exponential, and Quadratic Models
b. Recognize situations in which one quantity changes at a constant rate per unit interval relative to another.
Lesson 3-2: Linear Functions
c. Recognize situations in which a quantity grows or decays by a constant percent rate per unit interval relative to another.
Lesson 6-3: Exponential Growth and Decay

A Correlation of enVision A|G|A – Algebra 1 to the Maryland Common Core State Curriculum Framework for Mathematics Algebra 1
33 ★ Modeling Standard (+) indicates additional mathematics that students should learn to prepare for advanced courses
Maryland Common Core State Curriculum Framework - Algebra 1
enVision A|G|A Algebra 1 Lessons
F.LE.2 Construct linear and exponential functions, including arithmetic and geometric sequences, given a graph, a description of a relationship, or two input-output pairs (include reading these from a table). Note: In constructing linear functions draw on and consolidate previous work on finding equations for lines and linear functions (8.EE.6, 8.F).
Lesson 3-2: Linear Functions, Lesson 3-4: Arithmetic Sequences, Lesson 6-3: Exponential Growth and Decay, Lesson 6-4: Geometric Sequences
F.LE.3 Observe using graphs and tables that a quantity increasing exponentially eventually exceeds a quantity increasing linearly, quadratically, or (more generally) as a polynomial function. Note: Limit to comparisons between linear and exponential models.
Lesson 8-5: Comparing Linear, Exponential, and Quadratic Models
Interpret expressions for functions in terms of the situation they model. F.LE.5 Interpret the parameters in a linear or exponential function in terms of a context. Note: Limit exponential functions to those of the form f(x) = bx + k.
Lesson 3-2: Linear Functions, Lesson 6-2: Exponential Functions, Lesson 8-5: Comparing Linear, Exponential, and Quadratic Models
Unit 3: Descriptive Statistics Summarize, represent, and interpret data on a single count or measurement variable. Cluster Note: In grades 6 – 8, students describe center and spread in a data distribution. Here they choose a summary statistic appropriate to the characteristics of the data distribution, such as the shape of the distribution or the existence of extreme data points. S.ID.1 Represent data with plots on the real number line (dot plots, histograms, and box plots).
Lesson 11-1: Analyzing Data Displays, Lesson 11-2: Comparing Data Sets
S.ID.2 Use statistics appropriate to the shape of the data distribution to compare center (median, mean) and spread (interquartile range, standard deviation) of two or more different data sets.
Lesson 11-1: Analyzing Data Displays, Lesson 11-2: Comparing Data Sets, Lesson 11-3: Interpreting the Shapes of Data Displays, Lesson 11-4: Standard Deviation

A Correlation of enVision A|G|A – Algebra 1 to the Maryland Common Core State Curriculum Framework for Mathematics Algebra 1
34 ★ Modeling Standard (+) indicates additional mathematics that students should learn to prepare for advanced courses
Maryland Common Core State Curriculum Framework - Algebra 1
enVision A|G|A Algebra 1 Lessons
S.ID.3 Interpret differences in shape, center, and spread in the context of the data sets, accounting for possible effects of extreme data points (outliers).
Lesson 11-1: Analyzing Data Displays, Lesson 11-2: Comparing Data Sets, Lesson 11-3: Interpreting the Shapes of Data Displays, Lesson 11-4: Standard Deviation
Summarize, represent, and interpret data on two categorical and quantitative variables. S.ID.5 Summarize categorical data for two categories in two-way frequency tables. Interpret relative frequencies in the context of the data (including joint, marginal, and conditional relative frequencies). Recognize possible associations and trends in the data.
Lesson 11-5: Two-Way Frequency Tables
S.ID.6 represent data on two quantitative variables on a scatter-plot, and describe how the variables are related.
Lesson 3-5: Scatter Plots and Lines of Fit, Lesson 3-6: Analyzing Lines of Fit
a. Fit a function to the data; use functions fitted to data to solve problems in the context of the data. Use given functions or choose a function suggested by the context. Emphasize linear and exponential models. Note: S.ID.6.a.b. & c Students take a more sophisticated look at using a linear function to model the relationship between two numerical variables. In addition to fitting a line to data, students assess how well the model fits by analyzing residuals.
Lesson 3-5: Scatter Plots and Lines of Fit, Lesson 3-6: Analyzing Lines of Fit, Lesson 8-4: Modeling with Quadratic Functions, Lesson 8-5: Comparing Linear, Exponential, and Quadratic Models
b. Informally assess the fit of a function by plotting and analyzing residuals. Note: Focus on linear models, but may use this standard to preview quadratic functions in Unit 5 of this course
Lesson 3-6: Analyzing Lines of Fit, Lesson 8-4: Modeling with Quadratic Functions
c. Fit a linear function for a scatter plot that suggests a linear association
Lesson 3-5: Scatter Plots and Lines of Fit, Lesson 3-6: Analyzing Lines of Fit

A Correlation of enVision A|G|A – Algebra 1 to the Maryland Common Core State Curriculum Framework for Mathematics Algebra 1
35 ★ Modeling Standard (+) indicates additional mathematics that students should learn to prepare for advanced courses
Maryland Common Core State Curriculum Framework - Algebra 1
enVision A|G|A Algebra 1 Lessons
Interpret linear models. S.ID.7 Interpret the slope (rate of change) and the intercept (constant term) of a linear model in the context of the data.
Lesson 2-1: Slope-Intercept Form, Lesson 2-2: Point-Slope Form, Lesson 2-3: Standard Form, Lesson 3-5: Scatter Plots and Lines of Fit
S.ID.8 Compute (using technology) and interpret the correlation coefficient of a linear fit. Notes: Build on student experience with linear relationships in eighth grade and introduce the correlation coefficient. The focus here is on the computation and interpretation of the correlation coefficient as a measure of how well the data fit the relationship. The important distinction between a statistical relationship and a cause-and-effect relationship arises in S.ID.9.
Lesson 3-6: Analyzing Lines of Fit
S.ID.9 Distinguish between correlation and causation.
Lesson 3-6: Analyzing Lines of Fit
Unit 4: Expressions and Equations Extend the properties of exponents to rational exponents. N.RN.2 Rewrite expressions involving radicals and rational exponents using the properties of exponents.
Lesson 9-3: Rewriting Radical Expressions
Use properties of rational and irrational Numbers. N.RN.3 Explain why the sum or product of two rational numbers is rational; that the sum of a rational number and an irrational number is irrational; and that the product of a nonzero rational number and an irrational number is irrational. Note: Connect to physical situations, e.g., finding the perimeter of a square of area 2.
Lesson 1-1: Operations on Real Numbers

A Correlation of enVision A|G|A – Algebra 1 to the Maryland Common Core State Curriculum Framework for Mathematics Algebra 1
36 ★ Modeling Standard (+) indicates additional mathematics that students should learn to prepare for advanced courses
Maryland Common Core State Curriculum Framework - Algebra 1
enVision A|G|A Algebra 1 Lessons
Interpret the structure of expressions. Cluster Note: Focus on quadratic and exponential expressions. A.SSE.1 Interpret expressions that represent a quantity in terms of its context. ★
Lesson 7-5: Factoring X2 + bX + C, Lesson 7-6: Factoring aX2 + bX + C, Lesson 7-7: Factoring Special Cases
a. Interpret parts of an expression, such as terms, factors, and coefficients.
Lesson 7-5: Factoring X2 + bX + C, Lesson 7-6: Factoring aX2 + bX + C, Lesson 7-7: Factoring Special Cases
b. Interpret complicated expressions by viewing one or more of their parts as a single entity. For example, interpret P(1+r)n as the product of P and a factor not depending on P. Note: Exponents are extended from the integer exponents found in Unit 1 to rational exponents focusing on those that represent square or cube roots.
Lesson 6-3: Exponential Growth and Decay, Lesson 7-5: Factoring X2 + bX + C, Lesson 7-6: Factoring aX2 + bX + C, Lesson 7-7: Factoring Special Cases
A.SSE.2 Use the structure of an expression to identify ways to rewrite it. For example, see, 4x2−9y2 as (2x)2−(3y)2 thus recognizing it as a difference of squares that can be factored as (2x−3y)(2x+3y)
Lesson 7-4: Factoring Polynomials, Lesson 7-7: Factoring Special Cases, Lesson 9-4: Solving Quadratic Equations Using Square Roots
Write expressions in equivalent forms to solve problems. Cluster Note: It is important to balance conceptual understanding and procedural fluency in work with equivalent expressions. For example, development of skill in factoring and completing the square goes hand-in-hand with understanding what different forms of a quadratic expression reveal. A.SSE.3 Choose and produce an equivalent form of an expression to reveal and explain properties of the quantity represented by the expression. ★
Lesson 9-6: The Quadratic Formula and Discriminant
a. Factor a quadratic expression to reveal the zeros of the function it defines.
Lesson 9-2: Solving Quadratic Equations by Factoring
b. Complete the square in a quadratic expression to reveal the maximum or minimum value of the function it defines.
Lesson 9-4: Solving Quadratic Equations Using Square Roots, Lesson 9-5: Completing the Square

A Correlation of enVision A|G|A – Algebra 1 to the Maryland Common Core State Curriculum Framework for Mathematics Algebra 1
37 ★ Modeling Standard (+) indicates additional mathematics that students should learn to prepare for advanced courses
Maryland Common Core State Curriculum Framework - Algebra 1
enVision A|G|A Algebra 1 Lessons
c. Use the properties of exponents to transform expressions for exponential functions. For example the expression 1.15t can be rewritten as (1.151/12)12t ≈ 1.01212t to reveal the approximate equivalent monthly interest rate if the annual rate is 15%.
Lesson 6-3: Exponential Growth and Decay
Perform arithmetic operations on polynomials. A.APR.1 Understand that polynomials form a system analogous to the integers, namely, they are closed under the operations of addition, subtraction, and multiplication; add, subtract, and multiply polynomials.
Lesson 7-1: Adding and Subtracting Polynomials, Lesson 7-2: Multiplying Polynomials, Lesson 7-3: Multiplying Special Cases, Lesson 7-4: Factoring Polynomials
Understand the relationship between zeros and factors of polynomials A.APR.3 Identify zeros of polynomials when suitable factorizations are available, and use the zeros to construct a rough graph of the function defined by the polynomial.
Lesson 9-2: Solving Quadratic Equations by Factoring
Create equations that describe numbers or relationships. Cluster Note: Extend work on linear and exponential equations in Unit 1 to quadratic equations. A.CED.1 Create equations and inequalities in one variable and use them to solve problems. Include equations arising from linear and quadratic functions, and simple rational and exponential functions.
Lesson 1-2: Solving Linear Equations, Lesson 1-3: Solving Equations with A Variable on Both Sides, Lesson 1-4: Literal Equations and Formulas, Lesson 1-5: Solving Inequalities in One Variable, Lesson 1-6: Compound Inequalities, Lesson 1-7: Absolute Value Equations and Inequalities, Lesson 9-1: Solving Quadratic Equations Using Graphs and Tables, Lesson 9-2: Solving Quadratic Equations by Factoring, Lesson 9-4: Solving Quadratic Equations Using Square Roots, Lesson 9-6: The Quadratic Formula and Discriminant
A.CED.2 Create equations in two or more variables to represent relationships between quantities; graph equations on coordinate axes with labels and scales.
Lesson 2-1: Slope-Intercept Form, Lesson 2-2: Point-Slope Form, Lesson 2-3: Standard Form, Lesson 2-4: Parallel and Perpendicular Lines, Lesson 6-3: Exponential Growth and Decay, Lesson 8-1: Key Features of Graphs of Quadratic Functions

A Correlation of enVision A|G|A – Algebra 1 to the Maryland Common Core State Curriculum Framework for Mathematics Algebra 1
38 ★ Modeling Standard (+) indicates additional mathematics that students should learn to prepare for advanced courses
Maryland Common Core State Curriculum Framework - Algebra 1
enVision A|G|A Algebra 1 Lessons
A.CED.4 Rearrange formulas to highlight a quantity of interest, using the same reasoning as in solving equations. For example, rearrange Ohm’s law V = IR to highlight resistance R. Note: Extend to formulas involving squared variables
Lesson 1-4: Literal Equations and Formulas
Understanding solving equations as a process of reasoning and explain with reasoning. A.REI.1 Explain each step in solving a simple equation as following from the equality of numbers asserted at the previous step, starting from the assumption that the original equation has a solution. Construct a viable argument to justify a solution method.
Lesson 1-2: Solving Linear Equations, Lesson 1-3: Solving Equations with A Variable on Both Sides
Solve equations and inequalities in one variable. Cluster Note: Students should learn of the existence of the complex number system, but will not solve quadratics with complex solutions until Algebra II. A.REI.4 Solve quadratic equations in one variable.
Lesson 9-1: Solving Quadratic Equations Using Graphs and Tables
a. Use the method of completing the square to transform any quadratic equation in x into an equation of the form (x – p)2 = q that has the same solutions. Derive the quadratic formula from this form.
Lesson 9-5: Completing the Square, Lesson 9-6: The Quadratic Formula and Discriminant
b. Solve quadratic equations by inspection (e.g., for x2 = 49), taking square roots, completing the square, the quadratic formula and factoring, as appropriate to the initial form of the equation. Recognize when the quadratic formula reveals that the quadratic equation has “no real solutions”.
Lesson 9-1: Solving Quadratic Equations Using Graphs and Tables, Lesson 9-2: Solving Quadratic Equations by Factoring, Lesson 9-4: Solving Quadratic Equations Using Square Roots, Lesson 9-6: The Quadratic Formula and Discriminant

A Correlation of enVision A|G|A – Algebra 1 to the Maryland Common Core State Curriculum Framework for Mathematics Algebra 1
39 ★ Modeling Standard (+) indicates additional mathematics that students should learn to prepare for advanced courses
Maryland Common Core State Curriculum Framework - Algebra 1
enVision A|G|A Algebra 1 Lessons
Unit 5: Quadratic Functions and Modeling Interpret functions that arise in applications in terms of a context. Cluster Note: Focus on quadratic functions; compare with linear and exponential functions studied in Unit 2 F.IF.4 For a function that models a relationship between two quantities, interpret key features of graphs and tables in terms of the quantities, and sketch graphs showing key features given a verbal description of the relationship. Key features include: intercepts; intervals where the function is increasing, decreasing, positive, or negative; relative maximums and minimums; symmetries; end behavior; and periodicity. ★
Lesson 5-1: The Absolute Value Function, Lesson 5-2: Piecewise-Defined Functions, Lesson 5-3: Step Functions, Lesson 6-2: Exponential Functions, Lesson 6-5: Transformations of Exponential Functions, Lesson 8-3: Quadratic Functions in Standard Form, Lesson 10-1: The Square Root Function, Lesson 10-2: The Cube Root Function, Lesson 10-3: Analyzing Functions Graphically, Lesson 10-4: Translations of Functions
F.IF.5 Relate the domain of a function to its graph and, where applicable, to the quantitative relationship it describes. For example, if the function h(n) gives the number of person-hours it takes to assemble n engines in a factory, then the positive integers would be an appropriate domain for the function. ★
Lesson 3-2: Linear Functions, Lesson 3-3: Transforming Linear Functions, Lesson 6-2: Exponential Functions, Lesson 10-3: Analyzing Functions Graphically
F.IF.6 Calculate and interpret the average rate of change of a function (presented symbolically or as a table) over a specified interval. Estimate the rate of change from a graph. ★
Lesson 5-1: The Absolute Value Function, Lesson 5-2: Piecewise-Defined Functions, Lesson 5-3: Step Functions, Lesson 6-2: Exponential Functions, Lesson 8-1: Key Features of Graphs of Quadratic Functions, Lesson 10-1: The Square Root Function, Lesson 10-2: The Cube Root Function, Lesson 10-4: Translations of Functions
Analyze functions using different representations. Cluster Note: This unit, and in particular in F.IF.8b, extends the work begun in Unit 2 on exponential functions with integer exponents. Extend work with quadratics to include the relationship between coefficients and roots, and that once roots are known, a quadratic equation can be factored. F.IF.7 Graph functions expressed symbolically and show key features of the graph, by hand in simple cases and using technology for more complicated cases. ★
Lesson 3-3: Transforming Linear Functions, Lesson 8-2: Quadratic Functions in Vertex Form, Lesson 9-7: Solving Nonlinear Systems of Equations

A Correlation of enVision A|G|A – Algebra 1 to the Maryland Common Core State Curriculum Framework for Mathematics Algebra 1
40 ★ Modeling Standard (+) indicates additional mathematics that students should learn to prepare for advanced courses
Maryland Common Core State Curriculum Framework - Algebra 1
enVision A|G|A Algebra 1 Lessons
a. Graph linear and quadratic functions and show intercepts, maxima, and minima.
Lesson 8-3: Quadratic Functions in Standard Form
b. Graph square root, cube root, and piecewise-defined functions, including step functions and absolute value functions. Note: Compare and contrast absolute value, step and piecewise defined functions with linear, quadratic, and exponential functions. Highlight issues of domain, range, and usefulness when examining piecewise-defined functions
Lesson 5-1: The Absolute Value Function, Lesson 5-2: Piecewise-Defined Functions, Lesson 5-3: Step Functions, Lesson 5-4: Transformations of Piecewise-Defined Functions, Lesson 10-1: The Square Root Function, Lesson 10-2: The Cube Root Function, Lesson 10-4: Translations of Functions
F.IF.8 Write a function defined by an expression in different but equivalent forms to reveal and explain different properties of the function.
Lesson 8-3: Quadratic Functions in Standard Form, Lesson 9-5: Completing the Square
a. Use the process of factoring and completing the square in a quadratic function to show zeros, extreme values, and symmetry of the graph, and interpret these in terms of a context.
Lesson 9-2: Solving Quadratic Equations by Factoring, Lesson 9-5: Completing the Square
F.IF.9 Compare properties of two functions each represented in a different way (algebraically, graphically, numerically in tables, or by verbal descriptions Note: Focus on expanding the types of functions considered to include, linear, exponential, and quadratic.
Lesson 5-4: Transformations of Piecewise-Defined Functions, Lesson 6-5: Transformations of Exponential Functions, Lesson 8-3: Quadratic Functions in Standard Form
Build a function that models a relationship between two quantities. F.BF.1 Write a function that describes a relationship between two quantities. ★
Lesson 3-3: Transforming Linear Functions, Lesson 3-4: Arithmetic Sequences
a. Determine an explicit expression, a recursive process, or steps for calculation from a context.
Lesson 3-4: Arithmetic Sequences

A Correlation of enVision A|G|A – Algebra 1 to the Maryland Common Core State Curriculum Framework for Mathematics Algebra 1
41 ★ Modeling Standard (+) indicates additional mathematics that students should learn to prepare for advanced courses
Maryland Common Core State Curriculum Framework - Algebra 1
enVision A|G|A Algebra 1 Lessons
Build new functions from existing functions. F.BF.3 Identify the effect on the graph of replacing f(x) by f(x) + k, k f(x), f(kx), and f(x + k) for specific values of k (both positive and negative); find the value of k given the graphs. Experiment with cases and illustrate an explanation of the effects on the graph using technology. Note: Focus on quadratic functions, and consider including absolute value functions.
Lesson 3-3: Transforming Linear Functions, Lesson 5-4: Transformations of Piecewise-Defined Functions, Lesson 6-5: Transformations of Exponential Functions, Lesson 8-1: Key Features of Graphs of Quadratic Functions, Lesson 8-2: Quadratic Functions in Vertex Form, Lesson 10-5: Compressions and Stretches of Functions
Construct and compare linear, quadratic, and exponential models and solve problems. F.LE.3 Observe using graphs and tables that a quantity increasing exponentially eventually exceeds a quantity increasing linearly, quadratically, or (more generally) as a polynomial function. Note: Compare linear and exponential growth to quadratic growth
Lesson 8-5: Comparing Linear, Exponential, and Quadratic Models
Summarize, represent, and interpret data on two categorical and quantitative variables. S.ID.6 represent data on two quantitative variables on a scatter-plot, and describe how the variables are related.
Lesson 3-5: Scatter Plots and Lines of Fit, Lesson 3-6: Analyzing Lines of Fit, Lesson 8-4: Modeling with Quadratic Functions
a. Fit a function to the data; use functions fitted to data to solve problems in the context of the data. Use given functions or choose a function suggested by the context. Emphasize linear, exponential and quadratic models.
Lesson 3-5: Scatter Plots and Lines of Fit, Lesson 3-6: Analyzing Lines of Fit, Lesson 8-4: Modeling with Quadratic Functions