for 2018-2019 - agriseta.co.za 20171107 - sign off.pdf · education and training, busa won the...
TRANSCRIPT
Annual Performance Plan
For
2018-2019
November 2017

2

3

4
Contents Part A: Strategic overview ....................................................................................................................... 5
1. Situational analysis .......................................................................................................................... 5
1.1. Performance delivery environment .................................................................................... 5
1.2. Organisational environment ............................................................................................... 6
2. Revisions to legislative and other mandates .............................................................................. 7
3. Overview of 2018 budget and MTEF estimates .......................................................................... 8
3.1. Expenditure estimates ........................................................................................................ 8
3.2 Relating expenditure trends to strategic outcome oriented goals ......................................... 12
Part B: Programme and sub-programme plans .................................................................................... 13
1. Programme 1: Administration ...................................................................................................... 13
2. Programme 2: Skills Planning .................................................................................................... 20
3. Programme 3 Learning programmes and projects ................................................................... 32
4. Programme 4: Quality assurance .............................................................................................. 41
Part C: Links to other plans ................................................................................................................... 44
5. Links to the long-term infrastructure and other capital plans...................................................... 44
6. Conditional grants ......................................................................................................................... 44
7. Public entities ................................................................................................................................ 45
8. Public-private partnerships ........................................................................................................... 50
No partnership exist with a public entity .............................................................................................. 50
Annexure A: Technical Indicator Descriptor ......................................................................................... 51

5
Part A: Strategic overview
1. Situational analysis
Whilst the AgriSETA Sector Skills Plan (SSP) aims to address wide range of issues in the
agricultural sector, in essence it captures the following important realities which have a
direct impact on the process of development of such skills in the sector1;
The global consensus on commitment to agriculture as a key driver for achieving food security, poverty alleviation and economic growth in Sub-Saharan Africa, calls for new strategies and approaches in Agriculture for development. This commitment will directly encourage development of capacity towards smallholder and emerging farming sector.
The sectoral challenges, which include Inter Alia: Equity; Growth and Competitiveness; Environmental Sustainability; and Governance as identified in the Integrated Growth and Development Plan of the Department of Agriculture, Forestry and Fisheries for the period 2011-2031 shape the process of packaging these skills in the sector.
The pressure on AgriSETA to balance the disbursement of discretionary funds to AET, NQF 1 and NQF 2 learning programme, due to the fact that the Agriculture relies heavily on unskilled and semi-skilled workers with higher pitched learning in response to technological advances and the increase in the need for skilled agricultural workers;
The required efforts of the agriculture sector to change the image of agriculture to attract the youth, to advocate prevalent career and business opportunities in the sector.
The continued low success rate of land reform projects need to be factored into discretionary grant funding plans of the AgriSETA.
1.1. Performance delivery environment
The need for discretionary grant funded support to deliver on the required learning
programmes in the sector outstrips the available resources of the AgriSETA. The Strategic
plan has been updated to the National Treasury framework with the following significant
changes:
AgriSETA identified 4 programmes that will be driven to achieve the organisational
goals aligned with the proposed DHET framework for Strategic Plans;
Strategic outcome orientated goals were devised for the organisation

6
1.2. Organisational environment
The AgriSETA structure is well balanced and is entrenched from Accounting Authority level
to the Operational structure. Stability and extensive institutional knowledge however
challenges exist to fill vacancies resulting from resignations. The AgriSETA registration that
was extended up to 2020 makes the management of talent challenging.
AgriSETA Accounting Authority
Programme 3:
Quality Assurance
Programme 2:
Skills Planning
Programme 3:
Learning
programmes and
projects
Youth and career
development
EXCO Standing Comm.
Mandatory Grants
Decent work Quality Assurance
Governance
Strategic
O
P
E
R
A
T
I
O
N
A
L
CEO
Operations
Programme 1:
Administration
Resources
Finance
ICT
Human resources
Rural
Development and
Cooperatives
Reporting
Research
Qualification
Development
Executive Authority (DHET)
National Council of Provinces (NCOP) select committee on education and
recreation & national assembly portfolio committee on Higher Education and
Training
Agricultural
leadership capacity
Public entity
partnership
development
7
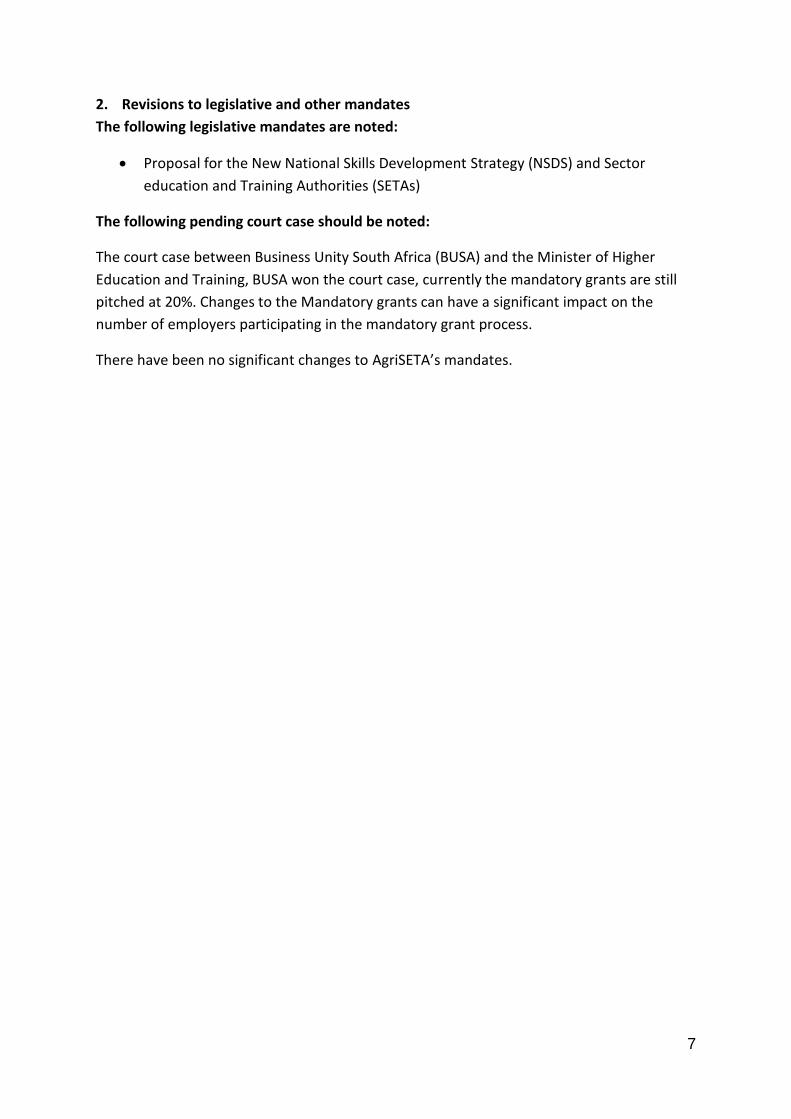
2. Revisions to legislative and other mandates
The following legislative mandates are noted:
Proposal for the New National Skills Development Strategy (NSDS) and Sector
education and Training Authorities (SETAs)
The following pending court case should be noted:
The court case between Business Unity South Africa (BUSA) and the Minister of Higher
Education and Training, BUSA won the court case, currently the mandatory grants are still
pitched at 20%. Changes to the Mandatory grants can have a significant impact on the
number of employers participating in the mandatory grant process.
There have been no significant changes to AgriSETA’s mandates.

8
3. Overview of 2018 budget and MTEF estimates
3.1. Expenditure estimates
Table 1: AgriSETA
Programme Audited outcome Adjusted appropriation
Medium term expenditure estimate
R('000) 2013/14 2014/15 2015/16 2016/17 2017/18 2018/19 2019/20 2020/21
1. Administration 31 102 35 958 38 982 44 195 49 103 50232 53 903 56 868
2. Skills Planning 55 196 46 821 54 579 76 083 79 225 75 762 86 122 90 859
3. Learning programmes
and projects
168 979 141 922 180 138 209 520 229 416 252 202 255 670 269 732
4. ETQA - - - - 20 102 20 102 20 102 20 102 21 208
- -
-
-
-
- -
-
-
- -
-
-
-
- -
-
-
- -
-
-
-
- -
-
-
- -
-
-
-
- -
-
-
255 277 224 701 273 699 349 900 377 846 398 298 415 797 438 666
9
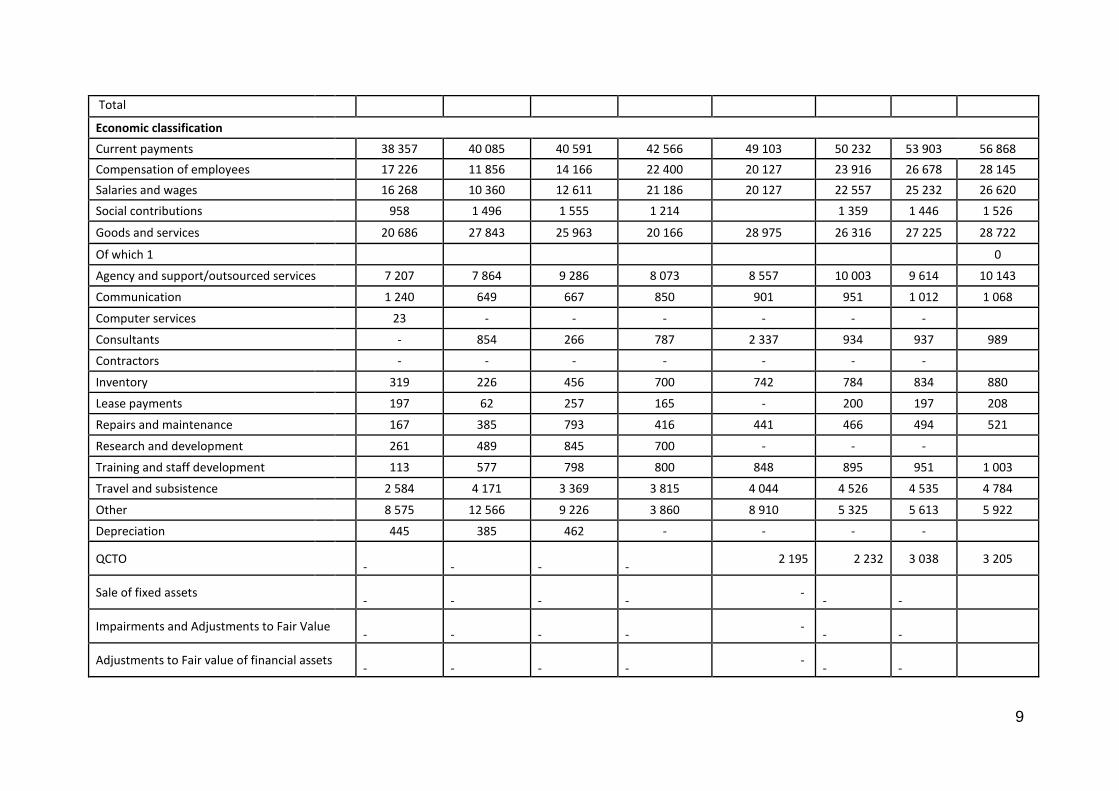
Total
Economic classification
Current payments 38 357 40 085 40 591 42 566 49 103 50 232 53 903 56 868
Compensation of employees 17 226 11 856 14 166 22 400 20 127 23 916 26 678 28 145
Salaries and wages 16 268 10 360 12 611 21 186 20 127 22 557 25 232 26 620
Social contributions 958 1 496 1 555 1 214 1 359 1 446 1 526
Goods and services 20 686 27 843 25 963 20 166 28 975 26 316 27 225 28 722
Of which 1
0
Agency and support/outsourced services 7 207 7 864 9 286 8 073 8 557 10 003 9 614 10 143
Communication 1 240 649 667 850 901 951 1 012 1 068
Computer services 23 - - - - - -
Consultants - 854 266 787 2 337 934 937 989
Contractors - - - - - - -
Inventory
319 226 456 700 742 784 834 880
Lease payments 197 62 257 165 - 200 197 208
Repairs and maintenance 167 385 793 416 441 466 494 521
Research and development 261 489 845 700 - - -
Training and staff development 113 577 798 800 848 895 951 1 003
Travel and subsistence 2 584 4 171 3 369 3 815 4 044 4 526 4 535 4 784
Other
8 575 12 566 9 226 3 860 8 910 5 325 5 613 5 922
Depreciation 445 385 462 - - - -
QCTO
-
-
-
-
2 195 2 232 3 038 3 205
Sale of fixed assets -
-
-
-
- -
-
Impairments and Adjustments to Fair Value -
-
-
-
- -
-
Adjustments to Fair value of financial assets -
-
-
-
- -
-

10
Impairments to non-financial assets -
-
-
-
- -
-
Interest, dividends and rent on land -
1 -
-
- -
-
Interest
-
1 -
-
- -
-
Dividends
-
-
-
-
- -
-
Rent on land -
-
-
-
- -
-
Transfers and subsidies 217 092 279 331 243 061 305 705 328 743 348 066 364 100 384 126
Employer Grant (SETAs only) 54 936 137 409 62 923 61 826 66 739 62 505 73 636 77 686
Other government units - 85 016 - - - - -
National government -
-
-
-
- -
-
Departmental agencies and accounts -
-
-
-
- -
-
Provinces
-
-
-
-
- -
-
Municipalities -
-
-
-
- -
-
National Skills Fund - 85 016 - - - - -
Public corporations and private enterprises (subsidies and other transfers)
- 6 061 9 189 - - - -
Public corporations - - - - - - -
Private enterprises - 6 061 9 189 - - - -
Households and non-government units 54 936 46 332 53 734 61 826 66 739 62 505 73 636 77 686
Discretionary Grant (SETAs only) 162 156 141 922 180 138 243 879 262 003 285 561 290 464 306 440
Other government units 137 526 141 922 - - - - -
National government 109 824 141 922 - - - - -
Departmental agencies and accounts - - - - - - -
11
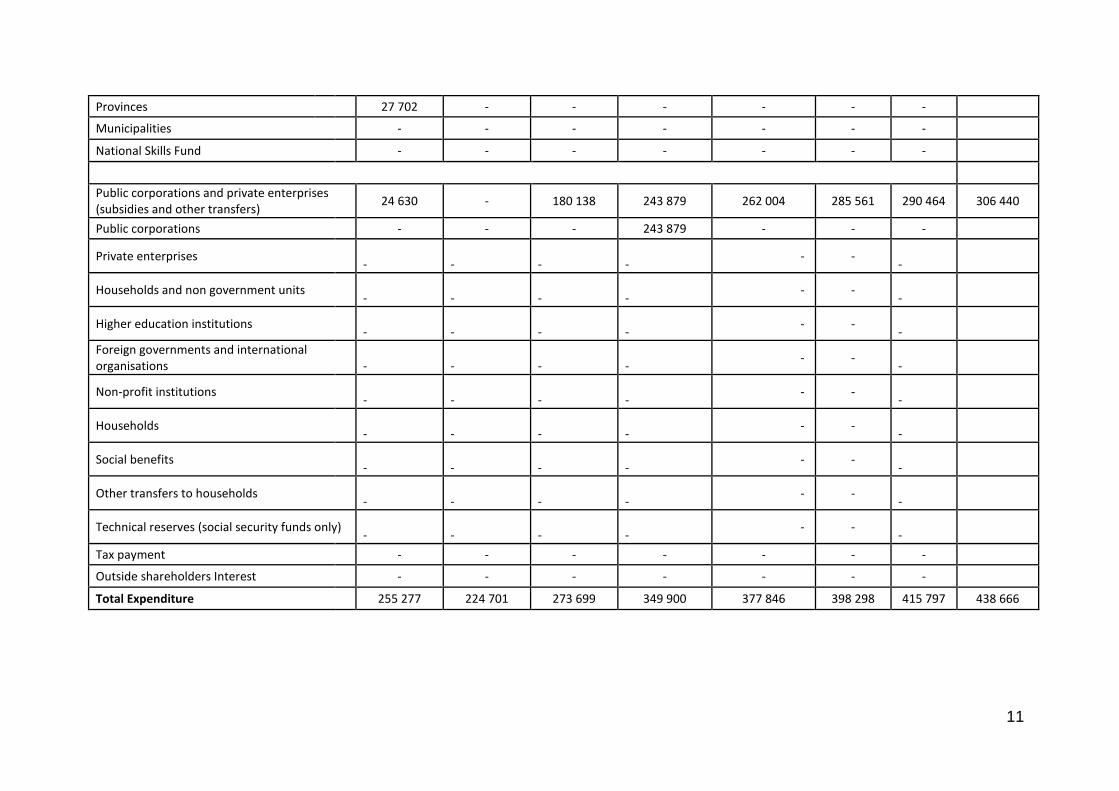
Provinces
27 702 - - - - - -
Municipalities - - - - - - -
National Skills Fund - - - - - - -
Public corporations and private enterprises (subsidies and other transfers)
24 630 - 180 138 243 879 262 004 285 561 290 464 306 440
Public corporations - - - 243 879 - - -
Private enterprises -
-
-
-
- - -
Households and non government units -
-
-
-
- - -
Higher education institutions -
-
-
-
- - -
Foreign governments and international organisations
-
-
-
-
- - -
Non-profit institutions -
-
-
-
- - -
Households -
-
-
-
- - -
Social benefits -
-
-
-
- - -
Other transfers to households -
-
-
-
- - -
Technical reserves (social security funds only) -
-
-
-
- - -
Tax payment - - - - - - -
Outside shareholders Interest - - - - - - -
Total Expenditure 255 277 224 701 273 699 349 900 377 846 398 298 415 797 438 666

12
3.2 Relating expenditure trends to strategic outcome oriented goals
Creditable institutional mechanisms: this goal will be supported through the implementation of the skills planning programme, focus
will be on establishing research capacity and strengthening the sector skills committees. It is expected that the full allocated budget will
be spend ;
Increased professional, vocational, occupational and workplace learning to create decent jobs: This goal will be supported through the
implementation of the skills delivery programme with the focus on addressing the critical skills identified in the updated sector skills
plan. The funding of learnerships, bursary and internship programmes will be prioritised;
Increased skills levels of cooperatives, NGOs, CBOs in support of Land Reform and rural development.: This goal will be supported
through implementation of the skills delivery programme; a renewed focus will be placed on partnership funding and support to rural
structures and youth. Funding will be prioritised for learnership and skills programmes;
Improved Agricultural education and training systems: This goal will be supported through the implementation of the ETQA programme
and a renewed focus of funding will be channelled towards expanding on the RPL programme and towards alignment with the QCTO
processes.
Increased Mandatory grant participation of levy paying employers: This goal will be supported through the implementation of the skills planning programme, a renewed focus will be placed on the induction of new employers and the capacitation of Skills Development Facilitators (SDFs)
Increased participation of Youth in Agriculture: This goal will be supported through the implementation of the skills planning programme focussing on increased participation in career development events
Increased Public sector capacity: This goal will be supported through the implementation of the Administration and Skills Planning programmes, focussing funding on the development of agricultural leaders and strengthening the capacity of board structures.

13
Part B: Programme and sub-programme plans
1. Programme 1: Administration
1.1. Purpose: To provide strategic leadership, management and support services to AgriSETA. The programme include the Accounting Authority, CEOs office, General Managers office , Financial Administration; Internal Audit; Risk; Stakeholder Relations, Communication; Information Technology and the Human Resources Department To improve the service delivery of public institutions in the agricultural sector through the following offices:
Accounting Authority: Provides leadership, decision-making strategic direction.
Office of the CEO: Provides leadership, strategic direction, policy development, decision-making support and financial oversight for AgriSETA.
Financial Administration: Provides the department with sound financial services.
General Managers office: Provides operational management services.
Stakeholder Relations, Communication and marketing: establishes and strengthens intergovernmental and stakeholder relations, manages communication and marketing services.
Internal audit, provides auditing services to ensure compliance with policies and procedures
Information Technology(ICT), provides hardware and software support to AgriSETA
Human Resources department provides Human capital support for AgriSETA to deliver on its mandate

14
Sub programme 1: Finance Strategic objective Strategic
Plan target Audited/Actual performance Estimated
performance
Medium-term targets
2013/14 2014/15 2015/16 2016/17 2017/18 2018/19 2019/20 2020/21
1.1 To manage AgriSETA finances in alignment with PFMA and National Treasury guidelines
To reduce the internal control deficiencies reported in the previous AG report by 10%.
- - - - 10% reduction
10% reduction
10% reduction
10% reduction
Programme performance indicators Audited/Actual performance Estimated performance
Medium-term targets
2013/14 2014/15 2015/16 2016/17 2017/18 2018/19 2019/20 2020/21
1.1.1.
Percentage of budget variances and adjustments reduced
- - - - 10% 20% 30% 40%
1.1.2. 100% of invoices processed within PFMA guidelines
- - - - 100% 100% 100% 100%
1.1.3. All service providers procured and managed within National Treasury guidelines
- - - - 100% 100% 100% 100%
1.1.4. Maintain a 90% verification rate with the asset register
- - - - 90% 90% 90% 90%
1.1.5. Collection rate of 90% of provincial levies
- - - - 90% 90% 90%
90%

15
Quarterly targets 2018 Quarterly targets for programme performance indicators:
Programme performance indicators Reporting period Annual target 2018/19
Quarterly targets
1st 2nd 3rd 4th
1.1.1.
Percentage of budget variances and adjustments reduced
Annually 10% reduction - - - 10%
1.1.2. 100% of invoices processed within PFMA
Quarterly 100% invoices processed in compliance with PFMA regulations
100% 100% 100% 100%
1.1.3. All service providers procured and managed within National Treasury guidelines
Quarterly 100% of service providers
100% 100% 100% 100%
1.1.4. Maintain an 90% verification rate with the asset register
Quarterly 90% reduction 90% 90% 90% 90%
1.1.5. Collection rate of 90% of provincial levies
Annually 90% collection rate of provincial levies
0 0 0 90%
Sub programme 2: Governance Strategic objective Strategic
Plan target Audited/Actual performance Estimated
performance Medium-term targets
2013/14 2014/15 2015/16 2016/17 2017/18 2018/19 2019/20 2020/21
1.2.
To provide strategic direction and oversight to AgriSETA for effective and direct facilitation of interventions in achievement of the organisational goals
To improve the governance function of the board by 15% annually
- - - - 15% improvement of governance function
15% improvement of governance function
15% improvement of governance function
15% improvement of governance function

16
Programme performance indicators Audited/Actual performance Estimated performance
Medium-term targets
2013/14 2014/15 2015/16 2016/17 2017/18 2018/19 2019/20 2020/21
1.2.1. Number of board meetings - - - - 4 4 4 4
1.2.2 Number of board sub-committee meetings
- - - - 4 4 4 4
1.2.3. 10% increase in the quality of the information that the board receive from board sub-committees
- - - - 10% increase in quality
10% increase in quality
10% increase in quality
10% increase in quality
Quarterly targets 2018 Quarterly targets for programme performance indicators:
Programme performance indicators Reporting period Annual target 2018/19
Quarterly targets
1st 2nd 3rd 4th
1.2.1. Number of board meetings Quarterly 4 1 1 1 1
1.2.2 Number of board sub-committee meetings
Annually 4 1 1 1 1
1.2.3. 10% increase in the quality of the information that the board receive from board sub-committees
Annually 10% increase in quality
- - - 10% increase in quality

17
Sub programme 3 : Information Technology(ICT) Strategic objective Strategic
Plan target Audited/Actual performance Estimated
performance
Medium-term targets
2013/14 2014/15 2015/16 2016/17 2017/18 2018/19 2019/20 2020/21
1.3. Provision of a hard and software solution to AgriSETA
To increase the responsiveness of the ICT solution by 10% annually
- - - - 10% increase 10% increase 10% increase
10% increase
Programme performance indicators Audited/Actual performance Estimated performance
Medium-term targets
2013/14 2014/15 2015/16 2016/17 2017/18 2018/19 2019/20 2020/21
1.3.1. 90% of all ICT (hard and software) related incidents resolved within 24 hours of first report.
- - - - 90% resolved in 24 hours
90% resolved in 24 hours
90% resolved in 24 hours
90% resolved in 24 hours
1.3.2. ICT solution reviewed annually - - - - 1 1 1
1
Quarterly targets 2018 Quarterly targets for programme performance indicators:
Programme performance indicators Reporting period Annual target 2018/19
Quarterly targets
1st 2nd 3rd 4th
1.3.1 90% of all ICT (hard and software) related incidents resolved within 24 hours of first report.
Annually 90% of queries resolved
90% of queries resolved
90% of queries resolved
90% of queries resolved
90% of queries resolved
1.3.2 ICT solution reviewed annually Annually 1 0 0 1 0

18
Sub programme 4: Human Resources Strategic objective Strategic
Plan target Audited/Actual performance Estimated
performance
Medium-term targets
2013/14 2014/15 2015/16 2016/17 2017/18 2018/19 2019/20 2020/21
1.4. Provision of Human Capital support to AgriSETA
To increase and maintain the level of employee satisfaction to 80% annually
- - - - 80% satisfaction
80% satisfaction
80% satisfaction
80% satisfaction
Programme performance indicators Audited/Actual performance Estimated performance
Medium-term targets
2013/14 2014/15 2015/16 2016/17 2017/18 2018/19 2019/20 2020/21
1.4.1. 90% of employees participate in further career development
- - - - 90% 90% 90% 90%
1.4.2. 90% of vacant positions filled - - - - 90% 90% 90% 90%
1.4.3. All employees sign performance contracts annually
- 53 100% 100% 100%
Quarterly targets 2018 Quarterly targets for programme performance indicators:
Programme performance indicators Reporting period Annual target 2018/19
Quarterly targets
1st 2nd 3rd 4th
1.4.1. 90% of employees participate in further career development
Annually 90% - - - 90%
1.4.2. 90% of vacant positions filled Quarterly 90% 90% of vacant positions filled
90% of vacant positions filled
90% of vacant positions filled
90% of vacant positions filled

19
1.4.3. All employees sign performance contracts annually
Annually 100% 100% - - -
1.3. Reconciling performance targets with the Budget and MTEF
Table 1: Programme name: Administration
Sub Programme: Expenditure outcome Adjusted
appropriation
Medium term expenditure estimate
R’000 R’000
NO DESCRIPTION 2013/14 2014/15 2015/16 2016/17 2017/18 2018/19 2019/20 2020/21
1 Finance 14 361 17 894 19 030 19 638 18 638 19 638 19 638 20 718
2 Governance 2 093 2 192 2 620 2 637 3 081 3 635 4 289 4 525
3 *Information Technology(ICT) 3 572 3 512 4 511 183 193 204,6 216,87 229
4 Human Resources 10 403 11 856 12 625 18 621 23 744 26 754 26 678 28 145
5 #Youth and Career Development
673 774 196 3 115 - - - 0
*Outsourced function 31 102 35 958 38 982 44 195 49 103 50232 53 903 56 868
# Moved to Skills Delivery
1.4. Performance and expenditure trends
Finance-During this MTEF this sub-programme will focus on the implementation of the new SCM guidelines
Governance- This sub-programme will focus on the continuous development of board sub committees and structures
*Information Technology-The management and storage of information will be prioritised through the maintenance of infrastructure and the continuous improvement of information systems
Human Resources-The retention of talent and human capital will be prioritised in this MTEF in light of the new SETA landscape. The management and measurement of performance will also be prioritised through the implementation of a new performance management system.
20
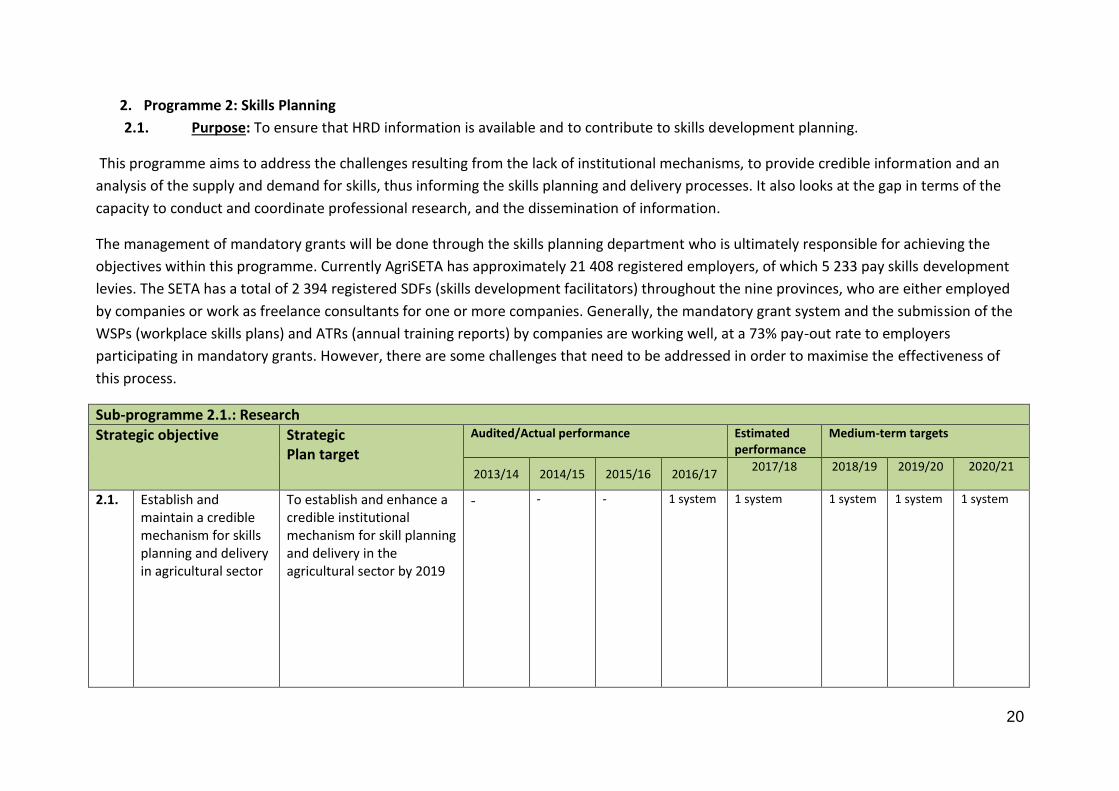
2. Programme 2: Skills Planning
2.1. Purpose: To ensure that HRD information is available and to contribute to skills development planning.
This programme aims to address the challenges resulting from the lack of institutional mechanisms, to provide credible information and an
analysis of the supply and demand for skills, thus informing the skills planning and delivery processes. It also looks at the gap in terms of the
capacity to conduct and coordinate professional research, and the dissemination of information.
The management of mandatory grants will be done through the skills planning department who is ultimately responsible for achieving the
objectives within this programme. Currently AgriSETA has approximately 21 408 registered employers, of which 5 233 pay skills development
levies. The SETA has a total of 2 394 registered SDFs (skills development facilitators) throughout the nine provinces, who are either employed
by companies or work as freelance consultants for one or more companies. Generally, the mandatory grant system and the submission of the
WSPs (workplace skills plans) and ATRs (annual training reports) by companies are working well, at a 73% pay-out rate to employers
participating in mandatory grants. However, there are some challenges that need to be addressed in order to maximise the effectiveness of
this process.
Sub-programme 2.1.: Research
Strategic objective Strategic Plan target
Audited/Actual performance Estimated performance
Medium-term targets
2013/14 2014/15 2015/16 2016/17 2017/18 2018/19 2019/20 2020/21
2.1.
Establish and maintain a credible mechanism for skills planning and delivery in agricultural sector
To establish and enhance a credible institutional mechanism for skill planning and delivery in the agricultural sector by 2019
- - - 1 system 1 system 1 system 1 system 1 system

21
Programme performance indicators Audited/Actual performance Estimated performance
Medium-term targets
2013/14 2014/15 2015/16 2016/17 2017/18 2018/19 2019/20 2020/21
2.1.1.
Sector skills plans, Annual performance plans and Strategic plans updated
1 1 1 1 1 1 SSP 1 APP 1 SP
1 SSP 1 APP 1 SP
1 SSP 1 APP 1 SP
2.1.2. Research agenda developed and approved No target No target 1 1 1 1 1 1
2.1.3. Number of SSC committees established and strengthened through capacity building sessions and plenaries.
0 1 7 11 SSCs 2 Capacity building 1 Plenary
11 SSC’s 2 Meet. 1 Plen.
11SSC’S 2 Meet .
2 plen.
11SSC’s 2 Meet. 2 Plen.
11SSC’s 2 Meet. 2 Plen.
Quarterly targets 2018 Quarterly targets for programme performance indicators:
Programme performance indicators Reporting period Annual target 2018/19
Quarterly targets
1st 2nd 3rd 4th
2.1.1.
Sector skills plans, Annual performance plan and strategic plans updated
Annually 1 SSP 1 APP 1 SP
1 SSP 1 APP 1 SP
0 0
2.1.2. Research agenda developed and approved
Quarterly 1 0 0 1 0
2.1.3. Number of SSC committees established and strengthened through capacity building sessions and plenaries.
Annually 11 SSC’s 2 Meetings 2 Plenary
0 11 SSC’s 1 Meetings 1 Plenary
0 11 SSC’s 1 Meetings 1 Plenary
22
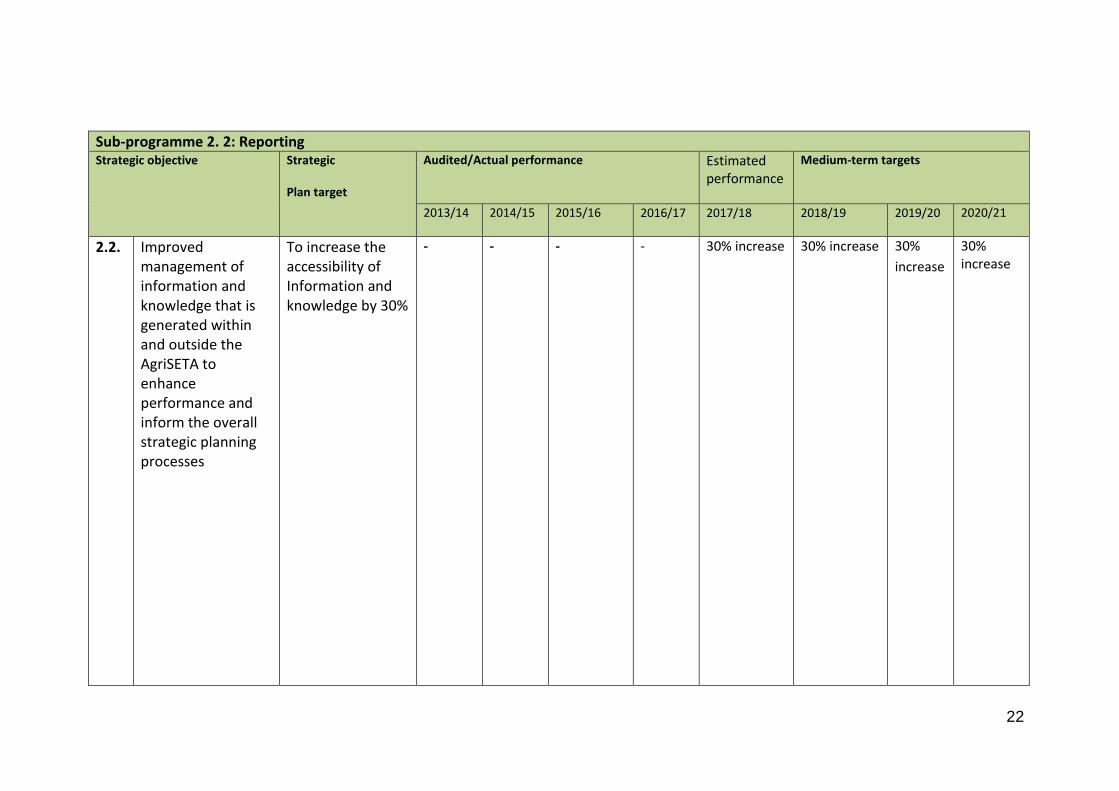
Sub-programme 2. 2: Reporting Strategic objective Strategic
Plan target
Audited/Actual performance Estimated performance
Medium-term targets
2013/14 2014/15 2015/16 2016/17 2017/18 2018/19 2019/20 2020/21
2.2.
Improved management of information and knowledge that is generated within and outside the AgriSETA to enhance performance and inform the overall strategic planning processes
To increase the accessibility of Information and knowledge by 30%
- - - - 30% increase 30% increase 30%
increase
30% increase

23
Programme performance indicators Audited/Actual performance Estimated performance
Medium-term targets
2013/14 2014/15 2015/16 2016/17 2017/18 2018/19 2019/20 2020/21
2.2.1. Number of internal knowledge exchange sessions
No Target No Target No Target No Target 4 4 4 4
2.2.2. Number of performance monitoring sessions facilitated with target holders within AgriSETA
No Target No Target No Target No Target 12 12 12 12
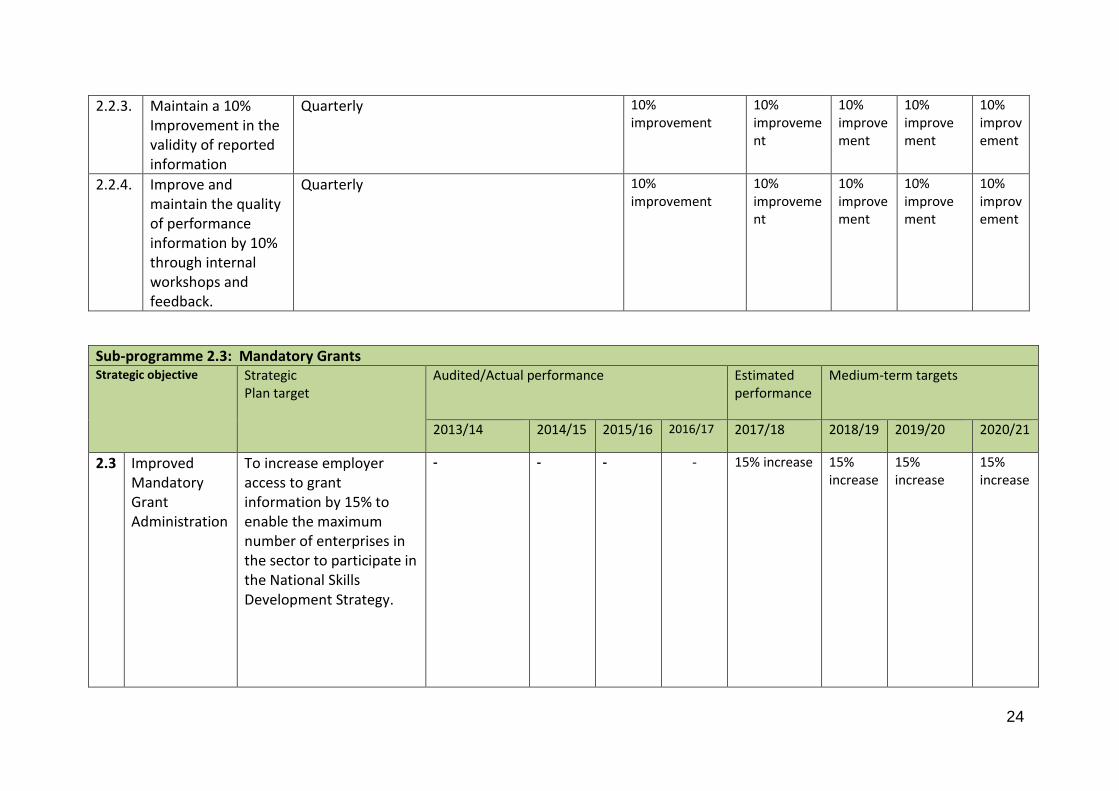
2.2.3.
Maintain a 10% Improvement in the validity of reported information
No Target No Target No Target No Target 10% improvement
10% improvement
10% improvement
10% improvement
2.2.4. Improve the quality of performance information by 10% through internal workshops and feedback.
No Target No Target No Target No Target 10% improvement
10% improvement
10% improvement
10% improvement
Quarterly targets 2018 Quarterly targets for programme performance indicators:
Programme performance indicators
Reporting period Annual target
2018/19
Quarterly targets
1st 2nd 3rd 4th
2.2.1. Number of internal knowledge exchange sessions
Quarterly 4 meetings 1 1 1 1
2.2.2. Number of performance monitoring sessions facilitated with target holders within AgriSETA
Quarterly 12 meetings 3 3 3 3
24
2.2.3. Maintain a 10% Improvement in the validity of reported information
Quarterly 10% improvement
10% improvement
10% improvement
10% improvement
10% improvement
2.2.4. Improve and maintain the quality of performance information by 10% through internal workshops and feedback.
Quarterly 10% improvement
10% improvement
10% improvement
10% improvement
10% improvement
Sub-programme 2.3: Mandatory Grants Strategic objective Strategic
Plan target Audited/Actual performance
Estimated performance
Medium-term targets
2013/14 2014/15 2015/16 2016/17 2017/18 2018/19 2019/20 2020/21
2.3
Improved Mandatory Grant Administration
To increase employer access to grant information by 15% to enable the maximum number of enterprises in the sector to participate in the National Skills Development Strategy.
- - - - 15% increase 15% increase
15% increase
15% increase
25
Programme performance indicators Audited/Actual performance Estimated performance
Medium-term targets
2013/14 2014/15 2015/16 2016/17 2017/18 2018/19 2019/20 2020/21
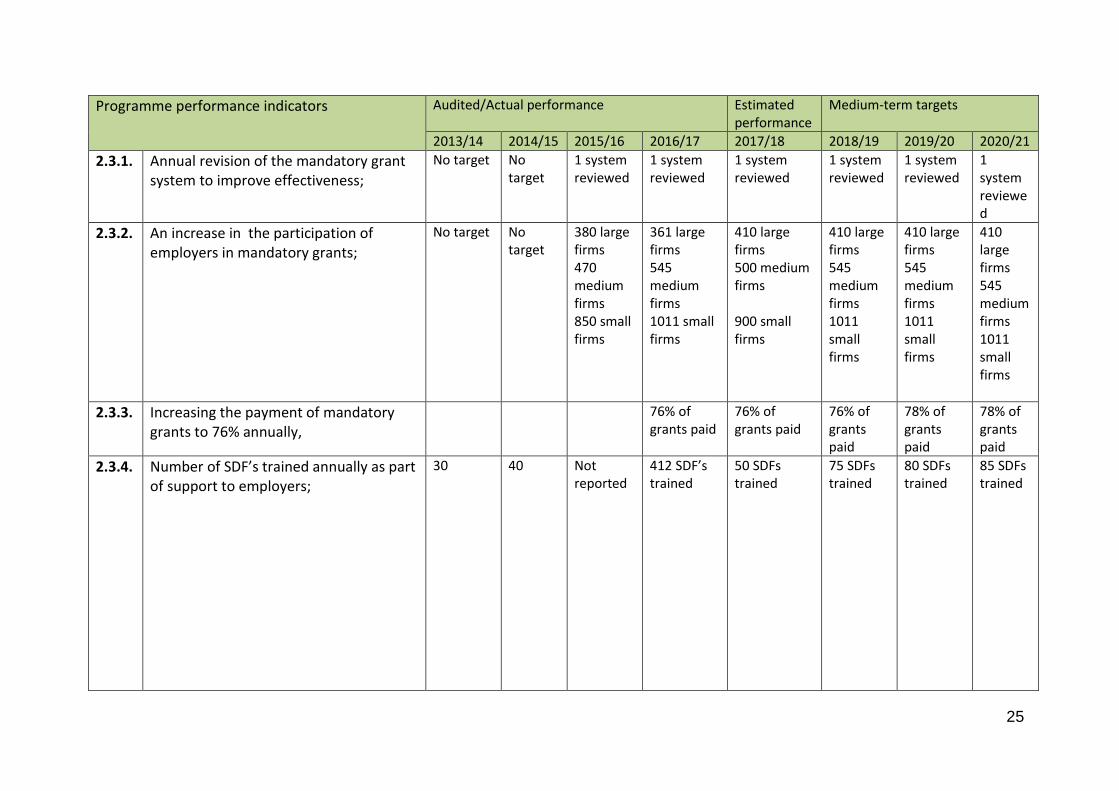
2.3.1.
Annual revision of the mandatory grant system to improve effectiveness;
No target No target
1 system reviewed
1 system reviewed
1 system reviewed
1 system reviewed
1 system reviewed
1 system reviewed
2.3.2. An increase in the participation of employers in mandatory grants;
No target No target
380 large firms 470 medium firms 850 small firms
361 large firms 545 medium firms 1011 small firms
410 large firms 500 medium firms 900 small firms
410 large firms 545 medium firms 1011 small firms
410 large firms 545 medium firms 1011 small firms
410 large firms 545 medium firms 1011 small firms
2.3.3. Increasing the payment of mandatory grants to 76% annually,
76% of grants paid
76% of grants paid
76% of grants paid
78% of grants paid
78% of grants paid
2.3.4. Number of SDF’s trained annually as part of support to employers;
30 40 Not reported
412 SDF’s trained
50 SDFs trained
75 SDFs trained
80 SDFs trained
85 SDFs trained
26
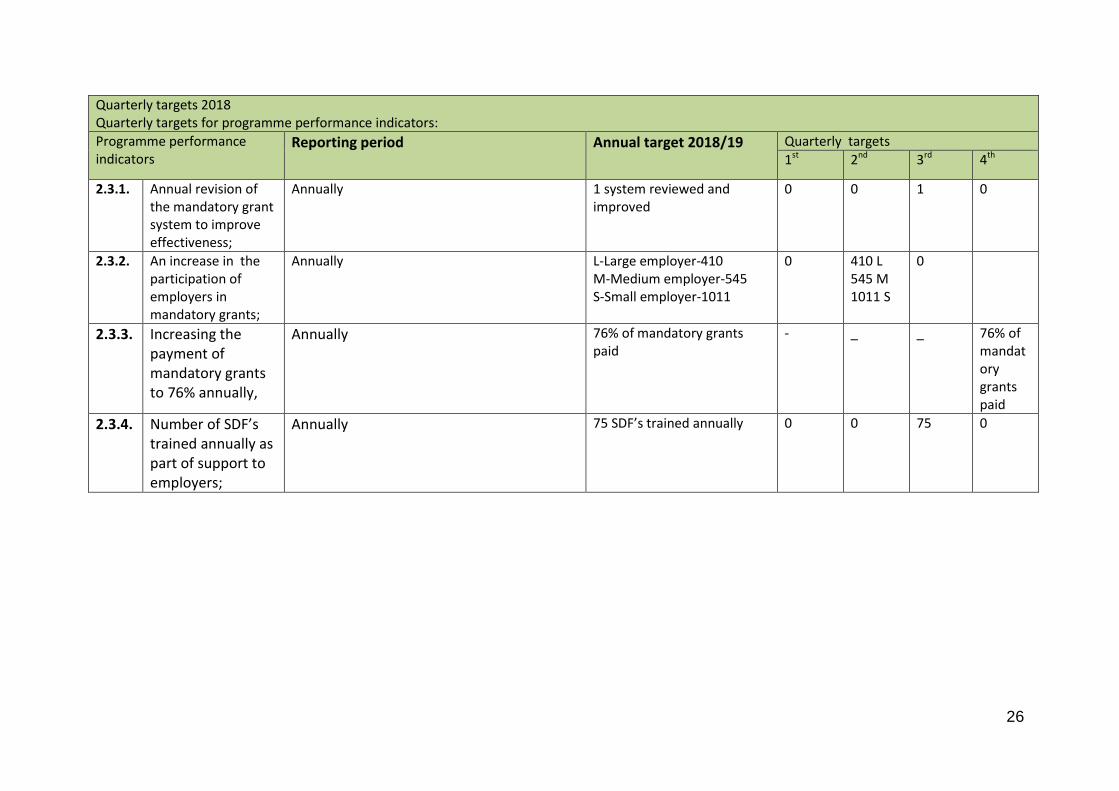
Quarterly targets 2018 Quarterly targets for programme performance indicators:
Programme performance indicators
Reporting period Annual target 2018/19 Quarterly targets
1st 2nd 3rd 4th
2.3.1.
Annual revision of the mandatory grant system to improve effectiveness;
Annually 1 system reviewed and improved
0 0 1 0
2.3.2. An increase in the participation of employers in mandatory grants;
Annually L-Large employer-410 M-Medium employer-545 S-Small employer-1011
0 410 L 545 M 1011 S
0
2.3.3. Increasing the payment of mandatory grants to 76% annually,
Annually 76% of mandatory grants paid
- _ _ 76% of mandatory grants paid
2.3.4. Number of SDF’s trained annually as part of support to employers;
Annually 75 SDF’s trained annually 0 0 75 0
27
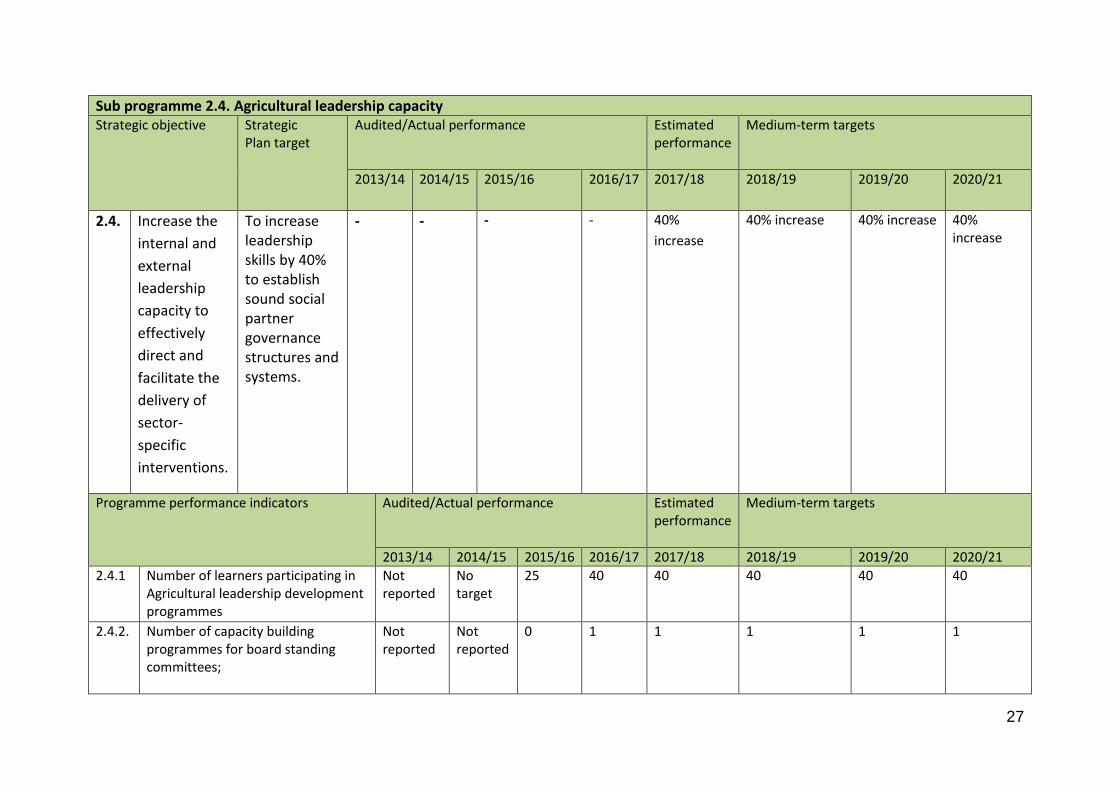
Sub programme 2.4. Agricultural leadership capacity Strategic objective Strategic
Plan target Audited/Actual performance Estimated
performance
Medium-term targets
2013/14 2014/15 2015/16 2016/17 2017/18 2018/19 2019/20 2020/21
2.4.
Increase the
internal and
external
leadership
capacity to
effectively
direct and
facilitate the
delivery of
sector-
specific
interventions.
To increase leadership skills by 40% to establish sound social partner governance structures and systems.
- - - - 40%
increase
40% increase 40% increase
40% increase
Programme performance indicators Audited/Actual performance Estimated performance
Medium-term targets
2013/14 2014/15 2015/16 2016/17 2017/18 2018/19 2019/20 2020/21
2.4.1 Number of learners participating in Agricultural leadership development programmes
Not reported
No target
25 40 40 40 40 40
2.4.2. Number of capacity building programmes for board standing committees;
Not reported
Not reported
0 1 1 1 1
1
28
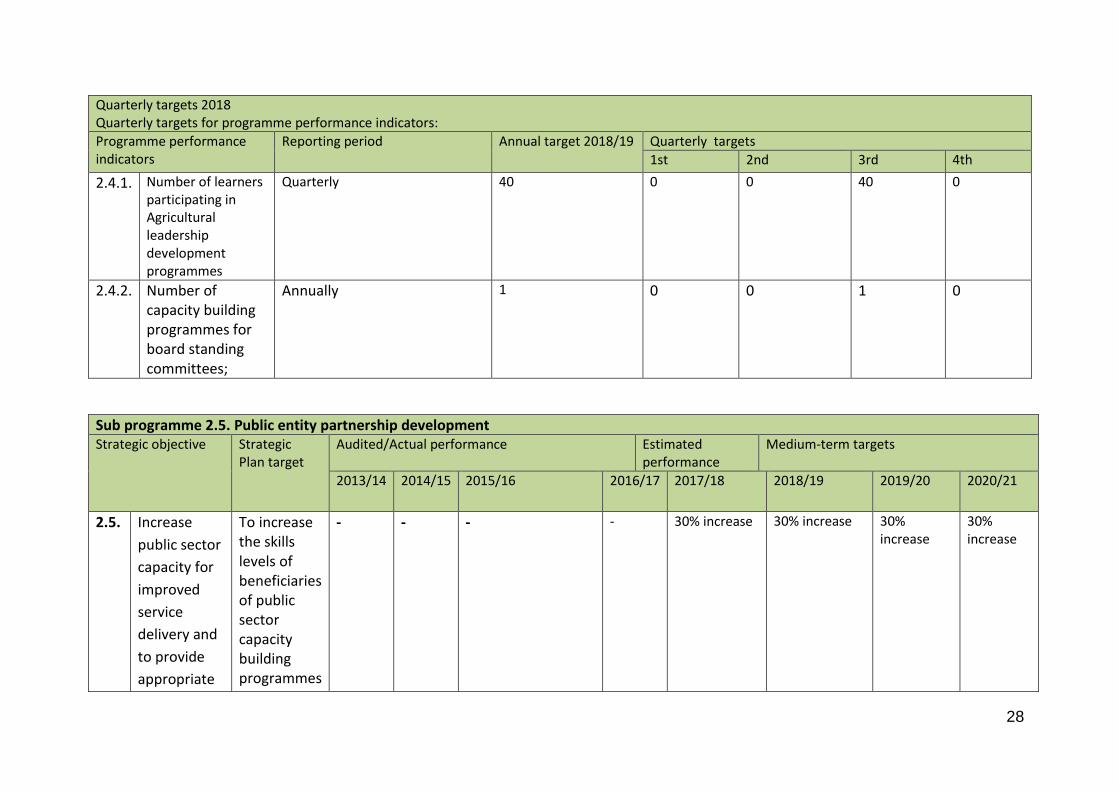
Quarterly targets 2018 Quarterly targets for programme performance indicators:
Programme performance indicators
Reporting period Annual target 2018/19 Quarterly targets
1st 2nd 3rd 4th
2.4.1.
Number of learners participating in Agricultural leadership development programmes
Quarterly 40 0 0 40 0
2.4.2. Number of capacity building programmes for board standing committees;
Annually 1 0 0 1 0
Sub programme 2.5. Public entity partnership development Strategic objective Strategic
Plan target Audited/Actual performance Estimated
performance Medium-term targets
2013/14 2014/15 2015/16 2016/17 2017/18 2018/19 2019/20 2020/21
2.5.
Increase
public sector
capacity for
improved
service
delivery and
to provide
appropriate
To increase the skills levels of beneficiaries of public sector capacity building programmes
- - - - 30% increase 30% increase 30% increase
30% increase

29
support for
agricultural
and rural
development
by 30%
Programme performance indicators
Audited/Actual performance Estimated performance
Medium-term targets
2013/14 2014/15 2015/16 2016/17 2017/18 2018/19 2019/20 2020/21
2.5.1 Number of co-funded projects supported through public entities
- - - - 8 8 8 8
2.5.2.
Number of research projects established
- - - - 10 10 10 10
2.5.3.
Number of partnerships with Public Entities in support of Ministerial Projects
- - - - 7 7 7 7
Quarterly targets 2018 Quarterly targets for programme performance indicators:
Programme performance indicators
Reporting period
Annual target 2018/19 Quarterly targets
1st 2nd 3rd 4th
2.5.1 Number of co-
funded projects
supported through
public entities
Annually 8 2 2 2 2
2.5.2. Number of research
projects established
Annually 10
- - 5 5
30
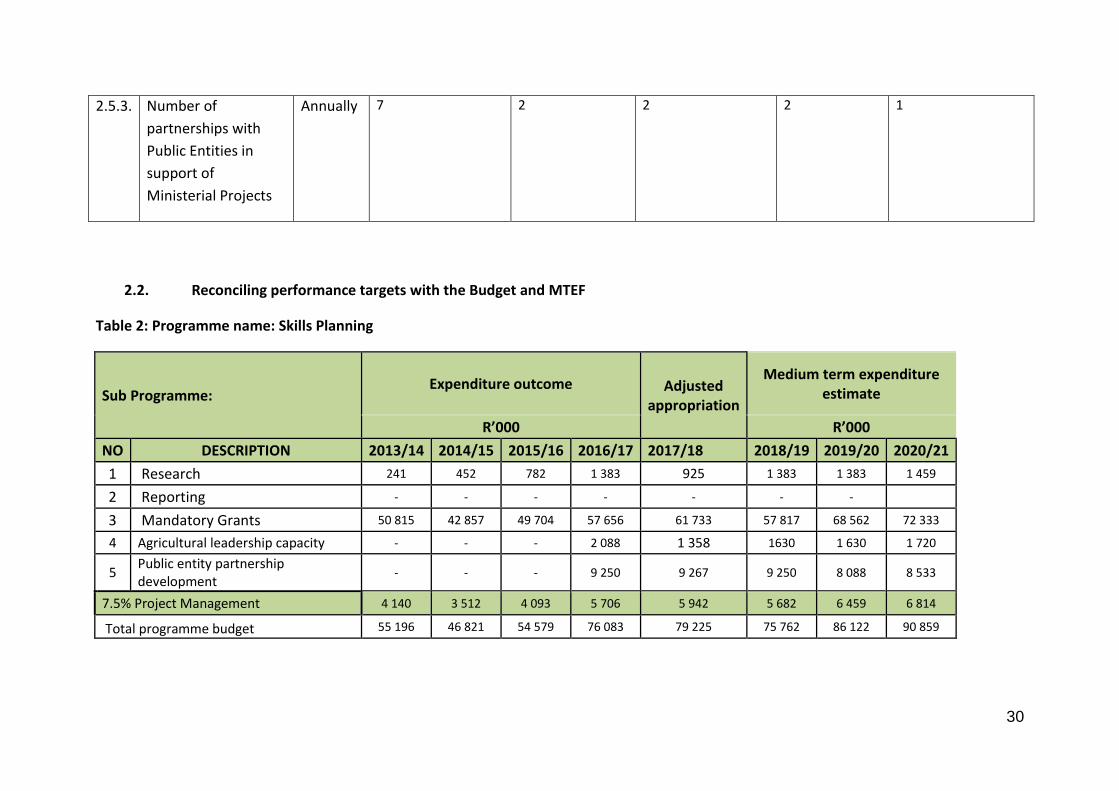
2.5.3. Number of
partnerships with
Public Entities in
support of
Ministerial Projects
Annually 7 2 2 2 1
2.2. Reconciling performance targets with the Budget and MTEF
Table 2: Programme name: Skills Planning
Sub Programme: Expenditure outcome Adjusted
appropriation
Medium term expenditure estimate
R’000 R’000
NO DESCRIPTION 2013/14 2014/15 2015/16 2016/17 2017/18 2018/19 2019/20 2020/21
1 Research 241 452 782 1 383 925 1 383 1 383 1 459
2 Reporting - - - - - - -
3 Mandatory Grants 50 815 42 857 49 704 57 656 61 733 57 817 68 562 72 333
4 Agricultural leadership capacity - - - 2 088 1 358 1630 1 630 1 720
5 Public entity partnership development
- - - 9 250 9 267 9 250 8 088 8 533
7.5% Project Management 4 140 3 512 4 093 5 706 5 942 5 682 6 459 6 814
Total programme budget 55 196 46 821 54 579 76 083 79 225 75 762 86 122 90 859

31
2.3. Performance and expenditure trends
Research
The priority for the research sub-programme within the MTEF for 2018 will be to establish and strengthen internal research capacity
through additional human capital and to re-structure and capacitate the Sector Skills Committee’s to inform the AgriSETA planning
process
Reporting
Within this MTEF the reporting sub-programme will focus on strengthening internal monitoring and verification processes to ensure
that credible and reliable information is reported that further enhancing the SETAs capacity to use internal data for planning purposes
Mandatory Grants
During this MTEF this sub-programme will focus on strengthening data collection through the WSP/ATR process and to increase the
current base of employers participating in the mandatory grant process
Agricultural Leadership capacity
The expenditure focus for this period will be on the development of new and emerging farmers and governance capacity of the
AgriSETA accounting Authority
Public entity partnership development
The expenditure for this reporting period will focus on the establishment of research activities within the Agricultural sector and to
support Agricultural structures to improve service delivery.
32
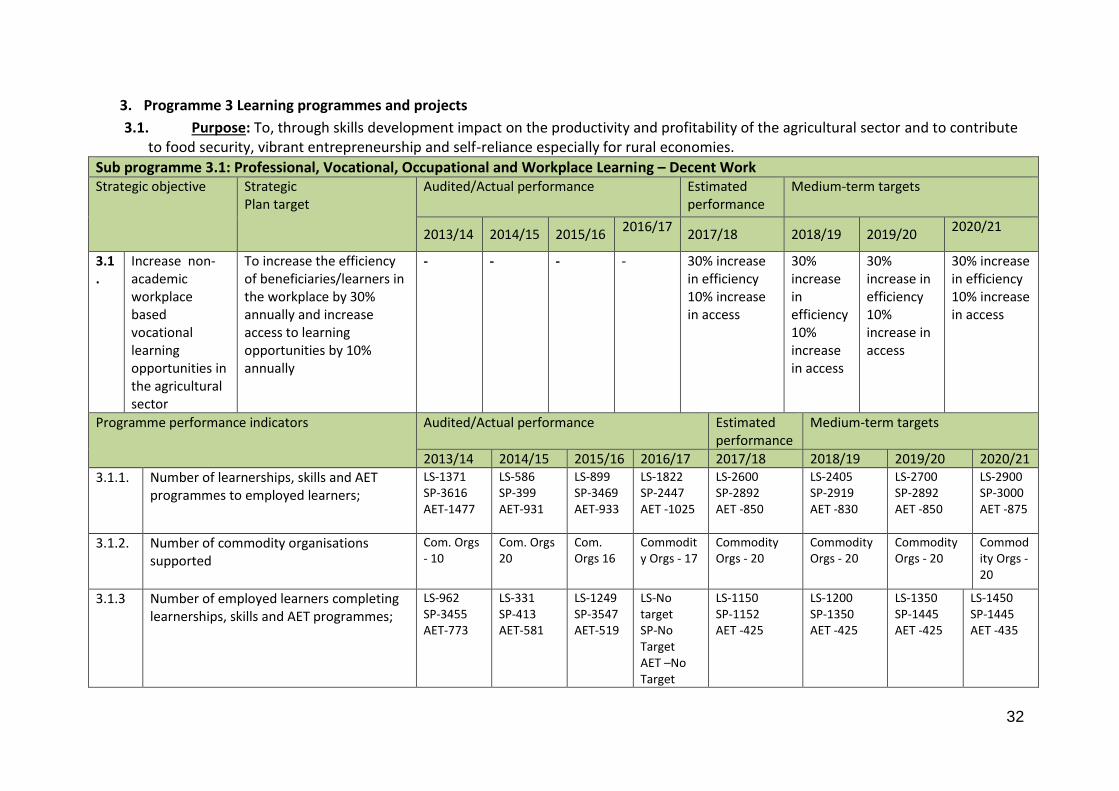
3. Programme 3 Learning programmes and projects
3.1. Purpose: To, through skills development impact on the productivity and profitability of the agricultural sector and to contribute to food security, vibrant entrepreneurship and self-reliance especially for rural economies.
Sub programme 3.1: Professional, Vocational, Occupational and Workplace Learning – Decent Work Strategic objective Strategic
Plan target Audited/Actual performance Estimated
performance Medium-term targets
2013/14 2014/15 2015/16 2016/17
2017/18 2018/19 2019/20 2020/21
3.1.
Increase non-academic workplace based vocational learning opportunities in the agricultural sector
To increase the efficiency of beneficiaries/learners in the workplace by 30% annually and increase access to learning opportunities by 10% annually
- - - - 30% increase in efficiency 10% increase in access
30% increase in efficiency 10% increase in access
30% increase in efficiency 10% increase in access
30% increase in efficiency 10% increase in access
Programme performance indicators Audited/Actual performance Estimated performance
Medium-term targets
2013/14 2014/15 2015/16 2016/17 2017/18 2018/19 2019/20 2020/21
3.1.1.
Number of learnerships, skills and AET programmes to employed learners;
LS-1371 SP-3616 AET-1477
LS-586 SP-399 AET-931
LS-899 SP-3469 AET-933
LS-1822 SP-2447 AET -1025
LS-2600 SP-2892 AET -850
LS-2405 SP-2919 AET -830
LS-2700 SP-2892 AET -850
LS-2900 SP-3000 AET -875
3.1.2. Number of commodity organisations supported
Com. Orgs - 10
Com. Orgs 20
Com. Orgs 16
Commodity Orgs - 17
Commodity Orgs - 20
Commodity Orgs - 20
Commodity Orgs - 20
Commodity Orgs - 20
3.1.3 Number of employed learners completing learnerships, skills and AET programmes;
LS-962 SP-3455 AET-773
LS-331 SP-413 AET-581
LS-1249 SP-3547 AET-519
LS-No target SP-No Target AET –No Target
LS-1150 SP-1152 AET -425
LS-1200 SP-1350 AET -425
LS-1350 SP-1445 AET -425
LS-1450 SP-1445 AET -435
33
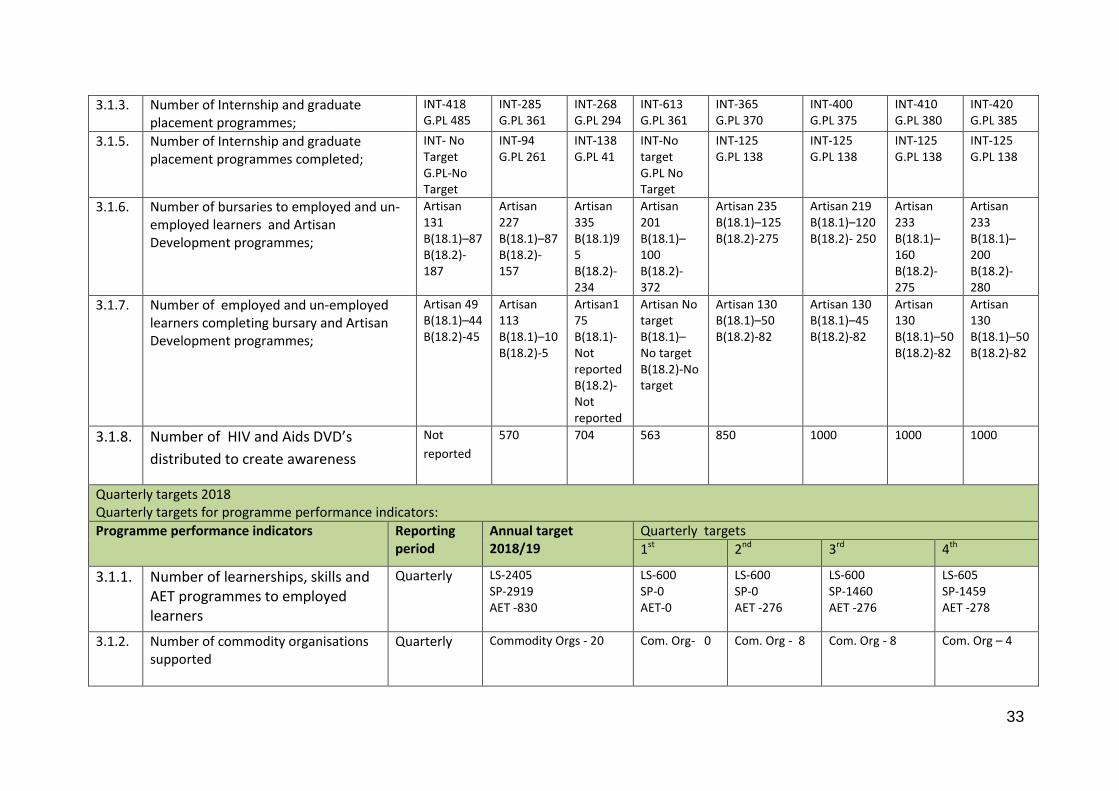
3.1.3. Number of Internship and graduate placement programmes;
INT-418 G.PL 485
INT-285 G.PL 361
INT-268 G.PL 294
INT-613 G.PL 361
INT-365 G.PL 370
INT-400 G.PL 375
INT-410 G.PL 380
INT-420 G.PL 385
3.1.5. Number of Internship and graduate placement programmes completed;
INT- No Target G.PL-No Target
INT-94 G.PL 261
INT-138 G.PL 41
INT-No target G.PL No Target
INT-125 G.PL 138
INT-125 G.PL 138
INT-125 G.PL 138
INT-125 G.PL 138
3.1.6. Number of bursaries to employed and un-employed learners and Artisan Development programmes;
Artisan 131 B(18.1)–87 B(18.2)-187
Artisan 227 B(18.1)–87 B(18.2)-157
Artisan 335 B(18.1)95 B(18.2)- 234
Artisan 201 B(18.1)–100 B(18.2)-372
Artisan 235 B(18.1)–125 B(18.2)-275
Artisan 219 B(18.1)–120 B(18.2)- 250
Artisan 233 B(18.1)–160 B(18.2)- 275
Artisan 233 B(18.1)–200 B(18.2)- 280
3.1.7. Number of employed and un-employed learners completing bursary and Artisan Development programmes;
Artisan 49 B(18.1)–44 B(18.2)-45
Artisan 113 B(18.1)–10 B(18.2)-5
Artisan175 B(18.1)-Not reported B(18.2)- Not reported
Artisan No target B(18.1)– No target B(18.2)-No target
Artisan 130 B(18.1)–50 B(18.2)-82
Artisan 130 B(18.1)–45 B(18.2)-82
Artisan 130 B(18.1)–50 B(18.2)-82
Artisan 130 B(18.1)–50 B(18.2)-82
3.1.8. Number of HIV and Aids DVD’s
distributed to create awareness
Not
reported
570 704 563 850 1000 1000 1000
Quarterly targets 2018 Quarterly targets for programme performance indicators:
Programme performance indicators Reporting period
Annual target 2018/19
Quarterly targets
1st 2nd 3rd 4th
3.1.1.
Number of learnerships, skills and AET programmes to employed learners
Quarterly LS-2405 SP-2919 AET -830
LS-600 SP-0 AET-0
LS-600 SP-0 AET -276
LS-600 SP-1460 AET -276
LS-605 SP-1459 AET -278
3.1.2. Number of commodity organisations supported
Quarterly Commodity Orgs - 20 Com. Org- 0 Com. Org - 8 Com. Org - 8 Com. Org – 4

34
3.1.3 Number of employed learners completing learnerships, skills and AET programmes;
Quarterly LS-1200 SP-1350 AET -425
LS-300 SP-0 AET-0
LS-300 SP-0 AET -0
LS-300 SP-675 AET -212
LS-300 SP-675 AET -213
3.1.4. Number of Internship and graduate placement programmes;
Quarterly INT-400 G.PL 365
0 INT-200 GPL-200
INT-100 GPL-120
INT-100 GPL- 45
3.1.5 Number of Internship and graduate placement programmes completed;
Quarterly INT-125 G.PL 138
INT-0 G.PL-0
INT-0 G.PL -0
INT-62 G.PL 69
INT-63 G.PL 69
3.1.6. Number of bursaries to employed and un-employed learners and Artisan Development programmes;
Quarterly Artisan 219 B(18.1)–120 B(18.2)- 250
Artisan- 60 B(18.1)–0 B(18.2)-0
Artisan- 60 B(18.1)–40 B(18.2)-70
Artisan- 60 B(18.1)–40 B(18.2)-100
Artisan- 39 B(18.1)–40 B(18.2)-80
3.1.7. Number of employed and un-employed learners completing bursary and Artisan Development programmes;
Quarterly Artisan 130 B(18.1)–45 B(18.2)-82
Artisan 0 B(18.1)–0 B(18.2)-0
Artisan 43 B(18.1)–0 B(18.2)-0
Artisan 43 B(18.1)–0 B(18.2)-0
Artisan 44 B(18.1)–45 B(18.2)-82
3.1.8. Number of HIV and Aids DVD’s
distributed to create awareness
Quarterly 1000 0 350 600 50

35
Sub programme 3.2. Rural Development
Strategic objective Strategic Plan target
Audited/Actual performance Estimated performance
Medium-term targets
2013/14 2014/15 2015/16 2016/17 2017/18 2018/19 2019/20 2020/21
3.2.
Increased governance and skills levels of NLPE to create stability and an environment for economic growth.
To increase the governance of NLPE’s by 20% and skills levels of beneficiaries with 30% annually.
- - - - 20% increase
in governance
and 30%
increase in
skills levels of
unemployed
beneficiaries
20% increase in governance and 30% increase in skills levels of unemployed beneficiaries
20% increase in governance and 30% increase in skills levels of unemployed beneficiaries
20% increase in governance and 30% increase in skills levels of unemployed beneficiaries
Programme performance indicators Audited/Actual performance Estimated performance
Medium-term targets
2013/14 2014/15 2015/16 2016/17 2017/18 2018/19 2019/20 2020/21
3.2.1.
Number of Learnership, Skills programmes for unemployed learners and support to Rural structures
LS – 1741 SP – 5189 Mentor’s-Not reported
LS – 797 SP –1821 Mentor’s - 30
LS – 1263 SP –1651 Mentor’s - 24
LS – 1258 SP – 3258 Mentor’s - 48
LS – 1900 SP – 3900 Mentor’s 30
LS – 2000 SP – 2667 Mentor’s – 30
LS – 2150 SP – 3000 Mentor’s - 35
LS – 2300 SP – 3440 Mentor’s - 40
3.2.2.
Number of unemployed learners completing Learnership and Skills programmes
LS – 125 SP – 3104
LS – 22 SP – Not reported
LS – 470 SP –Not reported
LS – No Target SP – No Target
LS – 768 SP – 1750
LS – 800 SP – 2280
LS – 840 SP – 2600
LS – 900 SP – 3000
3.2.3. Number of learners entering new venture creation programmes
Not reported
30 50 27 60 64 70 75
3.2.4. Number of learners completing new venture creation programmes
No target No target 35 No target set
40 45 50 55
36
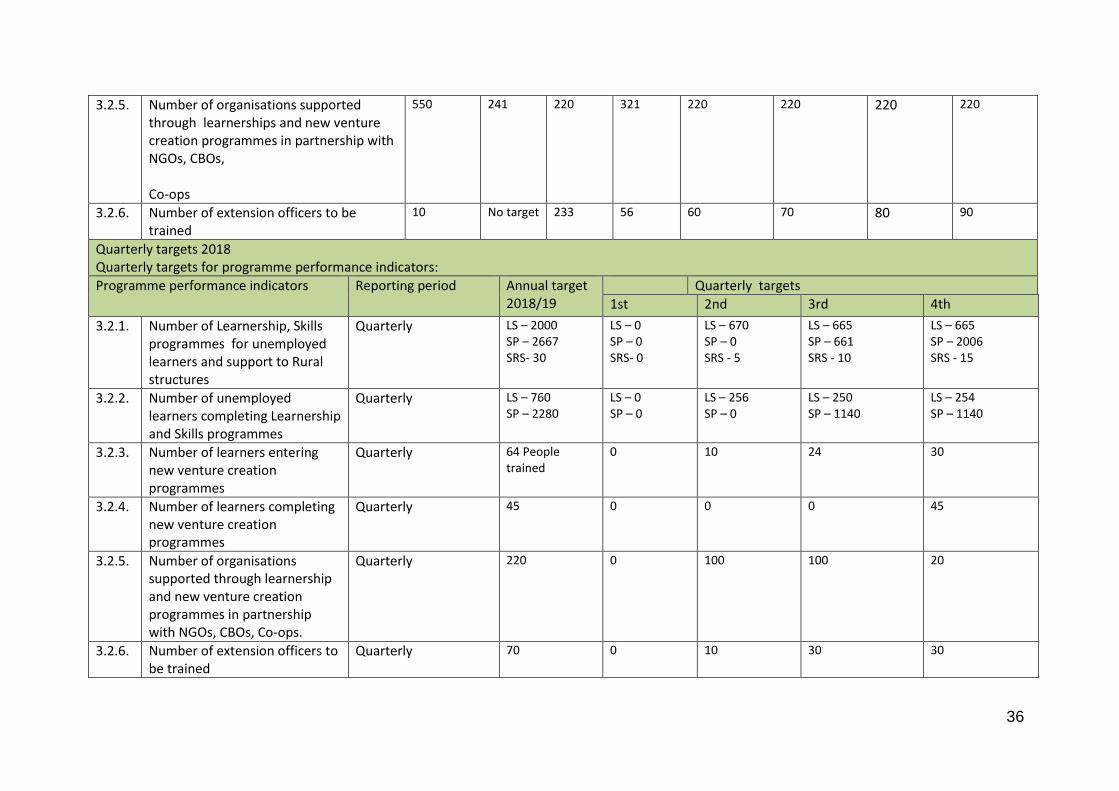
3.2.5. Number of organisations supported through learnerships and new venture creation programmes in partnership with NGOs, CBOs, Co-ops
550 241 220 321 220 220 220 220
3.2.6. Number of extension officers to be trained
10 No target 233 56 60 70 80 90
Quarterly targets 2018 Quarterly targets for programme performance indicators:
Programme performance indicators Reporting period Annual target 2018/19
Quarterly targets
1st 2nd 3rd 4th
3.2.1.
Number of Learnership, Skills programmes for unemployed learners and support to Rural structures
Quarterly LS – 2000 SP – 2667 SRS- 30
LS – 0 SP – 0 SRS- 0
LS – 670 SP – 0 SRS - 5
LS – 665 SP – 661 SRS - 10
LS – 665 SP – 2006 SRS - 15
3.2.2.
Number of unemployed learners completing Learnership and Skills programmes
Quarterly LS – 760 SP – 2280
LS – 0 SP – 0
LS – 256 SP – 0
LS – 250 SP – 1140
LS – 254 SP – 1140
3.2.3. Number of learners entering new venture creation programmes
Quarterly 64 People trained
0 10 24 30
3.2.4. Number of learners completing new venture creation programmes
Quarterly 45 0 0 0 45
3.2.5. Number of organisations supported through learnership and new venture creation programmes in partnership with NGOs, CBOs, Co-ops.
Quarterly 220 0 100 100 20
3.2.6. Number of extension officers to be trained
Quarterly 70 0 10 30 30
37
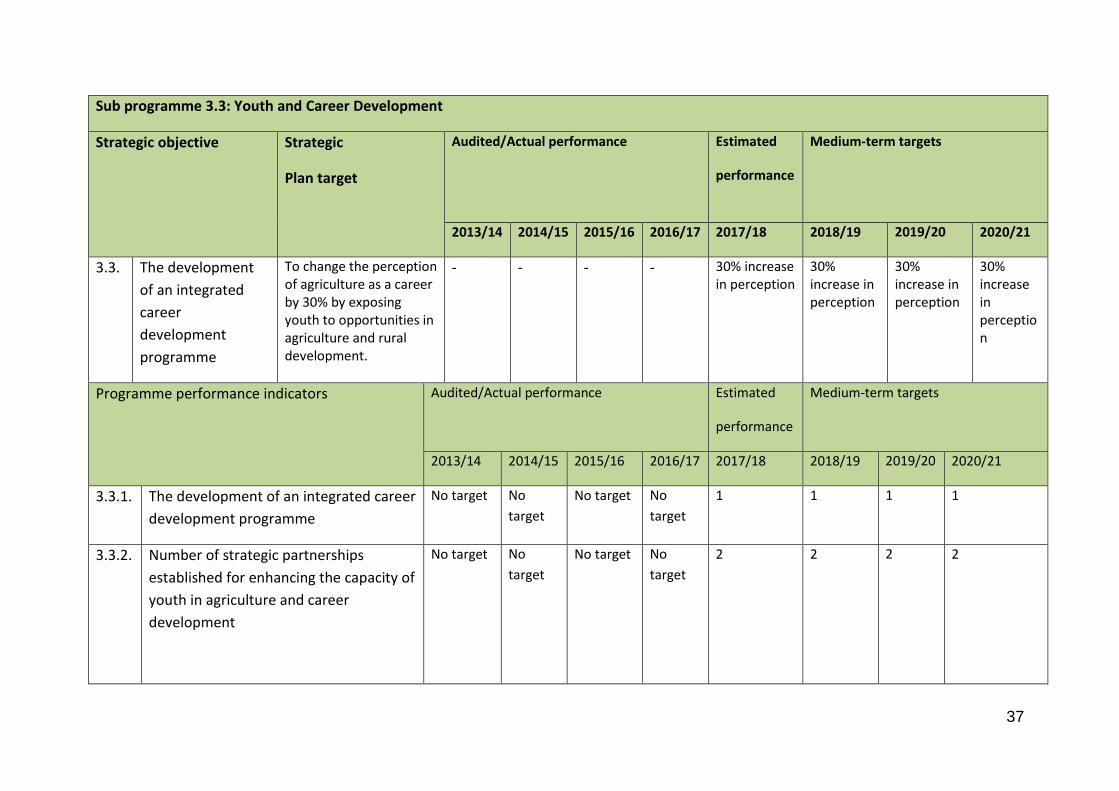
Sub programme 3.3: Youth and Career Development
Strategic objective Strategic
Plan target
Audited/Actual performance Estimated
performance
Medium-term targets
2013/14 2014/15 2015/16 2016/17 2017/18 2018/19 2019/20 2020/21
3.3.
The development
of an integrated
career
development
programme
To change the perception of agriculture as a career by 30% by exposing youth to opportunities in agriculture and rural development.
- - - - 30% increase in perception
30% increase in perception
30% increase in perception
30% increase in perception
Programme performance indicators Audited/Actual performance Estimated
performance
Medium-term targets
2013/14 2014/15 2015/16 2016/17 2017/18 2018/19 2019/20 2020/21
3.3.1. The development of an integrated career
development programme
No target No
target
No target No
target
1 1 1 1
3.3.2.
Number of strategic partnerships
established for enhancing the capacity of
youth in agriculture and career
development
No target No
target
No target No
target
2 2 2 2

38
3.3.3. Number of career exhibitions
attended, schools involved and
learners exposed
Expo’s
not
reported
16 Expo’s 8 Expo's 18 expo’s 15 x
Exhibit.
15 x Exhibit.
15 x Exhibit.
15 x Exhibit.
Schools not reported
Schools not reported
873 x schools
164 x schools
100 Schools
100 Schools
100 Schools
100 Schools
Not reported
Not reported
5 000 x
learners
exposed
28887 x
learners
exposed
5000x
learners
exposed
5000x
learners
exposed
5000x learners exposed
5000x
learners
exposed
Quarterly targets 2018 Quarterly targets for programme performance indicators:
Programme performance
indicators
Reporting period Annual target
2018/19
Quarterly targets
1st 2nd 3rd 4th
3.3.1. The development of an
integrated career
development programme
Annually 1 0 0 0 1
3.3.2. Number of strategic
partnerships established
for enhancing the capacity
of youth in agriculture and
career development
Annually 2 0 1 1 0
3.3.3. Number of career
exhibitions attended,
Quarterly 15 x Exhibit. 0 5 5 5
39
schools involved and
learners exposed
100 Schools
5000x learners
exposed
0
0
35
1500
35
1500
30
2000
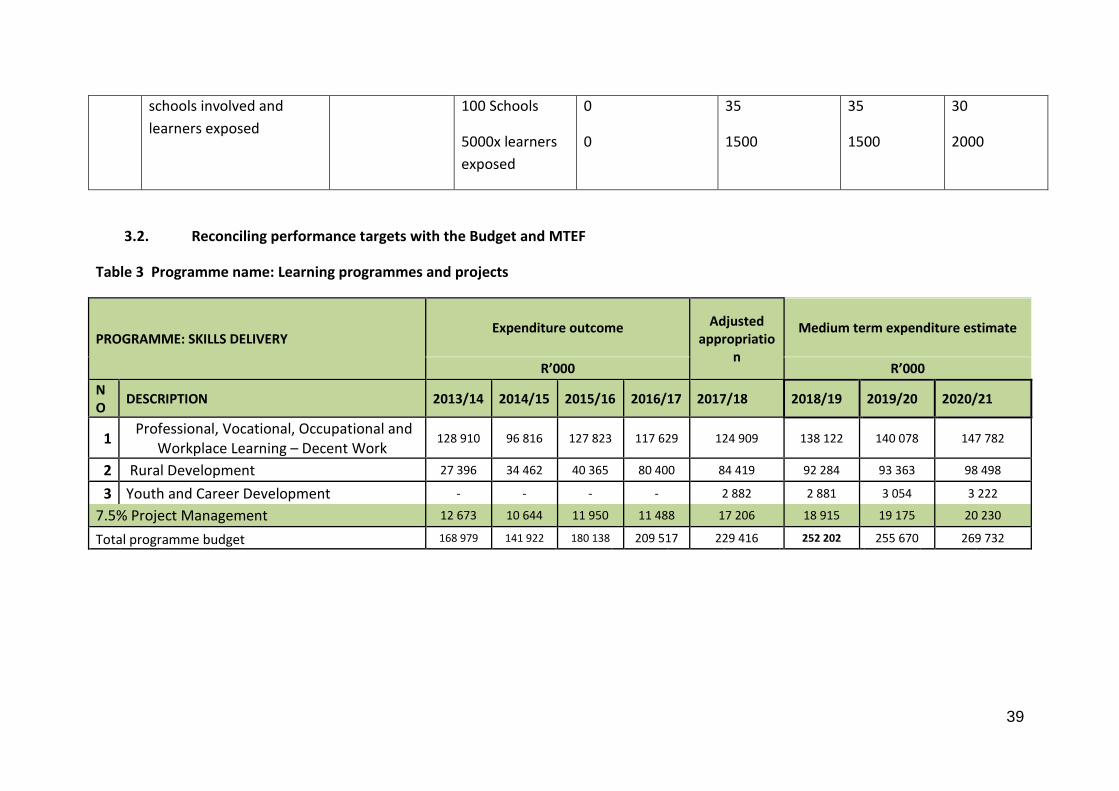
3.2. Reconciling performance targets with the Budget and MTEF
Table 3 Programme name: Learning programmes and projects
PROGRAMME: SKILLS DELIVERY Expenditure outcome Adjusted
appropriation
Medium term expenditure estimate
R’000 R’000
NO
DESCRIPTION 2013/14 2014/15 2015/16 2016/17 2017/18 2018/19 2019/20 2020/21
1 Professional, Vocational, Occupational and
Workplace Learning – Decent Work 128 910 96 816 127 823 117 629 124 909 138 122 140 078 147 782
2 Rural Development 27 396 34 462 40 365 80 400 84 419 92 284 93 363 98 498
3 Youth and Career Development - - - - 2 882 2 881 3 054 3 222
7.5% Project Management 12 673 10 644 11 950 11 488 17 206 18 915 19 175 20 230
Total programme budget 168 979 141 922 180 138 209 517 229 416 252 202 255 670 269 732

40
3.3. Performance and expenditure trends
Professional, Vocational, Occupational and Workplace Learning – Decent Work
The Sector Skills Plan for the 2018 period identified the development of higher level skills in the Agricultural sector as critical and
scarce, through Learnerships, Bursaries, internships this programme will provide opportunities for the development of these skills in
the Agricultural sector. This sub programme will ensure that the following Occupations amongst others, are addressed as identified in
the sector skills plan for 2018: Veterinarians, Agricultural scientists, Farm Managers, Agricultural produce inspectors, Agricultural
Engineers, Industrial Machinery Mechanic, Mobile plant operators, operations managers, mixed crop and livestock farm workers,
Research and development Managers and Agricultural consultants, implementation will be through Learnerships, skills, internships and
bursary programmes. The development of numeracy and literacy skills will also be prioritised to improve these basic level skills for
employees.
Rural Development
During this MTEF this sub-programme will continue to focus on the strengthening and support to youth and co-operative structures to
improve food security. Through new venture creation programmes and learnerships mentorship skills capacity will be built to mentor
new and up-coming farmers. The development extension services to farming enterprises are seen as a keen initiative to support
farmers and ensure longer term sustainability. The development of agricultural leadership will focus on providing the new and
emerging farmer with the required competencies to increase the knowledge base increasing competitiveness and improving the overall
sustainability of the emerging farming sector. This programme will again in this MTEF leverage on conditional grants to broaden the
AgriSETA’s impact in support to Rural structures.
This sub programme will ensure that the following Occupations amongst others are addressed as identified in the sector skills plan for
2018: Veterinarians, Agricultural scientists, Agricultural produce inspectors, Agricultural Engineers, Industrial Machinery Mechanic,
Mobile plant operators, mixed crop and livestock farm workers, implementation will be through Learnership and skills programmes.
Youth and career development-The priority within this sub-programme is to further expand on career development activities and to
focus on partnerships to implement an integrated career development strategy
41
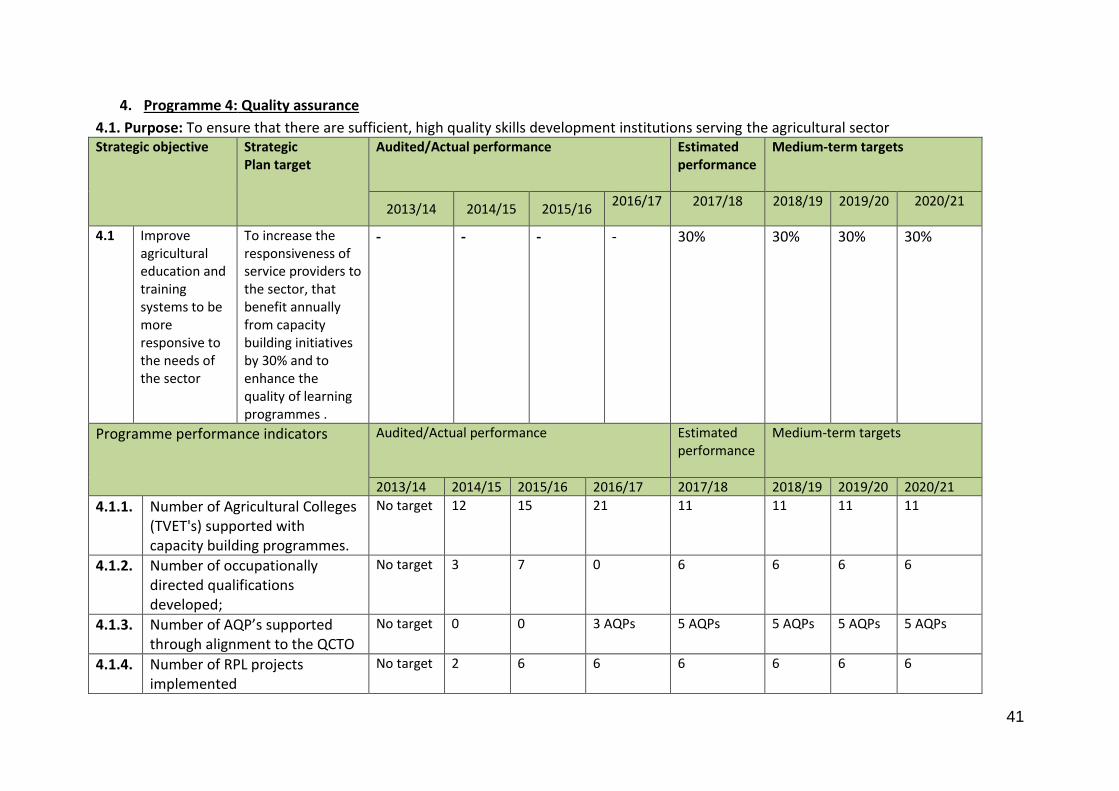
4. Programme 4: Quality assurance
4.1. Purpose: To ensure that there are sufficient, high quality skills development institutions serving the agricultural sector Strategic objective Strategic
Plan target Audited/Actual performance Estimated
performance
Medium-term targets
2013/14 2014/15 2015/16 2016/17 2017/18 2018/19 2019/20 2020/21
4.1 Improve agricultural education and training systems to be more responsive to the needs of the sector
To increase the responsiveness of service providers to the sector, that benefit annually from capacity building initiatives by 30% and to enhance the quality of learning programmes .
- - - - 30% 30% 30% 30%
Programme performance indicators Audited/Actual performance Estimated performance
Medium-term targets
2013/14 2014/15 2015/16 2016/17 2017/18 2018/19 2019/20 2020/21
4.1.1.
Number of Agricultural Colleges (TVET's) supported with capacity building programmes.
No target 12 15 21 11 11 11 11
4.1.2. Number of occupationally directed qualifications developed;
No target 3 7 0 6 6 6 6
4.1.3. Number of AQP’s supported through alignment to the QCTO
No target 0 0 3 AQPs 5 AQPs 5 AQPs 5 AQPs 5 AQPs
4.1.4. Number of RPL projects implemented
No target 2 6 6 6 6 6 6
42
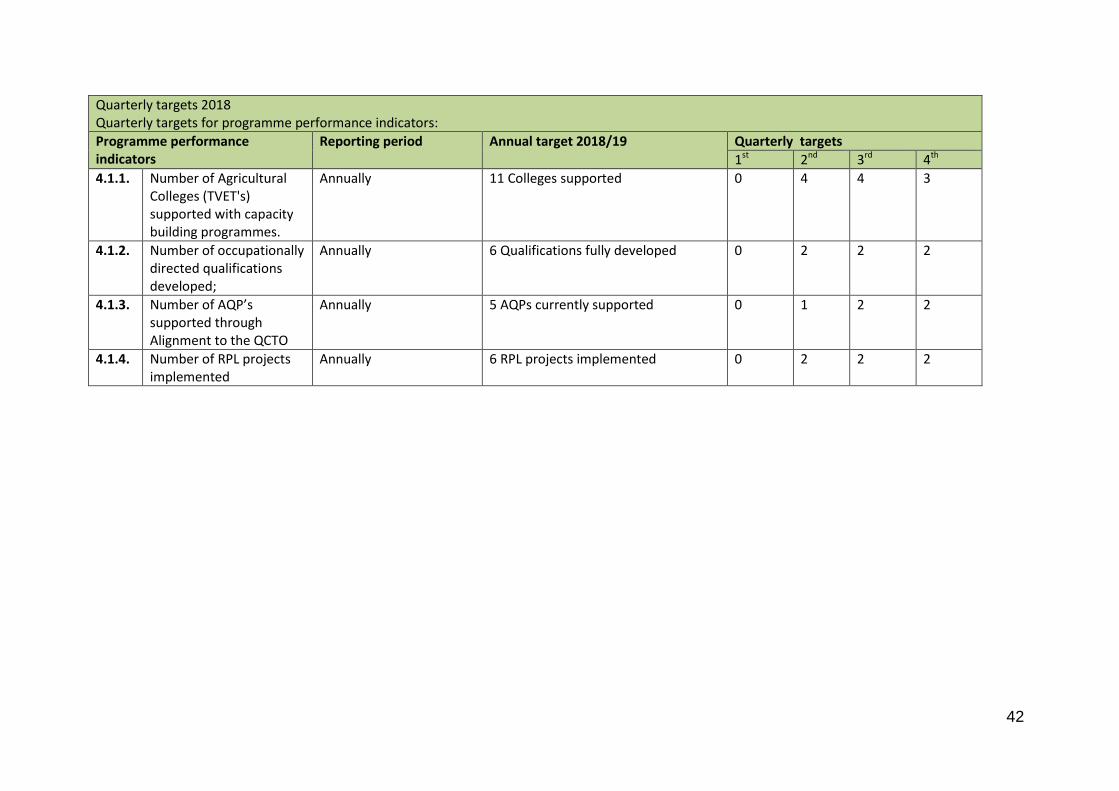
Quarterly targets 2018 Quarterly targets for programme performance indicators:
Programme performance indicators
Reporting period Annual target 2018/19 Quarterly targets
1st 2nd 3rd 4th
4.1.1.
Number of Agricultural Colleges (TVET's) supported with capacity building programmes.
Annually 11 Colleges supported 0 4 4 3
4.1.2. Number of occupationally directed qualifications developed;
Annually 6 Qualifications fully developed 0 2 2 2
4.1.3. Number of AQP’s supported through Alignment to the QCTO
Annually 5 AQPs currently supported 0 1 2 2
4.1.4. Number of RPL projects implemented
Annually 6 RPL projects implemented 0 2 2 2
43
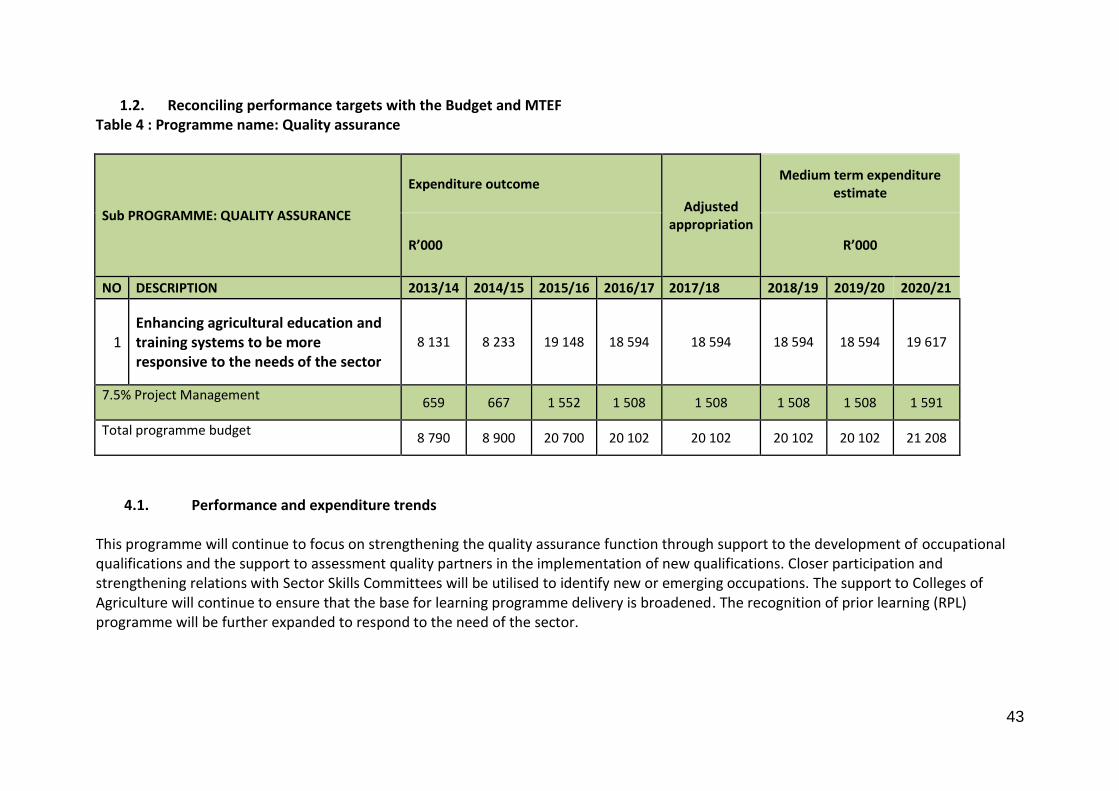
1.2. Reconciling performance targets with the Budget and MTEF Table 4 : Programme name: Quality assurance
Sub PROGRAMME: QUALITY ASSURANCE
Expenditure outcome
Adjusted appropriation
Medium term expenditure estimate
R’000 R’000
NO DESCRIPTION 2013/14 2014/15 2015/16 2016/17 2017/18 2018/19 2019/20 2020/21
1 Enhancing agricultural education and training systems to be more responsive to the needs of the sector
8 131 8 233 19 148 18 594 18 594 18 594 18 594 19 617
7.5% Project Management 659 667 1 552 1 508 1 508 1 508 1 508 1 591
Total programme budget 8 790 8 900 20 700 20 102 20 102 20 102 20 102 21 208
4.1. Performance and expenditure trends This programme will continue to focus on strengthening the quality assurance function through support to the development of occupational qualifications and the support to assessment quality partners in the implementation of new qualifications. Closer participation and strengthening relations with Sector Skills Committees will be utilised to identify new or emerging occupations. The support to Colleges of Agriculture will continue to ensure that the base for learning programme delivery is broadened. The recognition of prior learning (RPL) programme will be further expanded to respond to the need of the sector.

44
Part C: Links to other plans
5. Links to the long-term infrastructure and other capital plans
No Long term infrastructure or capital plans
6. Conditional grants
The AgriSETA’s levy base is relatively small in relation to the need expressed for funding of learning interventions annually. The cross subsidization of capacity building programmes and the collaborative approach taken by AgriSETA broadens the impact of projects. The table below reflects the conditional grants currently active:
No. Name of Grant Purpose Performance Indicator
Continuation Motivation
1 Department of Labour (UIF)
Provision of skills to cooperatives and UIF beneficiaries and providing Training Lay-off support to distressed employers
4000 Skills Programmes
Yes The current economic conditions in the sector (drought and climate change) severely affected most farmers and the request for relieve through TLS is dire, the number of UIF beneficiaries to be assisted through skills development is still huge.
2 Limpopo IDFC Nguni cattle Development Trust
Provision of mentorship support to the Nguni Cattle farmers in Limpopo.
40 livestock farmers will benefit from the programme
Yes The need to capacitate indigenous livestock owners with the required skills in order to develop a scientific breeding, pasture and vaccination programmes in line with industry norms
3 Department of Rural Development (Eastern Cape)
Provision of mentorship programmes to beneficiaries
50 farmers will benefit directly from the programme
Yes The programme will ensure that the programme remains sustainable in the medium term

45
6.2. Public entities
No. Name of Public Entity Mandate Output Current Annual Budget
Date of Evaluation
1 Department of Rural Development and Land Reform Gauteng
Rural Development
Training, infrastructure support, and linkages.
R400 000 Annually-March 2018
2 Polokwane Local Municipality
Rural Development
Governance, Enterprise Development and Technical training
R400 000 Annually-March 2018
3 Regional Land Claims Commission (KZN)
Rural Development
Training, infrastructure support, and linkages.
R400 000 Annually-March 2018
4 North-West Department of Rural Development and Land Reform
Rural Development
Training, infrastructure support, and linkages.
R400 000 Annually-March 2018
5 Polokwane Local Municipality
Rural Development
Training, infrastructure support, and linkages.
R400 000 Annually-March 2018
6 Land Claims Commission Limpopo
Rural Development
Training, infrastructure support, and linkages.
R400 000 Annually-March 2018
7 Department of Rural Development (Eastern Cape)
Rural Development
Training, infrastructure support, and linkages.
R314 005 Annually-March 2018
7. Public entities
AgriSETA recognises the importance of partnerships to achieve implementation of the Sector
strategy. Over a number of years the SETA has worked with various sector stakeholders to
implement skills development projects. Some projects are of a short term nature, but many have
developed into medium term collaborations that have organically evolved into more meaningful
longer term partnerships. This section is in two parts: the one dealing with existing partnerships,
setting out their focus and scope; the second setting out a strategy for the development of new
partnerships during the period 2015-2020.

46
7.1. Current partnerships
Department of Rural Development and Land Reform Gauteng
AgriSETA has funded emerging farmers through a budget of R400 000. These farmers were
supported by the DRDLR through inputs for production as well as farm capital infrastructure. In total
8 farmers will benefit from the programme. The project will be reviewed and success factors
evaluated to extend the project into the next financial year.
Polokwane Local Municipality
A funding of R 400 000 was approved by AgriSETA to assist farmers to be settled on the
municipality’s farm. In total 4 farmers will benefit directly from the project. The proposed
intervention covers areas such as Governance Training, Enterprise Development and Technical
Training which focus on AgriSETA’s PIVOTAL programmes. The project will be continued based on an
evaluation of the current year project.
Regional Land Claims Commission (KZN)
Funding of R 400 000 was approved by AgriSETA to land restitution projects as identified by the Land
Claims Commission in KZN. A total of 8(eight) land restitution projects have been identified to be
supported through mentorship programmes and capacity development programmes in governance
and general management to ensure compliance to the Communal Property Association Act. The
project will be continued based on an evaluation of the agreed deliverables.
North-West Department of Rural Development and Land Reform
AgriSETA in partnership with North-West Department of Rural Development and Land Reform
approved a mentorship programme in the North West Province. One farming enterprise will benefit
directly from the partnership. An amount of R400 000 has been approved for this project with the
expectation to extend the project into the next financial year.
Land Claims Commission Limpopo
AgriSETA entered into a partnership with the Land Claims Commission in Limpopo. The project will
focus on mentorship support and a budget to the value of R400 000 was approved. This support
programme will be geared towards the Gagesho farming project. This project was approved for
support by AgriSETA after it received Recapitalisation and Development funding from the Land
Claims Commission to the value of R3 000 000. One owner and six full time employees will benefit
from the project. The project after evaluation is expected to be extended based on the success of
the intervention.
47
7.2. Planned Partnerships
Youth
The National Rural Youth Service Corps (NARYSEC) has as its focus to develop rural youth. In a joint
project some 470 young people have been provided access to agricultural training. This is an
important project as it aims to motivate and incentivise young people to work on the land and
thereby have a stake in their rural communities rather than gravitate to the towns. It is unclear at
this stage how successful the project has been. On the basis of a review the DRDLR and the SETA will
determine whether to take the project forward in the longer term.
Limpopo Department of Agriculture
AgriSETA in partnership with the Limpopo Department of Agriculture will focus on the support to the
Comprehensive Agricultural Support Programme (CASP), Revitalisation of Agriculture and Agro-
processing value Chain (RAAVC). This partnership is conceptualised in line with the NDP nine point
plan given context in the Operation Phakisa programme for Agriculture and Land Reform.
Mining Development Agency and UIF
AgriSETA in partnership with the Mining Development Agency and the UIF will focus on supporting
skills development in mining communities interested in agriculture. The project will further focus of
employees that were laid off in the mining sector. The project will be driven through a co-funded
model in partnership with UIF, AgriSETA and MDA.
Agricultural and TVET colleges
Whilst there is no formal partnership in place, there has been a strategy developed in the sector and
which informs a range of projects that need to be developed into a formal set of partnerships. The
strategy is one of building the capabilities of the 11 Agricultural Colleges to deliver occupational
qualifications to the sector. These colleges are in the process of being transferred from DAFF to
DHET. There are a number of challenges that need to be addressed including funding models for
programmes required in the sector, neglected infrastructure and equipment and the difficulty in
establishing long term plans during a transitional period. The establishment of a formal partnership
requires engagement with both the Departments (DAFF and DHET) and the SETA will initiate these
discussions. It also requires engagement with the CEOs of the colleges and their umbrella body the
Association of Principals for Agricultural Colleges (APAC).
Working with the 11 colleges does not imply a neglect of either TVET colleges or universities but
rather an acceptance that there are specialist colleges that have their own working farms and a long
tradition of developing farm managers, and that this sector resource must be valued and retained.
The SETA will work with universities to provide support to the 11 colleges and with the TVET colleges
to identify learners in agricultural programmes who can be drawn into Agricultural college

48
programmes and work experience opportunities. Certain public TVET colleges that have invested in
farms and trainers will also be partnered, but there are few (such as the Waterberg College).
There are a number of components of the planned partnership with Agricultural colleges, interested
universities and selected TVET colleges. These are:
Developing a model of career-pathing between TVET and university. This is being piloted
between Waterberg TVET College and the University of Limpopo where 30 learners are being
assisted through an articulation and career path programme that takes them from FET level
college programmes to university farm management programmes. If the pilot is effective it could
be the basis of a longer term partnership and could be replicated in other areas of the country.
There is a similar pilot with the University of Mpumalanga to assist the learners who were in the
agricultural colleges to get into university. The focus is farmer development programmes -
develop a person who can do farming. Traditionally the Agricultural colleges were playing that
role but have lost capacity. The aim is to forge partnerships that will re-establish the colleges as
suppliers of farm and agri-business managers and technicians.
Another pilot is for RPL with Glen College of Agriculture (Free State). Ten learners are being put
through an RPL process. The SETA has developed tools, identified advisors and mentors and has
done work with the college on qualification. This is currently for a level 1 plant production
programme but could be expanded to other qualifications and extended to other colleges. The
aim is to support agricultural workers to gain higher level skills by recognising existing skills and
experience and enabling them to access higher level programmes.
Capacity building of lecturers. The SETA supports lecturers to attend University-based educator
programmes - advanced courses, training competence, Masters degrees, etc. There will also be a
need to expand the opportunities for lecturers to include real work experience in established
agri-businesses.
The SETA assists the Colleges with learning material, curriculum and the alignment of
programmes to the needs of local agri-businesses. Local needs can vary from goat farming in
parts of the Eastern Cape to Sugar in KZN and fruit growing in the Western Cape. It is important
to develop the capacity of colleges in line with the industry needs in the locality.
Mentoring and other interventions. In some colleges there is the capacity to provide mentoring
services and colleges can participate if that capacity is in place.
Support to local cooperatives as part of Farm Together. Establishing the colleges to support
cooperative farm managers rather than focusing entirely on lower level technical skills.
Working with industry bodies to identify agri-businesses and commodity associations to sit on
governance structures. Part of rebuilding Agricultural College capacity will be to strengthen their
boards and governance.
Mentoring partnerships
49
One of the key strategic interventions of the AgriSETA is to incentivise mentoring of emergent
agribusinesses and farms by established businesses in the sector. This has been very successful
where it has been put in place. There are a number of companies and institutions that have been
effective in the delivery of mentoring and it may be sensible for the SETA to enter into longer term
partnerships so as to build sustainable networks of support to emergent farmers.
SETA partnerships
The AgriSETA is committed to supporting skills development along value chains. The intention is to
ensure that not only is there capacity built in the sector but that the broader rural economy
(including non-agricultural industries and services are also strengthened. There is a need for various
government programmes to support each other and support local economic development. If skills
development support from the AgriSETA is aligned to other interventions a wider and more
substantial impact could be achieved. During the next five years AgriSETA will aspire to engage a
number of SETAs in areas of common interest such as:
Foodbev: There are a number of secondary agricultural industries that share skills needs with
industries located in the food and beverages sector. There are overlaps in relation to produces in
the citrus fruit and wine industries and a need to develop a set of skills interventions that
recognised the need for a more coordinated approach to beneficiation (i.e. the production of
fruit products from fruit).
FPM SETA: The FPM SETA is engaged with Forestry, a responsibility of DAFF. There are common
skills needs between Agriculture and Forestry, including the need for effective extension
services. The two SETAs need to work together on such services. There are a number of
secondary production processes that fall between the two SETAs, including leather, hemp,
cotton, and new industries such as the Eastern Cape goats hair initiative. A joint approach is
needed to work in these industries, so as to maximise the potential for job creation.
W&R SETA: In working with cooperatives one of the most difficult challenges is access to
markets. The logical market is supermarkets located in the Wholesale and Retail sector. There is
a trend of established farmers supplying supermarkets directly and forming direct relationships
rather than trading through intermediaries. A partnership approach whereby cooperatives
contracted to supply produce to a supermarket is provided with training from AgriSETA needs to
be explored.
H&W SETA: A serious skills shortage in the sector is animal health. Many qualified Vets are
located in towns and equity is a challenge. Veterinary schools are located in the H&W sector.
The needs of animals are most keenly understood in the Agri sector. The SETAs need to focus on
not only vets, but also animal health technicians and nurses. The partnership could include para-
professionals.
Green Industry Partnership
There will be research conducted as part of the revision of the current Sector Skills Plan to identify
new industries that need to be supported with skills development. This is in line with the SETA’s
commitment to not only support established businesses but to help nurture new ones. Some of the

50
industries might be categorised as Green Industries or industries responding to market changes
emanating from the sustainable development policies and strategies being pursued. One possible
set of industries involves organic farms. This type of farming has the potential to expand local
produce for local markets and to expand employment beyond traditional farming businesses.
AgriSETA will explore possible partnerships to provide support on a sustainable basis to viable Green
business initiative that show potential for job creation.
7.3. Partnership-related challenges
There are a number of challenges that have been experienced in establishing and or maintaining the
current partnerships referred to above. The first relates to levels of bureaucracy internally that can
disrupt and hinder project initiation and delivery. A second challenge relates to limited AgriSETA
project management staff that puts strain on existing capacity. Finally, adequate funding to ensure
project sustainability beyond the life cycle of the project is challenging.
The AgriSETA is involved in a number of key partnerships linked to skills development for land
reform beneficiaries, youth skills development in rural areas and the development of agricultural
cooperatives. Key, planned partnerships include increased collaboration and joint initiatives with
other SETAs such as FoodBev as part of a coordinated approach to beneficiation across the value
chain. There are also pilot projects being initiated in Recognition of Prior Learning (RPL) at Glen
College in the Free State and one on articulation between Waterberg TVET College and the
University of Limpopo.
8. Public-private partnerships
No partnership exist with a public entity
51
Annexure A: Technical Indicator Descriptor

52
Programme 1: Administration
Sub-programme 1.1 : Finance
Strategic objective 1.1.
Indicator title 1.1. To reduce the internal control deficiencies reported in the previous AG report by 10%
Short definition To reduce the internal control deficiencies reported in the previous AG report by 10%
Purpose/importance The finance function is a support function that enables the SETA to execute its mandate.
Source/collection of data AG report
Method of Calculation 10% reduction in control deficiencies if compared with the previous AG report. (Numerator-2018/19-2017/18 Control deficiencies , Denominator-control deficiencies 2017/18)
Data limitations Availability of AG report
Type of indicator Outcome
Calculation type Non-Cumulative
Reporting cycle Annually
New Indicator Yes
Desired Performance 10% reduction in control deficiencies
Indicator Responsibility Finance coordinator
Indicator title 1.1.1. Percentage of budget variances and adjustments reduced
Short definition Budget variances and adjustments must be kept to a minimum
Purpose/importance Budgeting must be done accurately to ensure that overall planning for projects can be implemented without a adjustment in targets .
Source/collection of data MTEF budgets and forecasts
Method of Calculation Percentage of budget variances presented to board year on year(Numerator-2018/19-2017/18, Denominator- number of budget variances 2017/18)
Data limitations Data limited to approved budgets
Type of indicator Outcome- with specific focus on completion of program
Calculation type Cumulative for the year
Reporting cycle Annually
New Indicator Yes
Desired Performance 10% reduction in annual budget adjustments
Indicator Responsibility Finance coordinator
Indicator title 1.1.2. 100% of invoices processed within PFMA
Short definition PFMA guidelines to be followed at all to ensure compliance
Purpose/importance PFMA guidelines forms backbone of financial management system
Source/collection of data Internal audit and midterm audit statements
Method of Calculation Audit findings raised(Numerator-Audit findings previous Quarter, Denominator-audit findings current Quarter)
Data limitations Availability of audit reports
Type of indicator Outcome
Calculation type Cumulative for the year

53
Reporting cycle Quarterly
New Indicator Yes
Desired Performance 100% compliance with PFMA regulations
Indicator Responsibility Finance coordinator/CFO
Indicator title 1.1.3. All service providers procured and managed within National Treasury guidelines
Short definition Procurement of service providers must follow guidelines of National Treasury to ensure compliance with legislation
Purpose/importance NT guidelines is an integral part of financial management and can lead to an audit qualification
Source/collection of data Audit statement from internal audit and auditor general
Method of Calculation Number of audit findings(Nominator number of findings in previous Quarter Denominator-Number of Audit findings in current Quarter)
Data limitations Availability of audit reports
Type of indicator Outcome-
Calculation type Non-Cumulative
Reporting cycle Quarterly
New Indicator Yes
Desired Performance 100% compliance
Indicator Responsibility Finance coordinator/CFO
Indicator title 1.1.4. Maintain an 90% verification rate with asset register
Short definition Variances on asset register must be kept to a minimum
Purpose/importance Asset management is an important finance function to assist with budgeting and planning
Source/collection of data Asset register
Method of Calculation Percentage of inconsistencies found in previous quarter compared with the current Quarter
Data limitations Up to date asset registers and audit reports
Type of indicator Outcome-
Calculation type Non-Cumulative
Reporting cycle Quarterly
New Indicator Yes
Desired Performance 90% verification rate with asset register year on year
Indicator Responsibility Finance coordinator/CFO

54
Indicator title 1.1.5. Collection rate of 90% of provincial levies
Short definition AgriSETA must ensure that the collection rate of levies is managed in a sustainable manner
Purpose/importance Levies contribute to AgriSETA’s overall available administrative funds thus ensuring optimal functionality of the SETA
Source/collection of data Financial statements
Method of Calculation Percentage calculation of levies collected and total receivable levies
Data limitations Availability of financial statements
Type of indicator Outcome
Calculation type Non-Cumulative
Reporting cycle Annually
New Indicator Yes
Desired Performance 90% collection rate on levies receiveable
Indicator Responsibility Financial coordinator/CFO
Sub- programme 1.2: Governance
Strategic objective 1.2.
Indicator title 1.2. To improve the governance function of the board by 15% annually
Short definition To improve the governance function of the board by 15% annually thus providing improved strategic direction to the organisation
Purpose/importance The strategic guidance of the board ensure that AgriSETA deliver on its mandate
Source/collection of data Survey to measure the governance function
Method of Calculation Baseline assessment compared with final assessment
Data limitations Availability data
Type of indicator Outcome
Calculation type Cumulative for the year
Reporting cycle Annually
New Indicator Yes
Desired Performance Governance function of the board increase by 15% annually
Indicator Responsibility Board administrator
Indicator title 1.2.1. Number of board meetings
Short definition Number and frequency of board and sub-committee meetings
Purpose/importance Provide strategic guidance to the organisation
Source/collection of data Minutes of meetings
Method of Calculation Number of meetings
Data limitations Availability of meetings
Type of indicator Outcome-
Calculation type Cumulative for the year
Reporting cycle Quarterly
New Indicator Yes
Desired Performance 4 board meetings
Indicator Responsibility Board administrator

55
Indicator title 1.2.2. Number of board subcommittee meetings
Short definition Number and frequency of board and sub-committee meetings
Purpose/importance Provide strategic guidance to the organisation
Source/collection of data Minutes of meetings
Method of Calculation Number of meetings
Data limitations Availability of meetings
Type of indicator Outcome-
Calculation type Cumulative for the year
Reporting cycle Annually
New Indicator Yes
Desired Performance 4 sub-committee meetings
Indicator Responsibility Board administrator
Indicator title 1.2.3. 10% increase in the quality of the information that the board receive from board sub-committees
Short definition 10% increase in the quality of the information that the board is given to make decisions
Purpose/importance The governance and oversight function is determined by the quality of information that is presented to the board
Source/collection of data Current year survey completed by board members
Method of Calculation Board members indicate through a survey that the quality of information that receive has improved by 10% (Nominator Pre survey % outcome, Denominator- Post survey % outcome)
Data limitations Accurate completed surveys
Type of indicator Outcome
Calculation type Cumulative for the year
Reporting cycle Annually
New Indicator Yes
Desired Performance 10% increase in the quality of the information that is submitted to board
Indicator Responsibility Board administrator
Sub programme 1.3: Information Technology(ICT)
Strategic objective 1.3.
Indicator title 1.3. To increase the responsiveness of the ICT solution by 10% annually
Short definition ICT solution is improved with 10% to respond to the needs of AgriSETA
Purpose/importance It is important that the ICT system is dynamic and can respond to the needs and growth of the AgriSETA
Source/collection of data Surveys completed by AgriSETA employees
Method of Calculation Respondents indicate an increase in the responsiveness of the ICT solution compared with the baseline assessment(Nominator Pre survey % outcome Denominator- Post survey % outcome)

56
Data limitations Accurate completion of surveys
Type of indicator Outcome
Calculation type Cumulative for the year
Reporting cycle Annually
New Indicator Yes
Desired Performance 10% increase in responsiveness of the ICT solution
Indicator Responsibility General Manager
Indicator title 1.3.1. 90% of all ICT (hard and software) related incidents resolved within 24 hours of first report.
Short definition ICT related incidents resolved within 24 hours
Purpose/importance The availability of ICT directly impacts on the performance of the SETA
Source/collection of data Data from ICT manager
Method of Calculation Numerator-number of reported incidents resolved in 24 h Denominator-total number of reported incidents.
Data limitations Availability of data
Type of indicator Outcome
Calculation type Cumulative for the year
Reporting cycle Quarterly
New Indicator Yes
Desired Performance 90% of all incidents resolved within 24 hours
Indicator Responsibility General Manager
Indicator title 1.3.2. ICT solution reviewed annually
Short definition ICT solution must be evaluated for enhancements and improvements annually
Purpose/importance The purpose of the review is to ensure that the current hardware and software is compliant with the needs of the SETA
Source/collection of data ICT steering committee’s annual review report
Method of Calculation Number of reports
Data limitations Availability of evaluation report
Type of indicator Outcome
Calculation type Non-cumulative
Reporting cycle Annually
New Indicator Yes
Desired Performance 1 ICT review report
Indicator Responsibility General Manager operations

57
Sub programme 1.4: Human Resources
Strategic objective 1.4.
Indicator title 1.4. To increase and maintain the level of employee satisfaction to 80% annually
Short definition To increase and maintain the level of employee satisfaction to 80% annually
Purpose/importance Employee satisfaction will be indicative the efficiency of the Human Resource function
Source/collection of data Survey completed by AgriSETA employees
Method of Calculation Baseline assessment compared with final assessment(Nominator positive response on Pre survey % outcome Denominator- Positive response on post survey % outcome)
Data limitations Objectivity and accuracy of the survey
Type of indicator Impact
Calculation type Cumulative for the year
Reporting cycle Annually
New Indicator Yes
Desired Performance 80% of employees are satisfied with the workplace
Indicator Responsibility HR Manager
Indicator title 1.4.1. 90% of employees participate in further career development
Short definition Employees are given the opportunity to develop professionally as employees of AgriSETA
Purpose/importance Employee development will impact positively on performance in the workplace
Source/collection of data HR training/ATR report
Method of Calculation Numerator-Number of employees participating in career development Denominator-total number of employees in AgriSETA
Data limitations Availability of data and actual start dates of training might run over financial years
Type of indicator Outcome
Calculation type Cumulative for the year
Reporting cycle Annually
New Indicator Yes
Desired Performance 90% of all employees participate in career development
Indicator Responsibility HR Manager
Indicator title 1.4.2. 90% of vacant positions filled
Short definition Critical vacant positions must be filled
Purpose/importance Vacant positions in the organisation must be filled to ensure operations are not impacted
Source/collection of data HR Quarterly report to Board
Method of Calculation Numerator- Number of positions filled Denominator- Number of approved positions
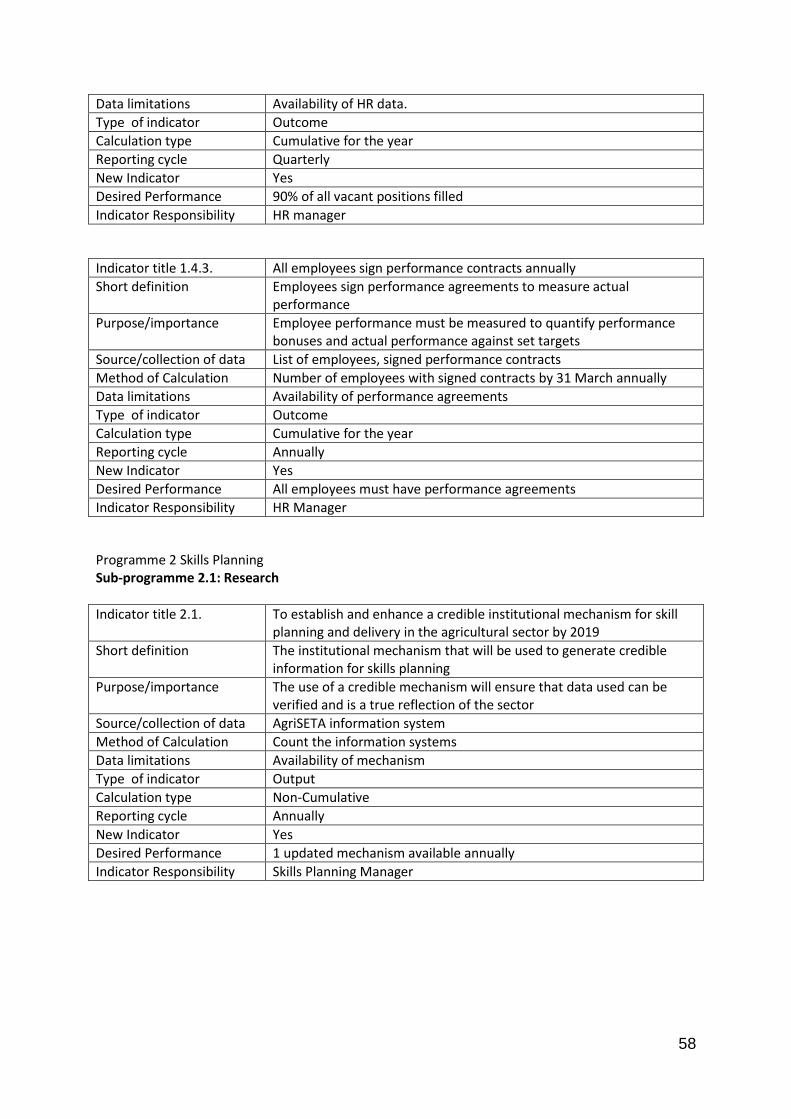
58
Data limitations Availability of HR data.
Type of indicator Outcome
Calculation type Cumulative for the year
Reporting cycle Quarterly
New Indicator Yes
Desired Performance 90% of all vacant positions filled
Indicator Responsibility HR manager
Indicator title 1.4.3. All employees sign performance contracts annually
Short definition Employees sign performance agreements to measure actual performance
Purpose/importance Employee performance must be measured to quantify performance bonuses and actual performance against set targets
Source/collection of data List of employees, signed performance contracts
Method of Calculation Number of employees with signed contracts by 31 March annually
Data limitations Availability of performance agreements
Type of indicator Outcome
Calculation type Cumulative for the year
Reporting cycle Annually
New Indicator Yes
Desired Performance All employees must have performance agreements
Indicator Responsibility HR Manager
Programme 2 Skills Planning Sub-programme 2.1: Research
Indicator title 2.1. To establish and enhance a credible institutional mechanism for skill planning and delivery in the agricultural sector by 2019
Short definition The institutional mechanism that will be used to generate credible information for skills planning
Purpose/importance The use of a credible mechanism will ensure that data used can be verified and is a true reflection of the sector
Source/collection of data AgriSETA information system
Method of Calculation Count the information systems
Data limitations Availability of mechanism
Type of indicator Output
Calculation type Non-Cumulative
Reporting cycle Annually
New Indicator Yes
Desired Performance 1 updated mechanism available annually
Indicator Responsibility Skills Planning Manager

59
Indicator title 2.1.1. Sector skills plans, Annual performance plan and strategic plans updated
Short definition SSP, APP developed SP updated
Purpose/importance Commissioned intelligence gathering and research projects conducted effectively
Source/collection of data Sector Skills plan, Annual Performance plan and Strategic Plan updated
Method of Calculation Submitted document count
Data limitations Validity of research information
Type of indicator Input
Calculation type Non-Cumulative
Reporting cycle Annually
New Indicator No
Desired Performance 1 SSP 1 APP 1 SP
Indicator Responsibility Skills Planning Manager
Indicator title 2.1.2. Research agenda developed and approved
Short definition Research agenda
Purpose/importance Commissioned intelligence gathering and research projects conducted effectively
Source/collection of data Research agenda
Method of Calculation Document count
Data limitations Document approval
Type of indicator Input
Calculation type Non-Cumulative
Reporting cycle Annually
New Indicator No
Desired Performance 1 Research agenda
Indicator Responsibility Skills Planning Manager
Indicator title 2.1.3. Number of SSC committees established and strengthened through capacity building sessions and plenaries.
Short definition Number of meetings and discussions gatherings towards strengthening SSC
Purpose/importance SSC mobilisation in preparation of the re-launch and establishment
Source/collection of data Meeting minutes, attendance registers
Method of Calculation Number of SSC’s established counted, number of SSC meetings and number of plenary meetings counted
Data limitations Availability of members to attend
Type of indicator Input
Calculation type Cumulative
Reporting cycle Annually
New Indicator No
Desired Performance 11 SSCs established, 2 Capacity building, 2 Plenary
Indicator Responsibility Skill Planning Manager

60
Sub-programme: 2.2 Reporting
Strategic objective 2.2
Indicator title 2.2. To increase the accessibility of Information and knowledge by 30%
Short definition Increase accessibility of Information and knowledge by sharing information internally with employees.
Purpose/importance The sharing of information is critical to ensure that all departments in AgriSETA understand the underlying dynamics of the sector
Source/collection of data Survey distributed to employees of AgriSETA
Method of Calculation The outcome of the survey will be used to determine the baseline and compared with the outcome of the final assessment.
Data limitations The accurate completion of surveys
Type of indicator Impact
Calculation type Cumulative
Reporting cycle Annually
New Indicator Yes
Desired Performance 30% increase in the accessibility of information
Indicator Responsibility Skills Planning - Manager
Indicator title 2.2.1. Number of internal knowledge exchange sessions
Short definition Information that is generated will be shared with all staff
Purpose/importance To ensure that all target owners are made aware of skills drivers and dynamics of the sector
Source/collection of data Minutes/attendance registers of meetings
Method of Calculation Number of information sharing sessions
Data limitations The availability of staff
Type of indicator Output
Calculation type Cumulative quarterly
Reporting cycle Quarterly
New Indicator Yes
Desired Performance 4 meetings annually
Indicator Responsibility Skills Planning - Manager
Indicator title 2.2.2. Number of performance monitoring sessions facilitated with target holders within AgriSETA
Short definition Feedback on overall performance against APP targets
Purpose/importance To make target owners aware of performance levels
Source/collection of data Signed off monthly performance
Method of Calculation Number of performance monitoring sessions held
Data limitations Availability of data
Type of indicator Output
Calculation type Cumulative quarterly
Reporting cycle Quarterly

61
New Indicator Yes
Desired Performance 12 Performance monitoring interventions
Indicator Responsibility Reporting coordinator
Indicator title 2.2.3. Maintain a 10% improvement in the validity of reported information
Short definition The verification of reported data to ensure that it’s relevant and accurate
Purpose/importance The accuracy of data reflected in reported performance can influence an audit opinion
Source/collection of data Quarterly verification reports by DHET
Method of Calculation Numerator-Number of findings in the previous Quarter validation, Denominator- Number of findings in the current Quarter validation
Data limitations Availability of reports
Type of indicator Output
Calculation type Cumulative quarterly
Reporting cycle Quarterly
New Indicator Yes
Desired Performance 10% improvement in validity
Indicator Responsibility Skills Planning Manager
Indicator title 2.2.4. Improve and maintain the quality of performance information by 10% through internal workshops and feedback.
Short definition The quality of evidence presented is improved
Purpose/importance The availability of evidence that is aligned to the DHET standards is critical to ensure that performance claims are backed up by evidence of the correct standard
Source/collection of data Internal audit reports
Method of Calculation Numerator-Number of findings in the previous Quarter audit, Denominator- Number of findings in the current Quarter audit
Data limitations Availability of reports
Type of indicator Output
Calculation type Cumulative quarterly
Reporting cycle Quarterly
New Indicator Yes
Desired Performance 10% improvement in Quality
Indicator Responsibility Skills Planning Manager
Sub programme 2.3: Mandatory grant management
Indicator title 2.3. To increase employer access to grant information by 15% to enable the maximum number of enterprises in the sector to participate in the National Skills Development Strategy
Short definition Employer access to grant information by 15% must be increased to allow for a maximum number of enterprises in the sector to participate in the Mandatory Grant process.
Purpose/importance The increase in employer access to mandatory grants will mean an increase in the training and development of employees.
Source/collection of data Surveys completed by employers

62
Method of Calculation Completed surveys will indicate that employers find information more accessible if compared with the corresponding period last year.
Data limitations Availability and number of completed surveys
Type of indicator Output
Calculation type Non- Cumulative
Reporting cycle Annually
New Indicator Yes
Desired Performance Employers indicate a 15% increase in access to information annually
Indicator Responsibility Skills Planning Manager
Indicator title 2.3.1. Annual revision of the mandatory grant system to improve effectiveness;
Short definition Revision of mandatory grant system
Purpose/importance To increase the effectiveness of mandatory grant submissions and quality of data
Source/collection of data System upgrade report
Method of Calculation The availability of upgrade report
Data limitations Availability of report
Type of indicator Output – completing accredited relevant training
Calculation type Cumulative for the year
Reporting cycle Annually
New Indicator Yes
Desired Performance Updated mandatory grant system
Indicator Responsibility Skills Planning - Manager
Indicator title 2.3.2. An increase in the participation of employers in mandatory grants;
Short definition Annual increase in participation into Mandatory grants
Purpose/importance Continuous increase in employer participation will ensure an increase in beneficiation of training
Source/collection of data WSP submissions
Method of Calculation Increase in the number of new WSPs submitted
Data limitations Availability of data
Type of indicator Output
Calculation type Cumulative
Reporting cycle Annually
New Indicator No
Desired Performance Large employers 410 M-Medium employer 545 S-Small employer 1011
Indicator Responsibility Skills Planning Manager
Indicator title 2.3.3. Increasing the payment of mandatory grants to 73% annually,
Short definition The payment of at least 76% of mandatory grants back to employers
Purpose/importance Payment of mandatory grants in fulfilment of skills levies act and to increase participation in training activities
Source/collection of data Mandatory grant payment schedule
Method of Calculation Numerator- 20% of Levies paid to employers participating in WSP/ATR
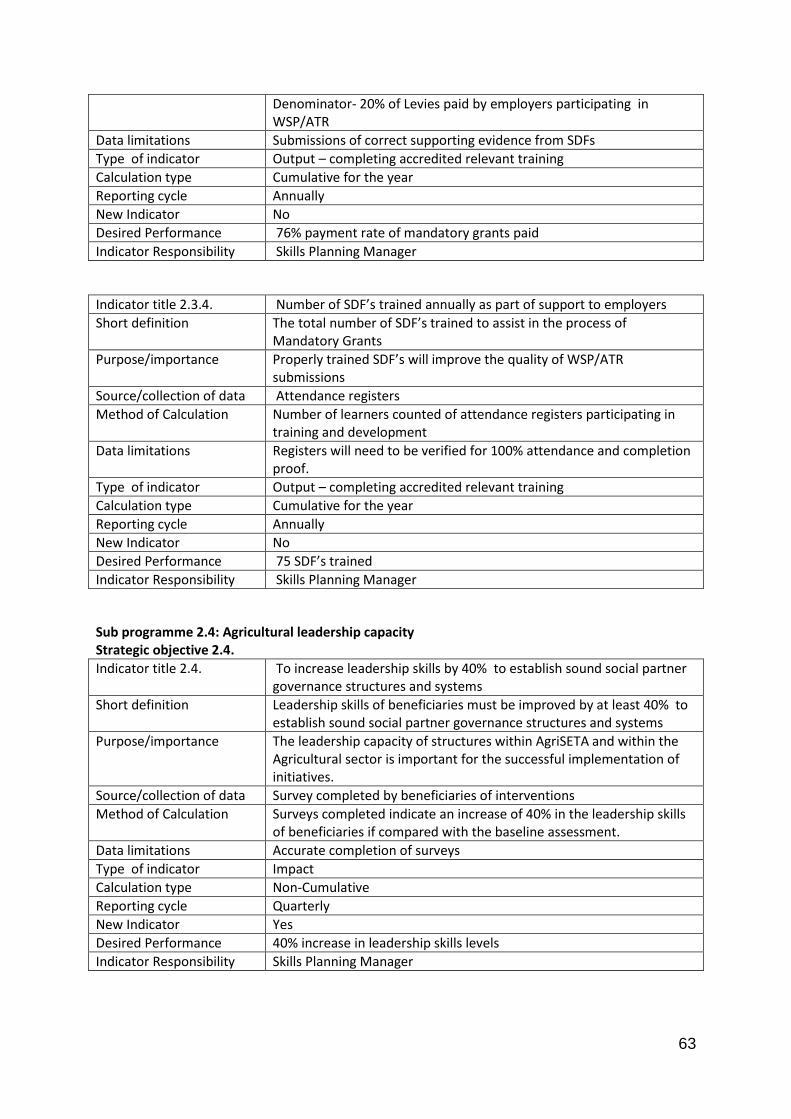
63
Denominator- 20% of Levies paid by employers participating in WSP/ATR
Data limitations Submissions of correct supporting evidence from SDFs
Type of indicator Output – completing accredited relevant training
Calculation type Cumulative for the year
Reporting cycle Annually
New Indicator No
Desired Performance 76% payment rate of mandatory grants paid
Indicator Responsibility Skills Planning Manager
Indicator title 2.3.4. Number of SDF’s trained annually as part of support to employers
Short definition The total number of SDF’s trained to assist in the process of Mandatory Grants
Purpose/importance Properly trained SDF’s will improve the quality of WSP/ATR submissions
Source/collection of data Attendance registers
Method of Calculation Number of learners counted of attendance registers participating in training and development
Data limitations Registers will need to be verified for 100% attendance and completion proof.
Type of indicator Output – completing accredited relevant training
Calculation type Cumulative for the year
Reporting cycle Annually
New Indicator No
Desired Performance 75 SDF’s trained
Indicator Responsibility Skills Planning Manager
Sub programme 2.4: Agricultural leadership capacity Strategic objective 2.4.
Indicator title 2.4. To increase leadership skills by 40% to establish sound social partner governance structures and systems
Short definition Leadership skills of beneficiaries must be improved by at least 40% to establish sound social partner governance structures and systems
Purpose/importance The leadership capacity of structures within AgriSETA and within the Agricultural sector is important for the successful implementation of initiatives.
Source/collection of data Survey completed by beneficiaries of interventions
Method of Calculation Surveys completed indicate an increase of 40% in the leadership skills of beneficiaries if compared with the baseline assessment.
Data limitations Accurate completion of surveys
Type of indicator Impact
Calculation type Non-Cumulative
Reporting cycle Quarterly
New Indicator Yes
Desired Performance 40% increase in leadership skills levels
Indicator Responsibility Skills Planning Manager

64
Indicator title 2.4.1. Number of learners participating in Agricultural leadership development programmes
Short definition The total number of staff in leadership position actually attending training.
Purpose/importance Improvement in Agricultural leadership development will ensure that the whole Agricultural value chain is strengthened
Source/collection of data Invitations or enrolments to such programs or attendance registers and/or certificates of completion or attendance , agenda & minutes where applicable
Method of Calculation Each program will be counted once with its total number of participants from the leadership team.
Data limitations Registers will need to be verified for 100% attendance
Type of indicator Outcome- with specific focus on completion of program
Calculation type Cumulative for the year
Reporting cycle Quarterly
New Indicator No
Desired Performance 40 Agri leaders will be trained across the value chain
Indicator Responsibility Skills Planning Manager
Indicator title 2.4.2. Number of capacity building programmes for board standing committees
Short definition Number and frequency of programs to be conducted for the Board including the sub-committees of the Board on governance issues
Purpose/importance Programs conducted and attended by the Board and/or its sub-committees will further improve the ability of the board to deliver on their fiduciary duties and general responsibilities.
Source/collection of data Invitations or enrolments to such programs or attendance registers and/or certificates of completion or attendance , agenda & minutes where applicable
Method of Calculation Number of programmes counted
Data limitations Availability of board members to attend
Type of indicator Outcome- with specific focus on completion of program
Calculation type Cumulative for the year
Reporting cycle Annually
New Indicator No
Desired Performance 1 programme
Indicator Responsibility Board secretary
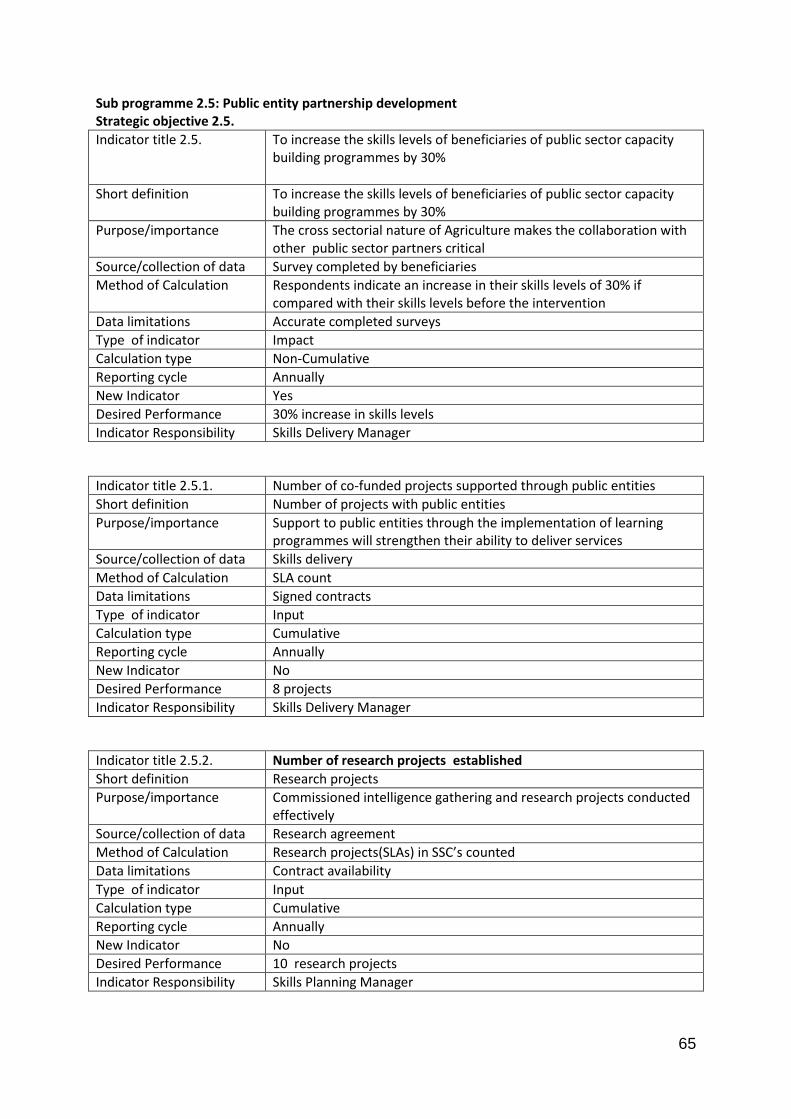
65
Sub programme 2.5: Public entity partnership development Strategic objective 2.5.
Indicator title 2.5. To increase the skills levels of beneficiaries of public sector capacity building programmes by 30%
Short definition To increase the skills levels of beneficiaries of public sector capacity building programmes by 30%
Purpose/importance The cross sectorial nature of Agriculture makes the collaboration with other public sector partners critical
Source/collection of data Survey completed by beneficiaries
Method of Calculation Respondents indicate an increase in their skills levels of 30% if compared with their skills levels before the intervention
Data limitations Accurate completed surveys
Type of indicator Impact
Calculation type Non-Cumulative
Reporting cycle Annually
New Indicator Yes
Desired Performance 30% increase in skills levels
Indicator Responsibility Skills Delivery Manager
Indicator title 2.5.1. Number of co-funded projects supported through public entities
Short definition Number of projects with public entities
Purpose/importance Support to public entities through the implementation of learning programmes will strengthen their ability to deliver services
Source/collection of data Skills delivery
Method of Calculation SLA count
Data limitations Signed contracts
Type of indicator Input
Calculation type Cumulative
Reporting cycle Annually
New Indicator No
Desired Performance 8 projects
Indicator Responsibility Skills Delivery Manager
Indicator title 2.5.2. Number of research projects established
Short definition Research projects
Purpose/importance Commissioned intelligence gathering and research projects conducted effectively
Source/collection of data Research agreement
Method of Calculation Research projects(SLAs) in SSC’s counted
Data limitations Contract availability
Type of indicator Input
Calculation type Cumulative
Reporting cycle Annually
New Indicator No
Desired Performance 10 research projects
Indicator Responsibility Skills Planning Manager

66
Indicator title 2.5.3. Number of partnerships with Public Entities in support of Ministerial Projects
Short definition Projects with public entities
Purpose/importance Co-funded projects broadens the impact of funding and strengthens the mandate of the SETA in support of ministerial projects
Source/collection of data Agreements signed
Method of Calculation SLA count
Data limitations Contract availability
Type of indicator Input
Calculation type Cumulative
Reporting cycle Annually
New Indicator No
Desired Performance 7 projects supported
Indicator Responsibility Office of the CEO (fully assisted by the Operations Department)
Programme 3: Learning programmes and projects
Sub programme 3.1: Professional, Vocational, Occupational and Workplace Learning – Decent
Work
Strategic objective 3.1.
Indicator title 3.1. To increase the efficiency of beneficiaries/learners in the workplace by 30% annually and increase access to learning opportunities by 10% annually
Short definition The efficiency of beneficiaries/learners in the workplace must increase by 30% annually to proof impact and the access to learning opportunities of beneficiaries must increase by 10% annually
Purpose/importance The impact of learning interventions is important in terms of ROI and the continuous increase of access to PIVOTAL initiatives to address the skills shortage in the sector.
Source/collection of data Surveys completed by employers and data from MIS system
Method of Calculation efficiency of 40% baseline assessment compared with final assessment 10% in learners registering for PIVOTAL initiatives (Numerator 2016 learners entering Denominator 2017 learners entering)
Data limitations Accurate completion of surveys and accuracy of data
Type of indicator Impact
Calculation type Non- Cumulative
Reporting cycle Annually
New Indicator Yes
Desired Performance 30% increase in worker efficiency and 10% increase in learner access annually
Indicator Responsibility Skills Delivery - Manager
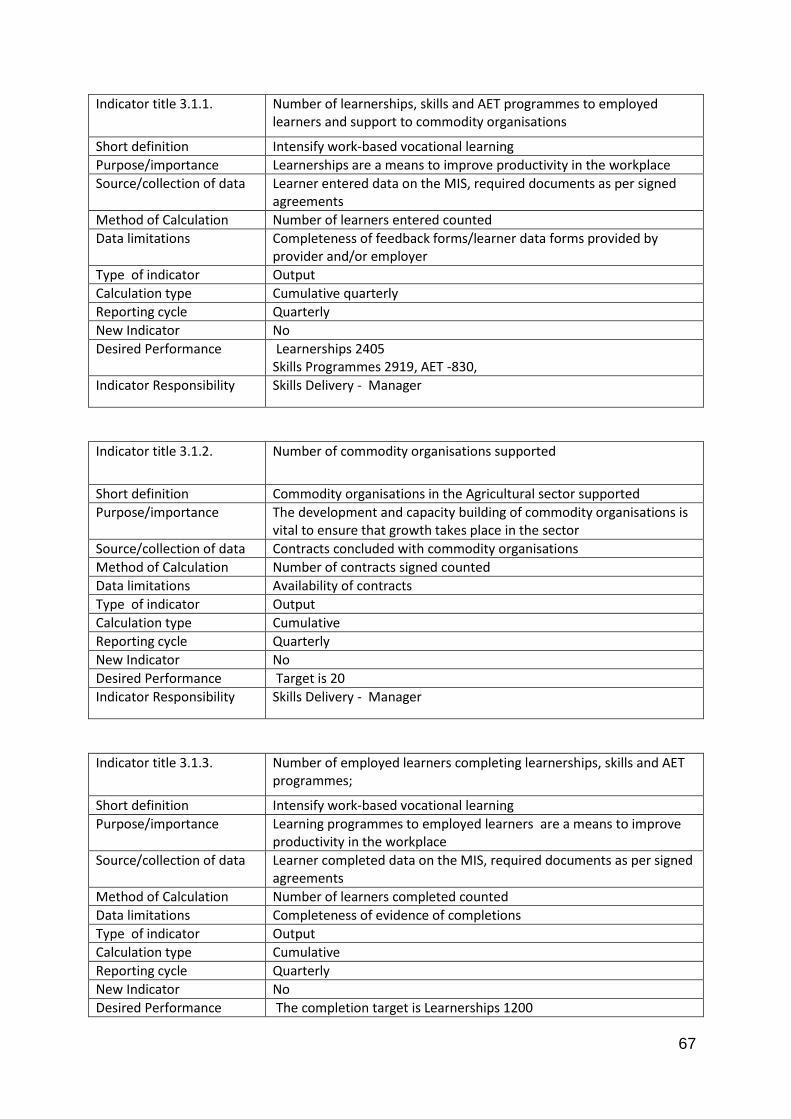
67
Indicator title 3.1.1. Number of learnerships, skills and AET programmes to employed learners and support to commodity organisations
Short definition Intensify work-based vocational learning
Purpose/importance Learnerships are a means to improve productivity in the workplace
Source/collection of data Learner entered data on the MIS, required documents as per signed agreements
Method of Calculation Number of learners entered counted
Data limitations Completeness of feedback forms/learner data forms provided by provider and/or employer
Type of indicator Output
Calculation type Cumulative quarterly
Reporting cycle Quarterly
New Indicator No
Desired Performance Learnerships 2405 Skills Programmes 2919, AET -830,
Indicator Responsibility Skills Delivery - Manager
Indicator title 3.1.2. Number of commodity organisations supported
Short definition Commodity organisations in the Agricultural sector supported
Purpose/importance The development and capacity building of commodity organisations is vital to ensure that growth takes place in the sector
Source/collection of data Contracts concluded with commodity organisations
Method of Calculation Number of contracts signed counted
Data limitations Availability of contracts
Type of indicator Output
Calculation type Cumulative
Reporting cycle Quarterly
New Indicator No
Desired Performance Target is 20
Indicator Responsibility Skills Delivery - Manager
Indicator title 3.1.3. Number of employed learners completing learnerships, skills and AET programmes;
Short definition Intensify work-based vocational learning
Purpose/importance Learning programmes to employed learners are a means to improve productivity in the workplace
Source/collection of data Learner completed data on the MIS, required documents as per signed agreements
Method of Calculation Number of learners completed counted
Data limitations Completeness of evidence of completions
Type of indicator Output
Calculation type Cumulative
Reporting cycle Quarterly
New Indicator No
Desired Performance The completion target is Learnerships 1200
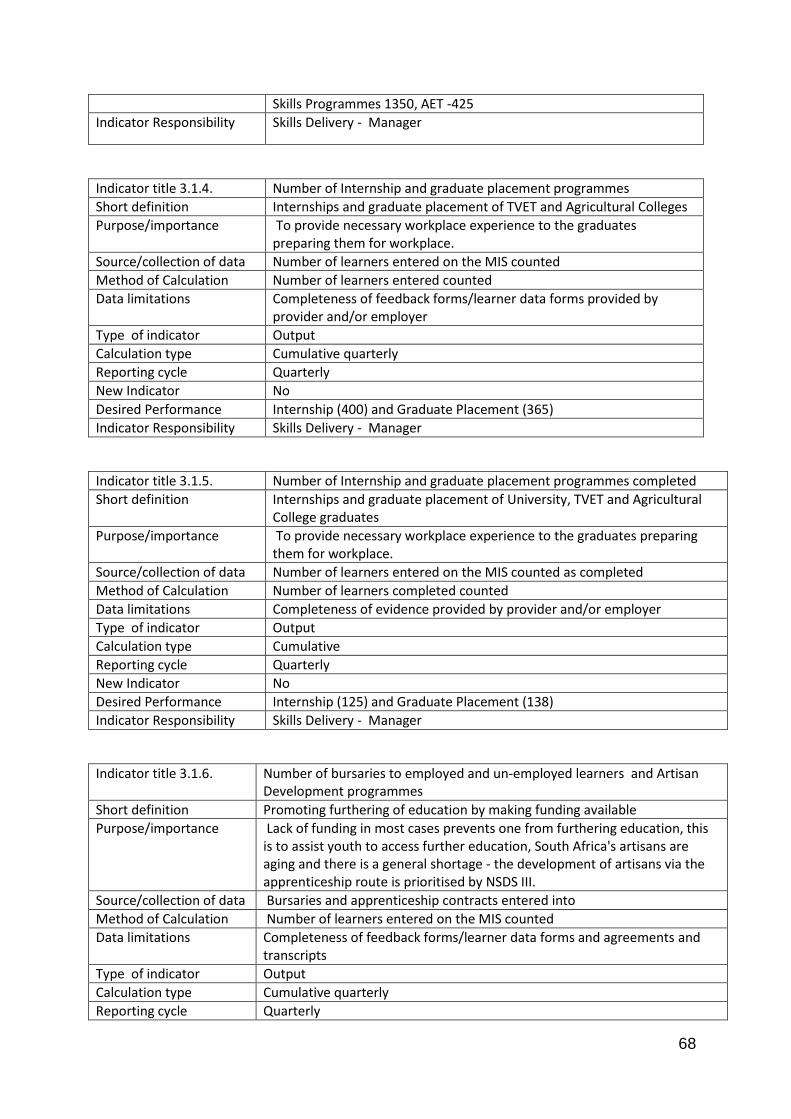
68
Skills Programmes 1350, AET -425
Indicator Responsibility Skills Delivery - Manager
Indicator title 3.1.4. Number of Internship and graduate placement programmes
Short definition Internships and graduate placement of TVET and Agricultural Colleges
Purpose/importance To provide necessary workplace experience to the graduates preparing them for workplace.
Source/collection of data Number of learners entered on the MIS counted
Method of Calculation Number of learners entered counted
Data limitations Completeness of feedback forms/learner data forms provided by provider and/or employer
Type of indicator Output
Calculation type Cumulative quarterly
Reporting cycle Quarterly
New Indicator No
Desired Performance Internship (400) and Graduate Placement (365)
Indicator Responsibility Skills Delivery - Manager
Indicator title 3.1.5. Number of Internship and graduate placement programmes completed
Short definition Internships and graduate placement of University, TVET and Agricultural College graduates
Purpose/importance To provide necessary workplace experience to the graduates preparing them for workplace.
Source/collection of data Number of learners entered on the MIS counted as completed
Method of Calculation Number of learners completed counted
Data limitations Completeness of evidence provided by provider and/or employer
Type of indicator Output
Calculation type Cumulative
Reporting cycle Quarterly
New Indicator No
Desired Performance Internship (125) and Graduate Placement (138)
Indicator Responsibility Skills Delivery - Manager
Indicator title 3.1.6. Number of bursaries to employed and un-employed learners and Artisan Development programmes
Short definition Promoting furthering of education by making funding available
Purpose/importance Lack of funding in most cases prevents one from furthering education, this is to assist youth to access further education, South Africa's artisans are aging and there is a general shortage - the development of artisans via the apprenticeship route is prioritised by NSDS III.
Source/collection of data Bursaries and apprenticeship contracts entered into
Method of Calculation Number of learners entered on the MIS counted
Data limitations Completeness of feedback forms/learner data forms and agreements and transcripts
Type of indicator Output
Calculation type Cumulative quarterly
Reporting cycle Quarterly

69
New Indicator No
Desired Performance Bursaries target Employed 18.1 (120) and Unemployed 18.2 (250), Artisan Development (219)
Indicator Responsibility Skills Delivery - Manager
Indicator title 3.1.7. Number of employed and un-employed learners completing bursary and Artisan Development programmes;
Short definition Promoting furthering of education by making funding available
Purpose/importance Lack of funding in most cases prevents one from furthering education, this is to assist youth to access further education, South Africa's artisans are aging and there is a general shortage - the development of artisans via the apprenticeship route is prioritised by NSDS III.
Source/collection of data Number of employed and un-employed learners completing bursary and Artisan Development programmes, required documents as per signed agreements
Method of Calculation Number of learners completed counted
Data limitations Completeness of evidence from employers/training providers
Type of indicator Output
Calculation type Cumulative
Reporting cycle Quarterly
New Indicator No
Desired Performance Bursaries Employed 18.1 (45) and Unemployed 18.2 (82), Artisan Development (130)
Indicator Responsibility Skills Delivery - Manager
Indicator title 3.1.8. Number of HIV and Aids DVD’s distributed to create awareness
Short definition To further awareness on HIV/AIDS prevalence & Infection by producing HIV DVD educational material
Purpose/importance To further awareness on HIV/AIDS prevalence &Infection by producing HIV DVD educational material
Source/collection of data Attendance registers
Method of Calculation Number of DVDs distributed
Data limitations Effectiveness and quality of the DVDs
Type of indicator Output
Calculation type Cumulative quarterly
Reporting cycle Quarterly
New Indicator No
Desired Performance Distribute 1000 DVDs
Indicator Responsibility Marketing coordinator

70
Sub-programme 3.2. Rural Development
Strategic objective 3.2.
Indicator title 3.2. To increase the governance of NLPE’s by 20% and skills levels of beneficiaries with 30% annually
Short definition To increase the governance of NLPE’s by 20% and skills levels of beneficiaries with 30% annually
Purpose/importance The governance and skills levels of NLPE is crucial to address Land Reform and food security
Source/collection of data Surveys completed by beneficiaries of training interventions
Method of Calculation Respondents indicate an improvement of 20% in terms of governance of NLPE compared with the baseline assessment and an improvement of 30% in their skills levels if pre and post assessment are compared
Data limitations Accurate completion of surveys
Type of indicator Impact
Calculation type Non-Cumulative
Reporting cycle Annually
New Indicator Yes
Desired Performance Improvement of 20% in terms of governance and 30% in terms of skills levels of beneficiaries
Indicator Responsibility Skills Delivery - Manager
Indicator title 3.2.1. Number of Learnership, Skills programmes for unemployed learners and support to Rural structures
Short definition Intensify occupational learning
Purpose/importance Occupational learning as a means to improve productivity in the workplace
Source/collection of data Learner entered and completed data recorded on the MIS
Method of Calculation LS and SP (Number of learners entered counted. RD(Number of learners counted on non-credit bearing programmes and mentorships)
Data limitations Completeness of feedback forms/learner data forms provided by provider and/or employer
Type of indicator Output
Calculation type Cumulative quarterly
Reporting cycle Quarterly
New Indicator No
Desired Performance LS (2000); SP (2667) and SRS (30)
Indicator Responsibility Skills Delivery - Manager
Indicator title 3.2.2. Number of unemployed learners completing Learnership and Skills programmes
Short definition Intensify occupational learning
Purpose/importance Occupational learning as a means to improve productivity in the workplace
Source/collection of data Learner completed data on the MIS
Method of Calculation Number of learners completed counted
Data limitations Completeness of evidence submitted by provider and/or employer
Type of indicator Output

71
Calculation type Cumulative
Reporting cycle Quarterly
New Indicator No
Desired Performance LS (768); SP (1750)
Indicator Responsibility Skills Delivery - Manager
Indicator title 3.2.3. Number of learners entering NVC programmes
Short definition Provision of training on new venture creation programs
Purpose/importance Support and provision of training to NVC in the form of training learners
Source/collection of data Learner entered and completed data recorded on the MIS
Method of Calculation Number of learners entered on MIS counted
Data limitations Completeness of feedback forms/learner data forms provided by provider and/or employer
Type of indicator Output
Calculation type Cumulative
Reporting cycle Quarterly
New Indicator No
Desired Performance Target 64 people
Indicator Responsibility Skills Delivery - Manager
Indicator title 3.2.4. Number of learners completing new venture creation programmes
Short definition Completion of training on new venture creation programs
Purpose/importance Support and provision of training to NVC in the form of training learners will assist in developing entrepreneurial training
Source/collection of data Learner completed data recorded on the MIS and DG Contracts
Method of Calculation Number of learners completed counted from NVC
Data limitations Completeness of feedback forms/learner data forms provided by provider and/or employer
Type of indicator Output
Calculation type Cumulative quarterly
Reporting cycle Quarterly
New Indicator No
Desired Performance Target 45 people
Indicator Responsibility Skills Delivery - Manager
Indicator title 3.2.5. Number of organisations supported through learnerships and new venture creation programmes in partnership with NGOs, CBOs, Co-ops
Short definition Provision of support to NGO and CBO
Purpose/importance Provision of support to NGO and CBO
Source/collection of data DG contracts entered to support such organisations
Method of Calculation Verifying the DG contracts stipulating support to such organisation
Data limitations Completeness of feedback forms/learner data forms provided by provider and/or employer
Type of indicator Output
Calculation type Cumulative quarterly
Reporting cycle Quarterly
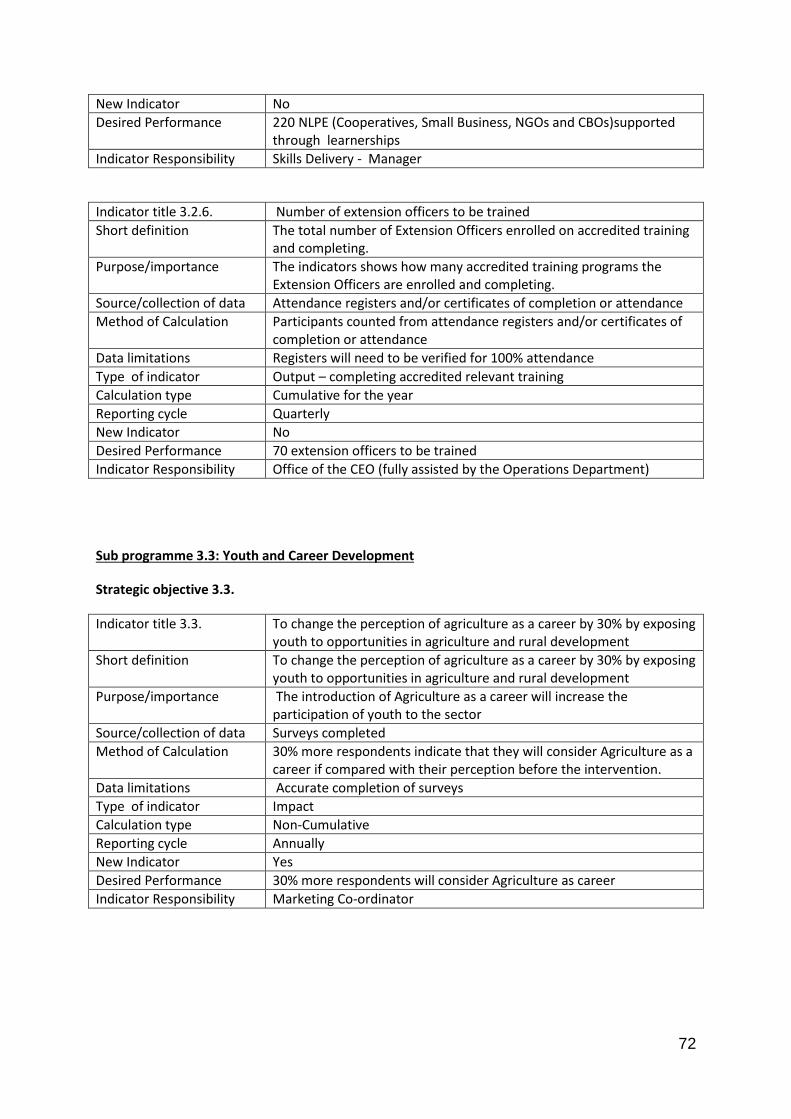
72
New Indicator No
Desired Performance 220 NLPE (Cooperatives, Small Business, NGOs and CBOs)supported through learnerships
Indicator Responsibility Skills Delivery - Manager
Indicator title 3.2.6. Number of extension officers to be trained
Short definition The total number of Extension Officers enrolled on accredited training and completing.
Purpose/importance The indicators shows how many accredited training programs the Extension Officers are enrolled and completing.
Source/collection of data Attendance registers and/or certificates of completion or attendance
Method of Calculation Participants counted from attendance registers and/or certificates of completion or attendance
Data limitations Registers will need to be verified for 100% attendance
Type of indicator Output – completing accredited relevant training
Calculation type Cumulative for the year
Reporting cycle Quarterly
New Indicator No
Desired Performance 70 extension officers to be trained
Indicator Responsibility Office of the CEO (fully assisted by the Operations Department)
Sub programme 3.3: Youth and Career Development
Strategic objective 3.3.
Indicator title 3.3. To change the perception of agriculture as a career by 30% by exposing youth to opportunities in agriculture and rural development
Short definition To change the perception of agriculture as a career by 30% by exposing youth to opportunities in agriculture and rural development
Purpose/importance The introduction of Agriculture as a career will increase the participation of youth to the sector
Source/collection of data Surveys completed
Method of Calculation 30% more respondents indicate that they will consider Agriculture as a career if compared with their perception before the intervention.
Data limitations Accurate completion of surveys
Type of indicator Impact
Calculation type Non-Cumulative
Reporting cycle Annually
New Indicator Yes
Desired Performance 30% more respondents will consider Agriculture as career
Indicator Responsibility Marketing Co-ordinator

73
Indicator title 3.3.1. The development of an integrated career development programme
Short definition Career development programme integrating all sectors within AgriSETA
Purpose/importance The cross-sectoral nature of Agriculture necessitates the development of an integrated career development plan.
Source/collection of data Integrated career development plan
Method of Calculation Career development plan count
Data limitations Availability of plan
Type of indicator Input
Calculation type Cumulative
Reporting cycle Annually
New Indicator Yes
Desired Performance 1 career development plan available
Indicator Responsibility Marketing Co-ordinator
Indicator title 3.3.2. Number of strategic partnerships established for enhancing the capacity of youth in agriculture and career development
Short definition Career guidance partnerships
Purpose/importance Career opportunities communicated through schools & youth development initiatives.
Source/collection of data Partnerships agreements with strategic partners
Method of Calculation Partnerships counted
Data limitations Availability of signed contracts
Type of indicator Input
Calculation type Cumulative
Reporting cycle Annually
New Indicator No
Desired Performance 2 partnerships established
Indicator Responsibility Marketing Co-ordinator
Indicator title 3.3.3. Number of career exhibitions attended, schools involved and learners exposed
Short definition Careers expos organised by the SETA
Purpose/importance Career opportunities communicated through schools & youth development initiatives.
Source/collection of data Attendance registers proof of occurrence invite
Method of Calculation Number of invitations, number of schools and number of learners counted
Data limitations Well designed and fit for purpose score carding instruments
Type of indicator Input
Calculation type Cumulative
Reporting cycle Annually
New Indicator No

74
Desired Performance 15 x career expo’s participated, Actual of 100 schools exposed, 5000 learners exposed to career guidance
Indicator Responsibility Marketing - Co-ordinator
Programme 4: Quality assurance
Strategic objective 4.1.
Indicator title 4.1. To increase the responsiveness of service providers to the sector, that benefit annually from capacity building initiatives by 30% and to enhance the quality of learning programmes
Short definition To increase the responsiveness of service providers to the sector, that benefit annually from capacity building initiatives by 30% and to enhance the quality of learning programmes
Purpose/importance The ability of TVET and ATVET to meet the demand for skills is important for AgriSETA to address critical and scarce skills
Source/collection of data Survey completed
Method of Calculation Respondents on survey indicate an increase of 30% to respond to the occupational qualifications and the needs of the sector if compared to the baseline assessment before the intervention
Data limitations Accuracy of completed surveys
Type of indicator Impact
Calculation type Non-Cumulative
Reporting cycle Annually
New Indicator Yes
Desired Performance 30% increase in capacity to be responsive to the sector
Indicator Responsibility ETQA - Manager
Indicator title 4.1.1. Number of Agricultural Colleges(TVETs) supported with capacity building programmes
Short definition Provision of support to Agriculture colleges
Purpose/importance Provision of support to Agriculture colleges
Source/collection of data DG contracts entered to support such organisations
Method of Calculation Number of DG contracts stipulating support to Agricultural Colleges(TVETs)
Data limitations Specifying the type of support
Type of indicator Output
Calculation type Cumulative quarterly
Reporting cycle Quarterly
New Indicator No
Desired Performance 11 Colleges of Agriculture supported
Indicator Responsibility ETQA - Manager
Indicator title 4.1.2. Number of occupationally directed qualifications developed
Short definition Supporting the sector through developing relevant qualifications
Purpose/importance Provision of support to Agriculture sector
Source/collection of data Verifying the MOA/MOU stipulating support , qualifications developed
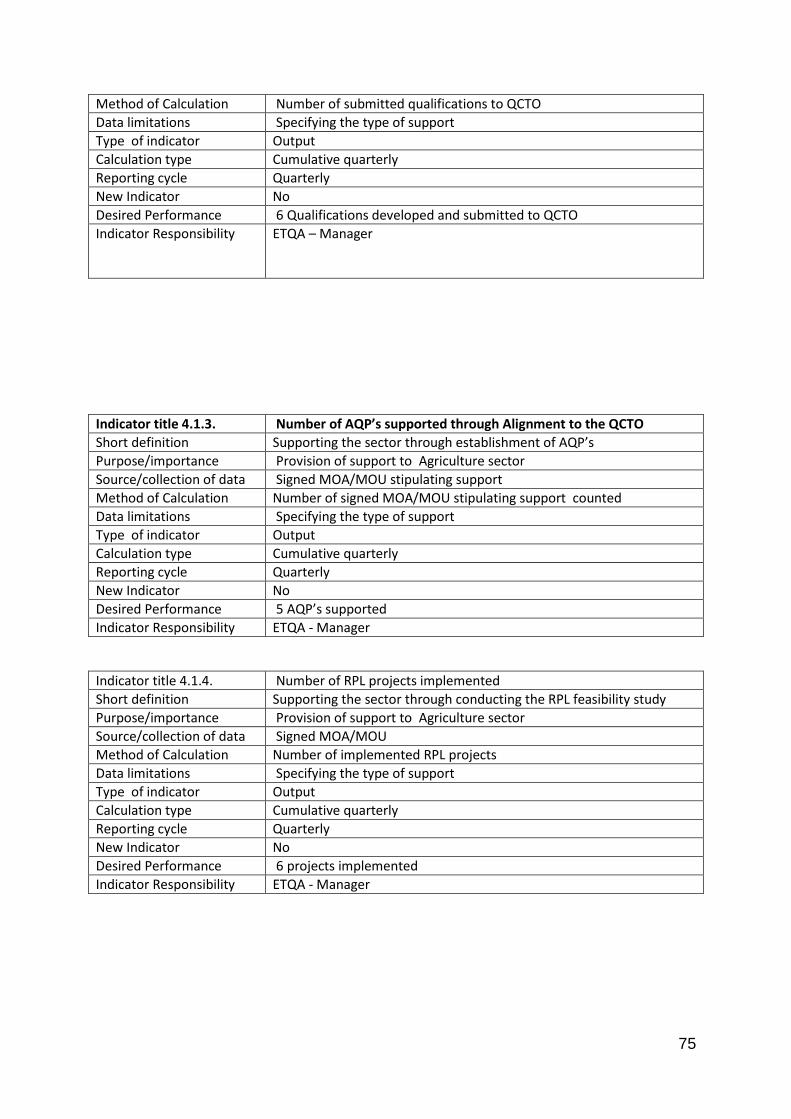
75
Method of Calculation Number of submitted qualifications to QCTO
Data limitations Specifying the type of support
Type of indicator Output
Calculation type Cumulative quarterly
Reporting cycle Quarterly
New Indicator No
Desired Performance 6 Qualifications developed and submitted to QCTO
Indicator Responsibility ETQA – Manager
Indicator title 4.1.3. Number of AQP’s supported through Alignment to the QCTO
Short definition Supporting the sector through establishment of AQP’s
Purpose/importance Provision of support to Agriculture sector
Source/collection of data Signed MOA/MOU stipulating support
Method of Calculation Number of signed MOA/MOU stipulating support counted
Data limitations Specifying the type of support
Type of indicator Output
Calculation type Cumulative quarterly
Reporting cycle Quarterly
New Indicator No
Desired Performance 5 AQP’s supported
Indicator Responsibility ETQA - Manager
Indicator title 4.1.4. Number of RPL projects implemented
Short definition Supporting the sector through conducting the RPL feasibility study
Purpose/importance Provision of support to Agriculture sector
Source/collection of data Signed MOA/MOU
Method of Calculation Number of implemented RPL projects
Data limitations Specifying the type of support
Type of indicator Output
Calculation type Cumulative quarterly
Reporting cycle Quarterly
New Indicator No
Desired Performance 6 projects implemented
Indicator Responsibility ETQA - Manager