food waste chemical analysis - wrap cymru waste chemical analysis 1 executive summary this report...
TRANSCRIPT
Final Report - March 2010
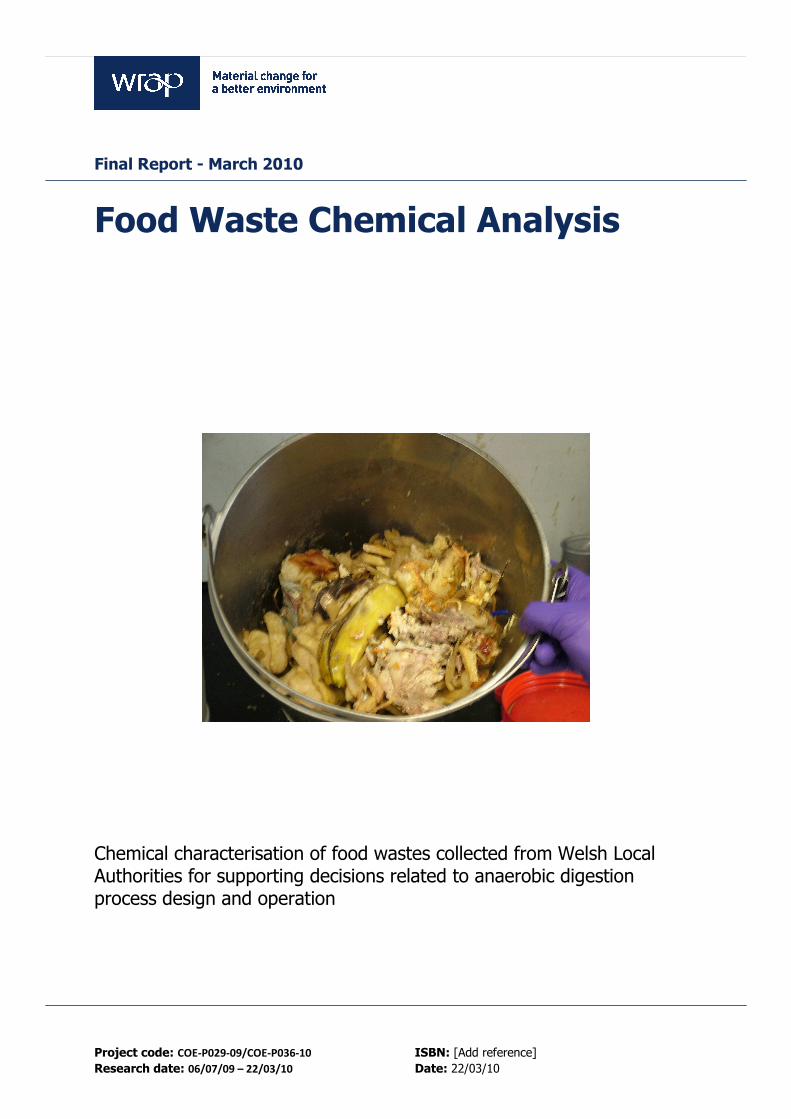
Food Waste Chemical Analysis
Chemical characterisation of food wastes collected from Welsh Local Authorities for supporting decisions related to anaerobic digestion process design and operation
Project code: COE-P029-09/COE-P036-10 ISBN: [Add reference]
Research date: 06/07/09 – 22/03/10 Date: 22/03/10
WRAP helps individuals, businesses and
local authorities to reduce waste and
recycle more, making better use of
resources and helping to tackle climate
change.
Document reference:
Written by: Dr. Sandra Esteves and Desmond Devlin
Front cover photography: Food waste sample prior to homogenisation and characterisation
WRAP and authors believe the content of this report to be correct as at the date of writing. While steps have been taken to ensure accuracy, WRAP cannot accept
responsibility or be held liable to any person for any loss or damage arising out of or in connection with this information being inaccurate, incomplete or misleading. This
material is copyrighted. It may be reproduced free of charge subject to the material being accurate and not used in a misleading context. The source of the material
must be identified and the copyright status acknowledged. This material must not be used to endorse or used to suggest WRAP’s endorsement of a commercial product
or service. For more detail, please refer to WRAP’s Terms & Conditions on its web site: www.wrap.org.uk
Food Waste Chemical Analysis 1
Executive summary
This report includes the research conducted by the Wales Centre of Excellence for Anaerobic Digestion at the University of Glamorgan as part of a wider survey of the Wales’s Municipal Waste Composition during the summer
and winter of 2009.
Anaerobic digestion has been defined by the Welsh Assembly Government as the preferred technology for
treating food wastes due to the valuable renewable energy produced as well as the valuable and low carbon
fertiliser and soil conditioner that can be generated. A number of local authorities are currently at the
procurement stage for their food waste treatment plants and anaerobic digestion may be the technology
employed for the treatment. Even if treatment of the food wastes will be conducted using other technologies, the
results from the chemical analysis will also help support the design and operation of those processes.
With any waste treatment technology, feedstock characteristics are extremely important when defining design
and operational parameters. Even more so when treatment efforts are conducted by living microorganisms, which
interact actively within a food chain and are affected by environmental conditions such as in anaerobic digestion
treatment processes.
A sample of 5 kg in weight was received by the Wales Centre of Excellence for Anaerobic Digestion from each
local authority of the food wastes collected by WastesWork from two survey sessions, one in the summer 2009
and one in the winter 2009. For some local authorities the food wastes had been source segregated, but for
others a sample was segregated by the WastesWork team from the refuse waste stream or from a mixture of
food waste and green waste stream. Each sample was collected from up to four socio-economic clusters of 35
houses each. During the summer season all the food waste collected from the clusters was mixed and a sub-
sample collected for analysis. During the winter season an apportionment was made to allow different weight
contributions from each socio-economic cluster to make up the overall contribution within each local authority.
The analytical testing was carried out in two stages. Initially, analyses took place for carbohydrate, lipid and
protein content as well as for total solids, volatile solids and ion concentration (sodium and potassium). In a
second stage, additional testing took place on stored frozen samples and the following parameters were then
analysed: elemental analysis (carbon, hydrogen, nitrogen, sulphur and oxygen); metals (Al, Cd, Ca, Cr, Co, Cu,
Fe, Pb, Mg, Mn, Hg, Mo, Ni and Zn) and nutrients (phosphorous (total); phosphorus oxide (P2O5); ammoniacal
nitrogen and nitrogen (Kjeldahl)).
Although there are concerns over the small number of samples analysed, the results provide valuable information
for the anaerobic digestion plant designers and operators. The concentrations of proteins and light metals (Na, K
and Ca) are significant and therefore monitoring and control of the plant should be performed so that inhibition
conditions or the onset of instability within the digestion process are avoided. Effective start-up and acclimation
phases will be fundamental to support good plant performance. Also desulphurisation of the biogas will be
required due to significant levels of sulphur in the wastes and effective precautionary measures for odour control
should also be considered.
Food Waste Chemical Analysis 2
Contents
1.0 Introduction ................................................................................................................................ 3
2.0 Methodology ............................................................................................................................... 4
2.1 Sample Preparation and Homogenisation ............................................................................... 4
2.2 Analytical Techniques and Equipment ................................................................................... 5
2.3 Additional Modelling ............................................................................................................ 6
3.0 Results and Discussion ............................................................................................................... 7
3.1 Solid Content Results ........................................................................................................... 7
3.2 Carbohydrate Content Results .............................................................................................. 8
3.3 Lipid Content Results ........................................................................................................... 9
3.4 Protein Content Results ..................................................................................................... 11
3.5 Soluble Ion (Na, K) Content Results .................................................................................... 12
3.6 Summary of Results for Solids, Carbohydrate, Lipid, Protein and Soluble Ion (Na and K) Content
....................................................................................................................................... 15
3.7 Elemental Composition (Carbon, Hydrogen, Nitrogen, Sulphur and Oxygen) Results ................ 17
3.8 Summary of Results for Elemental Composition .................................................................... 19
3.9 Theoretical composition of the biogas and maximum theoretical yields of methane ................. 21
3.10 Summary of Results for Metal Content ................................................................................ 23
3.11 Nutrient Content Results .................................................................................................... 25
3.12 Summary of Results for Nutrient Content ............................................................................ 27
4.0 Conclusions ............................................................................................................................... 29
5.0 References ................................................................................................................................ 30
Acknowledgements The authors would like to acknowledge the financial support provided by the Welsh Assembly Government. The
authors would also like to acknowledge WastesWork for collecting and supplying the food wastes samples.
Page 3 of 33
1.0 Introduction
This report includes the research conduced as part of a wider survey of the Wales’s Municipal Waste
Composition during the summer and winter 2009.
With any waste treatment process, feedstock characteristics are extremely important at defining design
and operational parameters. Even more so when treatment efforts are conducted by living
microorganisms, which interact actively within a food chain and are affected by environmental
conditions such as in anaerobic digestion treatment process.
Anaerobic digestion has been defined by the Welsh Assembly Government as the preferred technology
for treating food wastes due to the valuable renewable energy produced as well as the valuable and low
carbon fertiliser and soil conditioner that can be generated. A number of local authorities are currently
at the procurement stage for their food waste treatment plants and anaerobic digestion may be the
technology employed for the treatment. Even if treatment of the food wastes will be conducted using
other technologies, these results from the chemical analysis will also help support the design and
operation of other treatment processes.
It is vital that feedstocks for an AD plant are fully characterised. Chemical analysis can provide
important information and indicate necessary AD plant design and operational requirements:
a) Choice of reactor system and system sizing b) Waste variability and potential contamination
c) Need for dilutions, co-digestion, additional chemicals, pre and post-treatment requirements d) Need for odour control and biogas cleaning requirements
e) Bio-energy generation potential and sizing of biogas storage and utilisation systems f) Anaerobic digestion process inhibition potential – requirements for monitoring and control
g) Quality of digestate and needs for further treatment
In order to design a plant which will operate as efficient as possible and where maintenance
requirements are brought to a minimum, in general, the more information available about the
feedstocks the better. At the same time, additional inputs need to be considered as well as quality of
expected outputs so that a market can be secured. Some analysis of the food waste composition in
Wales per local authority during two seasons i.e. summer and winter 2009 have been performed and
are presented in an accompanying report. Chemical analyses were selected based on how useful they
would be in helping address requirements from a) to g), and the results are presented in this report.
The level of carbohydrate, protein and lipids content in the wastes will provide an indication of carbon
to nitrogen ratios and potential for ammonia toxicity. It would also indicate how useful certain pre-
treatments would be e.g. would the use of an enzyme such as lipase be advantageous as a pre-
treatment?
Soluble ion concentrations such as Na and K will provide an indication of potential for deficiencies or
excess with possibility of generating bacterial inhibition.
Elemental analysis is particularly useful as it can provide a theoretical indication of maximum biogas
yields. The Carbon to Nitrogen (C:N) ratio is an important parameter in predicting ammonia toxicity and
levels of sulphur will provide an indication of the likely requirement for desulphurisation of biogas.
Information regarding metal content will indicate the requirement for addition of trace elements to
enhance digester performance or if in excess, the potential for toxicity. It also indicates the potential
concentrations of metals that would be anticipated in digestates.
Nutrient content will provide information on the requirement for addition of macro-nutrients or the
potential for bacterial toxicity. Nutrient content of the wastes will also indicate the potential nutrient
content of the digestates.
Page 4 of 33
2.0 Methodology
A sample of 5 kg in weight was received by the Wales Centre of Excellence for Anaerobic Digestion from
each local authority of the food wastes collected by WastesWork from two survey sessions one in the
summer 2009 and one in the winter 2009. For some local authorities the food wastes had been source
segregated, but for others a sample was segregated by the WastesWork team from the refuse waste
stream or from a mixture of food waste and green waste stream. Each sample was collected from up to
four socio-economic clusters of 35 houses each. During the summer season, all the food waste collected
from the clusters was mixed and a sub-sample collected for analysis. During the winter season, an
apportionment was made to allow different weight contributions from each socio-economic cluster to
make up the overall contribution within each local authority.
The analytical testing was carried out in two stages. In the first stage, sample analyses took place for
carbohydrate, lipid and protein content as well as for total solids, volatile solids and soluble ion
concentration (sodium and potassium). In the second stage, additional testing was performed on stored
frozen samples and the following parameters were analysed: elemental analysis (carbon, hydrogen,
nitrogen, sulphur and oxygen); metals (Al, Cd, Ca, Cr, Co, Cu, Fe, Pb, Mg, Mn, Hg, Mo, Ni and Zn) and
nutrients (phosphorous (total); phosphorus oxide (P2O5); ammoniacal nitrogen and nitrogen (Kjeldahl)).
Sections 2.1 and 2.2 describe the methodology utilised to characterise the food waste samples.
No characterisation was performed for the summer season for Cardiff, Vale of Glamorgan, Newport or
Caerphilly local authorities’ food waste samples, as these were collected in the first week of the
surveying period and the Centre was only contracted afterwards. In addition, three samples
denominated here as Unknown X, Y and Z arrived the Centre unlabelled and although they have been
characterised, it has not been possible to fully identify its sources. They were, however from Ceredigion,
Gwynedd and Flintshire’s Local Authorities.
Characterisation was performed for all the 22 Welsh Local Authorities during the winter season.
2.1 Sample Preparation and Homogenisation
Once the samples were received they were stored at 5oC for a maximum of 24 hrs until homogenisation
could take place. On opening the sample its mass was recorded, the sample was examined and any
large pieces of bone, plastic or metal were removed since at laboratory scale they cause damage to the
homogenisation equipment and can cause quite large sampling errors later in testing. The mass of any
material removed from the sample was recorded and was subsequently subtracted from the original
sample mass. This only occurred with a couple of samples as contamination was minimal. It is important
to note however, that some selection may have previously taken place by the WastesWork team.
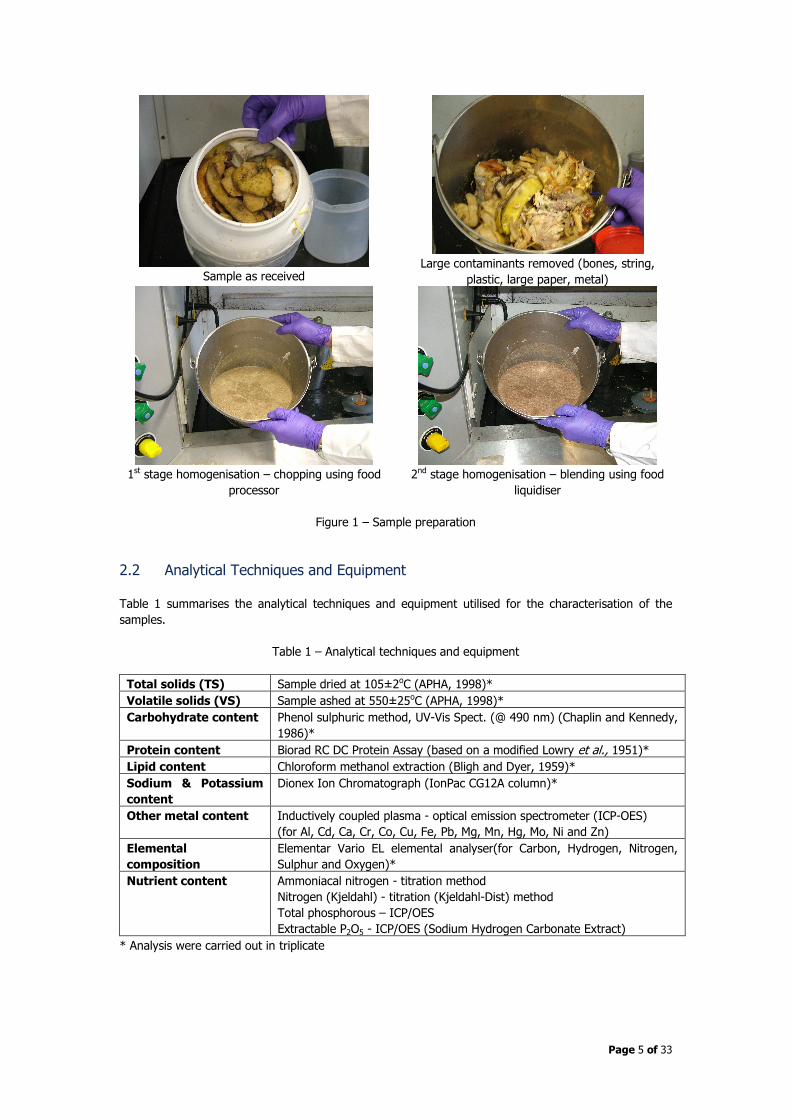
Homogenisation took place in two stages, the first stage involved chopping using an electric food
processor and the second stage involved blending using a food liquidiser. At both stages of
homogenization sufficient deionised water was added to create a vortex and hence good mixing in the
vessel. The volume of water was recorded so that all the analysis could be corrected for the added
water. See Figure 1 that illustrates the procedure. Samples were then frozen and defrosted prior to
some of the analysis.
Page 5 of 33
Sample as received
Large contaminants removed (bones, string,
plastic, large paper, metal)
1st stage homogenisation – chopping using food
processor
2nd stage homogenisation – blending using food
liquidiser
Figure 1 – Sample preparation
2.2 Analytical Techniques and Equipment
Table 1 summarises the analytical techniques and equipment utilised for the characterisation of the
samples.
Table 1 – Analytical techniques and equipment
Total solids (TS) Sample dried at 105±2oC (APHA, 1998)*
Volatile solids (VS) Sample ashed at 550±25oC (APHA, 1998)*
Carbohydrate content Phenol sulphuric method, UV-Vis Spect. (@ 490 nm) (Chaplin and Kennedy,
1986)*
Protein content Biorad RC DC Protein Assay (based on a modified Lowry et al., 1951)*
Lipid content Chloroform methanol extraction (Bligh and Dyer, 1959)*
Sodium & Potassium
content
Dionex Ion Chromatograph (IonPac CG12A column)*
Other metal content
Inductively coupled plasma - optical emission spectrometer (ICP-OES)
(for Al, Cd, Ca, Cr, Co, Cu, Fe, Pb, Mg, Mn, Hg, Mo, Ni and Zn)
Elemental
composition
Elementar Vario EL elemental analyser(for Carbon, Hydrogen, Nitrogen,
Sulphur and Oxygen)*
Nutrient content Ammoniacal nitrogen - titration method
Nitrogen (Kjeldahl) - titration (Kjeldahl-Dist) method
Total phosphorous – ICP/OES
Extractable P2O5 - ICP/OES (Sodium Hydrogen Carbonate Extract)
* Analysis were carried out in triplicate
Page 6 of 33
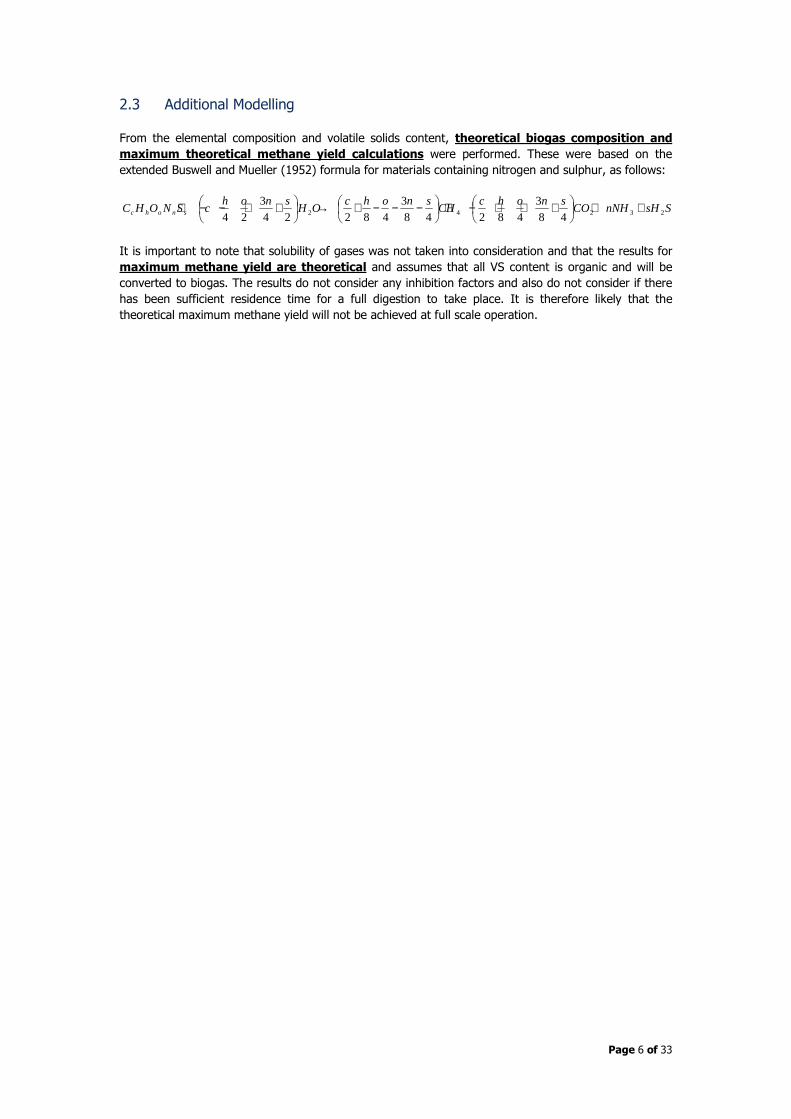
2.3 Additional Modelling
From the elemental composition and volatile solids content, theoretical biogas composition and
maximum theoretical methane yield calculations were performed. These were based on the
extended Buswell and Mueller (1952) formula for materials containing nitrogen and sulphur, as follows:
SsHnNHCOsnohc
CHsnohc
OHsnoh
cSNOHC snohc 23242 48
3
48248
3
48224
3
24++
+++−+
−−−+→
++−−+
It is important to note that solubility of gases was not taken into consideration and that the results for
maximum methane yield are theoretical and assumes that all VS content is organic and will be
converted to biogas. The results do not consider any inhibition factors and also do not consider if there
has been sufficient residence time for a full digestion to take place. It is therefore likely that the
theoretical maximum methane yield will not be achieved at full scale operation.
Page 7 of 33
3.0 Results and Discussion
This section includes the results and discussion related to the summer and winter 2009 chemical
analysis of the food waste produced by Local Authorities in Wales.
3.1 Solid Content Results
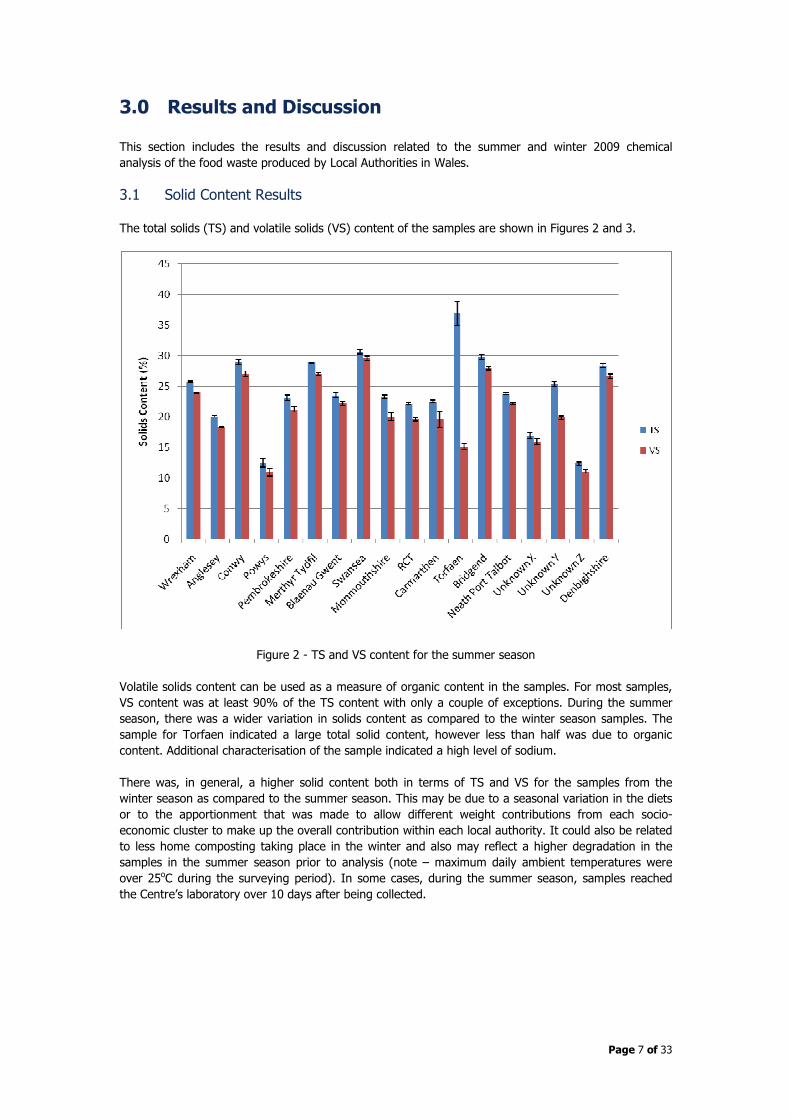
The total solids (TS) and volatile solids (VS) content of the samples are shown in Figures 2 and 3.
Figure 2 - TS and VS content for the summer season
Volatile solids content can be used as a measure of organic content in the samples. For most samples,
VS content was at least 90% of the TS content with only a couple of exceptions. During the summer
season, there was a wider variation in solids content as compared to the winter season samples. The
sample for Torfaen indicated a large total solid content, however less than half was due to organic
content. Additional characterisation of the sample indicated a high level of sodium.
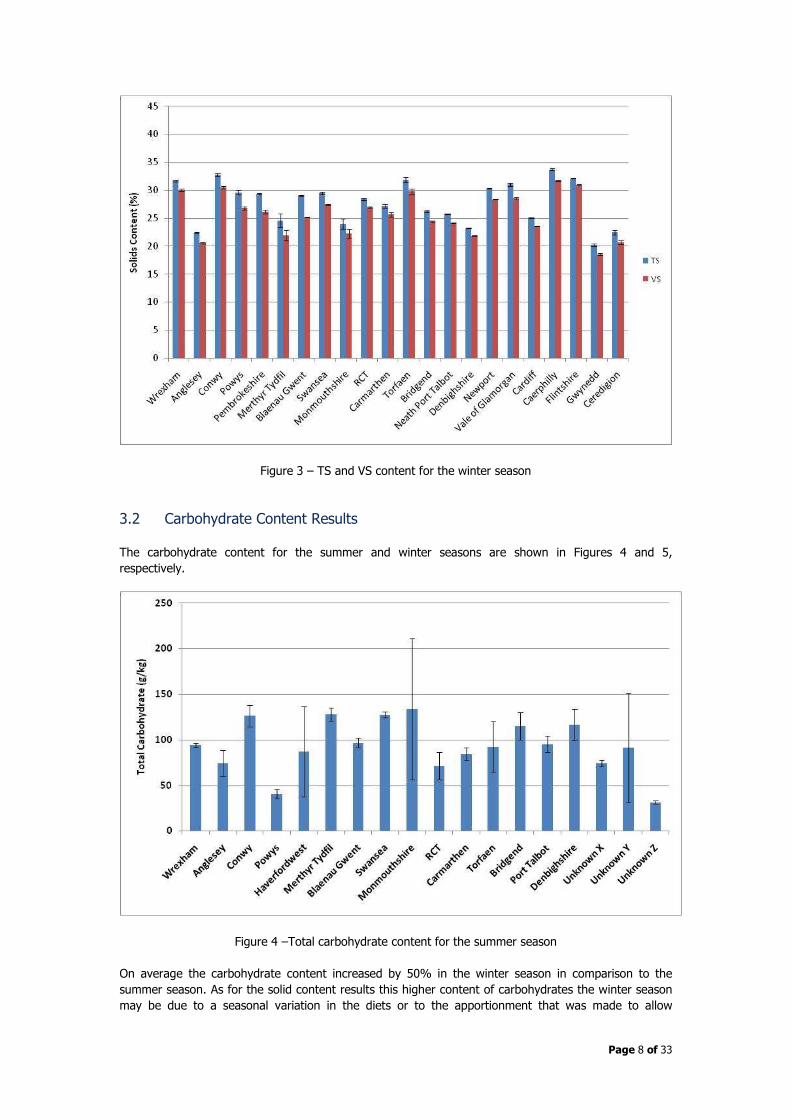
There was, in general, a higher solid content both in terms of TS and VS for the samples from the
winter season as compared to the summer season. This may be due to a seasonal variation in the diets
or to the apportionment that was made to allow different weight contributions from each socio-
economic cluster to make up the overall contribution within each local authority. It could also be related
to less home composting taking place in the winter and also may reflect a higher degradation in the
samples in the summer season prior to analysis (note – maximum daily ambient temperatures were
over 25oC during the surveying period). In some cases, during the summer season, samples reached
the Centre’s laboratory over 10 days after being collected.
Page 8 of 33
Figure 3 – TS and VS content for the winter season
3.2 Carbohydrate Content Results
The carbohydrate content for the summer and winter seasons are shown in Figures 4 and 5,
respectively.
Figure 4 –Total carbohydrate content for the summer season
On average the carbohydrate content increased by 50% in the winter season in comparison to the
summer season. As for the solid content results this higher content of carbohydrates the winter season
may be due to a seasonal variation in the diets or to the apportionment that was made to allow
Page 9 of 33
different weight contributions from each socio-economic cluster to make up the overall contribution
within each local authority. It could also be related to less home composting taking place in the winter
and also may reflect a higher degradation in the samples in the summer season prior to analysis (note –
maximum daily ambient temperatures were over 25oC during the surveying period). In some cases,
during the summer season, samples reached the Centre’s laboratory over 10 days after being collected.
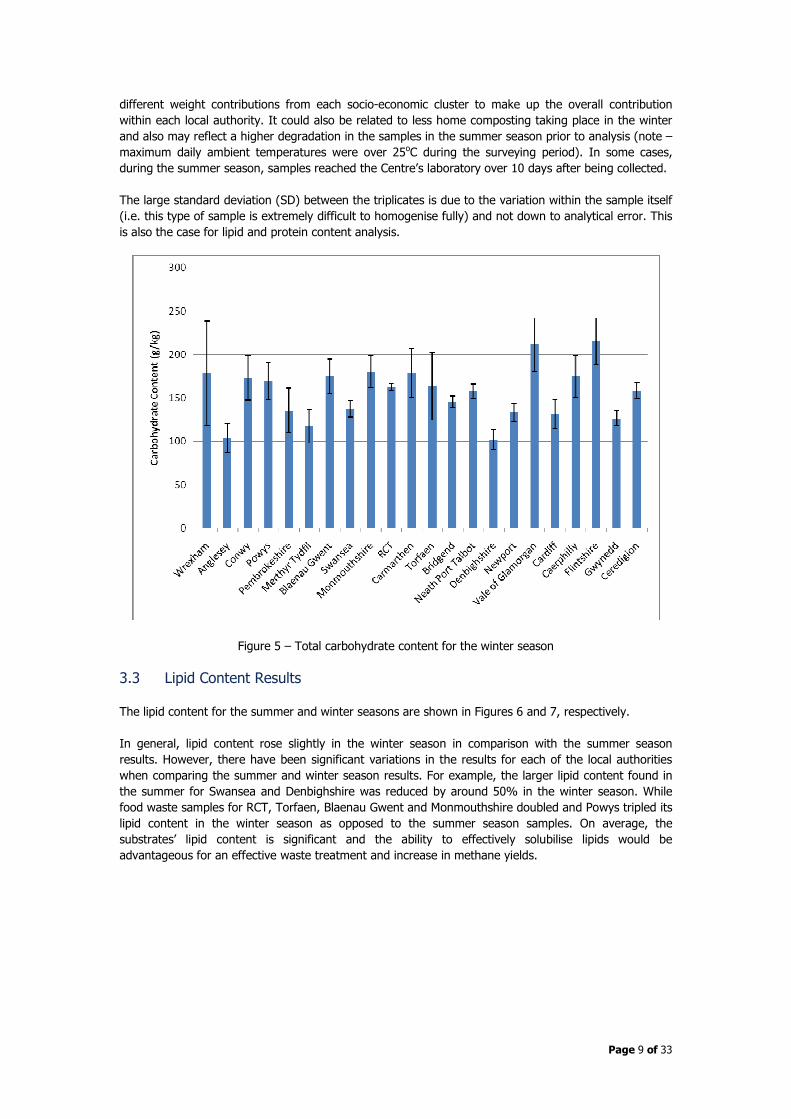
The large standard deviation (SD) between the triplicates is due to the variation within the sample itself
(i.e. this type of sample is extremely difficult to homogenise fully) and not down to analytical error. This
is also the case for lipid and protein content analysis.
Figure 5 – Total carbohydrate content for the winter season
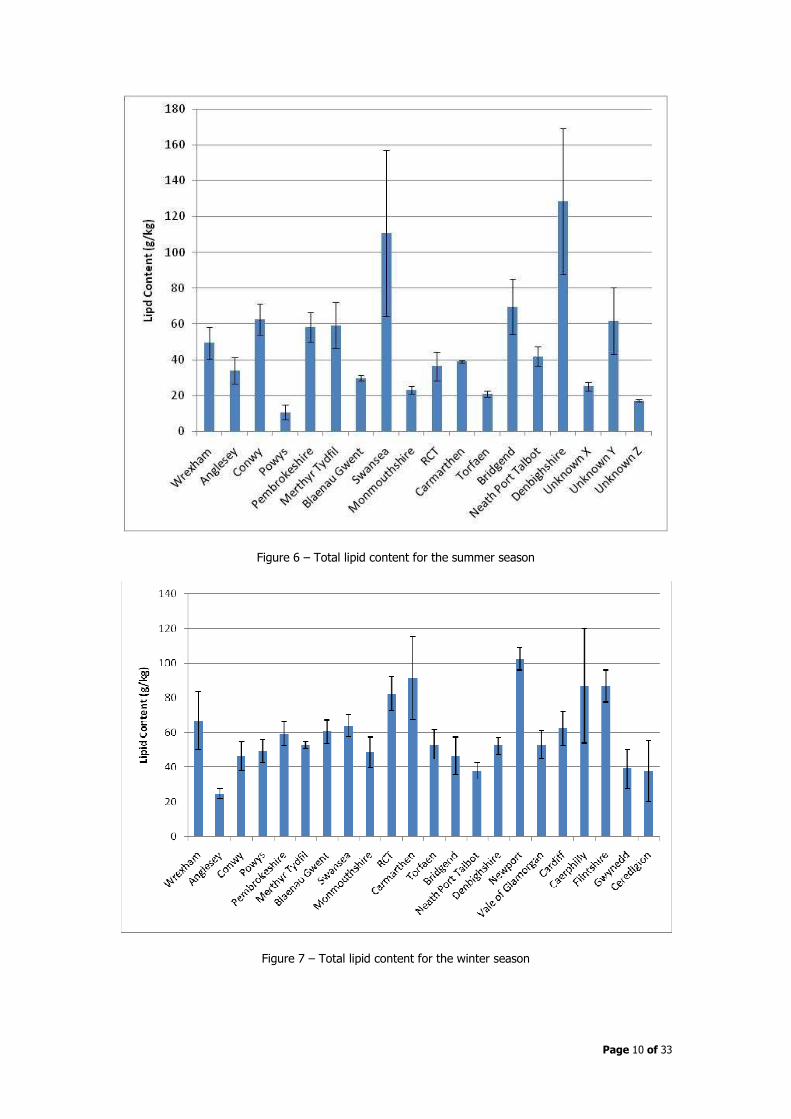
3.3 Lipid Content Results
The lipid content for the summer and winter seasons are shown in Figures 6 and 7, respectively.
In general, lipid content rose slightly in the winter season in comparison with the summer season
results. However, there have been significant variations in the results for each of the local authorities
when comparing the summer and winter season results. For example, the larger lipid content found in
the summer for Swansea and Denbighshire was reduced by around 50% in the winter season. While
food waste samples for RCT, Torfaen, Blaenau Gwent and Monmouthshire doubled and Powys tripled its
lipid content in the winter season as opposed to the summer season samples. On average, the
substrates’ lipid content is significant and the ability to effectively solubilise lipids would be
advantageous for an effective waste treatment and increase in methane yields.
Page 10 of 33
Figure 6 – Total lipid content for the summer season
Figure 7 – Total lipid content for the winter season
Page 11 of 33
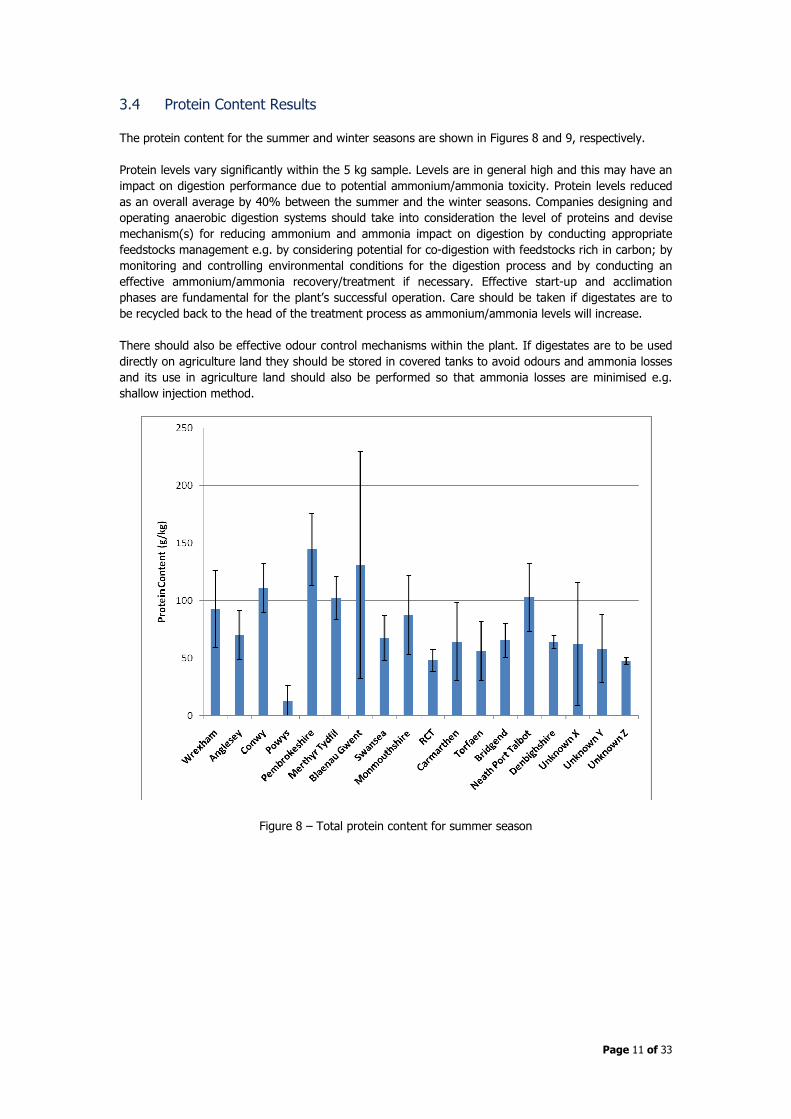
3.4 Protein Content Results
The protein content for the summer and winter seasons are shown in Figures 8 and 9, respectively.
Protein levels vary significantly within the 5 kg sample. Levels are in general high and this may have an
impact on digestion performance due to potential ammonium/ammonia toxicity. Protein levels reduced
as an overall average by 40% between the summer and the winter seasons. Companies designing and
operating anaerobic digestion systems should take into consideration the level of proteins and devise
mechanism(s) for reducing ammonium and ammonia impact on digestion by conducting appropriate
feedstocks management e.g. by considering potential for co-digestion with feedstocks rich in carbon; by
monitoring and controlling environmental conditions for the digestion process and by conducting an
effective ammonium/ammonia recovery/treatment if necessary. Effective start-up and acclimation
phases are fundamental for the plant’s successful operation. Care should be taken if digestates are to
be recycled back to the head of the treatment process as ammonium/ammonia levels will increase.
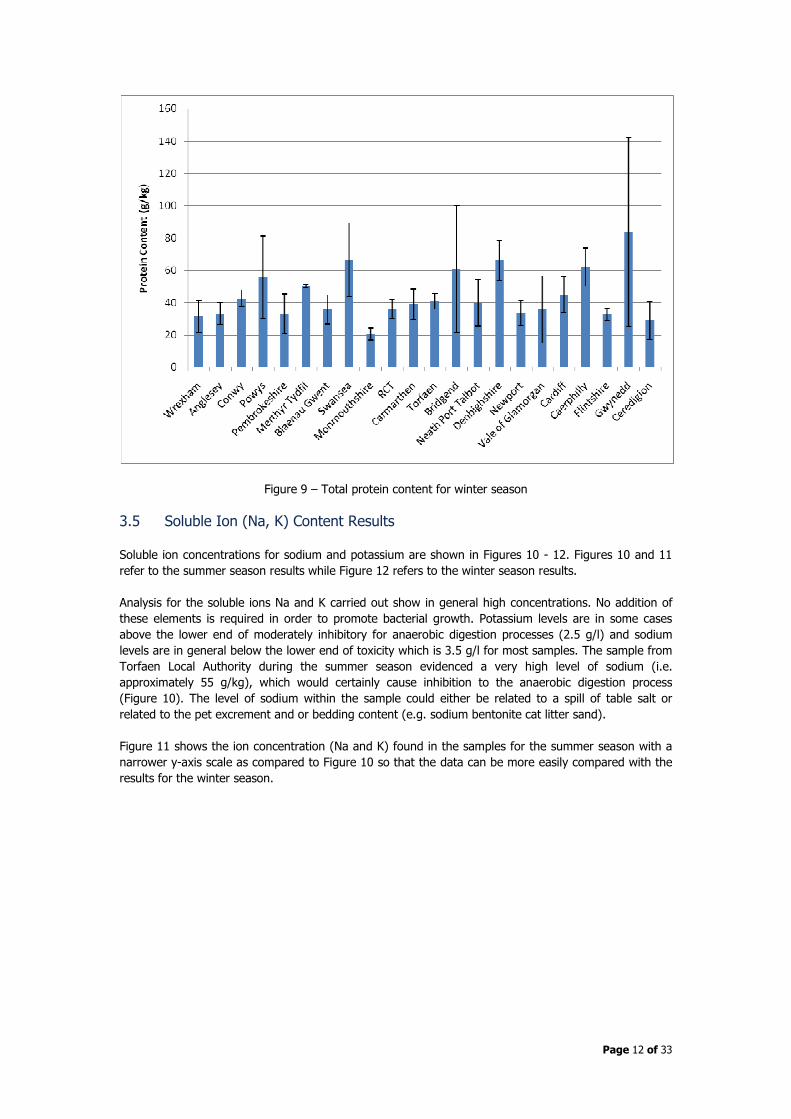
There should also be effective odour control mechanisms within the plant. If digestates are to be used
directly on agriculture land they should be stored in covered tanks to avoid odours and ammonia losses
and its use in agriculture land should also be performed so that ammonia losses are minimised e.g.
shallow injection method.
Figure 8 – Total protein content for summer season
Page 12 of 33
Figure 9 – Total protein content for winter season
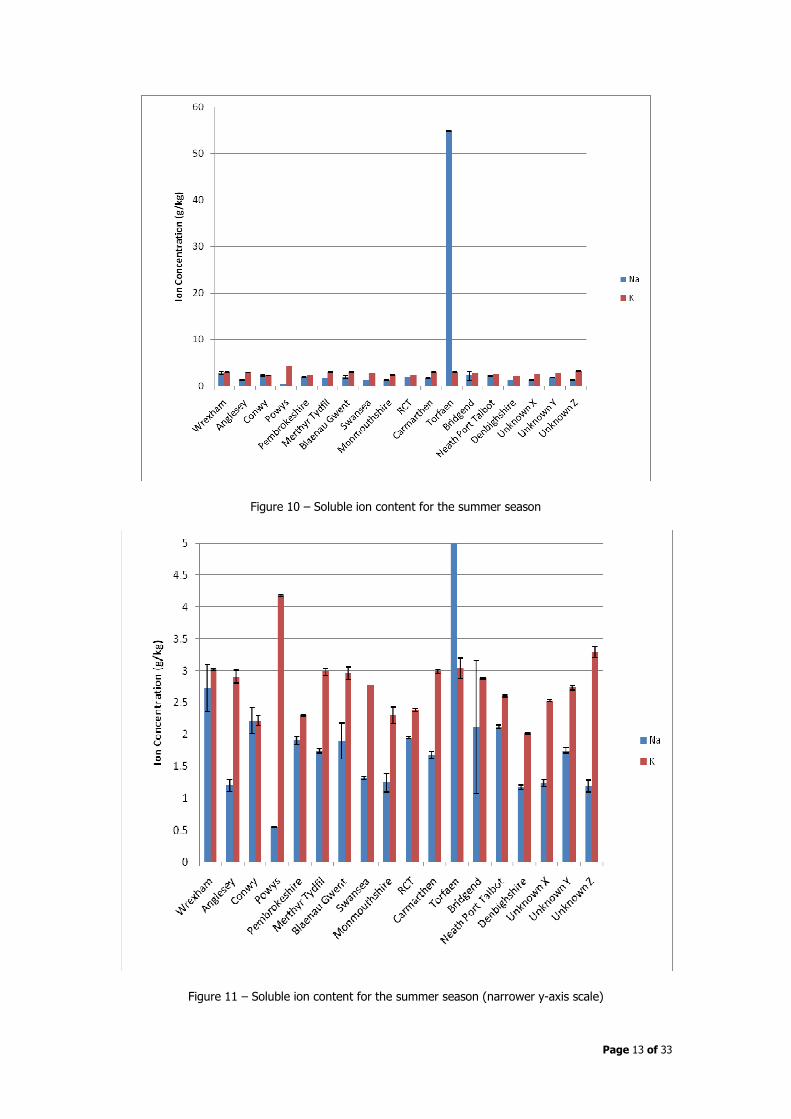
3.5 Soluble Ion (Na, K) Content Results
Soluble ion concentrations for sodium and potassium are shown in Figures 10 - 12. Figures 10 and 11
refer to the summer season results while Figure 12 refers to the winter season results.
Analysis for the soluble ions Na and K carried out show in general high concentrations. No addition of
these elements is required in order to promote bacterial growth. Potassium levels are in some cases
above the lower end of moderately inhibitory for anaerobic digestion processes (2.5 g/l) and sodium
levels are in general below the lower end of toxicity which is 3.5 g/l for most samples. The sample from
Torfaen Local Authority during the summer season evidenced a very high level of sodium (i.e.
approximately 55 g/kg), which would certainly cause inhibition to the anaerobic digestion process
(Figure 10). The level of sodium within the sample could either be related to a spill of table salt or
related to the pet excrement and or bedding content (e.g. sodium bentonite cat litter sand).
Figure 11 shows the ion concentration (Na and K) found in the samples for the summer season with a
narrower y-axis scale as compared to Figure 10 so that the data can be more easily compared with the
results for the winter season.
Page 13 of 33
Figure 10 – Soluble ion content for the summer season
Figure 11 – Soluble ion content for the summer season (narrower y-axis scale)
Page 14 of 33
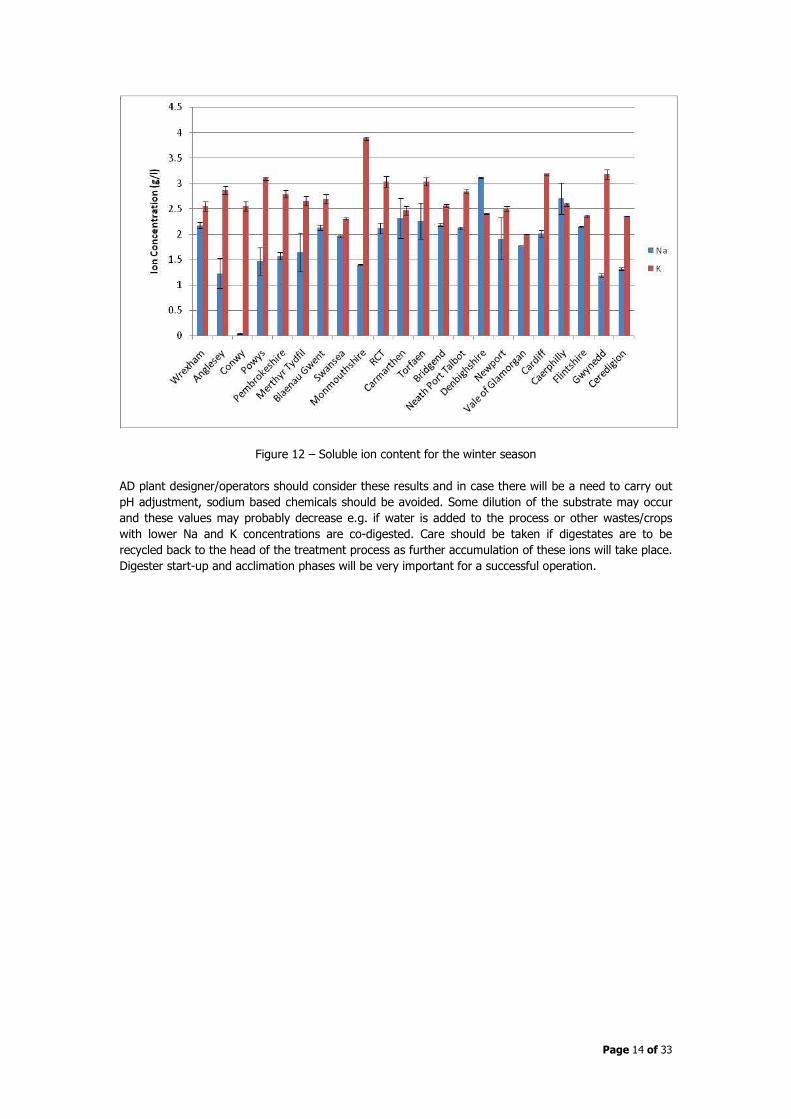
Figure 12 – Soluble ion content for the winter season
AD plant designer/operators should consider these results and in case there will be a need to carry out
pH adjustment, sodium based chemicals should be avoided. Some dilution of the substrate may occur
and these values may probably decrease e.g. if water is added to the process or other wastes/crops
with lower Na and K concentrations are co-digested. Care should be taken if digestates are to be
recycled back to the head of the treatment process as further accumulation of these ions will take place.
Digester start-up and acclimation phases will be very important for a successful operation.
Page 15 of 33
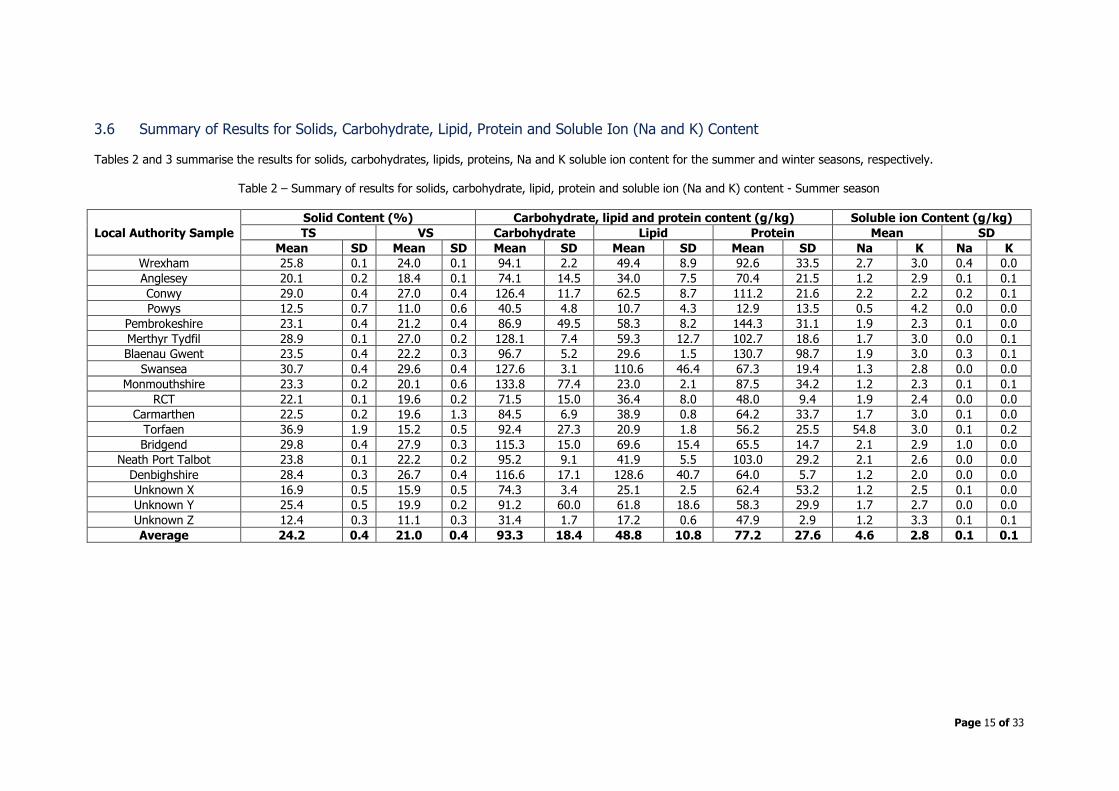
3.6 Summary of Results for Solids, Carbohydrate, Lipid, Protein and Soluble Ion (Na and K) Content
Tables 2 and 3 summarise the results for solids, carbohydrates, lipids, proteins, Na and K soluble ion content for the summer and winter seasons, respectively.
Table 2 – Summary of results for solids, carbohydrate, lipid, protein and soluble ion (Na and K) content - Summer season
Local Authority Sample
Solid Content (%) Carbohydrate, lipid and protein content (g/kg) Soluble ion Content (g/kg)
TS VS Carbohydrate Lipid Protein Mean SD
Mean SD Mean SD Mean SD Mean SD Mean SD Na K Na K
Wrexham 25.8 0.1 24.0 0.1 94.1 2.2 49.4 8.9 92.6 33.5 2.7 3.0 0.4 0.0
Anglesey 20.1 0.2 18.4 0.1 74.1 14.5 34.0 7.5 70.4 21.5 1.2 2.9 0.1 0.1
Conwy 29.0 0.4 27.0 0.4 126.4 11.7 62.5 8.7 111.2 21.6 2.2 2.2 0.2 0.1
Powys 12.5 0.7 11.0 0.6 40.5 4.8 10.7 4.3 12.9 13.5 0.5 4.2 0.0 0.0
Pembrokeshire 23.1 0.4 21.2 0.4 86.9 49.5 58.3 8.2 144.3 31.1 1.9 2.3 0.1 0.0
Merthyr Tydfil 28.9 0.1 27.0 0.2 128.1 7.4 59.3 12.7 102.7 18.6 1.7 3.0 0.0 0.1
Blaenau Gwent 23.5 0.4 22.2 0.3 96.7 5.2 29.6 1.5 130.7 98.7 1.9 3.0 0.3 0.1
Swansea 30.7 0.4 29.6 0.4 127.6 3.1 110.6 46.4 67.3 19.4 1.3 2.8 0.0 0.0
Monmouthshire 23.3 0.2 20.1 0.6 133.8 77.4 23.0 2.1 87.5 34.2 1.2 2.3 0.1 0.1
RCT 22.1 0.1 19.6 0.2 71.5 15.0 36.4 8.0 48.0 9.4 1.9 2.4 0.0 0.0
Carmarthen 22.5 0.2 19.6 1.3 84.5 6.9 38.9 0.8 64.2 33.7 1.7 3.0 0.1 0.0
Torfaen 36.9 1.9 15.2 0.5 92.4 27.3 20.9 1.8 56.2 25.5 54.8 3.0 0.1 0.2
Bridgend 29.8 0.4 27.9 0.3 115.3 15.0 69.6 15.4 65.5 14.7 2.1 2.9 1.0 0.0
Neath Port Talbot 23.8 0.1 22.2 0.2 95.2 9.1 41.9 5.5 103.0 29.2 2.1 2.6 0.0 0.0
Denbighshire 28.4 0.3 26.7 0.4 116.6 17.1 128.6 40.7 64.0 5.7 1.2 2.0 0.0 0.0
Unknown X 16.9 0.5 15.9 0.5 74.3 3.4 25.1 2.5 62.4 53.2 1.2 2.5 0.1 0.0
Unknown Y 25.4 0.5 19.9 0.2 91.2 60.0 61.8 18.6 58.3 29.9 1.7 2.7 0.0 0.0
Unknown Z 12.4 0.3 11.1 0.3 31.4 1.7 17.2 0.6 47.9 2.9 1.2 3.3 0.1 0.1
Average 24.2 0.4 21.0 0.4 93.3 18.4 48.8 10.8 77.2 27.6 4.6 2.8 0.1 0.1
Page 16 of 33
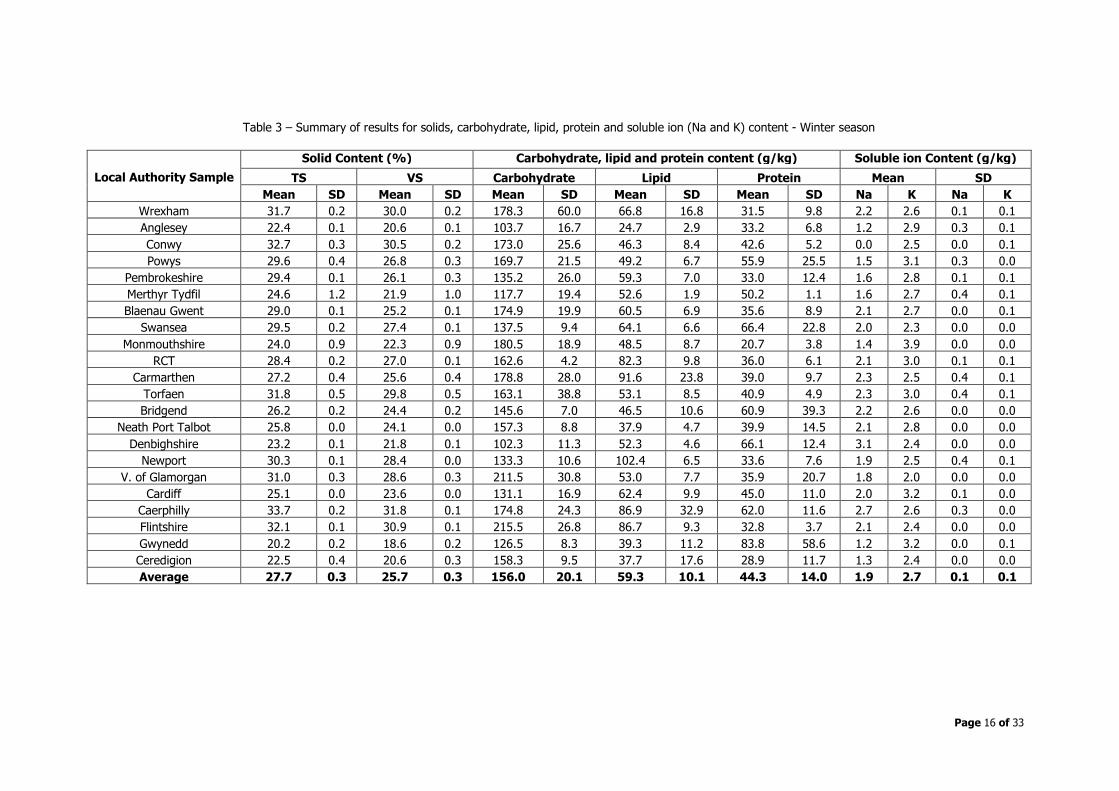
Table 3 – Summary of results for solids, carbohydrate, lipid, protein and soluble ion (Na and K) content - Winter season
Local Authority Sample
Solid Content (%) Carbohydrate, lipid and protein content (g/kg) Soluble ion Content (g/kg)
TS VS Carbohydrate Lipid Protein Mean SD
Mean SD Mean SD Mean SD Mean SD Mean SD Na K Na K
Wrexham 31.7 0.2 30.0 0.2 178.3 60.0 66.8 16.8 31.5 9.8 2.2 2.6 0.1 0.1
Anglesey 22.4 0.1 20.6 0.1 103.7 16.7 24.7 2.9 33.2 6.8 1.2 2.9 0.3 0.1
Conwy 32.7 0.3 30.5 0.2 173.0 25.6 46.3 8.4 42.6 5.2 0.0 2.5 0.0 0.1
Powys 29.6 0.4 26.8 0.3 169.7 21.5 49.2 6.7 55.9 25.5 1.5 3.1 0.3 0.0
Pembrokeshire 29.4 0.1 26.1 0.3 135.2 26.0 59.3 7.0 33.0 12.4 1.6 2.8 0.1 0.1
Merthyr Tydfil 24.6 1.2 21.9 1.0 117.7 19.4 52.6 1.9 50.2 1.1 1.6 2.7 0.4 0.1
Blaenau Gwent 29.0 0.1 25.2 0.1 174.9 19.9 60.5 6.9 35.6 8.9 2.1 2.7 0.0 0.1
Swansea 29.5 0.2 27.4 0.1 137.5 9.4 64.1 6.6 66.4 22.8 2.0 2.3 0.0 0.0
Monmouthshire 24.0 0.9 22.3 0.9 180.5 18.9 48.5 8.7 20.7 3.8 1.4 3.9 0.0 0.0
RCT 28.4 0.2 27.0 0.1 162.6 4.2 82.3 9.8 36.0 6.1 2.1 3.0 0.1 0.1
Carmarthen 27.2 0.4 25.6 0.4 178.8 28.0 91.6 23.8 39.0 9.7 2.3 2.5 0.4 0.1
Torfaen 31.8 0.5 29.8 0.5 163.1 38.8 53.1 8.5 40.9 4.9 2.3 3.0 0.4 0.1
Bridgend 26.2 0.2 24.4 0.2 145.6 7.0 46.5 10.6 60.9 39.3 2.2 2.6 0.0 0.0
Neath Port Talbot 25.8 0.0 24.1 0.0 157.3 8.8 37.9 4.7 39.9 14.5 2.1 2.8 0.0 0.0
Denbighshire 23.2 0.1 21.8 0.1 102.3 11.3 52.3 4.6 66.1 12.4 3.1 2.4 0.0 0.0
Newport 30.3 0.1 28.4 0.0 133.3 10.6 102.4 6.5 33.6 7.6 1.9 2.5 0.4 0.1
V. of Glamorgan 31.0 0.3 28.6 0.3 211.5 30.8 53.0 7.7 35.9 20.7 1.8 2.0 0.0 0.0
Cardiff 25.1 0.0 23.6 0.0 131.1 16.9 62.4 9.9 45.0 11.0 2.0 3.2 0.1 0.0
Caerphilly 33.7 0.2 31.8 0.1 174.8 24.3 86.9 32.9 62.0 11.6 2.7 2.6 0.3 0.0
Flintshire 32.1 0.1 30.9 0.1 215.5 26.8 86.7 9.3 32.8 3.7 2.1 2.4 0.0 0.0
Gwynedd 20.2 0.2 18.6 0.2 126.5 8.3 39.3 11.2 83.8 58.6 1.2 3.2 0.0 0.1
Ceredigion 22.5 0.4 20.6 0.3 158.3 9.5 37.7 17.6 28.9 11.7 1.3 2.4 0.0 0.0
Average 27.7 0.3 25.7 0.3 156.0 20.1 59.3 10.1 44.3 14.0 1.9 2.7 0.1 0.1
Page 17 of 33
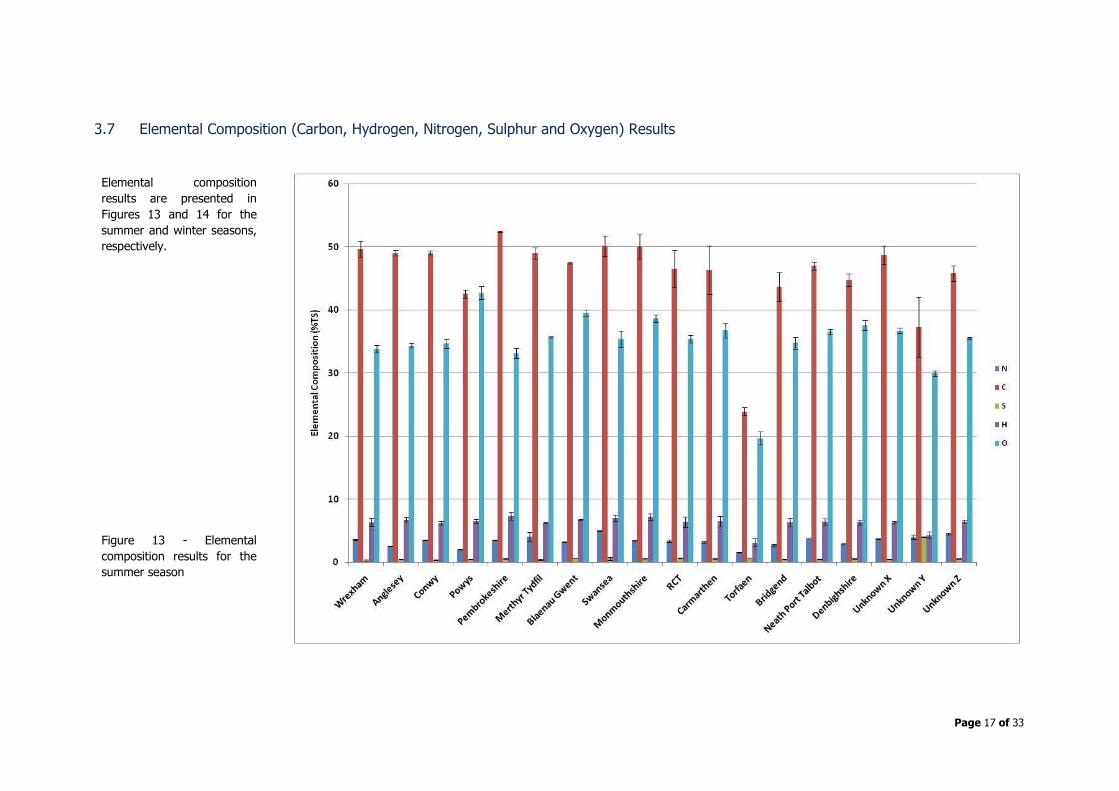
3.7 Elemental Composition (Carbon, Hydrogen, Nitrogen, Sulphur and Oxygen) Results
Elemental composition
results are presented in
Figures 13 and 14 for the
summer and winter seasons,
respectively.
Figure 13 - Elemental
composition results for the
summer season
Page 18 of 33
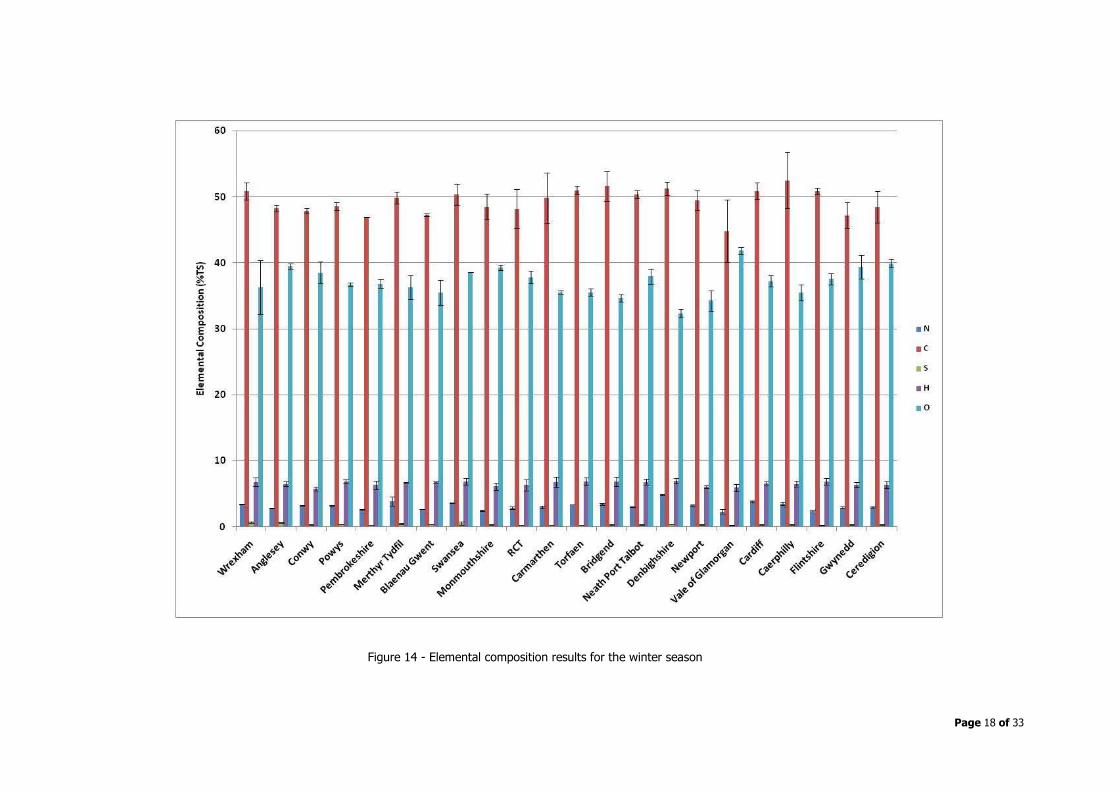
Figure 14 - Elemental composition results for the winter season
Food Waste Chemical Analysis 19
Elemental composition (Carbon, Hydrogen, Nitrogen, Sulphur and Oxygen) is able to provide the following
fundamental information:
• Data can be used to calculate the theoretical maximum biogas yields (as presented in section 3.9)
• C:N ratio is an important indicator of potential ammonium/ammonia toxicity
• Levels of elemental sulphur provide an indication of the level of desulphurisation that is likely to be
required for biogas and even if levels are likely to influence significantly inhibition/competition for substrate against the methanogens
Levels of elemental sulphur are relatively high throughout the two seasons with higher levels in the summer
season. H2S levels around 2000 ppm may be expected in the biogas when digesting these samples on average.
The sulphur level for the sample ‘Unknown Z’ in the summer season is however extremely high and therefore
even higher levels of H2S would be expected in the biogas. Toxicity and inhibition of the digestion process may
then be significant caused by sulphides and significant competition for substrates by the sulphate reducing
bacteria. Desulphurisation system(s) will need to be utilised in order to minimise health and safety risks and to
reduce corrosion effects in digesters, biogas pipes and biogas utilisation devices.
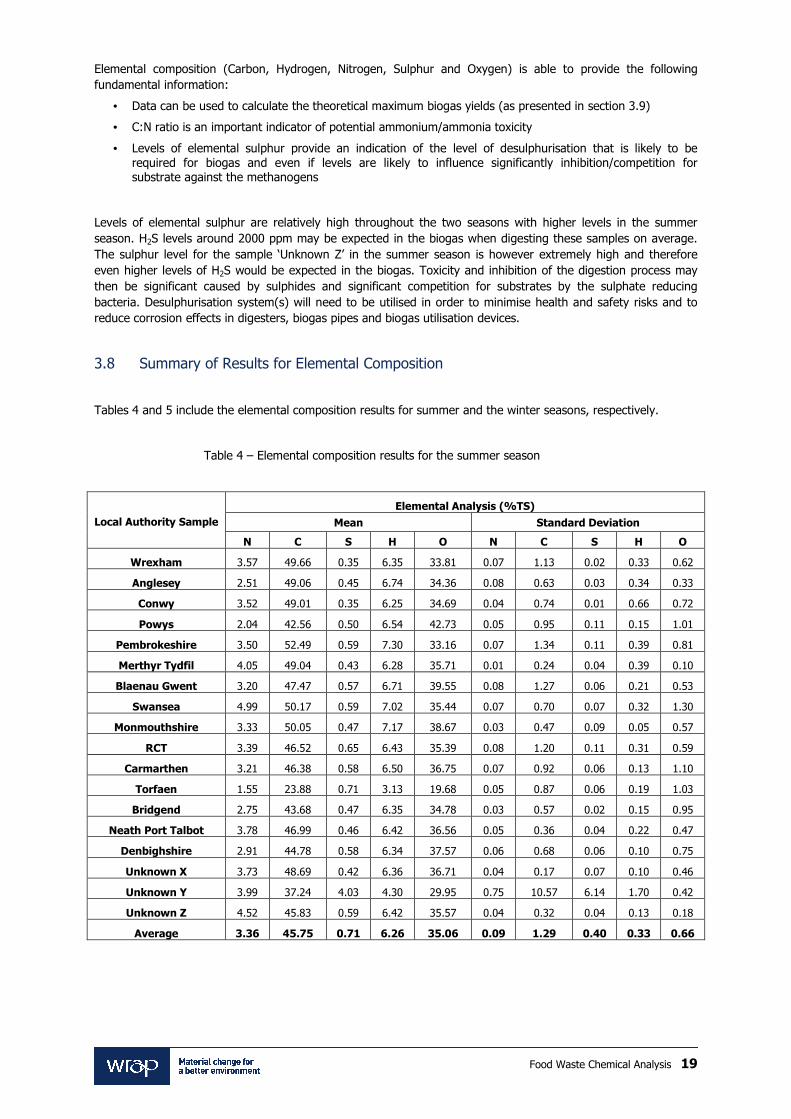
3.8 Summary of Results for Elemental Composition
Tables 4 and 5 include the elemental composition results for summer and the winter seasons, respectively.
Table 4 – Elemental composition results for the summer season
Local Authority Sample
Elemental Analysis (%TS)
Mean Standard Deviation
N C S H O N C S H O
Wrexham 3.57 49.66 0.35 6.35 33.81 0.07 1.13 0.02 0.33 0.62
Anglesey 2.51 49.06 0.45 6.74 34.36 0.08 0.63 0.03 0.34 0.33
Conwy 3.52 49.01 0.35 6.25 34.69 0.04 0.74 0.01 0.66 0.72
Powys 2.04 42.56 0.50 6.54 42.73 0.05 0.95 0.11 0.15 1.01
Pembrokeshire 3.50 52.49 0.59 7.30 33.16 0.07 1.34 0.11 0.39 0.81
Merthyr Tydfil 4.05 49.04 0.43 6.28 35.71 0.01 0.24 0.04 0.39 0.10
Blaenau Gwent 3.20 47.47 0.57 6.71 39.55 0.08 1.27 0.06 0.21 0.53
Swansea 4.99 50.17 0.59 7.02 35.44 0.07 0.70 0.07 0.32 1.30
Monmouthshire 3.33 50.05 0.47 7.17 38.67 0.03 0.47 0.09 0.05 0.57
RCT 3.39 46.52 0.65 6.43 35.39 0.08 1.20 0.11 0.31 0.59
Carmarthen 3.21 46.38 0.58 6.50 36.75 0.07 0.92 0.06 0.13 1.10
Torfaen 1.55 23.88 0.71 3.13 19.68 0.05 0.87 0.06 0.19 1.03
Bridgend 2.75 43.68 0.47 6.35 34.78 0.03 0.57 0.02 0.15 0.95
Neath Port Talbot 3.78 46.99 0.46 6.42 36.56 0.05 0.36 0.04 0.22 0.47
Denbighshire 2.91 44.78 0.58 6.34 37.57 0.06 0.68 0.06 0.10 0.75
Unknown X 3.73 48.69 0.42 6.36 36.71 0.04 0.17 0.07 0.10 0.46
Unknown Y 3.99 37.24 4.03 4.30 29.95 0.75 10.57 6.14 1.70 0.42
Unknown Z 4.52 45.83 0.59 6.42 35.57 0.04 0.32 0.04 0.13 0.18
Average 3.36 45.75 0.71 6.26 35.06 0.09 1.29 0.40 0.33 0.66
Food Waste Chemical Analysis 20
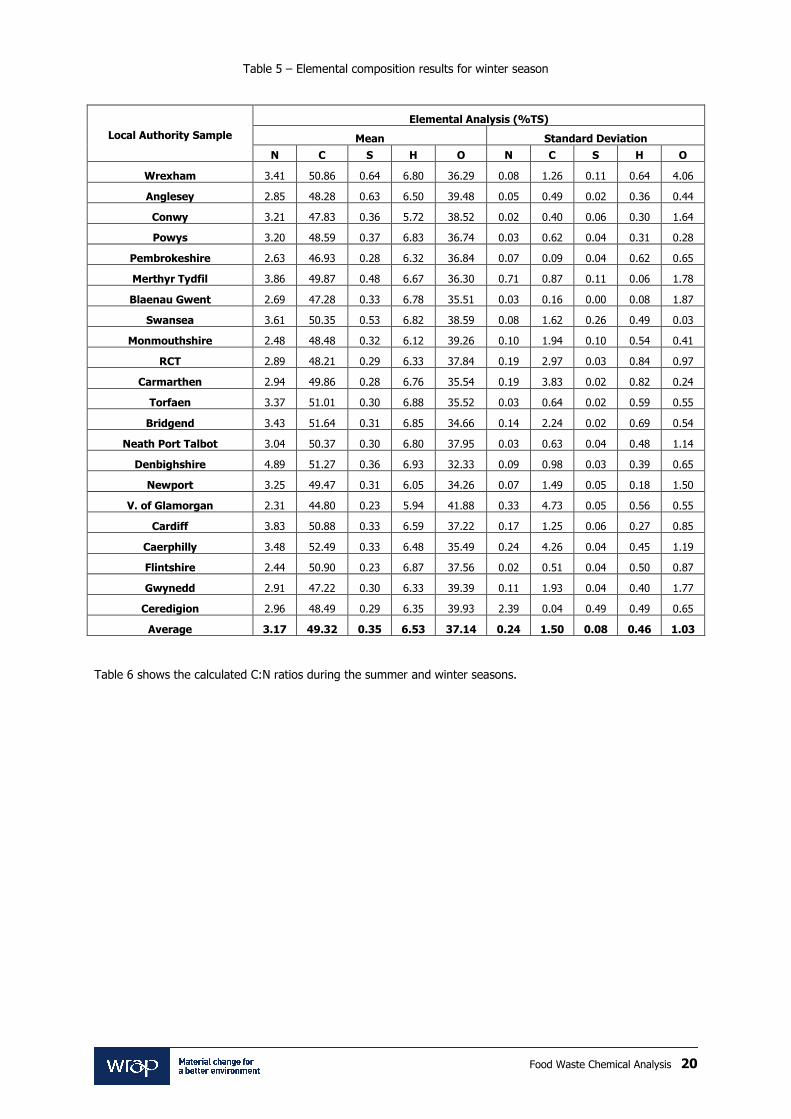
Table 5 – Elemental composition results for winter season
Local Authority Sample
Elemental Analysis (%TS)
Mean Standard Deviation
N C S H O N C S H O
Wrexham 3.41 50.86 0.64 6.80 36.29 0.08 1.26 0.11 0.64 4.06
Anglesey 2.85 48.28 0.63 6.50 39.48 0.05 0.49 0.02 0.36 0.44
Conwy 3.21 47.83 0.36 5.72 38.52 0.02 0.40 0.06 0.30 1.64
Powys 3.20 48.59 0.37 6.83 36.74 0.03 0.62 0.04 0.31 0.28
Pembrokeshire 2.63 46.93 0.28 6.32 36.84 0.07 0.09 0.04 0.62 0.65
Merthyr Tydfil 3.86 49.87 0.48 6.67 36.30 0.71 0.87 0.11 0.06 1.78
Blaenau Gwent 2.69 47.28 0.33 6.78 35.51 0.03 0.16 0.00 0.08 1.87
Swansea 3.61 50.35 0.53 6.82 38.59 0.08 1.62 0.26 0.49 0.03
Monmouthshire 2.48 48.48 0.32 6.12 39.26 0.10 1.94 0.10 0.54 0.41
RCT 2.89 48.21 0.29 6.33 37.84 0.19 2.97 0.03 0.84 0.97
Carmarthen 2.94 49.86 0.28 6.76 35.54 0.19 3.83 0.02 0.82 0.24
Torfaen 3.37 51.01 0.30 6.88 35.52 0.03 0.64 0.02 0.59 0.55
Bridgend 3.43 51.64 0.31 6.85 34.66 0.14 2.24 0.02 0.69 0.54
Neath Port Talbot 3.04 50.37 0.30 6.80 37.95 0.03 0.63 0.04 0.48 1.14
Denbighshire 4.89 51.27 0.36 6.93 32.33 0.09 0.98 0.03 0.39 0.65
Newport 3.25 49.47 0.31 6.05 34.26 0.07 1.49 0.05 0.18 1.50
V. of Glamorgan 2.31 44.80 0.23 5.94 41.88 0.33 4.73 0.05 0.56 0.55
Cardiff 3.83 50.88 0.33 6.59 37.22 0.17 1.25 0.06 0.27 0.85
Caerphilly 3.48 52.49 0.33 6.48 35.49 0.24 4.26 0.04 0.45 1.19
Flintshire 2.44 50.90 0.23 6.87 37.56 0.02 0.51 0.04 0.50 0.87
Gwynedd 2.91 47.22 0.30 6.33 39.39 0.11 1.93 0.04 0.40 1.77
Ceredigion 2.96 48.49 0.29 6.35 39.93 2.39 0.04 0.49 0.49 0.65
Average 3.17 49.32 0.35 6.53 37.14 0.24 1.50 0.08 0.46 1.03
Table 6 shows the calculated C:N ratios during the summer and winter seasons.
Food Waste Chemical Analysis 21
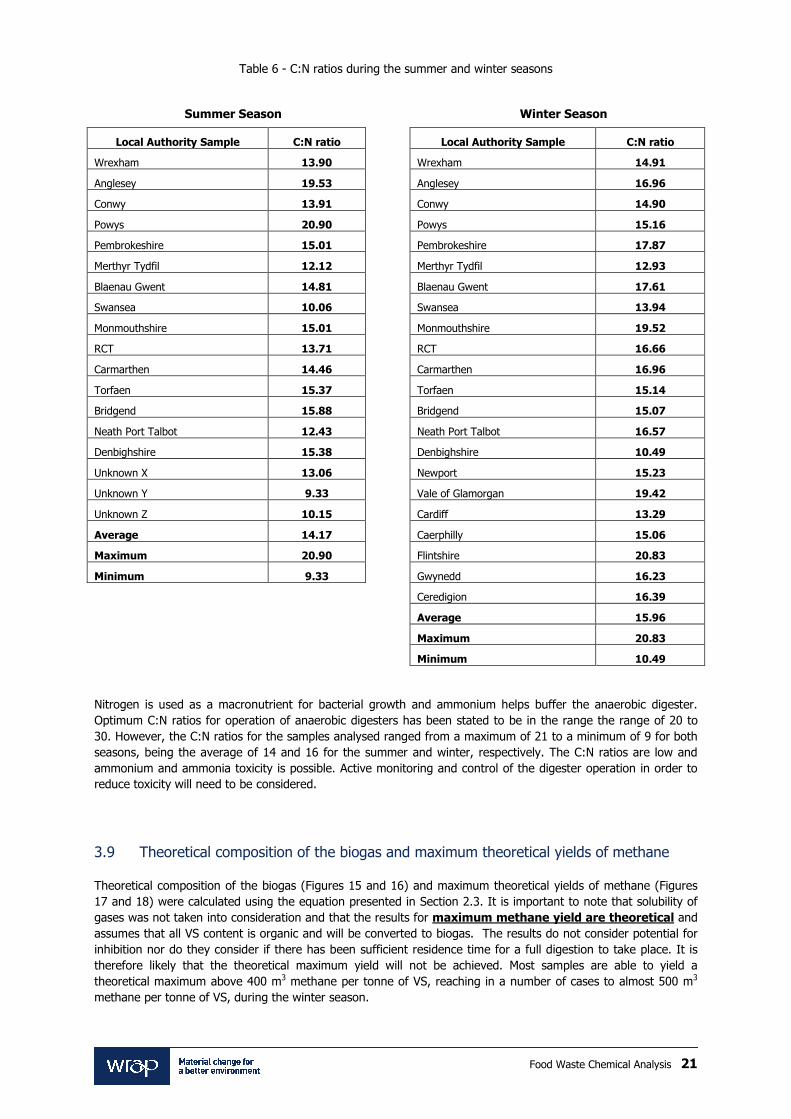
Table 6 - C:N ratios during the summer and winter seasons
Summer Season Winter Season
Local Authority Sample C:N ratio Local Authority Sample C:N ratio
Wrexham 13.90 Wrexham 14.91
Anglesey 19.53 Anglesey 16.96
Conwy 13.91 Conwy 14.90
Powys 20.90 Powys 15.16
Pembrokeshire 15.01 Pembrokeshire 17.87
Merthyr Tydfil 12.12 Merthyr Tydfil 12.93
Blaenau Gwent 14.81 Blaenau Gwent 17.61
Swansea 10.06 Swansea 13.94
Monmouthshire 15.01 Monmouthshire 19.52
RCT 13.71 RCT 16.66
Carmarthen 14.46 Carmarthen 16.96
Torfaen 15.37 Torfaen 15.14
Bridgend 15.88 Bridgend 15.07
Neath Port Talbot 12.43 Neath Port Talbot 16.57
Denbighshire 15.38 Denbighshire 10.49
Unknown X 13.06 Newport 15.23
Unknown Y 9.33 Vale of Glamorgan 19.42
Unknown Z 10.15 Cardiff 13.29
Average 14.17 Caerphilly 15.06
Maximum 20.90 Flintshire 20.83
Minimum 9.33 Gwynedd 16.23
Ceredigion 16.39
Average 15.96
Maximum 20.83
Minimum 10.49
Nitrogen is used as a macronutrient for bacterial growth and ammonium helps buffer the anaerobic digester.
Optimum C:N ratios for operation of anaerobic digesters has been stated to be in the range the range of 20 to
30. However, the C:N ratios for the samples analysed ranged from a maximum of 21 to a minimum of 9 for both
seasons, being the average of 14 and 16 for the summer and winter, respectively. The C:N ratios are low and
ammonium and ammonia toxicity is possible. Active monitoring and control of the digester operation in order to
reduce toxicity will need to be considered.
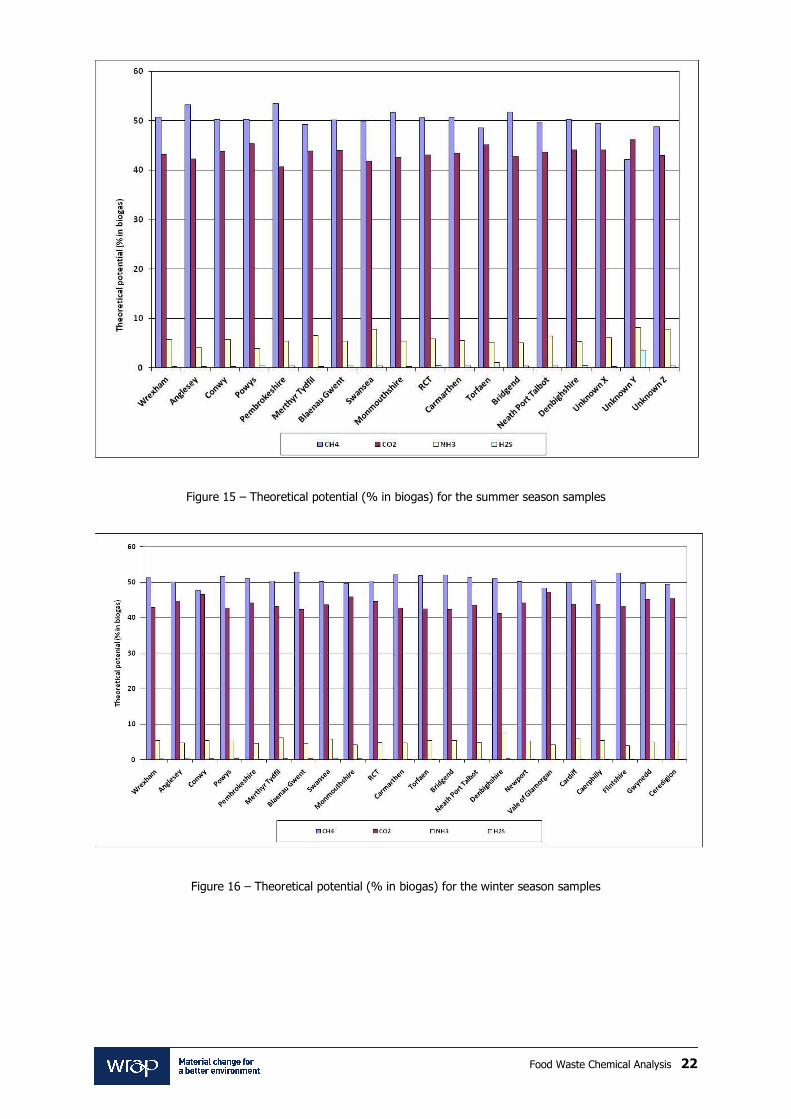
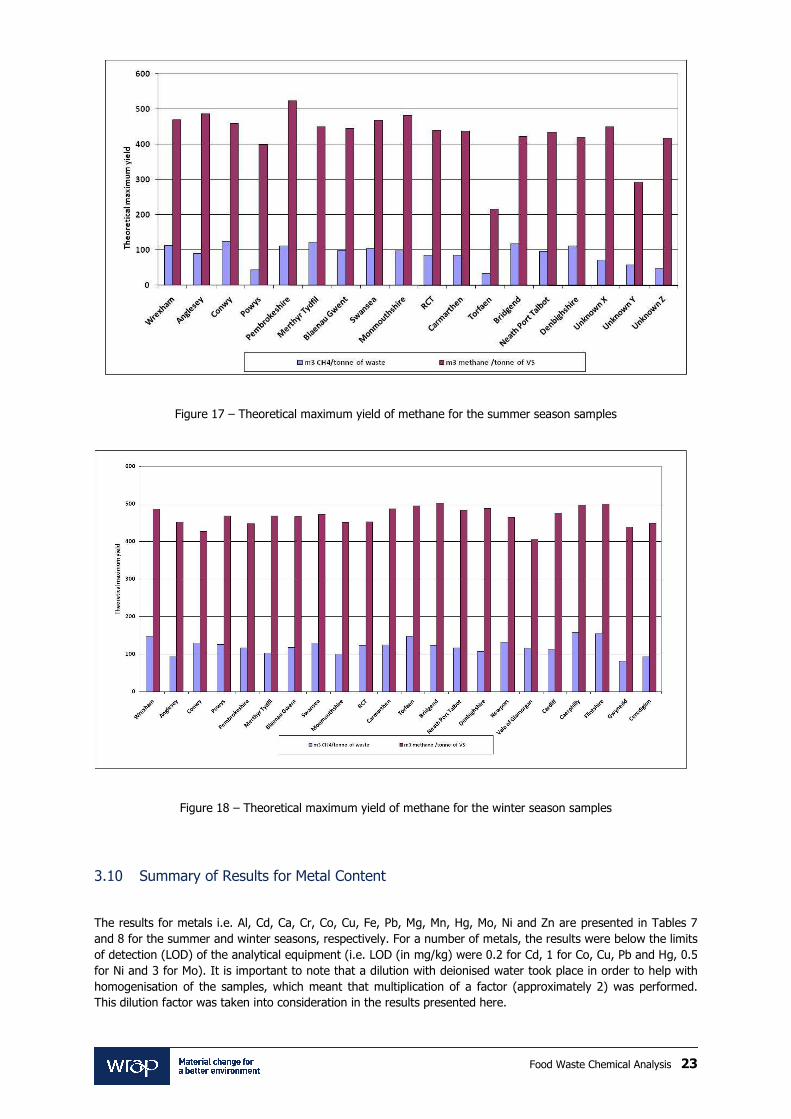
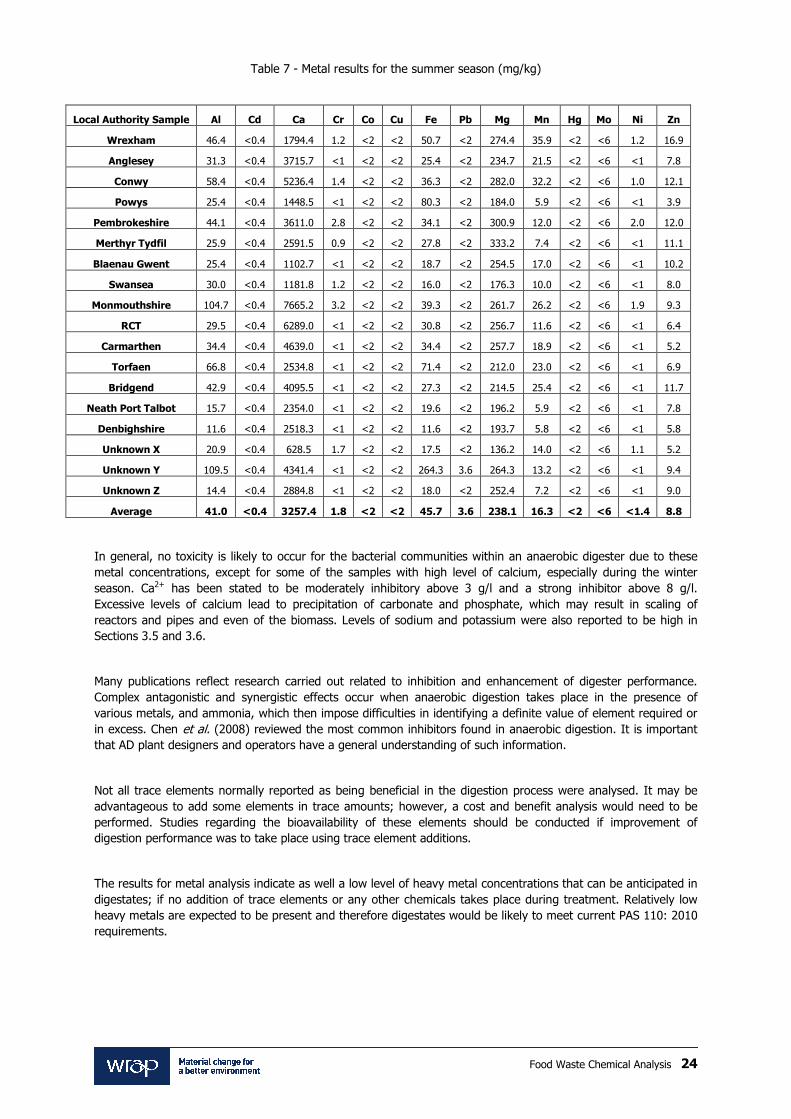
3.9 Theoretical composition of the biogas and maximum theoretical yields of methane
Theoretical composition of the biogas (Figures 15 and 16) and maximum theoretical yields of methane (Figures
17 and 18) were calculated using the equation presented in Section 2.3. It is important to note that solubility of
gases was not taken into consideration and that the results for maximum methane yield are theoretical and
assumes that all VS content is organic and will be converted to biogas. The results do not consider potential for
inhibition nor do they consider if there has been sufficient residence time for a full digestion to take place. It is
therefore likely that the theoretical maximum yield will not be achieved. Most samples are able to yield a
theoretical maximum above 400 m3 methane per tonne of VS, reaching in a number of cases to almost 500 m3
methane per tonne of VS, during the winter season.
Food Waste Chemical Analysis 22
Figure 15 – Theoretical potential (% in biogas) for the summer season samples
Figure 16 – Theoretical potential (% in biogas) for the winter season samples
Food Waste Chemical Analysis 23
Figure 17 – Theoretical maximum yield of methane for the summer season samples
Figure 18 – Theoretical maximum yield of methane for the winter season samples
3.10 Summary of Results for Metal Content
The results for metals i.e. Al, Cd, Ca, Cr, Co, Cu, Fe, Pb, Mg, Mn, Hg, Mo, Ni and Zn are presented in Tables 7
and 8 for the summer and winter seasons, respectively. For a number of metals, the results were below the limits
of detection (LOD) of the analytical equipment (i.e. LOD (in mg/kg) were 0.2 for Cd, 1 for Co, Cu, Pb and Hg, 0.5
for Ni and 3 for Mo). It is important to note that a dilution with deionised water took place in order to help with
homogenisation of the samples, which meant that multiplication of a factor (approximately 2) was performed.
This dilution factor was taken into consideration in the results presented here.
Food Waste Chemical Analysis 24
Table 7 - Metal results for the summer season (mg/kg)
Local Authority Sample Al Cd Ca Cr Co Cu Fe Pb Mg Mn Hg Mo Ni Zn
Wrexham 46.4 <0.4 1794.4 1.2 <2 <2 50.7 <2 274.4 35.9 <2 <6 1.2 16.9
Anglesey 31.3 <0.4 3715.7 <1 <2 <2 25.4 <2 234.7 21.5 <2 <6 <1 7.8
Conwy 58.4 <0.4 5236.4 1.4 <2 <2 36.3 <2 282.0 32.2 <2 <6 1.0 12.1
Powys 25.4 <0.4 1448.5 <1 <2 <2 80.3 <2 184.0 5.9 <2 <6 <1 3.9
Pembrokeshire 44.1 <0.4 3611.0 2.8 <2 <2 34.1 <2 300.9 12.0 <2 <6 2.0 12.0
Merthyr Tydfil 25.9 <0.4 2591.5 0.9 <2 <2 27.8 <2 333.2 7.4 <2 <6 <1 11.1
Blaenau Gwent 25.4 <0.4 1102.7 <1 <2 <2 18.7 <2 254.5 17.0 <2 <6 <1 10.2
Swansea 30.0 <0.4 1181.8 1.2 <2 <2 16.0 <2 176.3 10.0 <2 <6 <1 8.0
Monmouthshire 104.7 <0.4 7665.2 3.2 <2 <2 39.3 <2 261.7 26.2 <2 <6 1.9 9.3
RCT 29.5 <0.4 6289.0 <1 <2 <2 30.8 <2 256.7 11.6 <2 <6 <1 6.4
Carmarthen 34.4 <0.4 4639.0 <1 <2 <2 34.4 <2 257.7 18.9 <2 <6 <1 5.2
Torfaen 66.8 <0.4 2534.8 <1 <2 <2 71.4 <2 212.0 23.0 <2 <6 <1 6.9
Bridgend 42.9 <0.4 4095.5 <1 <2 <2 27.3 <2 214.5 25.4 <2 <6 <1 11.7
Neath Port Talbot 15.7 <0.4 2354.0 <1 <2 <2 19.6 <2 196.2 5.9 <2 <6 <1 7.8
Denbighshire 11.6 <0.4 2518.3 <1 <2 <2 11.6 <2 193.7 5.8 <2 <6 <1 5.8
Unknown X 20.9 <0.4 628.5 1.7 <2 <2 17.5 <2 136.2 14.0 <2 <6 1.1 5.2
Unknown Y 109.5 <0.4 4341.4 <1 <2 <2 264.3 3.6 264.3 13.2 <2 <6 <1 9.4
Unknown Z 14.4 <0.4 2884.8 <1 <2 <2 18.0 <2 252.4 7.2 <2 <6 <1 9.0
Average 41.0 <0.4 3257.4 1.8 <2 <2 45.7 3.6 238.1 16.3 <2 <6 <1.4 8.8
In general, no toxicity is likely to occur for the bacterial communities within an anaerobic digester due to these
metal concentrations, except for some of the samples with high level of calcium, especially during the winter
season. Ca2+ has been stated to be moderately inhibitory above 3 g/l and a strong inhibitor above 8 g/l.
Excessive levels of calcium lead to precipitation of carbonate and phosphate, which may result in scaling of
reactors and pipes and even of the biomass. Levels of sodium and potassium were also reported to be high in
Sections 3.5 and 3.6.
Many publications reflect research carried out related to inhibition and enhancement of digester performance.
Complex antagonistic and synergistic effects occur when anaerobic digestion takes place in the presence of
various metals, and ammonia, which then impose difficulties in identifying a definite value of element required or
in excess. Chen et al. (2008) reviewed the most common inhibitors found in anaerobic digestion. It is important
that AD plant designers and operators have a general understanding of such information.
Not all trace elements normally reported as being beneficial in the digestion process were analysed. It may be
advantageous to add some elements in trace amounts; however, a cost and benefit analysis would need to be
performed. Studies regarding the bioavailability of these elements should be conducted if improvement of
digestion performance was to take place using trace element additions.
The results for metal analysis indicate as well a low level of heavy metal concentrations that can be anticipated in
digestates; if no addition of trace elements or any other chemicals takes place during treatment. Relatively low
heavy metals are expected to be present and therefore digestates would be likely to meet current PAS 110: 2010
requirements.
Food Waste Chemical Analysis 25
Table 8 - Metals results for the winter season (mg/kg)
Local Authority Sample Al Cd Ca Cr Co Cu Fe Pb Mg Mn Hg Mo Ni Zn
Wrexham 58.7 <0.4 3116.7 <1 <2 <2 80.7 <2 256.7 9.2 <2 <6 <1 16.5
Anglesey 44.0 <0.4 3522.8 <1 <2 <2 28.2 <2 229.0 31.7 <2 <6 <1 7.0
Conwy 237.4 <0.4 4200.8 1.0 <2 <2 43.8 <2 255.7 25.6 <2 <6 1.2 12.8
Powys 102.9 <0.4 6600.0 1.3 <2 1.8 69.9 <2 368.8 42.7 <2 <6 1.1 13.6
Pembrokeshire 44.0 <0.4 8433.3 2.6 <2 <2 47.7 <2 348.3 23.8 <2 <6 1.7 11.0
Merthyr Tydfil 60.4 <0.4 6817.5 1.4 <2 <2 60.4 <2 272.7 31.2 <2 <6 1.2 9.7
Blaenau Gwent 74.1 <0.4 11393.3 1.0 <2 <2 47.5 <2 303.8 17.1 <2 <6 <1 13.3
Swansea 68.9 <0.4 4305.5 <1 <2 <2 40.9 <2 366.0 58.1 <2 <6 <1 10.8
Monmouthshire 25.5 <0.4 2370.0 2.7 <2 <2 43.8 <2 273.5 12.8 <2 <6 1.8 7.3
RCT 19.5 <0.4 1169.7 1.3 <2 <2 28.2 <2 153.8 4.3 <2 <6 <1 6.5
Carmarthen 36.4 <0.4 1564.9 1.4 <2 <2 61.9 <2 218.4 9.1 <2 <6 1.3 12.7
Torfaen 363.7 <0.4 3030.6 2.4 <2 <2 74.8 <2 242.4 12.1 <2 <6 1.6 12.1
Bridgend 31.8 <0.4 4121.4 <1 <2 <2 26.2 <2 262.3 11.2 <2 <6 <1 9.4
Neath Port Talbot 22.0 <0.4 2571.5 <1 <2 <2 29.4 <2 238.8 9.2 <2 <6 <1 9.2
Denbighshire 33.8 <0.4 756.6 2.3 <2 <2 25.9 <2 187.2 27.9 <2 <6 1.8 8.0
Newport 37.6 <0.4 4591.3 1.2 <2 <2 29.2 <2 313.0 10.4 <2 <6 <1 12.5
Vale of Glamorgan 74.3 <0.4 1197.0 2.8 <2 <2 28.9 <2 206.4 18.6 <2 <6 2.2 12.4
Cardiff 38.7 <0.4 1394.5 1.1 <2 <2 46.5 <2 271.1 9.7 <2 <6 <1 13.6
Caerphilly 69.0 <0.4 3643.1 1.0 <2 <2 38.3 <2 287.6 11.5 <2 <6 <1 17.3
Flintshire 62.8 <0.4 729.7 3.5 <2 <2 30.4 <2 174.3 4.1 <2 <6 2.0 10.1
Gwynedd 78.7 <0.4 2249.6 8.0 <2 <2 52.5 <2 281.2 37.5 <2 <6 5.6 13.1
Ceredigion 51.1 <0.4 2751.4 1.2 <2 <2 49.1 <2 216.2 27.5 <2 <6 <1 9.8
Average 74.3 <0.4 3660.5 2.1 <2 <2 44.7 <2 260.3 20.2 <2 <6 <2 11.3
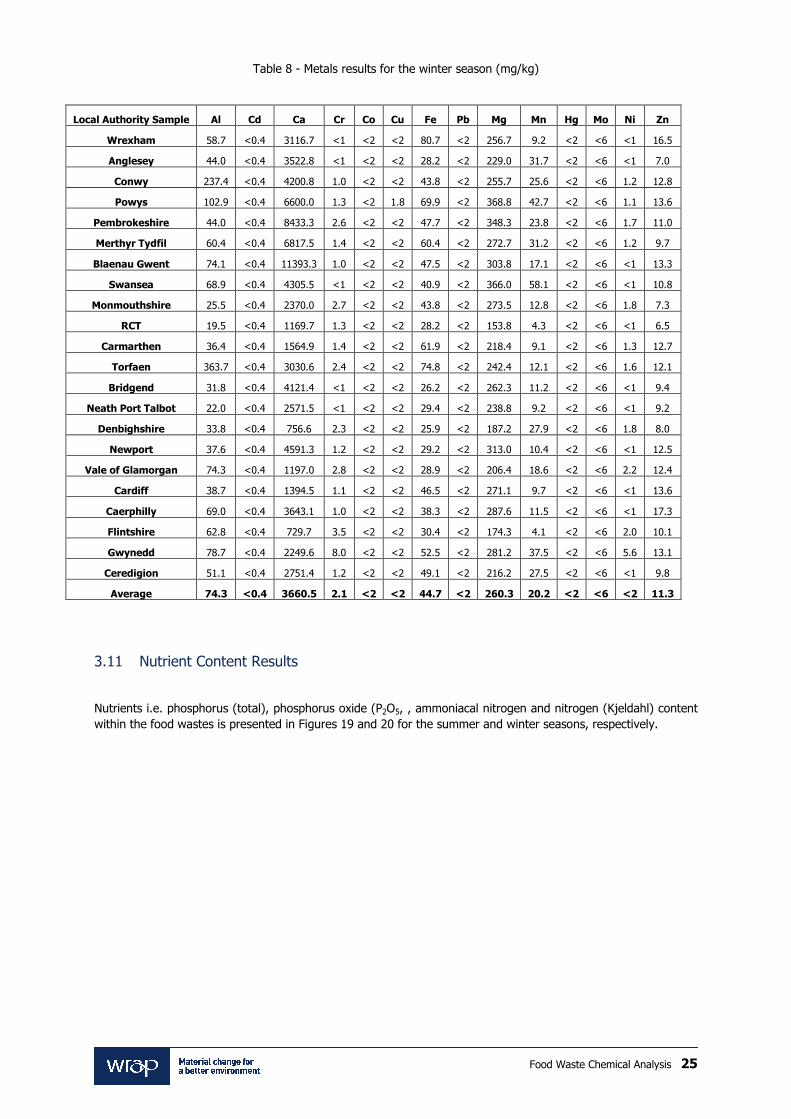
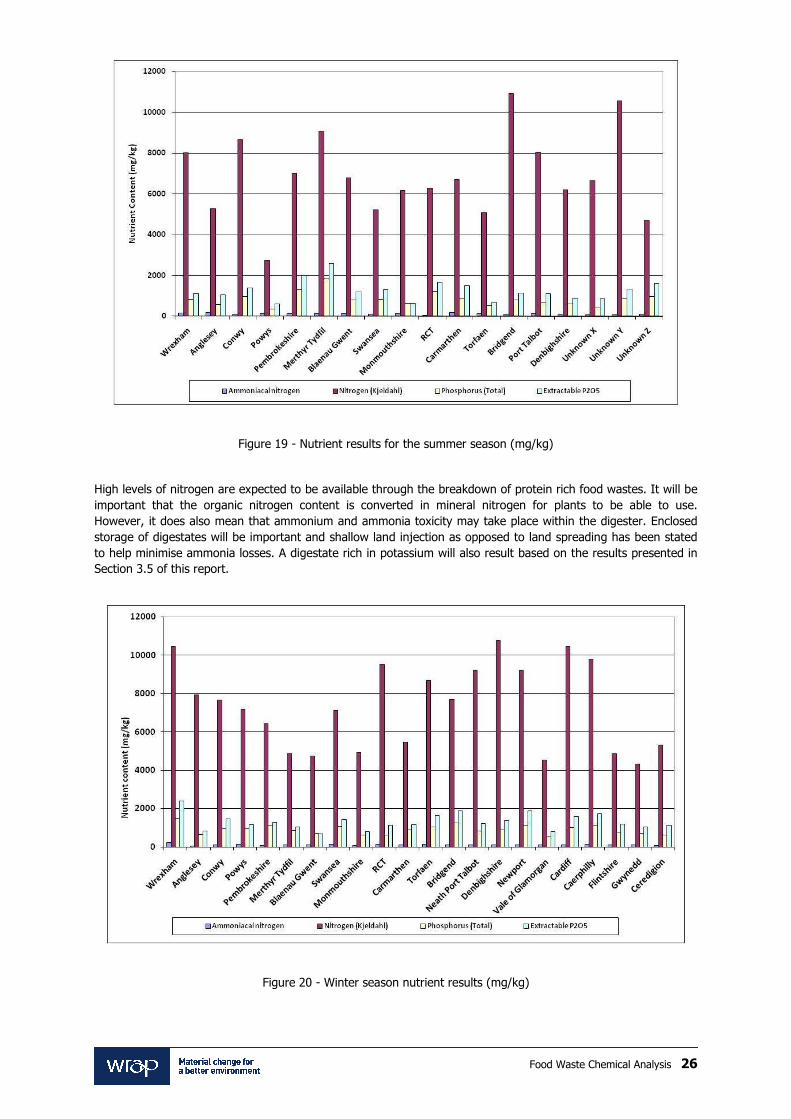
3.11 Nutrient Content Results
Nutrients i.e. phosphorus (total), phosphorus oxide (P2O5, , ammoniacal nitrogen and nitrogen (Kjeldahl) content
within the food wastes is presented in Figures 19 and 20 for the summer and winter seasons, respectively.
Food Waste Chemical Analysis 26
Figure 19 - Nutrient results for the summer season (mg/kg)
High levels of nitrogen are expected to be available through the breakdown of protein rich food wastes. It will be
important that the organic nitrogen content is converted in mineral nitrogen for plants to be able to use.
However, it does also mean that ammonium and ammonia toxicity may take place within the digester. Enclosed
storage of digestates will be important and shallow land injection as opposed to land spreading has been stated
to help minimise ammonia losses. A digestate rich in potassium will also result based on the results presented in
Section 3.5 of this report.
Figure 20 - Winter season nutrient results (mg/kg)
Food Waste Chemical Analysis 27
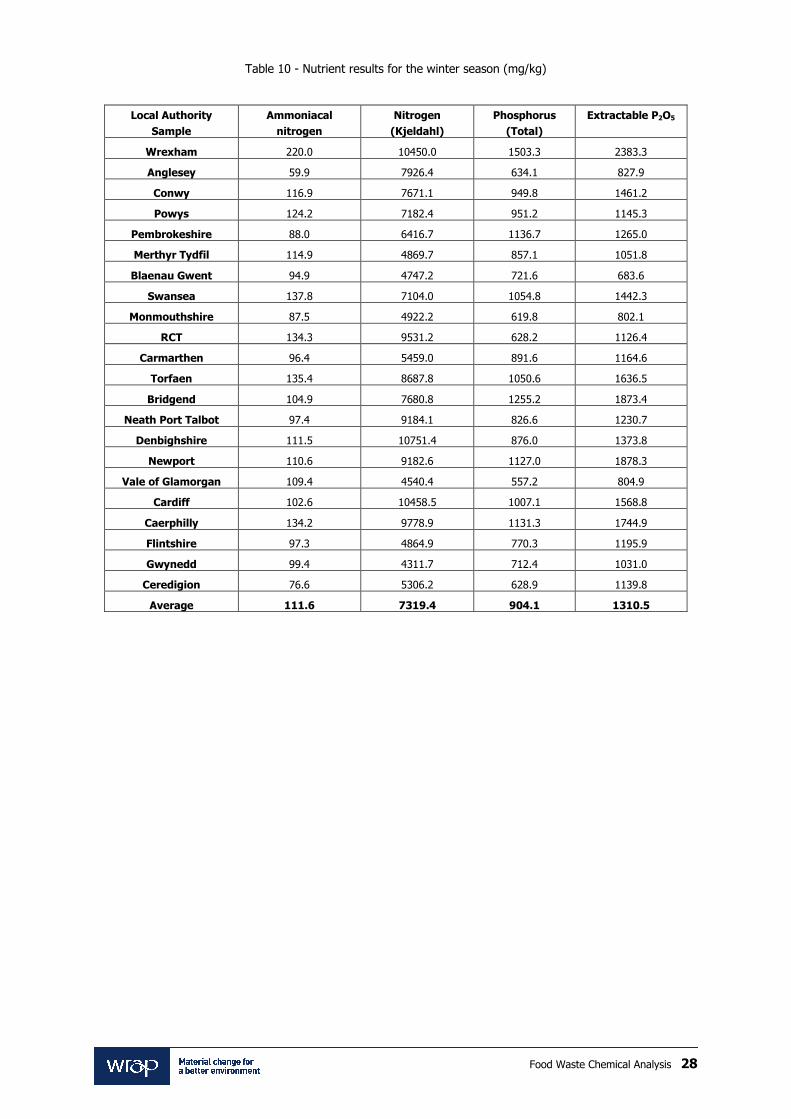
3.12 Summary of Results for Nutrient Content
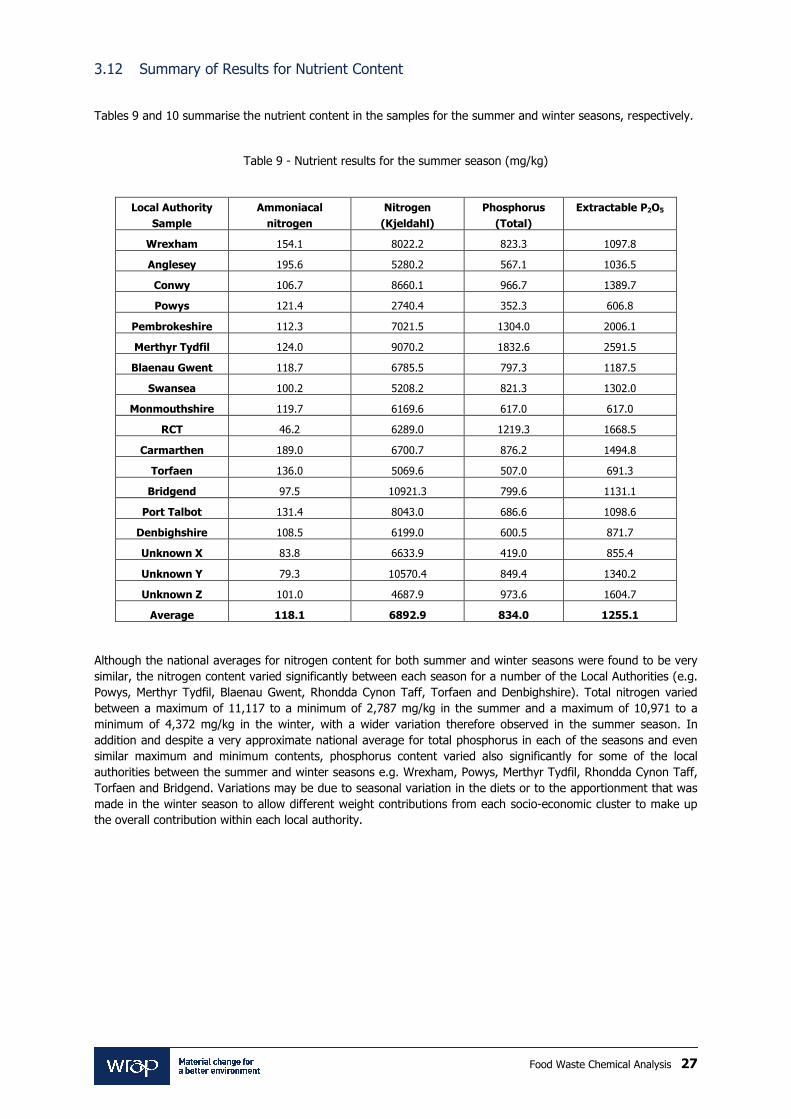
Tables 9 and 10 summarise the nutrient content in the samples for the summer and winter seasons, respectively.
Table 9 - Nutrient results for the summer season (mg/kg)
Local Authority
Sample
Ammoniacal
nitrogen
Nitrogen
(Kjeldahl)
Phosphorus
(Total)
Extractable P2O5
Wrexham 154.1 8022.2 823.3 1097.8
Anglesey 195.6 5280.2 567.1 1036.5
Conwy 106.7 8660.1 966.7 1389.7
Powys 121.4 2740.4 352.3 606.8
Pembrokeshire 112.3 7021.5 1304.0 2006.1
Merthyr Tydfil 124.0 9070.2 1832.6 2591.5
Blaenau Gwent 118.7 6785.5 797.3 1187.5
Swansea 100.2 5208.2 821.3 1302.0
Monmouthshire 119.7 6169.6 617.0 617.0
RCT 46.2 6289.0 1219.3 1668.5
Carmarthen 189.0 6700.7 876.2 1494.8
Torfaen 136.0 5069.6 507.0 691.3
Bridgend 97.5 10921.3 799.6 1131.1
Port Talbot 131.4 8043.0 686.6 1098.6
Denbighshire 108.5 6199.0 600.5 871.7
Unknown X 83.8 6633.9 419.0 855.4
Unknown Y 79.3 10570.4 849.4 1340.2
Unknown Z 101.0 4687.9 973.6 1604.7
Average 118.1 6892.9 834.0 1255.1
Although the national averages for nitrogen content for both summer and winter seasons were found to be very
similar, the nitrogen content varied significantly between each season for a number of the Local Authorities (e.g.
Powys, Merthyr Tydfil, Blaenau Gwent, Rhondda Cynon Taff, Torfaen and Denbighshire). Total nitrogen varied
between a maximum of 11,117 to a minimum of 2,787 mg/kg in the summer and a maximum of 10,971 to a
minimum of 4,372 mg/kg in the winter, with a wider variation therefore observed in the summer season. In
addition and despite a very approximate national average for total phosphorus in each of the seasons and even
similar maximum and minimum contents, phosphorus content varied also significantly for some of the local
authorities between the summer and winter seasons e.g. Wrexham, Powys, Merthyr Tydfil, Rhondda Cynon Taff,
Torfaen and Bridgend. Variations may be due to seasonal variation in the diets or to the apportionment that was
made in the winter season to allow different weight contributions from each socio-economic cluster to make up
the overall contribution within each local authority.
Food Waste Chemical Analysis 28
Table 10 - Nutrient results for the winter season (mg/kg)
Local Authority
Sample
Ammoniacal
nitrogen
Nitrogen
(Kjeldahl)
Phosphorus
(Total)
Extractable P2O5
Wrexham 220.0 10450.0 1503.3 2383.3
Anglesey 59.9 7926.4 634.1 827.9
Conwy 116.9 7671.1 949.8 1461.2
Powys 124.2 7182.4 951.2 1145.3
Pembrokeshire 88.0 6416.7 1136.7 1265.0
Merthyr Tydfil 114.9 4869.7 857.1 1051.8
Blaenau Gwent 94.9 4747.2 721.6 683.6
Swansea 137.8 7104.0 1054.8 1442.3
Monmouthshire 87.5 4922.2 619.8 802.1
RCT 134.3 9531.2 628.2 1126.4
Carmarthen 96.4 5459.0 891.6 1164.6
Torfaen 135.4 8687.8 1050.6 1636.5
Bridgend 104.9 7680.8 1255.2 1873.4
Neath Port Talbot 97.4 9184.1 826.6 1230.7
Denbighshire 111.5 10751.4 876.0 1373.8
Newport 110.6 9182.6 1127.0 1878.3
Vale of Glamorgan 109.4 4540.4 557.2 804.9
Cardiff 102.6 10458.5 1007.1 1568.8
Caerphilly 134.2 9778.9 1131.3 1744.9
Flintshire 97.3 4864.9 770.3 1195.9
Gwynedd 99.4 4311.7 712.4 1031.0
Ceredigion 76.6 5306.2 628.9 1139.8
Average 111.6 7319.4 904.1 1310.5
Food Waste Chemical Analysis 29
4.0 Conclusions
Due to the limited number of samples analysed which were sub-sampled from the 5 kg sample received, a true
representation of the whole local authority food waste stream could not be guaranteed. Some of the large
standard deviations reported for carbohydrates, proteins and lipids should not be concluded as an analysis
methodology error but instead be related to the heterogeneous nature of the sample and the reduced number of
samples analysed. In order to achieve a more accurate representation of the chemical composition of each local
authority food waste samples in Wales a larger number of samples surveyed would need to take place. The
results, however, are likely to provide a reasonable indication about the chemical nature of the food waste
samples that a waste treatment facility will need to treat. The results for the winter season are likely to be more
representative of each local authority as an apportionment was made to allow different weight contributions from
each socio-economic cluster. The results supply valuable information for the designer, supplier and operator of a
waste treatment facility.
The level of proteins and light metals (Na, K and Ca) are high and therefore monitoring and control strategies for
the anaerobic digestion plant may be required so that inhibition conditions are avoided within the digestion
process. Reactor start-up and bacterial acclimation phases should be effective in order to support a good process
performance. Desulphurisation of the biogas will be required and effective measures for odour control should also
be seriously considered. Heavy metal content is not likely to cause inhibition within the digestion process or
decrease the value and quality of the digestates. Nutrient value of digestates is expected to be significant.
Food Waste Chemical Analysis 30
5.0 References
APHA, 1998. Standard methods for the examination of water and wastewater. In: Clesceri, L.S., Greenberg, A.E.,
Eaton, A.D. (Eds.), 20th ed. American Public Health Association, Washington, D.C.
Bligh, E.G. and Dyer, W.J., 1959. A Rapid method of total lipid extraction and purification. Canadian Journal of
Physiology and Pharmacology, 37(8): 911–917.
Buswell, A.M. and Mueller, H.F.,1952. Mechanism of methane fermentation. Ind. Eng. Chem., 44: 550-552.
Chaplin, M.F., Kennedy, J.F., 1986. Carbohydrate Analysis: a Practical Approach. The Practical Approach Series.
IRL Press, Oxford, Washington, DC.
Chen, Y, Cheng J.J. and Creamer, K.S., 2008. Inhibition of Anaerobic Digestion process: A Review. Bioresource
Technology 99: 4044-4064.
Lowry, O.H., Rosebrough, N.J., Farr, A.L., Randall, R.J., 1951. Protein measurement with the Folin phenol
reagent. The Journal of Biological Chemistry 193(1), 265–275.

Printed on xx% recycled
content paper
www.wrap.org.uk/relevant link