food security sa working paper series:...
TRANSCRIPT

i
Food Security SA Working Paper Series:
#001
Why does malnutrition persist in South Africa despite social grants?
Authors: Stephen Devereux Jennifer Waidler

ii
DST-NRFCentreofExcellenceinFoodSecurityFoodSecuritySAWorkingPaperSeries
©DST-NRF Centre of Excellence in Food Security (CoE-FS) is an initiative of the
Department of Science and Technology – National Research Foundation. The
mission of the CoE-FS is to examine how a sustainable and healthy food system
can be achieved, to realise food security for poor, vulnerable and marginal
populations. Our goal is to fill knowledge gaps by undertaking research that is of
strategic and policy importance. We also seek to contribute to capacity building
efforts and dissemination of information, to make our Centre the leading hub of
knowledge production on Food Security and Nutrition in Africa.
The CoE-FS is jointly hosted by the University of the Western Cape and the
University of Pretoria. This Working Paper Series is designed to share work in
progress. Please send suggestions or comments to the corresponding author. Email: [email protected] Website: www.foodsecurity.ac.za Series Editor: Stephen Devereux

iii
WhydoesmalnutritionpersistinSouthAfricadespitesocialgrants?
January 2017 #001
AUTHORDETAILSAUTHORS’NAMES INSTITUTIONS
StephenDevereuxInstituteofDevelopmentStudies,UniversityofSussex,UK;andInstituteforSocialDevelopment,UniversityoftheWesternCape,SouthAfrica
JenniferWaidler MaastrichtGraduateSchoolofGovernance/UNU-MERIT,MaastrichtUniversity,TheNetherlands
CorrespondingAuthor:Stephen Devereux
Institute for Social Development, University of the Western Cape Address: Private Bag X17, Bellville 7535, South Africa
Email Address: [email protected]
Suggested Citation Devereux, S. and Waidler, J. (January 2017), “Why does malnutrition persist in South Africa despite social grants?” Food Security SA Working Paper Series No.001. DST-NRF Centre of Excellence in Food Security, South Africa.
iv
AUTHORBIOGRAPHIESStephen Devereux is a Research Fellow at the Institute of Development Studies at the University of Sussex, UK, where he is a Co-Director of the Centre for Social Protection. He is also the NRF–Newton Fund (SA-UK) Research Chair in Social Protection and Food Security, affiliated to the DST–NRF Centre of Excellence in Food Security and the Institute for Social Development at the University of the Western Cape, South Africa.
Jennifer Waidler is a PhD fellow at UNU-MERIT, Maastricht University. She holds a MSc in Public Policy and Human Development from Maastricht University and a degree in Business Administration from the university Carlos III de Madrid. Since September 2012, she has been working as a researcher at UNU-MERIT on a variety of projects in the field of migration and social protection. Her main research interests focus on the links between social transfers and remittances in developing countries.
ACKNOWLEDGEMENTSThis work is based on research supported by the National Research Foundation of South Africa (Grant Number: 98411), and the Newton Fund, administered by the British Council. Preliminary versions of this paper were presented by the authors in a seminar at the University of the Western Cape (UWC), co-hosted by the DST-NRF Centre of Excellence in Food Security (CoE-FS) and the Institute for Social Development (ISD) (April 2016), and at the international symposium ‘Social Protection Systems: Tying the Knots’, organised by the Bonn-Rhein-Sieg University of Applied Sciences in Bonn, Germany (September 2016). We are also grateful for insightful comments provided by two peer reviewers, Professor Julian May and Dr Nyasha Tirivayi.

v
SUMMARYAccording to most subjective and self-reported indicators, food security in South Africa is improving over time. However, objectively measured anthropometric indicators record only a marginal improvement in children’s nutrition status since the early 1990s. This is despite the introduction in 1998 and subsequent expansion of the Child Support Grant, which now reaches over 11 million children in South Africa and has been found to increase food consumption and dietary diversity in poor households. How can this paradox be explained? This paper reviews the evidence on food security and child nutrition trends in South Africa and identifies several reasons why nutrition outcomes appear to be lagging behind improvements in other food security indicators.
Word count: 8,157 words
KEYWORDS: Foodsecurity,Nutrition,Socialgrant,Socialprotection,ChildSupportGrant
vi
Contents 1. CONTEXT............................................................................................................................1
1.1. Foodsecurity..............................................................................................................1
1.1.1. NationalfoodsecurityinSouthAfrica..................................................................2
1.1.2. HouseholdfoodinsecurityinSouthAfrica............................................................3
1.1.3. IndividualnutritionalinsecurityinSouthAfrica....................................................5
1.2. SocialgrantsinSouthAfrica.......................................................................................7
1.3. Impactsofsocialgrantsonfoodsecurityandnutrition.............................................7
2. DATA..................................................................................................................................8
3. DESCRIPTIVESTATISTICS....................................................................................................9
4. DISCUSSION.....................................................................................................................13
4.1. Inadequatetransfers.................................................................................................14
4.1.1. Foodpricesarerising..........................................................................................15
4.1.2. Socialgrantsareinadequatetomeetfoodneeds..............................................16
4.1.3. Copingstrategiesaren’tcoping..........................................................................17
4.2. Dilutionanddeductionsfromsocialgrants..............................................................19
4.2.1. Dilution...............................................................................................................19
4.2.2. Deductions..........................................................................................................21
4.3. Foodsecurityneedsmorethanfood........................................................................22
5. CONCLUSIONSANDPOLICYIMPLICATIONS.....................................................................24
REFERENCES...........................................................................................................................25

vii
Figures
Figure1. FoodsupplyinSouthAfrica,1991–2011(kcal/capita/day)...........................................2Figure2. Dietaryenergysupply(DES)adequacyinSouthAfrica,1991–2015(%)........................3Figure3. ChildrenexperiencinghungerinSouthAfrica,1994to2012........................................4Figure4. PersonsexperiencinghungerinSouthAfrica,2002to2015.........................................4Figure5. ChildstuntingratesinSouthAfrica,1993–2012............................................................6Figure6. Householdincomepercapitafromsocialgrants,byincomedecile,2008..................10Figure7. Householdincomepercapita,withandwithouttransfers(Rand/month)..................11Figure8. Subjectivefoodinsecurity............................................................................................11Figure9. Dietarydiversityandspendingonfood.......................................................................12Figure10.Anthropometry............................................................................................................13Figure11.MaizepriceindexinSouthAfrica,1991–2013(2010=100).........................................15Figure12.ChildSupportGrant,nominalandrealvalue,1998–2015(Rand/month)...................16Figure13.Livingcostsforafamilyoffive(May2016)(Rand)......................................................17Figure14.Spendingofsocialgrants.............................................................................................21Figure15.UNICEFconceptualframeworkforcausesofchildmalnutrition.................................23

1
1. CONTEXT
The past 20 years has seen an extraordinary expansion in the coverage of social grants in South Africa, alongside the ANC government’s preference for market-friendly economic policies – a phenomenon that prompted Ferguson (2015: 2) to characterise contemporary South Africa as a “neoliberal welfare state”.
Redistributive income transfers to poor people can be expected to improve their wellbeing on several dimensions of wellbeing, not least household food security and individual nutrition status. But these are two distinct outcomes that should not be conflated. This is confirmed by data from South Africa. While the evidence on most food security indicators is significant and positive, trends in nutrition survey data are ambiguous and can be interpreted in diametrically opposite ways. On the one hand, May and Timæus (2014: 771) find that “stunting among young children has fallen”, and they conclude that “evidence points to the introduction of the Child Support Grant in 1998 as one important factor”. On the other hand, Hendriks (2014: 18) asserts that child stunting rates have increased since 1994, and that “aggregate levels of children’s nutrition have deteriorated, despite significant increases in the participation of the food insecure in the social security system”.
Our review of the evidence supports an intermediate position: food security has certainly improved for most South Africans post-1994, but the nutrition status of children has stagnated or improved only marginally. This leaves a puzzle that needs to be explained: why have rapid and sustained reductions in food insecurity in South Africa during the past 20 years not been matched by equivalent reductions in undernutrition among South Africa’s children? This paper offers some possible explanations.
1.1. Foodsecurity
Fromnationalfoodsecuritytohouseholdandindividualfoodandnutritionalinsecurity
Food security is a complex concept that operates at many levels. Standard definitions and concepts of food security identify four components: food availability, access, stability, and utilisation.
Food availability describes the total amount of food in a territory at a point in time. The FAOs ‘food balance sheet’ approach estimates national food availability as the sum of food production plus imports plus carry-over stocks, minus exports and losses in storage, processing and waste (FAO, 2001). Once the total food supply

2
has been estimated it is converted into Dietary Energy Supply (DES) and divided by the population to determine whether food availability per capita is adequate at national level, by comparing DES per capita against a Dietary Energy Requirement (DER) – usually around 2,100 kcal per person per day. Access to food is assessed in terms of both physical and economic accessibility. Physical access relates to distance to markets and whether food is actually on sale in the markets. Economic access relates to food prices and affordability, which are compromised by poverty, inflation and food price spikes. Stability refers to stable availability and access over time, which can be undermined by seasonality or disruptions to food systems due to natural disasters, climate change, civil insecurity and other shocks. Utilisation describes the biological processes that convert food consumed into nutritional status, which is determined not only by the amount and quality of the diet (e.g. dietary diversity) but also by individual health status, the public health environment, child care and feeding practices, and so on. 1.1.1. NationalfoodsecurityinSouthAfrica
In terms of national food availability, South Africa has enough food to feed all of its population, currently around 55m people. Data compiled by the Food and Agriculture Organisation (FAO) shows that aggregate food supplies have been steadily rising for the past 25 years, not only in absolute terms but faster than population growth, from around 2,800 kilocalories per person per day in the early 1990s to 3,000 kcal/capita/day by 2011 (Figure 1). Figure1. FoodsupplyinSouthAfrica,1991–2011(kcal/capita/day)
Source:datafromFAOSTAT(http://faostat3.fao.org/browse/FB/*/E)downloaded15July2016

3
Even assuming a relatively generous average energy intake requirement of around 2,300 kilocalories per person per day, this food availability has translated into more than adequate energy supplies for the national population every year. Figure 2 shows that average dietary energy supply (DES) hovered around 20% above national needs throughout the 1990s, but has climbed steadily since the mid-2000s, reaching 30% above national needs by 2013. However, in 2015 the lowest annual rainfall since 1904 triggered a drought that reduced the national maize harvest by 14% relative to the 2011-2015 average, and by a further 25% in 2016, a cumulative loss of 35% in two years (FAO, 2016). Although a rebound is expected in 2017, this event highlighted the reality that South Africa’s future capacity to meet staple food consumption needs through production could be undermined by climate change. Figure2.Dietaryenergysupply(DES)adequacyinSouthAfrica,1991–2015(%)
Source:datafromFAOSTAT(http://faostat3.fao.org/browse/D/FS/E)downloaded15July2016
But food security is not only about how much food is available, it is about who has access to that food – from availability to accessibility, which in market-dependent households is determined mainly by affordability. 1.1.2. HouseholdfoodinsecurityinSouthAfrica
Aliber (2009: 385) extracted a self-reported indicator of food insecurity from five years of Stats SA’s October Household Survey (OHS) in the 1990s. The OHS asked: “In the past year, was there ever a time when you could not afford to feed the children in the household?” For the period 1994 to 1998, the GHS displayed a 24 percentage point decline in households reporting hungry children, from 41% to 31%. Hendriks (2014, Table 2) reports figures on individuals experiencing hunger from Stats SA’s annual General Household Surveys (GHS) for 2002 to 2012. The indicator used in the GHS was subjective hunger: “In the past 12 months, did any child in this household go hungry because there wasn’t enough food?” This question is not identical to that asked by the OHS in the 1990s, but it is similar

4
enough to allow a comparison of trends to be made between the two data series (Figure 3). For the period 2002 to 2012, the GHS indicator displayed a 55 percentage point decline in children experiencing hunger, from 24% to 11% (Hendriks, 2014: 16). By this indicator, child hunger in South Africa has more than halved since the turn of the millennium. Figure3. ChildrenexperiencinghungerinSouthAfrica,1994to2012
Source: Authors,derivedfromAliber(2009,Figure1);Hendriks(2014,Table2)Note: Questionsonhungerwerenotaskedinthe2009GHS
GHS data on the percentage of the total population experiencing hunger reveals a similar trend to the GHS question on children experiencing hunger, at a slightly higher level. After declining steadily from 2002 to 2007, there was a moderate increase in subjective hunger in 2008 and 2010 (Figure 4). This temporary reversal to the long-term trend probably reflects the effects of the global financial crisis of 2007/08. Since 2011 this indicator has stabilised at around 13% of the total population. Figure4. PersonsexperiencinghungerinSouthAfrica,2002to2015
Source:StatsSA(2016b,Figure62)

5
1.1.3. IndividualnutritionalinsecurityinSouthAfrica
As noted above, there are two competing narratives around trends in malnutrition in South Africa. One view is that the nutritional status of children has been steadily improving since at least the 1990s. The alternative view is that children’s nutritional indicators have worsened or remained unchanged for the past 20 years. This is an empirical debate, so one interpretation of the data must be correct while the other is wrong. But which is correct? Our review of available sources of anthropometric data on child nutrition in South Africa reveals that there has been very little improvement in the 20 years since the transition to democracy in 1994. Specifically, child stunting rates have been more or less constant, fluctuating around 25% since 1993 – never above 30%, never below 20% – as revealed by the virtually flat plotted trend-line in Figure 5. Stunting rates of children under five years old are preferred in the food security and nutrition literature as a robust, objectively measured indicator of chronic undernutrition or long-term food insecurity.1 Figure 5 presents the child stunting rates reported in six studies between 1993 and 2013. These figures are not directly comparable – the surveys vary in sample size, sampling frame, and even in the age range of children measured – but they all reinforce the conclusion that approximately one in four children in South Africa is chronically malnourished, and that this has been almost constant at least since the early 1990s. The stunting rate ranges from a high of 27.4% in the Demographic and Health Survey (DHS) of 2003 to a low of 21.5% in the SANHANES of 2012. But it would be misleading to conclude that there has been a trend decline, even since 2003, as does one recent report. Save the Children (2016: 5)2 applauds South Africa’s “exceptional progress” in reducing child stunting from 33% to 24% between 2004 and 2008. Confusingly, this finding is directly contradicted by a systematic review of nutrition surveys in South Africa, which found a 6.8% increase in stunting between 2005 and 2008, from 23.2% to 30% (Said-Mohamed et al., 2015: 5). Figure 5 shows almost identical stunting rates in 1993 and 2008. May and Timæus (2014: 5) suggest that child malnutrition might have been overestimated in the 1993 PSLSD survey and underestimated in the 2008 NIDS survey. If this is true, it follows 1 Stuntingisananthropometricmeasureofheight-for-age.Achildischaracterisedashavingstuntedgrowth
ifherorhisheightislessthan2standarddeviationsbelowtheheightofachildthesameageinareferencepopulation.
2 Thesefiguresarederivedfromjointchildmalnutritionestimatesfor2015producedbyUNICEF,WHOandtheWorldBank(http://www.who.int/nutrition/publications/jointchildmalnutrition_2015_estimates/en/).

6
that stunting rates may actually have been higher in 2008 than in 1993. Secondly, taking the NFCS–1 stunting rate in 1999 as a ‘baseline’ figure for when the Child Support Grant was introduced in 1998, it is striking that no subsequent estimate of child stunting is lower than this figure until the SANHANES survey of 2012, which produced an estimate that is statistically identical to the 1999 figure. Figure5. ChildstuntingratesinSouthAfrica,1993–2012
PSLSD SAVACG NFCS-1 DHS NFCS-2 NIDS-1 SANHANES
Sources: 1993:datafromnationalProjectforStatisticsonLivingStandardsandDevelopment(PSLSD)survey;n=3,765childrenaged0–5years(ZereandMcIntyre,2003)
1994:datafromtheSouthAfricanVitaminAConsultativeGroup(SAVACG);n=4,788childrenaged6–71months(Steyn,1996:151)
1999: data from the first National Food Consumption Survey (NFCS), n=2,894 children aged 1-9years(Labadariosetal.,2005)
2003: data from the Demographic and Health Survey (DHS); n=1,159 children under 5 years old(DepartmentofHealthetal.,2007,Table8.6)
2005:datafromthesecondNationalFoodConsumptionSurvey(NFCS);n=2,413childrenaged1-9years(Labadarios,SteynandNel,2011:893)
2008: data from National Income Dynamics Study (NIDS) wave 1; n=1,970 children aged 6–59months(MayandTimæus,2014)3
2012: data from SouthAfricanNationalHealth andNutrition Examination Survey (SANHANES-1);n=2,044childrenaged0–6years,dataareforchildrenaged0-5years(Shisanaetal.,2013:210)
Hendriks (2014, Table 3) finds a consistently rising trend in stunting since the CSG was introduced, from 21.6% in 1999 (NFCS-1) to 23.4% in 2005 (NFCS-2) to 26.5% in 2012 (SANHANES). But this compares only 1–3 year-olds in the NFCS and SANHANES. Among 4–6 year-olds the figures were much lower and the trend was reversed, from 16.4% in 2005 to 11.9% in 2012 (Shisana et al., 2013: 211). Conversely, May and Timæus (2014) reported a significant improvement in average
3 Thesamplesizeof1,970derivesfromMayandTimæus(2014:5):“NIDSsurveyed2925childrenaged6–59
months and measured the heights and weights of 74% of them. When they were compared to thereference population, the data on up to 9% of those measured in 2008 had to be excluded as beingimplausible”.

7
height-for-age between 1993 and 2008, and in the overall distribution. Also, a systematic review found a mixed trend – a 5% increase in child stunting prevalence between 1993 and 2008, followed by a 10% decrease by 2013 – or a net decline of 5% in 20 years, from 24.5% to 19.5% (Said-Mohamed et al., 2015: 6).
1.2. SocialgrantsinSouthAfrica
South Africa’s social protection system includes seven unconditional cash transfers, five of which are means tested to target poor individuals from vulnerable demographic groups such as children, older persons and persons with disability (PWD). The social grants are dominated by the Child Support Grant (CSG) and the Older Person’s Grant (OPG). As of April 2016 the CSG reached 11.9 million poor children under 18 years of age and paid R350 per month. The OPG reached 3.2 million people over 60 years of age and paid R1,505 per month, but R1,525 to over 75-year-olds (SASSA, 2016). Other social grants include the Disability Grant (R1,505/month), the Foster Care Grant (R890/month) and the Care Dependency Grant (R1,505/month). Almost one in three South Africans (30% of the total population) and 44% of all households currently receives one or more social grants, rising to over 60% in the poorest provinces of Eastern Cape and Limpopo (Ferguson, 2015: 6). According to Stats SA (2012), social grants contribute 42% of household income in poor families, making grants the most important source of income, since wages contribute only 32%.
1.3. Impactsofsocialgrantsonfoodsecurityandnutrition
Several empirical studies have found robust evidence that receiving social grants – especially the Old Age Grant and the Child Support Grant – has positive impacts on household food security indicators and on individual nutritional status in South Africa. The ‘Langeberg survey’ of 1,300 racially stratified individuals in the Western Cape in 1999 generated evidence that the Old Age Grant reduces the probability of adults skipping meals (due to not having enough money for food) by approximately 25%, in households where these grants are pooled with other income. Recipients reported that they could now buy enough food, thanks to the Old Age Grant. The same study found that children living in households with Old Age Grant recipients were about five centimetres taller. “This effect is roughly equal to a half-year’s growth for Black and Coloured children aged 0 to 6 in the Langeberg data, and is roughly one standard deviation increase in height for age” (Case, 2001: 15).

8
A study by Duflo (2003), based on a 1993 national survey of 9,000 randomly selected households, also found that children’s nutritional status improved if they lived with an older person who was an Old Age Grant recipient, but this effect was highly gendered in two ways. Firstly, Old Age Grants received by women had a bigger impact on children’s nutritional status (height-for-age and weight-for-height z-scores) than did Old Age Grants received by men. Secondly, Old Age Grants had a bigger impact on the nutrition status of girls than boys. Specifically, Duflo (2003: 18) found that Old Age Grants “received by women led to an increase of at least 1.16 standard deviations in the height of girls and to a much smaller (and insignificant) effect (0.28 standard deviation) on the height of boys. Pensions received by men appear to have had no effect on the height of boys or girls.” An analysis of the KwaZulu-Natal Income Dynamics Study (KIDS) panel dataset by Agüero, Carter and Woolard (2007) found that the Child Support Grant significantly reduces the incidence of child stunting. Specifically, boys who started receiving the CSG before their first birthday gained 0.40 in height-for-age z-scores by three years of age, compared to boys in the control group. This translates into an estimated gain of 3.5cm (2.1%) in height as adults, compared to other 25-35 year-old men. Coetzee (2013) estimated the impacts of the CSG on child well-being by analysing the first wave of the NIDS panel data, and found small but significant effects on children’s height-for-age (4% of a standard deviation) and household expenditure on food items (3% per person). The anthropometric impact translates into children growing approximately one centimetre taller than non-beneficiaries (Coetzee, 2014: 5), which is less than the finding by Agüero et al. (2007). “These effect sizes are much smaller than expected, given the relative size of the transfer in relation to the mean per capita household expenditure of households in the sample” (Coetzee, 2013: 429). A rigorous evaluation of the CSG conducted in 2010/11 found no impact of the CSG on stunting in the full sample of 665 children who were enrolled early (during their first two years of life), but a significant positive impact on children in the sample with educated mothers: “for children whose mothers have more than eight grades of schooling, early receipt has a large, positive impact, increasing HAZ by 0.19 standard deviations” (DSD, SASSA and UNICEF, 2012: 50).
2. DATA
In this section we analyse three groups of indicators of food insecurity using the first round of the National Income Dynamic Survey (NIDS), which corresponds to the year 2008 and consists of 28,641 sampled individuals. The first group consists of

9
anthropometric indicators, which measure the physical consequences of hunger. For children under 5, we define a child as stunted if his/her height for age is less than 2 standard deviations below the median of the reference group. For children between 5 and 14 years old, we calculate the percentage of undernourished children based on their BMI (if their BMI is less than 2SD below the median of the reference group they are classified as undernourished). Finally, adults (above 14 years old) are considered to have a normal weight if their BMI is between 18.5 and 24.9 (below 18.5 they are classified as underweight and above 24.9 as overweight). The second group comprises three subjective indicators of food insecurity. These indicators are based on a set of questions in the household questionnaire that ask the household head if any child or adult in the household went to bed hungry in the previous month, and if food has been adequate to meet household needs. Finally, indicators that measure the adequacy of food consumption are food expenditure and dietary diversity. The reasoning behind including food expenditure is that households that spend a large share of their income on food are considered to be more vulnerable to changes in food prices, as well as to changes in income. The variable is defined as the household share of monthly food expenditure out of total expenditure. As suggested by Lipton (1988) and Maxwell et al. (1999), a high food expenditure proportion is regarded as 60% and above, and these households are classified as food insecure. Regarding dietary diversity, we build an index based on the United Nations Food and Agriculture Organisation’s ‘Food Composition Table for Use in Africa’ (Ryan and Leibbrandt, 2015),4 which counts the number of 12 discrete food groups that a household consumes in a month. While the Household Dietary Diversity Score guide suggests taking the average diversity of the upper tercile, we follow Ryan and Leibbrandt (2015) using the same dataset and take average dietary diversity as a cut-off point (so that households below the average are considered food insecure).
3. DESCRIPTIVESTATISTICS
In 2008, 53% of households in the NIDS sample received at least one form of social grant. Of these, 26.3% received only the CSG, 6.5% received only the OPG, and 7.1% received both the CSG and OPG. The Child Support Grant is means tested to ensure that it reaches children in poor households. Figure 6a shows that households with children in low-income deciles received more income per capita per month from the CSG than higher-income households. Poverty targeting is not perfect, however: households in the poorest 4 Formoreinformationonthefoodcompositiontable,see:www.fao.org/docrep/003/X6877E00.htm.

10
decile received less income from the CSG than households in income deciles 2 through 8 (possibly because the poorest households are less likely to have children, or because very poor households do not apply for the grant, for various reasons), and households in the sixth decile received more income from the CSG than households in deciles 3, 4 and 5. The Older Persons Grant is also means tested, but Figure 6b shows that targeting is weak or even regressive – in 2008 the highest OPG income per capita was received by households with older persons in deciles 7, 8 and 9, while households with older persons in the poorest decile received almost no income from the OPG. Figure6.Householdincomepercapitafromsocialgrants,byincomedecile,2008
(R/person/month)
(a)ChildSupportGrant (b)OlderPersonsGrant
Source:Authors’calculationsfromNIDS2008dataNote:Onlyhouseholds(a)withchildren,(b)witholderpersons(respectively)areincludedinthisanalysis
The average amounts received reflect the higher value of the pension: R431 by CSG recipients, R1,041 by OPG recipients, and R1,555 by households receiving both the CSG and the OPG. Figure 7 shows the contribution of social grants to household income. In households receiving only the CSG, per capita income increased by 28% (from R277 to R355). In households receiving only the OPG, per capita income increased more, by 70% (R400 to R678), mainly because the OPG is worth much more than the CSG but also because households with pensioners tend to be smaller than households with children (5.3 versus 6.3 members, respectively). Households receiving both the CSG and OPG had the largest percentage increase in per capita income, at 151%, but the lowest actual per capita incomes, before and after the transfers (from R136 to R342), because poor households with both pensioners and children are the largest (8.9 members).
020
4060
mea
n of
pc_
csgw
1
1 2 3 4 5 6 7 8 9 10

11
Figure7.Householdincomepercapita,withandwithouttransfers(Rand/month)
Source:Authors’calculationsfromNIDS2008data
Figure 8 shows subjective indicators of food insecurity, from the NIDS 2008 dataset. All three subjective indicators are high, at a quarter to half of households receiving grants and, for child and adult hunger, approximately double the proportion of households receiving no transfers. This suggests that the CSG and OPG are not sufficiently large to meet food needs and eradicate hunger in recipient households. Another consistent pattern is evident across all categories. Adults are more likely to go to bed hungry than their children, which is consistent with evidence on ‘coping strategies’ during food crises – and by poor South Africans (Ngidi and Hendriks, 2014) – that adults will go hungry to protect their children’s food consumption. Figure8. Subjectivefoodinsecurity
Source:Authors’calculationsfromNIDS2008data
12
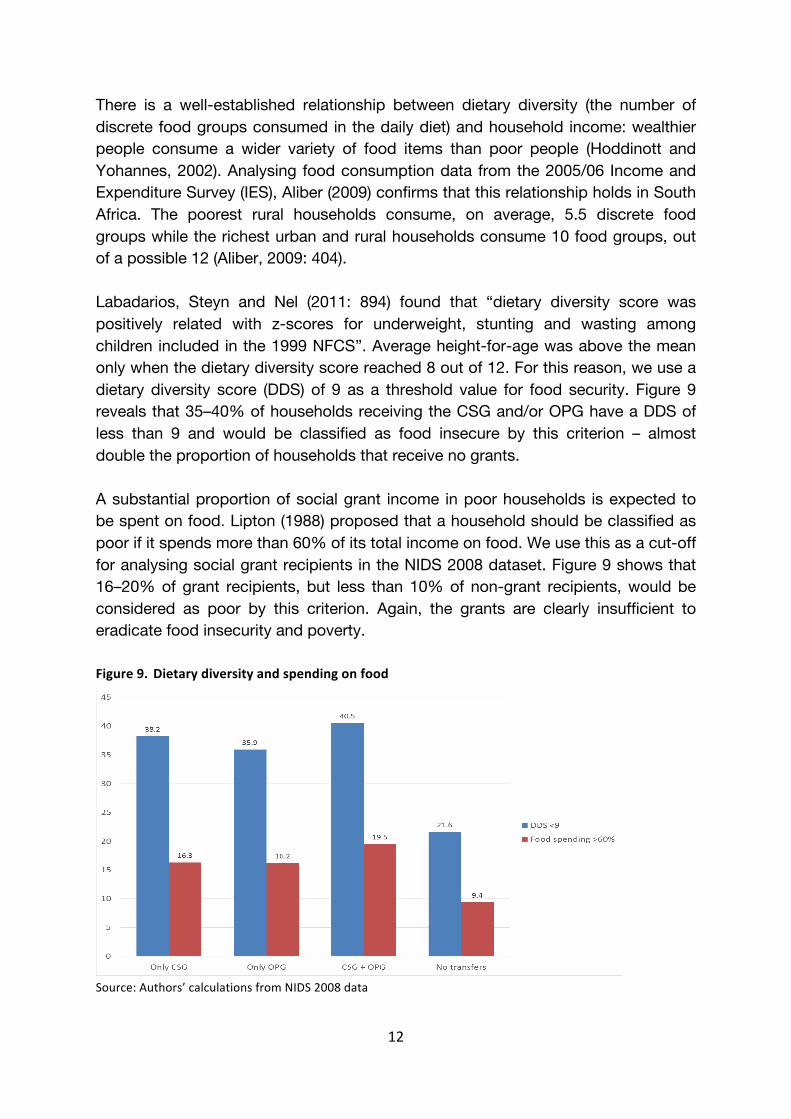
There is a well-established relationship between dietary diversity (the number of discrete food groups consumed in the daily diet) and household income: wealthier people consume a wider variety of food items than poor people (Hoddinott and Yohannes, 2002). Analysing food consumption data from the 2005/06 Income and Expenditure Survey (IES), Aliber (2009) confirms that this relationship holds in South Africa. The poorest rural households consume, on average, 5.5 discrete food groups while the richest urban and rural households consume 10 food groups, out of a possible 12 (Aliber, 2009: 404). Labadarios, Steyn and Nel (2011: 894) found that “dietary diversity score was positively related with z-scores for underweight, stunting and wasting among children included in the 1999 NFCS”. Average height-for-age was above the mean only when the dietary diversity score reached 8 out of 12. For this reason, we use a dietary diversity score (DDS) of 9 as a threshold value for food security. Figure 9 reveals that 35–40% of households receiving the CSG and/or OPG have a DDS of less than 9 and would be classified as food insecure by this criterion – almost double the proportion of households that receive no grants. A substantial proportion of social grant income in poor households is expected to be spent on food. Lipton (1988) proposed that a household should be classified as poor if it spends more than 60% of its total income on food. We use this as a cut-off for analysing social grant recipients in the NIDS 2008 dataset. Figure 9 shows that 16–20% of grant recipients, but less than 10% of non-grant recipients, would be considered as poor by this criterion. Again, the grants are clearly insufficient to eradicate food insecurity and poverty. Figure9.Dietarydiversityandspendingonfood
Source:Authors’calculationsfromNIDS2008data
13
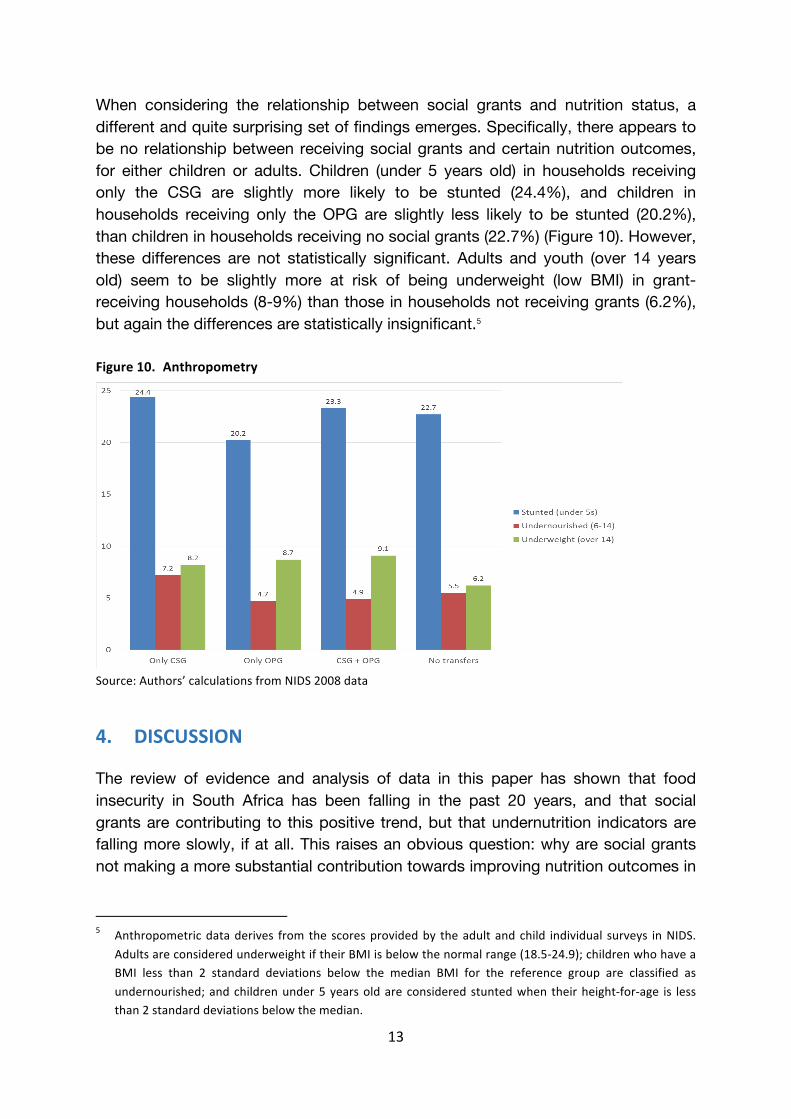
When considering the relationship between social grants and nutrition status, a different and quite surprising set of findings emerges. Specifically, there appears to be no relationship between receiving social grants and certain nutrition outcomes, for either children or adults. Children (under 5 years old) in households receiving only the CSG are slightly more likely to be stunted (24.4%), and children in households receiving only the OPG are slightly less likely to be stunted (20.2%), than children in households receiving no social grants (22.7%) (Figure 10). However, these differences are not statistically significant. Adults and youth (over 14 years old) seem to be slightly more at risk of being underweight (low BMI) in grant-receiving households (8-9%) than those in households not receiving grants (6.2%), but again the differences are statistically insignificant.5 Figure10. Anthropometry
Source:Authors’calculationsfromNIDS2008data
4. DISCUSSION
The review of evidence and analysis of data in this paper has shown that food insecurity in South Africa has been falling in the past 20 years, and that social grants are contributing to this positive trend, but that undernutrition indicators are falling more slowly, if at all. This raises an obvious question: why are social grants not making a more substantial contribution towards improving nutrition outcomes in
5 Anthropometricdataderives fromthe scoresprovidedby theadultandchild individual surveys inNIDS.
AdultsareconsideredunderweightiftheirBMIisbelowthenormalrange(18.5-24.9);childrenwhohaveaBMI less than 2 standard deviations below the median BMI for the reference group are classified asundernourished;andchildrenunder5yearsoldareconsideredstuntedwhen theirheight-for-age is lessthan2standarddeviationsbelowthemedian.
14
grant-receiving households? Three possible explanations for this puzzle are discussed here.
4.1. Inadequatetransfers
‘He thinks about the amount of the grant, trying to ascertain its actual worth to afamilyoffour.“Ifpeoplelivedonlybyeating,thismoneywouldstillbesmall.”’
‘HungerEatsaMan’–NkosinathiSithole Although social grants in South Africa are relatively generous compared to cash transfer programmes in other countries, they are not sufficient to meet nutritional needs. The Older Person’s Grant and the Disability Grant each pay R1,505, equivalent to US$110 a month or almost 4 dollars a day (at July 2016 exchange rates). The Child Support Grant, at R350, is worth considerably less – about US$25 per child each month, or less than a dollar a day. By comparison, Lesotho’s Child Grants Programme pays households US$14–28/month, depending on the number of children, while Kenya’s Cash Transfer for Orphans and Vulnerable Children (CT-OVC) pays eligible households a flat rate worth US$18/month, and Zambia’s Child Grant Programme pays households US$14/month (Daidone et al., 2015: 94). According to Handa and Davis (2006: 7): “An international rule of thumb is that a poverty motivated cash or in-kind transfer should represent between 20% and 40% of the per capita total poverty line in order to be meaningful to the beneficiary”. According to Stats SA, as of April 2016 South Africa’s food poverty line (FPL) stands at R498 per person per month, and the upper-bound poverty line (UBPL) stands at R1,077 (cited in City Press, 2016).6 The CSG is therefore worth 70% of the FPL and 32% of the UBPL, which sounds “meaningful” but in reality these grants are often ‘diluted’ among several family members (see below), so their effective value per capita is much less. ‘Engel’s law’ predicts that the proportion of household income spent on food falls as income rises. Aliber (2009: 397) demonstrates that this relationship holds in South Africa, from household income and expenditure survey data for 2005/06: the average share of total spending devoted to food was 37% for the poorest decile but only 7% for the highest income decile. Using a different measurement, analysis of NIDS data by Mhlongo and Daniels (2013) confirms that the inverse relationship between food expenditure and income holds in South Africa. The proportion of total spending allocated to food varied from 53% to 64% for the lowest expenditure per
6 “The FPL is the level of consumption belowwhich individuals are unable to purchase sufficient food to
providethemwithanadequatediet.…individualsattheUBPLcanpurchasebothadequatefoodandnon-fooditems”(StatsSA,2014:7).

15
capita decile and from 19% to 23% for the highest decile, across the three waves of NIDS (calculated from Mhlongo and Daniels, 2013: Figure 3). These findings imply that poor South African families will spend between one-third and two-thirds of incremental income, including social grants, on food – or R130 to R224 from the CSG of R350/month. 4.1.1. Foodpricesarerising
Food price inflation in South Africa has been volatile around a rising trend for several years. The gross producer price for white maize trebled in just seven years, from R660/ton in the 2006/07 marketing year to R2,200 in 2012/13, having doubled in just two years, from R1,098 in 2010/11 (DAFF, 2015: 7). This upward trajectory is reflected in a steep rise in the maize prize index, from around 60 in 2005 to close to 200 in 2012, with the index set at 100 in 2010 (Figure 11). Figure11. MaizepriceindexinSouthAfrica,1991–2013(2010=100)
Source:derivedfromDAFF(2015:7,Table7)
According to Stats SA (2016a: 4), the Consumer Price Index (CPI) has risen from a baseline of 100 in December 2012 to 117 in 2015. Food prices are frequently the main driver of CPI inflation. Between March 2015 and March 2016, the CPI for food and non-alcoholic beverages rose from 113 to 124 (+9.5%), while the CPI excluding food and non-alcoholic beverages rose from 113 to 119 (+5.7%) (Stats SA, 2016a: 3). Food prices are projected to continue rising faster than overall inflation, due to the 2015 agricultural drought and the weak Rand, which increases the cost of food imports. The Pietermaritzburg Agency for Community Social Action (PACSA) has been tracking the monthly cost of a basket of 32 basic food items for low-income households in Pietermaritzburg, KwaZulu-Natal since 2006. PACSA argues that the

16
official CPI underestimates the true cost of living for low-income households. In May 2014, for example, the annualised headline CPI was 6.6% and the CPI for food was 8.8%, but PACSA’s food price barometer increased by 11.2% year on year (PACSA, 2014: 2). Between May 2015 and May 2016, the cost of PACSA’s food basket increased by 13.3%, with maize-meal being a major driver, rising by 33% – from R170 to R226 for a 25kg bag – over the year (PACSA, 2016: 2). 4.1.2. Socialgrantsareinadequatetomeetfoodneeds
The Child Support Grant initially paid R100 to each eligible child every month, which increased to R200 by 2007 and R300 in 2014. Although social grants are adjusted every year they are not index-linked and the annual increment of the Child Support Grant is typically R10 or R20, irrespective of inflation rates. After a period in the early 2000s when the real value of the CSG increased substantially, from around R200 to almost R300 a month at December 2012 prices, 10 years of increments below or equal to inflation mean that its real value has stagnated or fallen year on year, and its purchasing power was actually slightly lower in 2015 than in 2005 (see Figure 12). Figure12. ChildSupportGrant,nominalandrealvalue,1998–2015(Rand/month)
Source:Beukesetal.(2015:3)
In April 2016, the CSG payment was increased from R330 to R350, an increment of 6% after a year when, as noted above, food prices rose by almost 10%. PACSA (2016) estimates that the cost of a nutritionally adequate diet for a young child (aged 3–9 years) in May 2016 was R557, and for an older child (10–13 years) it was R604. This means that even if all the CSG cash is spent only on nutritious food (no non-food spending) and even if all this food is given to the designated beneficiary (not shared with other household members), the CSG of R350 can cover less than two-thirds of the minimum food needs of a young child (63%) or an older child (58%).

17
But we know that only a proportion of the CSG will be spent on food for the child, because this cash is also needed for other household expenses. Figure13. Livingcostsforafamilyoffive(May2016)(Rand)
Source:derivedfromPACSA(2016:8) For a household of five comprising two children, two active adults and one older person, PACSA (2016) estimates that the cost of purchasing enough food to meet minimum nutritional requirements was R3,115 in May 2016. If we assume that the two active adults are unemployed and the household survives entirely on two Child Support Grants (@R350) and one State Old Age Grant (@R1,505), total monthly income is R2,205. Based on what poor households in Pietermaritzburg actually buy, this household spends R1,351 on food each month (61% of income), leaving R854 for all non-food basic needs (clothing, transport, education, housing, airtime, electricity, water, etc.) – which actually cost an estimated R3,427 (Figure 13). So this household needs R6,542 to cover its basic needs, but it has only one-third of this. With a R1,764 deficit on its food budget alone, the household’s diet is nutritionally inadequate – it is spending only 57% of what it needs for a minimum nutritional food basket. 4.1.3. Copingstrategiesaren’tcoping
Low-income households respond to food insecurity by adopting a range of ‘coping strategies’, which include dietary adjustments, cutting non-food spending, and raising money to buy food. A 2013 survey in KwaZulu-Natal found that rural

18
households use a diverse array of coping strategies to cope with food shortages during the winter months. The most common were (Ngidi and Hendriks, 2014: 285):
1 Rely on less preferred or less expensive foods (88.4% of 138 households) 2= Rely on help from relatives or friends (85.5%) 2= Borrow food or money for food (85.5%) 4 Limit food portion size at meal times (80.4%) 5 Beg for food from neighbours or relatives (80.3%) 6 Reduce number of meals in a day (76.1%) 7 Limit own intake for children’s sake (67.4%) 8 Consume seed stock held for next season (62.0%) 9 Send household members to eat elsewhere (44.9%) 10 Purchase food on credit (43.5%)
According to Stats SA’s General Household Survey, one in five South Africans skip meals and/or reduce the size of their meals at least five days each month (Oxfam, 2014: 28). Rising costs of living, including rising prices of basic food items, also reduce dietary diversity in poor households, as more of their budget is of necessity allocated to staple foods such as bread and maize-meal, leaving less to spend on other food groups. Despite spending almost half of their income on food, poor families are being steadily forced into eating cheaper, less nutritious food – more starch but less protein, vegetables and fruit. Rising electricity prices are forcing poor South Africans to buy more pre-cooked and processed foods that require little or no preparation, instead of fresh foods that are costly to buy and to cook. “Poor households have good access to bad food but bad access to good food” (Oxfam, 2014: 25). One consequence of bad diets is obesity, which is high and rising at a “remarkable” pace in South Africa (Cois and Day, 2015: 2). Being overweight, just like being underweight, is an indicator of food insecurity.7 Obesity is often a signifier of excessive consumption due to wealth, but is just as often a signifier of unhealthy and unbalanced diets due to poverty. In their analysis of the first wave of the South African National Income Dynamics Study (NIDS) data, a nationally representative survey undertaken in 2008 which included anthropometric measurements, Alaba and Chola (2014) found a positive relationship between obesity and socioeconomic status, for both men and women.
7 Nutritionstatusinadultsismeasuredbybodymassindex(BMI),whichiscalculatedasaperson’sweight
(inkilograms)dividedbythesquareoftheirheight(inmetres).ObesityisdefinedashavingaBMIof30orabove.

19
Among men, obesity increased from 6% in the lowest wealth quintile to 18% in the highest quintile. Among women, the prevalence of obesity was 28% in the poorest quintile and 41% in the richest. Although “richer men are more likely to be obese than their poorer counterparts … the distribution of obesity is not very different between poor and rich women” (Alaba and Chola, 2014: 3396). This leads to a researchable hypothesis: that high levels of obesity among affluent South Africans reflects the ‘nutrition transition’ towards highly processed foods and sedentary lifestyles, whereas high levels of obesity among low-income women reflects unhealthy diets due to poverty. Because food is a basic need for survival, one response to rising food prices for households with a fixed budget is to reduce spending on non-food items. Some poor families have withdrawn their children from school because they can no longer afford the costs associated with education (Oxfam, 2014: 18). A final set of coping strategies involves raising money to buy food. This includes asking for “donations” from neighbours (Oxfam, 2014: 15) – even though this is considered shameful and stigmatising – and borrowing, either from friends or from loan sharks who charge exorbitant interest rates which trap poor households in indebtedness that is ultimately unsustainable.
4.2. Dilutionanddeductionsfromsocialgrants
“Thisisnotforthewholefamily.It’sforyourdaughteroffouryears.”“Doyoumeanthishastobeusedforheronly?Thisiscrazy.Don’ttheyknowweareallhungry?”’
‘HungerEatsaMan’–NkosinathiSithole There are at least two other reasons why social grants are failing to significantly reduce malnutrition in South Africa. The first is dilution among other individuals and other cash needs, and the second is deductions made by service providers, sometimes illegally. 4.2.1. Dilution
Social grants targeted at individuals rather than households face being ‘diluted’ in two ways: firstly, in terms of who they are spent on, and secondly in terms of what they are spent on. Both forms of dilution – multiple users and multiple uses – can be expected to reduce the impacts on the intended beneficiaries. This could explain the limited impacts of the CSG that have been observed in several studies, for example in Coetzee’s analysis of NIDS data.

20
“Although these estimates suggest that the CSG does have some positive impact on the lives of beneficiary children, these effects are small and do not provide conclusive evidence that the transfers received by caregivers are spent mainly on improving the well-being of children. This might be explained by the fact that the transfers may be channelled towards the purchase of other goods that are not only to the benefit of children. … it might also be that when the cash is spread across the entire household, the observable effect on children is small” (Coetzee, 2013: 446).
The CSG targets individual children (beneficiaries) but is given to care-givers (recipients) and is pooled with other sources of income to meet the needs of all household members. A qualitative impact assessment which interviewed recipients of the CSG confirmed this. “I use it for everyone, because if I buy sugar we all share it”; “We are poor, so it ends up being used in the household”; “Since most people are not working this money cannot be used on the child alone, but it has to be used on the whole family” (DSD, SASSA and UNICEF, 2011). This applies equally to other social grants such as the Older Persons Grant and the Disability Grant: although they are ‘labelled’ as individual grants the cash tends to be shared with other family members. Social grants are also allocated to non-food needs: even if they could cover the full cost of a nutritious diet, poor people have other needs for cash apart from food. A study of how social grant money is spent by women recipients in the Western Cape found that food was the first priority for recipients of the Child Support Grant, Older Person’s Grant and Disability Grant (Figure 14). Education costs were second priority for CSG recipients, followed by clothing and transport. For OPG and DG recipients, funeral cover policies were second priority, followed by education (Taylor and Chagunda, 2015). A qualitative evaluation of the CSG confirmed that the CSG cash is used for a diverse range of food and non-food needs by recipients. “Food-related expenses covered general groceries such as eggs, biscuits, mealie-meal, polony, yogurt, as well as child-specific food, such as formula milk, baby food, Lactogen, yogurt for kids, food for lunch boxes and school lunches”.

21
Figure14. Spendingofsocialgrants
Source:TaylorandChagunda(2015:129)
Education-related expenses included “crèche fees, pre-school fees, Grade R fees, pens, bags, calculators, transport, soccer trips and clothing”, also covers for books, school uniforms, calculators and transport to school (DSD, SASSA and UNICEF, 2012: 40). Other spending items that were mentioned by CSG recipients include soap, nappies, health care costs, immunisations, burial society payments, church contributions, shoes, sweets, toiletries, music CDs, hairdressing, airtime for mobile phones and paying off debts. 4.2.2. Deductions
The Department of Social Development (DSD) introduced a payment system for social grants that uses bank accounts and SASSA payment cards – rather than manual disbursement of cash transfers – for several reasons, including: to reduce leakages due to fraud and corruption, to facilitate financial inclusion of the poor, and to reduce their vulnerability to exploitative money-lenders. However, giving bank accounts to beneficiaries also gave opportunities to a range of service providers to make unauthorised deductions from these bank accounts. In her 2014 Budget Vote speech to Parliament, the Minister of Social Development referred to having received “many complaints from beneficiaries about deductions that they had not authorised. These include loan repayments, prescribed debt, multiple funeral schemes, advance electricity and airtime, often without their knowledge or consent. … this growing national phenomenon of unlawful and immoral debit deductions is unacceptable in the sense that while some of these deductions may be technically legal, they remain immoral as they serve to rob the poor from the resources that we as South Africans provide for them, to meet their basic needs” (DSD, 2014).

22
The Minister noted that the food security objective of the grants was compromised by these deductions. “The social assistance grants provide poor households with the means to meet their basic needs, especially food and we cannot allow these solidarity funds to be eroded to enrich a few unscrupulous business people” (DSD, 2014). A Ministerial Task Team (MTT) was appointed to investigate this issue, and made recommendations in August 2014 that were intended to stop “unauthorised, unlawful and fraudulent deductions” (DSD, 2016) from social grants. In 2015 more than 13,000 reported cases were investigated, 77% of which were resolved in favour of the beneficiary (DSD, 2016). In May 2016 the Minister launched the revised ‘Regulations to the Social Assistance Act’, which included a requirement that beneficiaries must give their written permission to SASSA for all deductions from their social grants (DSD, 2016).
4.3. Foodsecurityneedsmorethanfood
It is increasingly recognised that malnutrition is a complex phenomenon that has multiple causes. Already in the early 1990s, it was understood that poverty and food insecurity are not synonymous. UNICEF’s conceptual framework for the determinants of child malnutrition (Figure 15) identified three ‘underlying causes’ of child malnutrition: inadequate access to food, inadequate care for children and women, and insufficient health services and unhealthy environment. Only the first of these can be directly attributed to poverty – not enough resources at the individual or household level to acquire adequate food. There are reasons to believe that in South Africa, inadequate care for children and women and insufficient health services are important factors leading to malnutrition, especially in poor and rural households, which are more likely to be grant recipients. Kruger and Gericke (2003), studying the feeding and weaning practices – as well as knowledge and attitudes towards nutrition – of caregivers of children up to 3 years old in a non-urban district north of Pretoria, reveal inadequate nutrition knowledge and cultural practices that led to poor quality feeding practices and eating habits. Harris et al. (2011), analysing the barriers to health care access through a representative survey of 4,668 households, find that black Africans, poor, uninsured individuals and rural respondents experience greater barriers to health care in terms of affordability, accessibility, and acceptability of services.

23
Figure15. UNICEFconceptualframeworkforcausesofchildmalnutrition
Source:UNICEF,1990
The implication is that cash transfers such as the Child Support Grant are not enough to eradicate malnutrition. Even if this incremental income increases household spending on food and individual consumption of food, indicators of malnutrition such as stunting and wasting could remain unchanged at the aggregate level, because the scope and scale of social grants are not enough to affect national nutrition statistics. Although the subjective experience of hunger among South Africans is falling, the objective measurement of nutrition status does not appear to reflect this improvement. Even at the individual level, increased food consumption, largely financed by social grants, might not improve the person’s nutrition status if care practices are poor or the sanitation environment is unhygienic. This was recognised in the most recent evaluation of the CSG, which found little impact on children’s anthropometry: “child health in early life requires the use of complementary inputs: resources such as food and sanitation … providing more resources in the absence of these complementary inputs is not sufficient to improve anthropometric status but when these resources are in place, cash transfers can have a positive impact” (DSD, SASSA and UNICEF, 2012). Similarly, May and Timæus (2014: 771) noted that “malnutrition in 2008 arises from factors other than poverty”. They identified improvements in child nutrition outcomes since 1994, which they attributed to positive changes such as the introduction of the Child Support Grant, improving access to clean water, free health care, and rising women’s education. Again, only the first of these is an

24
income effect; the other three are related to improving access to essential services that contribute to a healthier and better nourished population.
5. CONCLUSIONSANDPOLICYIMPLICATIONS
In this paper we have attempted to explain the paradox of very limited significant improvement in nutritional indicators in South Africa – specifically in child stunting rates – during the last two decades, despite the expansion of social grants and evidence of improved food consumption and dietary diversity in poor households. Social grants have positive impacts on food insecurity, but not on severe malnutrition. We have shown that the value of the Child Support Grant is not sufficient to cover even basic food needs. Moreover, poor households pool their income to cover the food and non-food needs of all of their members, not only of beneficiaries – so social grants have multiple uses and multiple users. Besides, malnutrition is a complex phenomenon that has multiple causes, and incremental income alone is not enough to eradicate it. In middle-income countries like South Africa – with an extensive and well-developed social protection system in place – transfers from the government enhance access to food, but this does not necessarily translate into improvements in nutrition status. Other drivers of malnutrition, such as maternal education, child care, breastfeeding and hygiene practices, as well as dietary quality, also need analytical and policy attention. In terms of implications for policy, social transfers should be substantially increased and index–linked to the cost of a nutritious food basket, so they can buy adequate food and retain their purchasing power, especially in periods of drought and high price inflation. Also, since social grants on their own are not enough to break the intergenerational transmission of malnutrition, “cash+” models should be explored, that link cash transfers to access to basic services (health, education, social services), and to behaviour change communication (BCC) on nutrition, hygiene and sanitation. One pilot project in Bangladesh found that a combination of ‘cash + BCC’, where cash transfers were complemented by nutrition training, performed significantly better than when cash only, food only, cash + food or food + BCC was delivered (Ahmed et al., 2016). Social grants are essential to finance food consumption and reduce hunger in poor households, but the determinants of nutrition status are more complex than food consumption. A holistic approach is needed to tackle the persistent and unacceptably high levels of child malnutrition in South Africa. The social grants are not high enough, and social grants alone are not enough.

25
REFERENCES
Agüero,J.,Carter,M.andWoolard,I.(2007).Theimpactofunconditionalcashtransfersonnutrition:theSouthAfricanChildSupportGrant,IPCWorkingPaper,no.39.Brasilia:InternationalPovertyCentre.
Ahmed,A.,Hoddinott,J.,Roy,S.,Sraboni,E.,Quabili,W.andMargolies,A.(2016).Whichkindsofsocialsafetynettransfersworkbestfortheultra-poorinBangladesh?OperationandimpactsoftheTransferModalityResearchInitiative.Dhaka:IFPRIandWorldFoodProgramme.
Alaba,O.andChola,L.(2014).SocioeconomicinequalitiesinadultobesityprevalenceinSouthAfrica:Adecompositionanalysis,InternationalJournalofEnvironmentalResearchandPublicHealth,11:3387–3406.
Aliber,M.(2009).ExploringStatisticsSouthAfrica’snationalhouseholdsurveysassourcesofinformationabouthousehold-levelfoodsecurity,Agrekon,48(4):384–409.
Beukes,R.,Jansen,A.,Moses,M.andYu,D.(2015).ExploringtheeligibilitycriteriaoftheChildSupportGrantanditsimpactonpoverty,paperpresentedatthe2015BiennialConferenceoftheEconomicSocietyofSouthAfrica.CapeTown:UniversityofCapeTown.2–4September.
Case,A.(2001).Doesmoneyprotecthealthstatus?EvidencefromSouthAfricanpensions,NBERWorkingPaper,No.8495.Cambridge,MA:NationalBureauofEconomicResearch.
CityPress(2016).SApovertylinesrisefasterthaninflation.19July.http://city-press.news24.com/Business/sa-poverty-lines-rise-faster-than-inflation-20160719[accessed18December2016].
Coetzee,M.(2013).FindingtheBenefits:EstimatingtheImpactoftheSouthAfricanChildSupportGrant,SouthAfricanJournalofEconomics,81(3):427–450.
Coetzee,M.(2014).Dopoorchildrenreallybenefitfromthechildsupportgrant?Econ3x3.July.
Cois,A.andDay,C.(2015).ObesitytrendsandriskfactorsintheSouthAfricanadultpopulation,BMCObesity,2(42):1–10.
Daidone,S.,Pellerano,L.,Handa,S.andDavis,B.(2015).Isgraduationfromsocialsafetynetspossible?Evidencefromsub-SaharanAfrica,IDSBulletin,46(2):93–102.
DepartmentofAgriculture,ForestryandFisheries(DAFF)(2015).AbstractofAgriculturalStatistics2015.Pretoria:RepublicofSouthAfrica.
DepartmentofHealth,MedicalResearchCouncilandOrcMacro(2007).SouthAfricaDemographicandHealthSurvey2003.Pretoria:DepartmentofHealth.
DepartmentofSocialDevelopment(DSD),SouthAfricanSocialSecurityAgency(SASSA)andUNICEF(2011).ChildSupportGrantEvaluation2010:QualitativeResearchReport.Pretoria:UNICEFSouthAfrica.

26
DepartmentofSocialDevelopment(DSD),SouthAfricanSocialSecurityAgency(SASSA)andUNICEF(2012).TheSouthAfricanChildSupportGrantImpactAssessment:Evidencefromasurveyofchildren,adolescentsandtheirhouseholds.Pretoria:UNICEFSouthAfrica.
DepartmentofSocialDevelopment(DSD)(11September2014).StatementbytheMinisterofSocialDevelopment,MsBathabileDlamini,ontheOccasionoftheMediaBriefingonUnauthorisedDeductions.www.dsd.gov.za/index.php?option=com_content&task=view&id=625&Itemid=106[accessed14July2016].
DepartmentofSocialDevelopment(DSD)(6May2016).StatementbytheMinisterofSocialDevelopment,MsBathabileDlamini,onUnauthorisedGrantDeductions.www.blacksash.org.za/index.php/media-and-publications/media-statements/1681-statement-by-the-min-of-social-development-ms-bathabile-dlamini-on-unauthorised-grant-deductions[accessed14July2016].
Duflo,E.(2003).Grandmothersandgranddaughters:Old-agepensionsandintra-householdallocationinSouthAfrica,WorldBankEconomicReview,17(1):1-25.
FAO(2001).FoodBalanceSheets:AHandbook.Rome:FoodandAgricultureOrganisationoftheUnitedNations.
FAO (2016). Country Briefs: South Africa. Rome: GIEWS (Global Information and EarlyWarning System), FAO. http://www.fao.org/giews/countrybrief/country.jsp?code=ZAF[ReferenceDate:12December2016;accessed18December2016].
Ferguson, J. (2015).Give aMan a Fish: Reflections on the New Politics of Distribution.Durham:DukeUniversityPress.
Handa,S.andDavis,B.(2006).TheexperienceofconditionalcashtransfersinLatinAmericaandtheCaribbean,ESAWorkingPaper,No.06-07.Rome:FAO.
Harris,B.,Goudge,J.,Atagubab,J.,McIntyreb,D.,Nxumaloa,N.,Jikwanac,S.andChersich,M.(2011).InequitiesinaccesstohealthcareinSouthAfrica,JournalofPublicHealthPolicy,32(S1):S102–S123.
Hendriks,S.(2014).FoodsecurityinSouthAfrica:Statusquoandpolicyimperatives,Agrekon,53(2):1–24.
Hoddinott,J.andYohannes,Y.(2002).Dietarydiversityasafoodsecurityindicator.DiscussionPaper,no.136.Washington,DC:InternationalFoodPolicyResearchInstitute(IFPRI).
Kruger,R.andGericke,G.(2003).Aqualitativeexplorationofruralfeedingandweaningpractices,knowledgeandattitudesonnutrition,PublicHealthNutrition,6(2):217–223.
Labadarios,D.,Steyn,N.P.,Maunder,E.,MacIntryre,U.,Gericke,G.,Swart,R.,Huskisson,J.,Dannhauser,A.,Vorster,H.H.,Nesmvuni,A.E.andNel,J.H.(2005).TheNationalFoodConsumptionSurvey(NFCS):SouthAfrica,1999,PublicHealthNutrition,8(5):533–543.

27
Labadarios,D.,Steyn,N.P.andNel,J.(2011).HowdiverseisthedietofadultSouthAfricans?NutritionJournal,10(33).
Lipton,M.(1988).Thepoorandthepoorest,DiscussionPaper,25.WashingtonDC:WorldBank.
Maxwell,D.,Ahiadeke,C.,Levin,C.,Armar-Klemesu,M.,Zakariah,S.andLamptey,G.(1999).Alternativefoodsecurityindicators:revisitingthefrequencyandseverityofcopingstrategies,FoodPolicy,24(4):411–429.
May,J.andTimæus,I.(2014).Inequitiesinunder-fivenutritionalstatusinSouthAfrica:whatprogresshasbeenmade?DevelopmentSouthernAfrica,31(6):761–774.
Mhlongo,V.andDaniels,R.C.(2013).FoodexpenditurepatternsinSouthAfrica:EvidencefromtheNIDS,SALDRUWorkingPaper,Number123.CapeTown:SALDRU,UniversityofCapeTown.
Ngidi,M.andHendriks,S.(2014).CopingwithfoodinsecurityinruralSouthAfrica:thecaseofJozini,KwaZulu-Natal,MediterraneanJournalofSocialSciences,25(5):278–289.
PietermaritzburgAgencyforCommunitySocialAction(PACSA)(2014).PACSAMonthlyFoodPriceBarometer:June2014.Pietermaritzburg:PACSA.
PietermaritzburgAgencyforCommunitySocialAction(PACSA)(2016).PACSAMonthlyFoodPriceBarometer:May2016.Pietermaritzburg:PACSA.
Ryan,J.andLeibbrandt,M.(2015).MultidimensionalFoodInsecurityMeasurement,SALDRUWorkingPaperSeries,Number160.CapeTown:SALDRU.
Said-Mohamed,R.,Micklesfield,L.,Pettifor,J.andNorris,S.(2015).HastheprevalenceofstuntinginSouthAfricanchildrenchangedinfortyyears?Asystematicreview,BMCPublicHealth,15:534.
SASSA(SouthAfricanSocialSecurityAgency)(2016).Factsheet:Issueno4of2016–30April2016,AstatisticalsummaryofsocialgrantsinSouthAfrica.www.sassa.gov.za/index.php/statistical-reports[accessed16August2016].
SavetheChildren(2016).Unequalportions–endingmalnutritionforeverylastchild.London:SavetheChildrenFund.
Shisana,O.,Labadarios,D.,Rehle,T.,Simbayi,L.,Zuma,K.,Dhansay,A.,Reddy,P.,Parker,W.,Hoosain,E.,Naidoo,P.,Hongoro,C.,Mchiza,Z.,Steyn,N.P.,Dwane,N.,Makoae,M.,Maluleke,T.,Ramlagan,S.,Zungu,N.,Evans,M.G.,Jacobs,L.,Faber,M.,andSANHANES-1Team(2013).SouthAfricanNationalHealthandNutritionExaminationSurvey(SANHANES-1).CapeTown:HSRCPress.
StatisticsSouthAfrica(StatsSA)(2012).Foodsecurityandagriculture2002–2011:In-depthanalysisoftheGeneralHouseholdSurveydata.GHSSeriesVolumeIV:ReportNo.03-18-03(2002–2011).Pretoria:StatisticsSouthAfrica.
StatisticsSouthAfrica(StatsSA)(2014).PovertytrendsinSouthAfrica:Anexaminationofabsolutepovertybetween2006and2011.Pretoria:StatisticsSouthAfrica.

28
StatisticsSouthAfrica(StatsSA)(2016a).ConsumerPriceIndex:March2016.StatisticalreleaseP0141.Pretoria:StatisticsSouthAfrica.
StatisticsSouthAfrica(StatsSA)(2016b).GeneralHouseholdSurvey:2015.StatisticalreleaseP0318.Pretoria:StatisticsSouthAfrica.
Steyn,N.(1996).Nutrition.Chapter13inHealthSystemsTrust,SouthAfricanHealthReview1996.Durban:HealthSystemsTrustandMenloPark,CA:HenryJ.KaiserFamilyFoundation.
Taylor,V.andChagunda,C.(2015).Thegenderdimensionsoffoodinsecurity:Women’sexperiencesofentitlementsanddeprivationinSouthAfrica.Chapter7inS.Fukuda-ParrandV.Taylor(editors),FoodSecurityinSouthAfrica:Humanrightsandentitlementperspectives.CapeTown:UCTPress.
UNICEF(1990).StrategyforImprovedNutritionofChildrenandWomeninDevelopingCountries.PolicyReviewPaper,E/ICEF/1990/1.6.NewYork:UNICEF.
Zere,E.andMcIntyre,D.(2003).Inequitiesinunder-fivechildmalnutritioninSouthAfrica,InternationalJournalforEquityinHealth,2(7):1–10.