food security cluster meeting idb building 8 january 2015
TRANSCRIPT

Food Security Cluster Meeting
IDB Building8 January 2015

1. Approval of minutes
2. Introduction of new Information Management Officer Mr. Mohammad Mainul Hossain Rony
3. FSC Work plan 2015
4. Flood Recovery Assessment
5. AOB
AGENDA
Approval of Minutes1
Introduction of new IMO
Mr. Mohammad Mainul Hossain Rony
Icddr,b, UNFPA, IOM and FAO, BBS Degree computer science and MBA in operations management
2

FSC Work plan 20153Coordination Map out a government engagement
strategy Lessons learned on Northern Flood
Response Earthquake Simulation exercise Procurement of various visibility items
(multi-media)
Information Management IM capacity building workshop Workshop on managing data for GIS and
analysis Develop mobile data collection
applications Training on the use of mobile data
collection Assessment of organisational capacity to
conduct mobile data collection program
Needs Assessment As required
IPC Level 1 Training Data Analysis Training Acute Analysis

Flood Recovery Assessment4
5 Districts (Kurigram, Gaibandha, Jamalpur, Bogra and Sirajganj) 10 Upazilas 30 Unions across engaging 360 households 60 Focus Group Discussions 10 Key Informant Interviews Union Parishad Help Line Survey District Livestock Officer - over phone
Methodology
ContextFood Security, Nutrition, Shelter and Early Recovery Assessment In Flood Affected Areas of North-west Bangladesh August 2014
Thanks to Care, Oxfam and Muslim Aid, ACF, Concern World Wide, Save the Children, DanChurch Aid and WFP

Dependence on External Support4
In Kurigram approximately 70% of HH surveyed stated they were still partially dependent on food or cash support means 20% above the average. According to HH surveys, the most common assistance was food, receiving an average of 12 kg food items and it supported them for 10 days.
Flood Recovery Assessment4
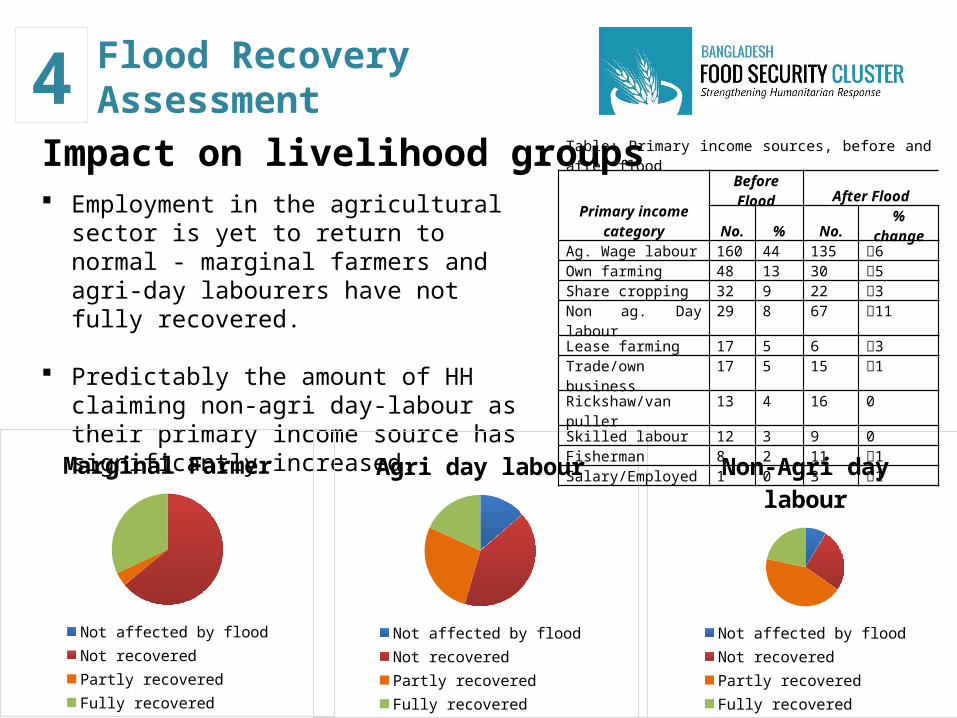
Employment in the agricultural sector is yet to return to normal - marginal farmers and agri-day labourers have not fully recovered.
Predictably the amount of HH claiming non-agri day-labour as their primary income source has significantly increased.
Impact on livelihood groups
Marginal Farmer
Not affected by flood Not recoveredPartly recovered Fully recovered
Agri day labour
Not affected by flood Not recoveredPartly recovered Fully recovered
Non-Agri day labour
Not affected by flood Not recoveredPartly recovered Fully recovered
Table: Primary income sources, before and after flood
Primary income category
Before Flood After FloodNo. % No. % change
Ag. Wage labour 160 44 135 6Own farming 48 13 30 5Share cropping 32 9 22 3Non ag. Day labour 29 8 67 11Lease farming 17 5 6 3Trade/own business 17 5 15 1Rickshaw/van puller 13 4 16 0Skilled labour 12 3 9 0Fisherman 8 2 11 1Salary/Employed 1 0 3 1

Flood Recovery Assessment6
Due to the reduction in agri-employment opportunities there is a squeeze on non-agricultural labour
There is a corresponding reduction in wages across both sectors
Implications for markets and labour
For the majority of HH assessed the average # of work days per week is 2.5 or less
Monthly income is now below the average monthly food expenditure for many HH between 200 – 800 Tk (Bogra and Kurigram)

Flood Recovery Assessment4
While instances of reduced nutritional intake was registered by some HH, the most common coping strategy was loan taking
Loans were predominantly in the 2000-5000tk range but almost a quarter of those surveyed have taken loans of up to 10,000tk.
Over 70% of women surveyed in FGD were likely to eat less, or less preferred food as a primary coping strategy, and 13% said they were forced to restricted food to children as a primary coping strategy.
Coping Strategies
Average Loan Tk
Sample size
Bogra 7741 25
Gaibandha 7533 70
Jamalpur 4918 36
Kurigram 4759 78
Sirajganj 6795 94
Average 6,349 Tk

FOOD SECURITY AND NUTRITION7
Average meal consumption dropped across all age groups
Based on the food consumption scores, about 16% of the total HH surveyed have ‘Poor’ consumption and 60% have ‘Borderline” food consumption.
Kurigram district has the highest percentage of households (39%) with poor food consumption, whereas households with borderline food consumption was higher (over 70%) in Jamalpur and Gaibandha.
Avg. Meal consumption (times per day) Before flood After
Children (2- 5yrs) 2.9 2.5Boy/Girls (5 -18yrs) 2.8 2.6Female (>18yrs) 2.7 2.4Male (>18yrs) 2.8 2.3Elderly (>60yrs) 2.6 2.3Total 2.8 2.4
FOOD SECURITY AND NUTRITION(Cont.)
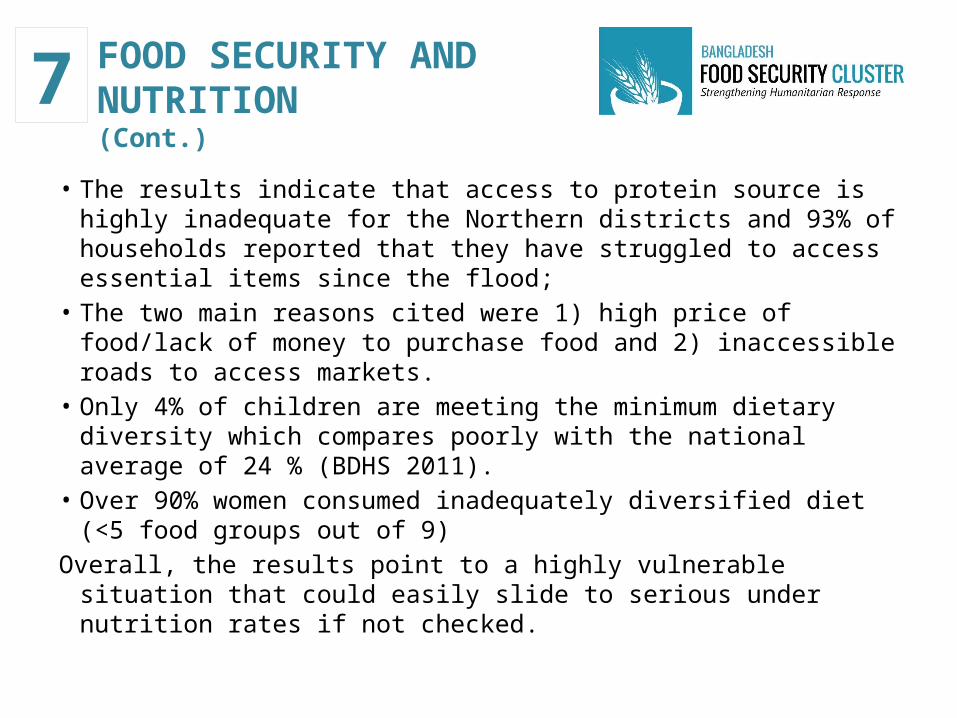
7• The results indicate that access to protein source is highly inadequate
for the Northern districts and 93% of households reported that they have struggled to access essential items since the flood;
• The two main reasons cited were 1) high price of food/lack of money to purchase food and 2) inaccessible roads to access markets.
• Only 4% of children are meeting the minimum dietary diversity which compares poorly with the national average of 24 % (BDHS 2011).
• Over 90% women consumed inadequately diversified diet (<5 food groups out of 9)
Overall, the results point to a highly vulnerable situation that could easily slide to serious under nutrition rates if not checked.

COPING STRATEGIES8
Did not borrow money
less than 2000 BDT
2001-5000 BDT
5001-10000 BDT
More than 10000 BDT
10
21
36
25
8
Proportion of households borrowed money
Normal situation Increase of 20% as compared to
last year
Increase of 50% as compared to
last year
Increase of 100% or more as compared to
last year
63
16 18
3
Loan has increased/normal situation
Household have to pay back 6655 Tk on an average
Taking loan at high interest – 25% Livelihood Change – 22% Support from relatives – 15% Selling of advance labour – 13% Spending Savings – 8%
Flood Recovery Assessment4
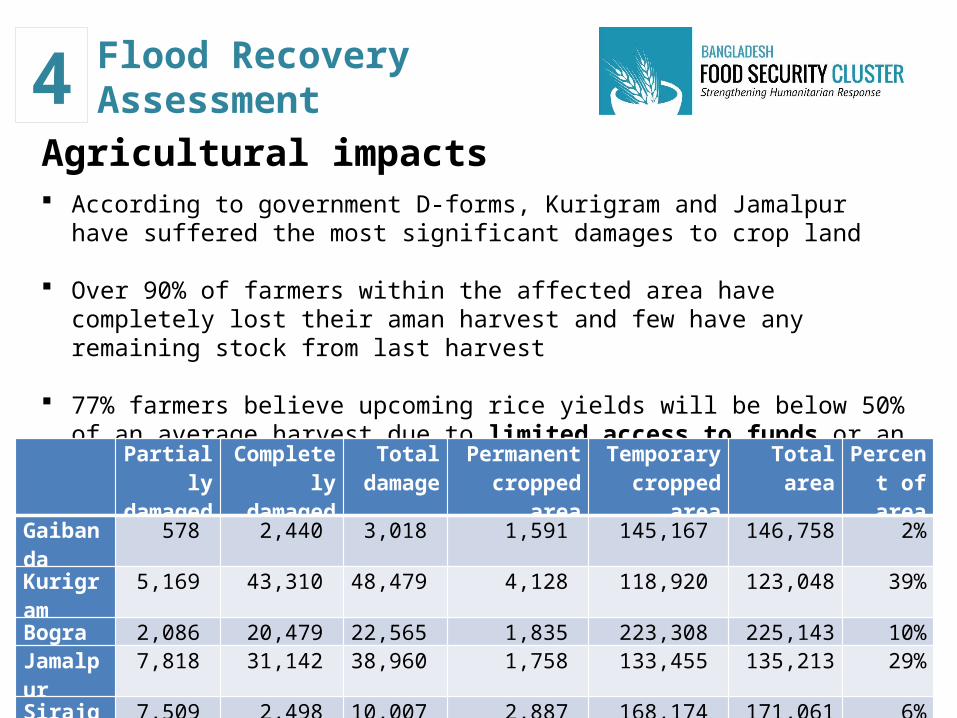
According to government D-forms, Kurigram and Jamalpur have suffered the most significant damages to crop land
Over 90% of farmers within the affected area have completely lost their aman harvest and few have any remaining stock from last harvest
77% farmers believe upcoming rice yields will be below 50% of an average harvest due to limited access to funds or an land remains unsuitable for cultivation
Agricultural impacts
Partially damaged
Completely damaged
Total damage
Permanent cropped area
Temporary cropped area
Total area Percent of area
Gaibanda 578 2,440 3,018 1,591 145,167 146,758 2%
Kurigram 5,169 43,310 48,479 4,128 118,920 123,048 39%Bogra 2,086 20,479 22,565 1,835 223,308 225,143 10%Jamalpur 7,818 31,142 38,960 1,758 133,455 135,213 29%Sirajganj 7,509 2,498 10,007 2,887 168,174 171,061 6%Total 23,160 99,869 120,589 12,199 789,024 801,223 15%

Flood Recovery Assessment4
It is estimated that almost 114,000 people remain displaced (approximately half the number estimated in the JNA).
Four Upazilas increased in numbers, most notably Fulchari (Gaibandha) where there the Union Uria reports 7000 people (up from 1500) currently residing in local flood shelters
Over 40,000 people are living on embankments or roadsides
Ongoing displacement

Flood Recovery Assessment8Shelter Major support should be provided to repair/reconstruct of different elements of
the houses, mainly the walls and structural frames
Approximately 65% of HH respondents indicated repair costs would be less than 30,000Tk, the remaining 35% would be under 50,000Tk.
The primary material needed for construction were CGI sheets, bamboo and timber.

Flood Recovery Assessment9Early recovery
Inadequate employment opportunities (46%), loss/damage of agricultural lands (26%) and insufficient financial resources (24%) were reported as major constraints for resumption of primary livelihoods of the affected families
• Most of the affected households reported that the resumption of their livelihoods would take more than 3 months period. Many of them also reported that the time period is not known to them.
• Community Community infrastructures especially embankments, roads and educational institutes were affected by the flood.
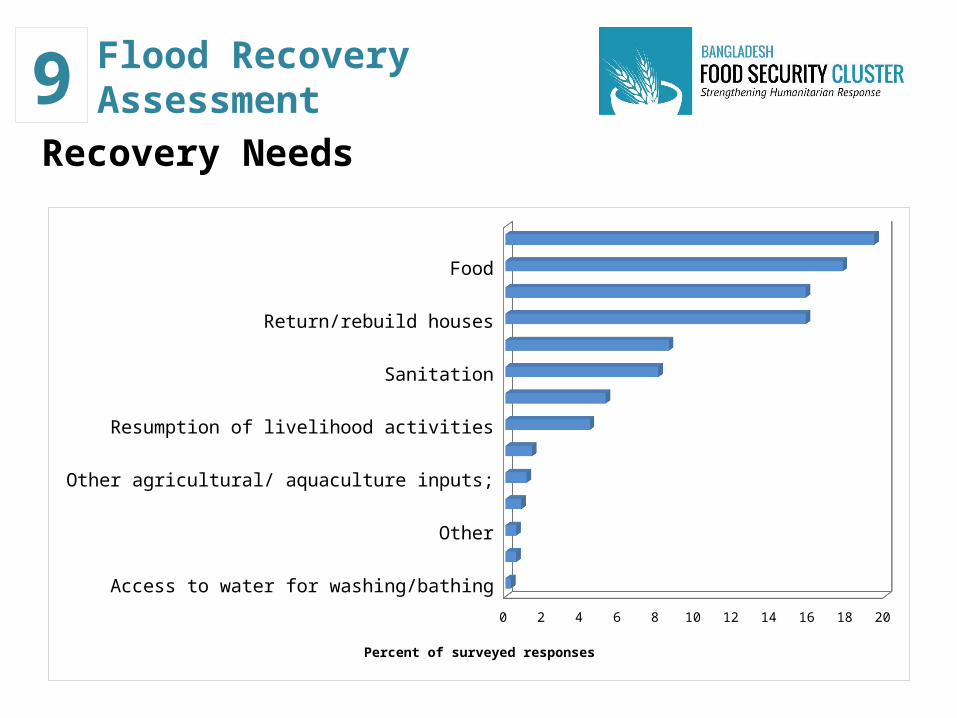
Flood Recovery Assessment9Recovery Needs
Access to water for washing/bathingChildren return to school
OtherHealth care
Other agricultural/ aquaculture inputs;Accessto clean drinking water
Resumption of livelihood activitiesSeed for agricultural production
SanitationInput for livestock
Return/rebuild housesEmployment
FoodShort term financial support
0 2 4 6 8 10 12 14 16 18 20
Percent of surveyed responses

Flood Recovery Assessment9Recovery Needs
Figure 1: Male priority needs (FGD)
Figure 2: Female priority needs (FGD).
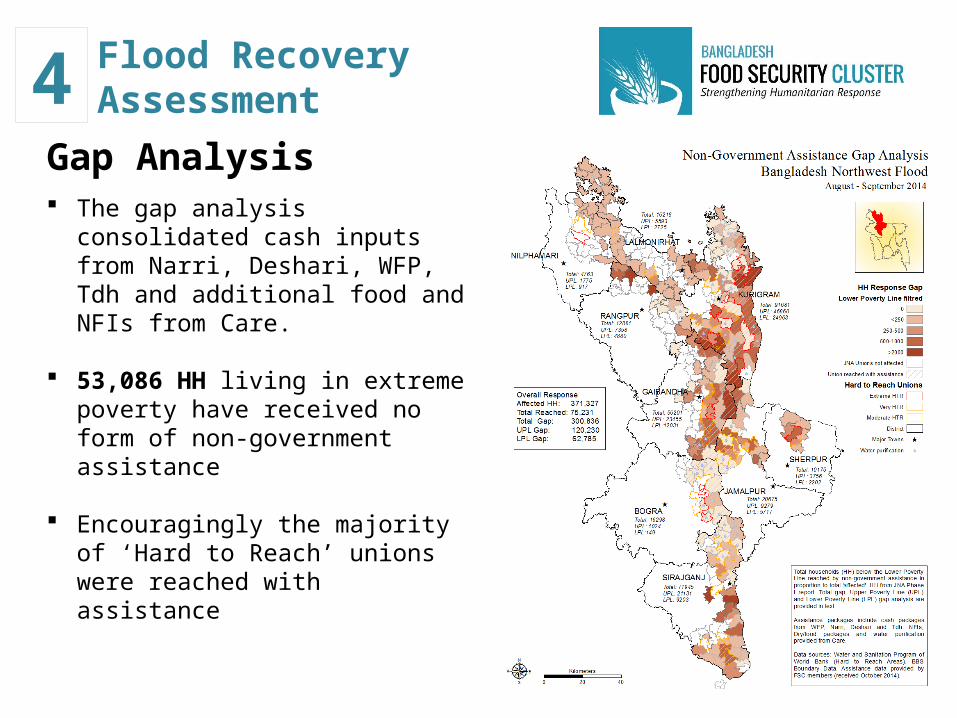
Flood Recovery Assessment4
The gap analysis consolidated cash inputs from Narri, Deshari, WFP, Tdh and additional food and NFIs from Care.
53,086 HH living in extreme poverty
have received no form of non-government assistance
Encouragingly the majority of ‘Hard to Reach’ unions were reached with assistance
Gap Analysis

Flood Recovery Assessment4
53,086 HH living in extreme poverty have received no form of non-government assistance
Over 20,000 HH remain displaced
There is a lack of skilled labour to address shelter reconstruction
Employment opportunities have not recovered and both men and women listed as their second priority behind food or cash
Significant areas of agricutural land remain damaged
Household debt is increasing with average debt around 6,500Tk.
Average meal consumption dropped across all age groups
Monthly income is now below the average monthly food expenditure for many HH between 200 – 800 Tk (Bogra and Kurigram)
Key messages

Flood Recovery Assessment4
Approximately $1.5 million is required o meet the 800Tk monthly shortfall in food expenditure for three months the
Standard packages?
The FSC urge members to coordinate through mechanisms such as the 4Ws and Cash Working Group
Key messages
Thank you