food security and family well-being by - montana state university
TRANSCRIPT
FOOD SECURITY AND FAMILY WELL-BEING
by
Lauren Christine Long
A thesis submitted in partial fulfillment of the requirements for the degree
of
Masters of Science
in
Health and Human Development
MONTANA STATE UNIVERSITY Bozeman, Montana
April 2007

©COPYRIGHT
By
Lauren Christine Long
2007
All Rights Reserved
ii
APPROVAL
of a thesis submitted by
Lauren Christine Long
This thesis has been read by each member of the thesis committee and has been found to be satisfactory regarding content, English use, format, citations, bibliographic style, and consistency, and is ready for submission to the Division of Graduate Education.
Bethany L. Letiecq, Ph.D.
Approval for the Department of Health and Human Development
Craig Stewart, Ph.D.
Approval for the Division of Graduate Education
Dr. Carl A. Fox, Vice Provost.

iii
STATEMENT OF PERMISSION TO USE
In presenting this thesis in partial fulfillment of the requirements for a master’s
degree at Montana State University, I agree that the Library shall make it available to
borrowers under rules of the Library.
If I have indicated my intention to copyright this thesis by including a copyright
notice page, copying is allowable only for scholarly purposes, consistent with “fair use”
as prescribed in the U.S. Copyright Law. Requests for permission for extended quotation
from or reproduction of this thesis in whole or in parts may be granted only by the
copyright holder.
Lauren Christine Long
April 2007

iv
TABLE OF CONTENTS
ABSTRACT...................................................................................................................... vii 1. INTRODUCTION ...........................................................................................................1 Overview of food insecurity ............................................................................................1 Household characteristics ................................................................................................1 Food insecurity at the state level......................................................................................3 Effects of food insecurity on the family ..........................................................................4 Food insecurity in rural areas...........................................................................................5 Goal of the study..............................................................................................................6 2. REVIEW OF LITERATURE ..........................................................................................7 Food security in the United States ...................................................................................7 Current population study..........................................................................................8 Prevalence of food insecurity.............................................................................9 Household characteristics ................................................................................10 Food security in Montana ..............................................................................................12 Economic status and poverty in Montana..............................................................12 Effects of food security on health ..................................................................................13 Theoretical framework...........................................................................................13 Food insecurity and mental health .........................................................................15 Parental depression and child behavior..................................................................19 Food insecurity and child behavior........................................................................23 Food security in rural areas............................................................................................27 Purpose and hypotheses .................................................................................................30 Bivariate hypotheses ..............................................................................................30 Multivariate hypotheses .........................................................................................31 3. METHODS ....................................................................................................................33 Sample ..........................................................................................................................33 Inclusion/exclusion criteria............................................................................................34 Measures ........................................................................................................................35 Demographic characteristics..........................................................................................35 Food security..........................................................................................................35 Maternal depression...............................................................................................36 Child behavior........................................................................................................37 Rurality ..................................................................................................................37 Procedure .......................................................................................................................37 Data analysis plan ..........................................................................................................37 Preliminary analysis...............................................................................................38 Hypothesis testing..................................................................................................39
v
TABLE OF CONTENTS-CONTINUED
4. RESULTS ......................................................................................................................41 Preliminary analysis.......................................................................................................41 Demographic characteristics..................................................................................41 Means, standard deviations and internal consistency Of food security, maternal depression and child behavior scores .........................46 Government assistance as a function of level of food security..............................47 Correlations between social demographics and study variables............................48 Bivariate analysis: Hypothesis testing ...........................................................................50 Hypothesis 1A and 1B: food insecurity and maternal depression .........................50 Hypothesis 2: maternal depression and child behavior..........................................51 Hypothesis 3A and 3B: food insecurity and child behavior ..................................51 Hypothesis 4: food insecurity and rurality.............................................................52 Multivariate analysis: Hypothesis testing ......................................................................55 Hypothesis 5: rurality, food insecurity and maternal depression...........................55 Hypothesis 6: rurality, food insecurity Maternal depression and child behavior ................................................................56 5. DISCUSSION................................................................................................................61 Food insecurity and maternal depression...............................................................61 Maternal depression and child behavior ................................................................62 Food insecurity and child behavior........................................................................63 Food insecurity and rurality ...................................................................................64 Predictors of maternal depression and child behavior ...........................................65 Study limitations and future research ............................................................................67 Implications for practitioners and policymakers............................................................69 REFERENCES ..............................................................................................................73 APPENDICES ...............................................................................................................80 APPENDIX A: Human Subjects Application........................................................81 APPENDIX B: Human Participant Protections Education For Research Completion Certificate.....................................................................83 APPENDIX C: Consent Form ...............................................................................85 APPENDIX D: Survey ..........................................................................................87

vi
LIST OF TABLES Table Page
1. Demographic Characteristics of the Sample (n=67)......................................................43 2. Demographic Characteristics by Survey Location ........................................................44 3. Food Security, Maternal Depression, and Child Behavior Problems: Means, Standard Deviations and Reliability Alphas .....................................................46 4. Level of Food Security by Survey Location ..................................................................47 5. Receipt of Government Assistance as a Function of Level of Food Security ..............................................................................................48 6. Correlation Coefficients of Study Variables..................................................................53 7. Maternal Depression and Child Behavior Scores as a Function of Food Security ......................................................................................54 8. Predictors of Maternal Depression.................................................................................56 9. Hierarchical Regression Analysis of Food Insecurity and Maternal Depression as Predictors of Child Behavior............................................58 10. Summary of Results Compared with Original Hypothesis..........................................59
vii
ABSTRACT
Each year, millions of individuals in the United States experience hunger yet can not afford to obtain food. This feeling of hunger and uncertain ability to obtain food can have many consequences including food insecurity. Food insecurity is a growing problem which has severe implications for the individual and family. Among these implications are parental depression and child behavior problems. Additionally, there is increasing research pertaining to the uniqueness of rural locales and the increased risk for food insecurity in these areas. Although there is a growing body of literature examining food insecurity, no studies exist that examine the relationships between food insecurity, maternal depression, and child behavior among low-income families residing in rural locales. To shed light on this topic, this study examined the ways in which food insecurity—and varying levels of food insecurity—related to maternal depression and child behavior problems. This study also examined these variables as a function of rurality. And lastly, this study examined the combined effect of rurality and food insecurity on maternal depression and child behavior problems. Sixty-seven low income women were surveyed at either the local Food Bank or the Head Start program using a convenience sample. Respondents were asked to fill out an anonymous survey about their emotional well-being, child’s behavior, and food security status. This study found a significant positive relationship between food insecurity and maternal depression, reconfirmed a well established link between maternal depression and child behavior problems, and showed a significant relationship between food insecurity status and child behavior problems. Overall, mothers who experienced more food insecurity also reported experiencing higher levels of depression and more behavioral problems with their children. Contrary to expectations, this study did not find support for a relationship between food security status and rurality. The best predictor of maternal depression in this study was food security status. This study also examined the best predictors of child behavior problems. While food security status was a significant predictor of child behavior problems on its own, when we added maternal depression in the analyses, food security status failed to account for the variance in child behavior outcomes. Implications of the findings for research, practice, and policy are discussed.
1
CHAPTER 1
INTRODUCTION
Each year, millions of individuals in the United States experience hunger yet can
not afford to obtain food. This feeling of hunger and uncertain ability to obtain food can
have many consequences including food insecurity. Currently, there are an estimated 31
million people who live in food insecure households, meaning that at some time during
the previous year, these households were unable to acquire or were uncertain of having
enough food to meet basic needs due to inadequate household resources (Nord, Andrews
& Carlson, 2005). In a wealthy nation, these high rates of food insecurity and food
insufficiency are significant national problems. According to the United States
Department of Agriculture’s (USDA) Household Food Security in the United States 2004
report, almost 12% of households are food insecure. Of these households, nearly thirty
percent are food insecure with hunger. This translates into 4.4 million people or almost
4% of all US Households that are considered food insecure with hunger. Not only is this
an astonishing number but a number that is rising annually (Nord et al.).
Currently, the operational definition of food insecurity is derived from a Life
Science Research Office report titled “Core Indications of Nutritional State for Difficult-
to-Sample Populations” published in 1990 (http://www.fao.org/wfs/index_en.htm ). Food
insecurity is “the limited or uncertain ability to acquire or consume an adequate quality or
sufficient quantity of food in socially acceptable ways” (Boyle, 2003, p.114). According
to the USDA’s Current Population Study, households that are food insecure without
hunger are those that are experiencing uncertain access to sufficient food, concerned

2
about inadequate resources to buy enough food, and who can not afford to eat balanced
meals. Households that are food insecure with hunger are those in which the adults have
decreased the quantity as well as the quality of food they consume (because of lack of
money) to the point where they show clear evidence of a repeated pattern of hunger. This
category includes households that have indicated that, due to constrained resources, their
children were not eating enough and that they had, at times, been forced to cut the size of
their children’s meals in order to make ends meet (Hampl & Hall, 2002).
Although food insecurity is considered a national problem, the prevalence of food
insecurity varies drastically depending on the type of household. Groups who are
disproportionately represented among the food insecure include poor families, working
poor families, young children, low-income women, ethnic minorities, the elderly,
homeless individuals and families, and inner-city and rural dwellers (Rose, 1999).
Geographically, food insecurity is most prevalent in the South and West and in central
cities and rural areas. Additionally, rates of food insecurity are substantially higher for
those households with incomes below the federal poverty line (Nord et al., 2005). Briefly,
the federal poverty line was developed in 1965 by taking the cost of the Thrifty Food
Plan, an emergency short term diet, and multiplying it by 3.3. The factor 3.3 was used
because in the 1960’s it was shown that low income individuals spent nearly one third of
their income on food (Boyle, 2003). It is important to mention that the food plan used in
this calculation is barely adequate and is defined as “short-term.” Additionally,
households that fall below the poverty line by definition have less money than what is
needed for a barely adequate dietary intake.
3
Examining the problem at the state level, Montana’s poverty level is
approximately 14.6% and over 37% of the population is below 200% of the poverty line
(Annie E. Casey Foundation, 2005). Almost 20% of Montana’s children under the age of
18 live in poverty, children under age 5 are at an even higher level of poverty. In 2004,
the state ranked 46th in median household income. Compared to other states in the
Northwest, Montana had the highest rate of poverty (Andrews et al., 2000; Northwest
Foundation, 2004). Specifically, the highest rates of poverty in Montana are among rural
households. According to the Northwest Foundation’s report On getting Out- and Staying
Out- of Poverty, non metro poverty rates in Montana are 15.5%, central city rates are
14.8% and suburban rates are 9.1%. Of the eight states focused on in this report, only
South Dakota ranked higher in poverty with a rate of 15.6% in non metro areas. The
report also showed that over 12% of Montana’s population was “food insecure,” and of
that number, almost 5% was “food insecure with hunger.” Both children and adults living
in poverty have difficulty accessing food in a sustainable manner that meets their
nutrition needs (Andrews et al.; Northwest Foundation).
Food insecurity has many negative effects on individuals and families. Current
research indicates that hunger and poor nutritional qualities are not the only significant
negative outcomes of food insecurity. Food insecurity disrupts many aspects of the
individual and family life and is associated with increased levels of parental depression
and emotional, behavioral and cognitive problems in children (Campbell, 1991; Olson,
1999). Although food insecurity and hunger can potentially affect mental well being and
overall quality of life, it is difficult for researchers to disentangle the health consequences
4
of food insecurity from those of its common risk factors including poverty and low
socioeconomic status (Campbell; Olson).
A recent study by Siefert, Heflin, Corcoran and Williams (2001) analyzed the
relationship between household food insufficiency and indicators of physical and mental
health status among 733 European American and African American women who are
current or recent welfare recipients. This study used random sampling and found that
household food insufficiency was a significant predictor of fair or poor self-rated health,
limitations in physical functioning, and meeting the DSM-III-R diagnostic criteria for
major depression. This was found while controlling for other factors known to be
associated with low income women’s health and mental health. Other studies conducted
by Siefert and associates have found similar results linking food insecurity to elevated
levels of depression (Siefert et al., 2001). Although several researchers have come to
similar findings there is a lack of consistency in the literature regarding the measures
used for depression and the measures used to assess food insecurity.
Other researchers have explored the relationship between food insecurity and
abnormal child behavior. Kleinman et al. (1998) found a significant relationship between
hunger and abnormal child behavior. Using the Pediatric Symptom Checklist (PSC) and
an 8-item hunger scale, researchers found that hunger status was significantly related to
total PSC score. As hypothesized, hungry children were significantly more likely to be
classified as dysfunctional by the PSC than non-hungry children or children who were
classified as “at risk” for hunger. Twenty-one percent of hungry children were classified
5
as dysfunctional by the PSC, compared with 6% of at-risk for hunger children and 3% of
non-hungry children.
Lastly, there is a growing body of evidence that food insecurity is higher in rural
areas than suburban or metropolitan areas. This may be due to the unique characteristics
affecting food availability and acquisition in rural areas. Among these characteristics are
the limited number of supermarkets, limited availability of food items and higher relative
costs of food (Morris, Neuhauser, & Campbell, 1992). Other factors that potentially
contribute to higher rates of food insecurity include negative attitudes towards welfare
and a lack of accurate information regarding welfare. Rank and Hirsch (1993) showed
that qualified families in rural areas were much less likely to participate in food
assistance programs such as food stamps than their urban counterparts due to their
negative outlook on welfare.
While research in the areas of food insecurity, maternal depression, and child
well-being has been conducted, few studies have examined the effect that food insecurity
has on both the child and parent in terms of the parent’s mental health and their child’s
behavioral outcomes. Additionally, no study has analyzed the levels of food insecurity
including “food secure,” “food insecure without hunger,” and “food insecure with
hunger” and the varying effects of food insecurity on maternal depression and child
dysfunction. Lastly, few studies have examined how these variables relate among low-
income families residing in rural communities.
To shed light on food insecurity and rurality, this study examined the
relationships between food insecurity, maternal depression, and child behavior among
6
low-income individuals residing in rural locales. To address shortcomings in the extant
literature, this study also examined maternal depression and child behavior as a function
of the level of food insecurity. It was hypothesized that parents included in the “food
insecure without hunger” and “food insecure with hunger” groups would display higher
levels of maternal depression than their food secure counterparts. Likewise, it was
hypothesized that parents reporting food insecurity without or with hunger would report
more child behavior problems than their food secure counterparts. Next, this study
examined food insecurity levels as a function of rurality. Due to the unique characteristics
of rural areas, it was also hypothesized that individuals residing in the most remote areas
of the county would report higher levels of food insecurity than those in more urbanized
areas. And finally, this study examined the ability of rurality and food insecurity to
account for the variance in maternal depression scores and the ability of rurality, food
insecurity, and maternal depression to account for the variance in child behavior
problems.

7
CHAPTER 2
LITERATURE REVIEW
Food Security in the United States
The concept of hunger is described in terms of food security, food insecurity, and
food insecurity with and without hunger (Nord et al., 2005). Food security, access by all
people at all times to sufficient food for an active and healthy lifestyle, is not a condition
felt by all individuals in the United States. Previously, when addressing the issue of food
security, researchers were speaking in terms of developing nations, however, this is no
longer a problem just experienced by developing nations.
In addition to sufficient food for an active and healthy lifestyle, food security
encompasses the fact that food is readily available, nutritionally adequate, safe, and
acquired in socially acceptable ways (Boyle, 2003). According to Splett (1994), food
security has five components, including: 1) quantity, a sufficient amount of food; 2)
quality, where the food is nutritionally adequate; 3) suitability, which suggests the food is
culturally acceptable and the capacity for preparation and storage is appropriate; 4)
psychological, where the type and quantity of food alleviates anxiety, lack of choice and
feelings of depression; and 5) social, in which the methods of acquiring food are socially
acceptable.
The lack of food security can lead to feelings of hunger and food insecurity.
Originally, the term food insecurity was used to describe the instability of national food
supplies within poor nations and then expanded to include the insecurity of food

8
situations within families (Habicht, Pelto, Frongillo, & Rose, 2004). The most current
definition of food insecurity is derived from a Life Science Research Office report titled
“Core Indications of Nutritional State for Difficult-to-Sample Populations” published in
1990 (http://www.fao.org/wfs/index_en.htm ). Food insecurity is “the limited or
uncertain ability to acquire or consume an adequate quality or sufficient quantity of food
in socially acceptable ways” (Boyle, 2003, p.114).
According to the USDA’s Current Population Study, households that are food
insecure without hunger are those that are experiencing uncertain access to sufficient
food, concerned about inadequate resources to buy enough food, and who can not afford
to eat balanced meals. Households that are food insecure with hunger are those in which
the adults have decreased the quantity as well as the quality of food they consume
(because of lack of money) to the point where they show clear evidence of a repeated
pattern of hunger. This category includes households who have indicated that due to
constrained resources their children were not eating enough and that they had, at times,
been forced to cut the size of their children’s meals in order to make ends meet.
Current Population Survey and Food Security in the United States
Since 1995, the USDA has monitored the food security of US households via an
annual, nationally representative survey. This survey is a supplement to the Current
Population Survey (CPS) and collects information regarding household food spending,
food access and adequacy and sources of food assistance for the US (Nord et al., 2005).
The survey results are published annually in the USDA report, Measuring Food Security
in the United States.

9
Specifically, 60,000 surveys were sent out to households in 2004 and 48,000
households responded. The participating households were civilian and non-
institutionalized. Each household was placed into one of three categories based on their
responses to an 18 item food security questionnaire. The questionnaire titled, “Questions
Used to Access the Food Security of Households in the CPS Food Security Survey,”
included 10 questions regarding food conditions in the household, specifically adults in
the household. If the household contained children, 8 additional questions were used to
measure their food conditions (Nord et al., 2005). According to the 2004 report,
households were classified as food secure if they reported no food-insecure conditions or
if they reported only one or two food-insecure conditions. Households were classified as
food insecure if they reported three or more food insecure conditions. The survey further
classified food insecure households into either food insecure without hunger or food
insecure with hunger depending on the number of food insecure responses (Nord et al.).
Prevalence of Food Insecurity. The USDA report shows that in 2004, 12% of
American households (13.5 million households) were food insecure at least some time
during the year and had difficulty providing enough food for all their members due to a
lack of resources. This number has risen from 11.2 percent of households in 2003 (Nord
et al., 2005).
Of these food insecure households, approximately one-third experienced food
insecurity with hunger; one or more members were hungry at least some time during the
year because they could not afford sufficient food. The remaining two thirds used a
variety of coping strategies such as eating less varied diets, participating in Federal food

10
assistance programs, or utilizing emergency food pantries in order to obtain enough food
to avoid hunger.
The USDA report states that most of the questions used to assess households’
food security status asked whether a condition, experience or behavior occurred at any
time in the past 12 months. Therefore, households could have been classified as food
insecure with hunger based on a single, severe episode during the year. Additionally,
Nord et al. (2005) further mention that when food insecurity with hunger occurs in the
United States, it is usually occasional or episodic, not chronic.
Further analyzing the data on the duration of household food insecurity, the 2004
Household Food Security report shows that about one third of the households that were
food insecure with hunger experienced the condition rarely or occasionally. The
remaining two-thirds experienced hunger in three or more months of the year. Twenty
percent of food insecure households and thirty percent of food insecure with hunger
households experienced food insecurity with hunger chronically—as often as every
month. Additionally, households classified as food insecure with hunger experienced this
condition, on average, in 8 to 9 months during the year. This does not mean, however,
that these households were food insecure with hunger every day of those eight or nine
months. On average, these households experienced this condition between one and seven
days of the month (Nord et al., 2005). Regardless of the longevity of hunger experienced,
the number of Americans experiencing food insecurity is astonishing.
Household Characteristics. The USDA’s (2004) Household Food Security in the
United States report shows that the level of food security and prevalence of food

11
insecurity varied depending on specific household characteristics. The lowest rates of
food insecurity were among households with more than one adult and no children (6.7%)
and for households with elderly persons (6.5%). For this study, “elderly” people are those
ages 65 and older. These percentages are substantially lower than the national average of
11.9%.
Additionally, certain types of households experienced food insecurity at much
higher levels than the national average, including households with incomes below the
2004 poverty line of $19,157 for a family of four (36.8%); households with children
headed by a single woman (33.0%) or a single man (22.2%); Black households (23.7%)
and Hispanic households (21.7%). There were also significant differences in reports of
food insecurity depending on the presence of children in the household. Approximately
17.6% of households with children reported food insecurity, which is approximately
twice the rate of food insecurity among households without children (8.9%). This
information shows that single, female headed households with children are at the highest
risk for food insecurity.
Rates of food insecurity also varied depending on geographic region and
proximity to a metropolitan area. Households in selected principle cities of metropolitan
areas reported a 15.4% food insecurity rate while 9% of suburban households reported
food insecurity. Approximately 13% of households living in non metropolitan areas
reported food insecurity. Geographically, the highest rates of food insecurity were
reported in the South and West with rates of 13.3% and 12.8 % respectively (Nord et al.,
2005).

12
Food Insecurity in Montana
Economic Status and Poverty in Montana
Montana is the fourth largest state in the nation with a land mass of approximately
147,042 square miles, however, it is the third least populated state with approximately 6.3
persons per square mile in 2003. It is an agricultural state with 94.5% of its land in non
metropolitan areas. Unfortunately, it is one of the poorest states in the nation and ranked
50th overall in annual pay (Annie E. Casey Foundation, 2005).
In 2002, the average annual pay for individuals in the state of Montana was
$26,001. Almost 14% of the population (13.7%) was below the poverty line and 19.1% of
its youth (17 and younger) were living in poverty. Additionally, in this same year,
Montana ranked second in the nation for children living in poverty per 100,000
population and had an overall unemployment rate of 4.6%. According to Kids Count state
level data, these statistics have not improved since 2002 and in some cases are worsening
(Annie E. Casey Foundation, 2005).
Briefly, in 2004, the overall unemployment rate rose to 4.8%, the teen
unemployment rate was up from 11.9% in 2002 to 14.6%, the number of eligible students
for free or reduced price lunch rose from 69,886 to 73,424 people, the monthly average of
food stamps participants rose from 63,766 to 81,317 people and the estimated median
household income dropped from $34,835 to $34,105. Moreover, 12% of the population
was considered “food insecure.” Of that number, almost 5% was “food insecure with
hunger” thus leading to the conclusion that both children and adults living in poverty
13
have difficulty accessing food in a sustainable manner that meets their nutrition needs
(Annie E. Casey Foundation, 2005).
The Northwest Foundation (2004) reported economic information on eight states
including, Idaho, Iowa, Minnesota, Montana, North Dakota, Oregon, South Dakota and
Washington. Montana had the highest rate of severely poor individuals (tied with SD) at
5.8% of the population, the highest rate of individuals at the poverty level (14.6%) and
the highest rate of individuals below 200% of the federal poverty level (37.1%). This
report states that Montana's rural nature has implications on the geographic distribution
of those living in poverty . The poverty rate for central cities in Montana was 14.8% and
in non metro areas was 15.5% (Northwest Foundation).
The Effects of Food Insecurity on Health
Theoretical Framework
In the early 1990s, Campbell (1991) offered a refined conceptualization of food
insecurity, which included its risk factors and consequences. In this conceptualization,
she indicated that there were two sets of potential consequences of food insecurity. The
first set of consequences refers to one’s nutritional status and includes the typical
physical and physiologic symptoms of suboptimal nutritional status, such as
anthropometric, biochemical, and clinical symptoms. The second set of consequences
refers to those related to poor nutritional status, including health and quality of life
indicators. In her framework, Campbell divides health into social and mental well being
in addition to physical health. Campbell makes the very important point that food
14
insecurity can affect health and quality of life either directly or indirectly through
nutritional status. This research paper focused on the second set of consequences—
specifically, familial mental health as it relates to food insecurity.
In conjunction with Campbell’s theoretical framework, this study was guided by
Maslow’s Hierarchy of Needs. Maslow (1968; 1970) suggests that all human beings,
regardless of culture, have five basic needs that can be arranged on a hierarchy according
to prepotency or pressing drive for fulfillment. From the lowest level of needs (the most
prepotent needs) to the highest level, these include physiological needs, safety needs,
need for belongingness and love, esteem needs, and self-actualization.
The most prepotent need group, physiological needs, relates to the body’s need
for food, water, oxygen, optimal temperature, and sleep in order to maintain
physiological homeostasis and survival. Without food, water, sleep and oxygen, nothing
else in life matters; however, once these needs are met one is able to move to the next
level. The second most prepotent need group, safety needs, includes the need for security,
protection, stability, and freedom from fear or constant anxiety. At this level we look for
safety through other people and strive to find a world that will protect us and keep us free
from harm (Harper, Harper, & Stills, 2003). Once we feel safe and secure in our world
we can seek out friendship in order to feel a sense of belonging (Harper et al.).
Need for belongingness and love, the next level, is described by Maslow as the
need to belong to and feel loved by a group. These groups include one’s family, religious
group, work group, professional group, social club or fraternity, or even one’s youth
gang. The fourth hierarchical level is called esteem needs. This level has to do with self-

15
esteem for one’s accomplishments or achievements and deserved esteem from others,
based on one’s accomplishments, status, or appearance. At this level we focus our energy
on self-respect, respect from others and feeling that we have made accomplishments in
our lives.
The final level in the hierarchy is the need for self-actualization. Self-
actualization refers to a complete understanding of the self and the need to develop one’s
common potential and unique talent at the highest possible level of growth and
achievement. To be self-actualized means to deeply know who you are, where you
belong in the greater society or scheme of life, and to feel like you have accomplished all
that you have set out to accomplish (Harper et al., 2003)
The premise behind Maslow’s hierarchy is that we are born with certain needs.
Without meeting our initial needs we may not be able to continue our life (e.g., if basic
needs are not met) and may not be able to move upward on the hierarchy (Harper et al.,
2003). It is also possible that individuals will attempt to meet their “higher-order” needs
(e.g., belongingness, esteem) but may do so in dysfunctional, less optimal, or unhealthy
ways. Based on this theory, it seems logical that without fulfilling the basic physiological
need for food, one will likely not be able to fulfill higher needs, which may compromise
one’s mental health and familial well-being.
Food Insecurity and Mental Health
Current research suggests that food insufficiency/food insecurity may affect
mental health, specifically the likelihood of parental depression. There are several
reasons why this may occur. First, food insufficiency could impair mental health through
16
the direct effect of nutritional shortfalls on psychological functioning and behavior. Even
the early stages of nutrient deficiency can adversely affect behavior and mental
performance. In a study conducted by Heseker, Kubler, Pudel and Westenhoffer (1992),
1081 young men in good health received a reduced vitamin intake over a 2 month period.
This reduced intake was associated with negative changes in psychological disposition
and functioning. Tiemeier et al. (2002) also found that inadequate vitamin intake was
associated with increased irritability, nervousness, depression, feelings of fear and
decreased well-being, memory and reaction performance.
Secondly, research suggests that household food insufficiency may be
subjectively experienced as a stressful event. The presence and or persistence of food
insufficiency could initiate or maintain feelings of self-blame and the perception that one
is not efficacious (Gecas & Schwalbe, 1983). Furthermore, there is a documented
association between cumulative or persistent stressful life events or conditions and the
onset or chronicity of depression. This is particularly prevalent in, but not limited to,
mothers with low self-esteem and lack of support (Brown & Moran, 1997).
A recent study conducted by Siefert et al. (2001) analyzed the relationship
between household food insufficiency and indicators of physical and mental health status
among 753 African American and White women. These women were either current or
recent welfare recipients. This study found that household food insufficiency was a
significant predictor of fair or poor self-rated health, limitations in physical functioning
and meeting the DSM-III-R diagnostic criteria for major depression.

17
In another study conducted by Siefert, Heflin, Corcoran, and Williams (2004),
researchers investigated the physical and mental effects of food insufficiency by using
two waves of the same data mentioned above. This longitudinal study allowed
researchers to measure persistent or recurrent food insufficiency and allowed researchers
to estimate the effects of food insufficiency on health status at the second wave, while
controlling for both initial health status at wave 1, personal risk factors and common risk
factors.
Specifically, Siefert et al. (2004) analyzed the data from the second wave of the
Women’s Employment Study. The study participants were 753 mothers who were
receiving cash assistance in an urban Michigan county in February 1997. Researchers
hypothesized that household food insufficiency would be associated with worse physical
and mental health in this population and that persistent or recurrent food insufficiency
would be associated with worse physical and mental health status. It is important to note
that in this study, the term “food insufficiency” was defined as “restricted household food
stores or too little food intake among either adults or children in the household” (Siefert
et al., p. 174). Food insufficiency was measured using a single item validated measure
and major depressive disorder was measured using the Composite International
Diagnostic Interview developed by Siefert and associates.
The results showed that over one third of the participants had experienced food
insufficiency at one or both of the waves, 11.8% were food insufficient at both waves,
12.7 % were food insufficient at wave 1 and 10.2% were food insufficient only at wave 2
(Siefert et al., 2004). Food insufficiency at both waves and food insufficiency at wave 2

18
were significantly associated with meeting the diagnostic criteria for major depression.
Studies like this are difficult to interpret due to the challenge in distinguishing the health
consequences of food insecurity from those of its common risk factors such as poverty
and low socioeconomic status (Campbell, 1991). When social and environmental risk
factors as well as background characteristics were controlled for, the associations became
smaller in size; however, they were still significant.
It was also found that the women who became food insufficient between the first
and second waves were more likely to meet the diagnostic criteria for major depression at
wave 2. If reconfirmed researchers think that preventing food insufficiency might lower
the risk of major depression in this particular population. Another interesting finding
pertained to the longevity of food insufficiency. This study found that the participants
who reported food insufficiency only at wave 1 and not again at wave 2 had similar
physical and mental health outcomes as those who never reported food insufficiency.
This suggests that the effects of short term food insufficiency may not be permanent
(Siefert et al., 2004). The exact duration of food insufficiency experienced for an
individual to display negative health outcomes is not known. The overall findings
supported the hypothesis that persistent or recurrent food insufficiency is a significant
and independent predictor of self-rated health (Siefert et al.).
In a convenience sample of 5306 mothers in 5 states and the District of Columbia,
researchers arrived at similar associations between parental depression and food
insecurity. Casey et al. (2004) conducted household-level surveys and medical record
audits during a three year time period. Caregivers were interviewed and demographic

19
information was collected. Household food security was measured using the USDA 18-
item Food Security Scale and maternal depression was measured using a 3-item maternal
depression screen. The study found that 35% of the mothers in the sample were positive
on the maternal depression screen and that a positive maternal depression screen was
strongly associated with food insecurity. Additionally, 53% of the mothers who reported
food insecurity scored positive on the maternal depression scale (Casey et al.). Although
there is substantial literature linking food insecurity and parental depression, there are
few, if any, studies that have looked at the severity of food insecurity and how it is
related to the mental health of caregivers.
Parental Depression and Child Behavior
Maternal depression has been identified as an extremely important variable in
relation to child outcomes. Higher rates of parental stress and maternal depression are
associated with harsher, inconsistent, and less responsive parenting (McLeod &
Nonnemaker, 2000). Studies show an association between a mother’s depression and
adverse outcomes for a child. These adverse outcomes include low birth weight, behavior
problems, learning difficulties, poor growth, higher incidences of accidents, emotional
illness and somatic complaints (Zuckerman & Bearslee, 1987). According to Petterson
and Albers (2001), depressed women’s maternal behavior has been characterized in
studies as less responsive, more hostile, critical, alternatively disengaged or intrusive,
disorganized and less active, avoidant of confrontation and generally less confident than
non depressed mothers. Although the rate of clinical depression in the general population

20
is said to be only 5%, there are indications that up to 21% of females are diagnosed with
depression (Kornstein et al., 2000).
It is important to recognize that the rates of depression differ depending on the
different populations studied and the assessment tool used. Childrearing also plays an
important role on depression rates as over 12% of mothers with young children have a
diagnosable depression and up to 52% have depressive symptoms (Zuckerman &
Beardslee, 1987). Other factors that are associated with an increased rate of depression
include lower education, housing dissatisfaction, immigrant status, poor marital relations,
stressful life events and belonging to a lower economic class. According to Zuckerman
and Beardslee (2001), researchers have shown that working class mothers are much more
likely to be depressed than those mothers in a higher economic class. In conjunction, both
gender and low SES are strongly associated with increased risk of depression, however,
the pathways through which they influence mood disorders are not well understood.
Epidemiologic studies worldwide have established that depression is twice as prevalent in
women as men, and that childbearing and child-rearing years is when the first onset of
depression peaks (Culbertson, 1997; Kessler et al., 1994; Weissman & Olfson, 1995).
Other researchers have found that mothers of young children are at particular risk;
maternal depression rates in pediatric primary care settings range from 12% to 47%
(Heneghan, Silver, Bauman, Westbrook, & Stein, 1998). Mothers with several young
children, single mothers, and mothers in poverty are at even higher risk of depression
(Heneghan et al.; Hobfoll, Ritter, Lavin, Hulsizer, & Cameron, 1995).
21
In a study looking at maternal depression and child outcomes among a child
welfare sample, Leschield, Chiodo, Whitehead and Hurley (2003) found that poor child
outcomes such as attention deficit disorder, conduct disorder and emotional adjustment
were related to maternal depression. This study was a retrospective file review of child
protection cases from the years 1995 and 2001. The participants included 853
mother/child pairs. Information regarding the families’ mental health, family violence
and access to social services was collected. Additionally, information collected on the
children included past and present access to mental health, young offender, educational
and developmental services as well as outcomes related to behavioral, developmental,
academic and psychological concerns. A risk analysis was then completed from this
information via a Risk Assessment Tool. Two behavioral outcomes and one
psychological outcome were considered including an attention deficit hyperactivity
disorder (ADHD), conduct disorder and the primary psychological (emotional) concern
of the child.
According to Leschied et al. (2003), the results indicated that more children of
depressed mothers were diagnosed with ADHD and were on medication for an
adjustment related disorder than children living with non depressed mothers. In addition,
a higher number of children living with depressed mothers were identified as having a
psychological/emotional concern versus children of non-depressed mothers. Other
findings suggest that children with depressed mothers are more likely to have higher risk
scores than children of non depressed mothers. Lastly, depressed mothers and their

22
offspring are more likely to be utilizing treatment services and be more socially isolated
than non-depressed mothers.
In another study conducted by Fendrich, Warner, and Weissman (1990),
researchers assessed multiple measures of family discord on psychopathology in children
of depressed and non-depressed parents. Essentially, their study compared offspring from
65 families with one or more depressed parents with offspring from 26 non-depressed
parents. Parents were interviewed about their children and answered question pertaining
to their child’s behavioral and social functioning as well as developmental history.
Additionally four lifetime diagnoses in children including major depression, anxiety
disorder, conduct disorder and any other diagnosis were compared to indexes of family
disharmony (Fendrich et al.). The results showed that the rates for all of the diagnostic
categories were higher for the children of depressed parents than for children of non-
depressed parents. The most relevant findings of this study indicated that the presence of
parental depression is the most important risk factor and predictor of major depression,
anxiety disorders and any diagnosis in offspring. Furthermore, parental depression was
identified as an important risk factor for child conduct disorder.
While researchers have examined relationships between food insecurity and
parental depression, and relationships between parental depression and child behavior,
fewer studies have focused on food insecurity and child outcomes. The following section
reviews the extant literature in this area.
23
Food Insecurity and Child Behavior
Dunifon and Kowaleski-Jones (2003) state that food insecurity is likely to affect
children via two pathways. The first pathway is related to food insecurity in the home.
Food insecurity in the home may translate into a source of family stress that has the
potential to affect both parenting behaviors and the children’s reactions to parenting
behaviors. These familial stressors may have negative implications for child behavior.
Additionally, as low income parents experience hardships or new stresses, their mental
health and interactions with their children may change. This change could directly affect
their children’s functioning. The second pathway is the direct affect that food security has
on the child’s health. Research suggests that children who are living in homes where the
availability of food is limited are less likely to have access to nutritionally adequate foods
therefore potentially affecting their health outcome (Dunifon & Kowaleski-Jones).
Others have found that going without food can cause distractibility, irritability or
emotional changes which in turn affect children’s achievement and psychosocial
behaviors (Strupp & Levitsky, 1995). Regardless of the exact mechanism, there are
several studies that indicate that children living in food-insecure or hungry households
experience considerable psychological and emotional distress.
According to Murphy et al. (1998), most of the current data available on the
impact of intermittent episodes of food insufficiency and hunger comes from the CCHIP
surveys. The Community Childhood Hunger Impact Project or CCHIP conducted a series
of 18 studies using large, selected samples in communities through out the nation. This
project categorized families as “hungry”, “at-risk for hunger,” or “not hungry” based on

24
the parent’s answers to 8 standardized questions. Based on these parental reports, it has
been consistently shown that children who are classified as hungry are more likely to
have mood and attention problems than those who are not hungry (Murphy et al.).
In a study conducted by Murphy et al. (1998), researchers examined the
relationship between child hunger as measured by CCHIP parental reports and
psychosocial problems assessed using standardized measures. This study was conducted
in a total of four schools in Philadelphia and Baltimore using a battery pf psychosocial,
academic and food insufficiency/hunger measures before the start of a free breakfast
program. Teachers of all of the students completed a teacher report measure before and
after the free breakfast program began (Murphy et al.). The results indicated that 65% of
the children were classified as not hungry according to the CCHIP scale, 27% were at
risk for hunger and 8% were hungry. According to the parent report measures, those
children that were classified as hungry and at risk for hunger scored twice as high on the
Child Behavior Checklist as children in the not hungry group. A higher score is indicative
of impairment. Additionally, on the second child behavior measure, the Pediatric
Symptom Checklist, total scores were significantly associated with child hunger status.
This checklist is a parent completed questionnaire that has been validated as a screening
measure to identify children with psychosocial problems (Murphy et al.).These findings
suggest that parent reported hunger scores are associated with psychosocial dysfunction
in their children as assessed by the standardized measures mentioned above. Furthermore,
in this study, hungry children were 2-3 times more likely to score in the impaired range
on the measures concerning emotional problems than their non hungry schoolmates.
25
Lastly, attention and behavior problems per teacher reports were more prevalent in
hungry children than either those at risk for hunger or those classified as not hungry
(Murphy et al.).
Two additional studies found similar results. A study conducted by Kleinman et
al. (1998) looked at the potential behavioral and emotional correlates among hungry
children. The data for this study were taken from a CCHIP study in Pittsburgh PA and the
surrounding county. Similar to previous studies conducted by Murphy et al., hunger was
assessed using an 8 item CCHIP scale and participants were classified as “hungry,” “at
risk for hunger,” or “not hungry” depending on their responses to the questions. The
Pediatric Symptom Checklist (PSC), a 35 item questionnaire answered by parents, was
used to assess child psychosocial dysfunction. Researchers hypothesized that hungry
children would have a higher rate of psychosocial dysfunction than not hungry children.
The results of this study showed that total hunger status was significantly related
to total PSC score and as hypothesized, hungry children were significantly more likely to
be classified as dysfunctional by the PSC than non hungry or at risk children (Kleinman
et al., 1998). Specifically, 21% of the “hungry” children scored in the dysfunctional
range on the PSC vs. 6% of the “at-risk for hunger” children and 3% of the “non hungry”
children. When analyzing specific behaviors, this study found that hungry children were
7 to 12 times more likely to exhibit symptoms of conduct disorder than non hungry
children. Additionally, higher levels of irritable, anxious, aggressive and oppositional
behaviors were found among low income hungry children that among low income non
hungry children (Kleinman et al.).
26
More recently, Alaimo, Olson, and Frongillo (2001) investigated the association
between food insufficiency and cognitive, academic and psychosocial outcomes for US
children aged 6 to 11 and 12 to 16. Data from the Third National Health and Nutrition
Examination Survey (NHANES III) were used. This national health survey was
conducted from 1988 to 1994 among the US civilian population and included medical
and cognitive examinations and interviews conducted with survey participants and proxy
respondents. Alaimo and associates postulated that poor cognitive, academic and
psychosocial outcomes are caused by deficiencies in family and child resources,
environmental risks, past nutrition, health and social risks, and family food insufficiency.
Of particular interest is the component of this study related to food insufficiency and
psychosocial outcomes. In this study, psychosocial outcomes included whether the child
had ever seen a psychiatrist (or other mental health professional) for emotional, mental or
behavioral problems, number of days absent from school, whether they had been
suspended, number of friends, and if they had trouble getting along with other children or
teenagers. Families were reported as food insufficient if the familial survey respondent
answered that they either “sometimes” or “often” did not get enough food to eat.
The results showed that food insufficient children were more likely to have
psychosocial difficulties than food sufficient children. After adjusting for potentially
confounding variables, there was a positive association between food insufficiency and
having seen a psychologist and repeating a grade among 6-11 year olds. Food insufficient
teenagers were 3 times as likely to have been suspended from school, more than 2 times

27
as likely to have seen a mental health professional and 2 times as likely to have problems
getting along with others than their food sufficient classmates (Alaimo et al., 2001).
All of the studies explained above are similar in respect to the correlational
relationship that they show. In most cases, it is difficult to discern the role that poverty
plays among children versus food insecurity. Poverty and food insecurity are
interdependent and many studies demonstrate higher levels of food insecurity among the
poor. Additionally, lower income adults have higher rates of mental disorders including
depression and antisocial behaviors than those with higher incomes. A repeated link
between general economic hardship and poor mental health in adults has been
documented (Dohrenwend et al., 1992; Jayakody, Danzinger, & Pollak, 2000; Pollak,
Danziger, Seefeldt, & Jayakody, 2002). In turn, further research has shown that poor
mental health among parents is associated with impaired parent-child interactions
(McLeod & Nonnemaker, 2000). What remains to be studied are the relationships
between food insecurity, maternal depression, and child behavior among low-income
families residing in rural locales.
Food Insecurity in Rural Areas
Research has shown that rates of food insecurity are higher among rural areas
than suburbs, metropolitan areas and noncentral cities. In their study, Morris et al. (1992)
stated that there are several factors that contribute to a higher degree of food insecurity in
rural areas. These factors include a limited number of supermarkets in rural areas
compared to urban areas, the lack of variety of food items available in rural areas, and
higher food prices.
28
There are additional factors that may contribute to food insecurity in rural areas.
Rank and Hirsch (1993) have shown that qualified families in rural areas are much less
likely to participate in food assistance programs such as food stamps than their urban
counterparts. These researchers found two main reasons for low food stamp participation
rates including adverse attitudes toward welfare and lack of accurate information.
Furthermore, studies indicate that food acquisition may be constrained in rural areas and
that these constraints may increase households' risk of food insecurity (Rank & Hirsch).
Olson and Rauschenbach in their 1997 study examined household food insecurity
in a rural area in upstate New York. Their objectives were threefold. First, the researchers
identified the social, demographic and economic characteristics of households that
contribute to food insecurity. Second, the researchers identified the food acquisition
characteristics of households that contribute to food insecurity. And lastly, the
researchers analyzed the interrelationships between these two factors. Specifically, this
study was conducted in a county with an approximate population in 1990 of 60,000
people. Two hundred women with children in their household participated in this study
which included two in-home interviews. The information collected included
sociodemographic characteristics, methods of obtaining food, food program participation,
household expenditure and the Radimer/Cornell hunger and food insecurity questions. A
household food inventory was also conducted. Their results showed that there were
higher rates of food insufficiency among households that were low income, renting a
home, headed by a single parent, had a low educational level, were larger in size—that is,
six or more people in the household, and of an ethnic minority group. Economic

29
insecurity and limited income earning potential were also related to an increased risk of
food insecurity. Additionally, total annual food expenditures were strongly associated
with food insecurity and low food supplies. Total amount of money spent on food
differed as well. Food insecure households spent approximately 83% of what food secure
households spent on food. Although only a small portion of households received food
stamps in this study, those receiving insufficient food stamp allowances in which they
had to add $50 or more of their personal money to groceries were more likely to be food
insecure and to have lower household food supplies (Olsen & Rauschenbach).
In another study conducted by Olsen, Anderson, Kiss, Lawrence, and Seiling
(2004), the researchers interviewed 316 families with children in 24 rural counties in 14
states. Their objectives were to access how the level of human resources of the household
and the diversion of financial resources from food acquisition influence food security. To
be eligible for the study, households had to have incomes at or below 200 percent of the
federal poverty line and had at least one child 12 years old or younger (Olsen et al.). Both
in-depth qualitative and quantitative data were collected from the mother in each
household. The results of this study were similar to Olsen’s previous work and
demonstrated that chronic health conditions, life skills, knowledge of community
resources, and participation in the Food Stamp Program were each related to food
security status.
30
Study Purpose and Hypotheses
Although there is a growing body of literature examining food insecurity, no
studies exist that examine the relationships between food insecurity, maternal depression,
and child behavior among low-income families residing in rural locales. To shed light on
this topic, this study examined the ways in which food insecurity—and varying levels of
food insecurity—related to maternal depression and child behavior problems. This study
also examined these variables as a function of rurality. And lastly, this study examined
the combined effect of rurality and food insecurity on maternal depression and child
behavior problems.
Based on the extant literature, there were a number of hypotheses developed for
this study. These hypotheses included the following bivariate and multivariate
expectations:
Bivariate Hypotheses
Food Insecurity and Maternal Depression
1a. It was hypothesized that food insecurity would be related to maternal depression.
Mothers who reported higher levels of food insecurity would experience more
depressive symptoms than their more food secure counterparts.
1b. It was hypothesized that mothers included in the “food insecure without hunger”
and “food insecure with hunger” groups would display higher levels of maternal
depression than their food secure counterparts.

31
Maternal Depression and Child Behavior
2. It was hypothesized that, as compared to less depressed mothers, mothers who
experienced more depressive symptoms would also report that their child
exhibited more behavior problems.
Food Insecurity and Child Behavior
3a. It was hypothesized that food insecurity would be related to child behavior such
that families experiencing higher levels of food insecurity would report more
child behavior problems than families experiencing food security.
3b. It was also hypothesized that mothers who reported experiencing food insecurity
without or with hunger would report more behavior problems exhibited by their
children than their food secure counterparts.
Food Insecurity and Rurality
4. It was hypothesized that individuals residing in the most remote areas of the
county would report higher levels of food insecurity than those in more urbanized
areas.
Multivariate Hypotheses
Rurality, Food Insecurity, and Maternal Depression
5. It was hypothesized that both degree of rurality and level of food insecurity would
predict maternal depression such that more rural dwellers and more food insecure
mothers would report more depressive symptoms than their less rural, less food
insecure counterparts.

32
Rurality, food insecurity, maternal depression, and child behavior
6. It was hypothesized that rurality, food insecurity, and maternal depression would
predict child behavior problems such that more rural dwellers, more food insecure
mothers, and mothers experiencing more depressive symptoms would report that
their child exhibited more behavioral problems than their less rural, less food
insecure, less depressed counterparts.

33
CHAPTER 3
METHODS
Sample
This study was conducted at two locations: the Gallatin Valley Food Bank and
Head Start centers located in the Gallatin Valley. At the Food Bank, data were gathered
over a two week period. In an average week, one hundred families receive emergency
assistance from the food bank. Given inclusion criteria and refusals, we estimated that we
would recruit a minimum of 50% of the families. At the end of the first week, there were
only 25 respondents; thus, we extended this study for a second week.
The Gallatin Valley Food Bank provides a 3-5 day supply of “emergency” food to
individuals in need and allows recipients to receive food every thirty days as needed. The
facility is located in the largest city in the county, Bozeman. Individuals and families
from neighboring towns and counties also receive emergency food supplies from this
location. Due to the “emergency” relief that the food bank provides, most individuals that
come to the food bank are low-income and/or receiving federal assistance.
In 2005, a study of 296 clients at food pantries and soup kitchens in the state was
conducted by America’s Second Harvest. Although almost half the people surveyed were
employed, almost 77% were experiencing food insecurity, and of this number, over 46%
were dealing with severe hunger. In households with children under aged 18, 76% were
food insecure. In households with seniors over the age of 65, 57% were food insecure
(Montana State Advisory Council on Food and Nutrition, 2006).

34
Specific to the Gallatin Valley, in 2004, 6,153 Households were provided with
emergency food boxes, representing 17,458 individuals and an average household size of
2.83. Of the total households, 907 were requesting emergency food assistance for the first
time. Additionally, 29% of the households served requested assistance only once within a
one year period. Lastly, almost 33% of the people receiving assistance were under the age
of 17 and 9.4% were over the age of 60 (Gallatin Valley Food Bank, 2005).
Inclusion/Exclusion Criteria
Study participants were limited to women with children aged 4 to 16 years. The
study was limited to women due to the overwhelming amount of research suggesting
higher rates of depression among women than men. As previously mentioned,
epidemiologic studies worldwide have established that depression is twice as prevalent in
women as men, and that childbearing and child-rearing years are when the first onset of
depression peaks (Culbertson, 1997; Kessler et al., 1994; Weissman & Olfson, 1995).
Other researchers have found that mothers of young children are at particular risk;
maternal depression rates in pediatric primary care settings range from 12% to 47%
(Heneghan et al., 1998). Mothers with several young children, single mothers, and
mothers in poverty are at even higher risk of depression (Heneghan et al.; Hobfoll et al.,
1995). If a participating mother was the primary caregiver for more than one child
between the ages of 4 and 16, the mother was asked to focus on the child that had the
most recent birthday.

35
Measures
Demographic Characteristics
All participants were asked a series of questions detailing their sociodemographic
characteristics, including mother’s age, child’s age, mother’s level of education, income,
and relationship status.
Food Security
Household food security was assessed using the 18-item US Household Food
Security Survey Module (Hamilton et al., 1997) which was derived from the CPS data
described previously. This scale is the most widely used scale to assess household food
insecurity and consists of 18 questions; 10 items about household food insecurity and
adult hunger and 8 items about child food insecurity and hunger. These 18 items are
ordered by severity and cutoff points were placed a scale according to substantive
considerations. The scale is scored using the number of affirmative responses by the
household and placed into one of four categories. These are food secure (affirmative
responses to less than 3 items in all types of households), food insecure without hunger
(households with out children: 3-5 positive responses, households with children: 3-7
positive responses), food insecure with hunger (without children: more than 5 positive
responses; households with children: more than 7 positive responses). Households with
children are further classified as food insecure with hunger among children if there are
affirmative responses to 5 of 8 items specifically addressing children (Alaimo, 2005).
Examples of items include: “In the last 12 months, did you ever eat less than you felt you
should because there wasn’t enough money to buy food?” and “I/We couldn’t afford to
36
eat balanced meals.” This 12 month scale has been shown to have a reliability score of
.81 for households with children and is the most comprehensive instrument developed for
measuring food security and hunger in US households (Keenan, Olson, Hersey, &
Parmer, 2001).
Maternal Depression
Depression as an indicator of psychological well-being was measured using the
Centers for Epidemiological Studies-Depression Scale (CES-D; Radloff, 1977).
Depression was defined in this study as symptomology expressed through the self-report
CES-D Scale which included: depressed mood, feelings of guilt and worthlessness,
feelings of helplessness and hopelessness, psychomotor retardation, loss of appetite, and
sleep disturbance. This scale has been successfully used in non-clinical samples.
Questions on the CES-D included, “I was bothered by things that don’t usually bother
me,” “I felt that everything I did was an effort,” “My sleep was restless,” and “I felt that
people disliked me.” Each symptom was coded on a scale ranging from 0 (symptom
experienced rarely or never in the past week) to 4 (symptom experienced usually or all
the time in the past week). This measure was scored by summing the 20 items, which
yielded scores ranging from 1-60. The cutoff score of 16 indicates clinical concern for
depression (Radloff). The CES-D is a widely used, easily administrated self-report
measure of current depressive symptoms. The scale has good internal consistency with a
Cronbach’s alpha of .73, acceptable test-retest reliability, and excellent concurrent
validity. The psychometric properties have previously been found to be consistent across
sex, age, and ethnic subgroups (Radloff & Locke, 1986).

37
Child Behavior
Child Behavior was measured using the Pediatric Symptom Checklist. This
measure is a psychosocial screen designed to help recognize cognitive, emotional and
behavioral problems in children ages 6-16. This parent-completed form consists of 35
items that are rated as “never”, “sometimes” or “often” scored as 0, 1 and 2 respectively.
The total score is calculated by summing the scores for each of the items with a cut off
point of 28. A score of 28 or higher indicates psychological impairment (Kleinman et al.,
1998). Examples of items include: “Less interested in school,” “Does not understand
other people’s feelings,” and “Takes things that do not belong to him or her.”
Rurality
Measures of rurality are quite limited in scope. The USDA defines rural areas as
those with fewer than 2,500 residents (USDA Economic Research Service, 2007). For
this study, we used the following question as a proxy for rurality: “How many miles do
you live from the closest major grocery store?” Those who lived farthest away from a
major grocery store were considered the most rural dwellers. This measure assumed
proximity to a major grocery store was indicative of one’s rurality.
Procedure
This study used a convenience sample and participation was voluntary. Data were
collected for two weeks from the hours of 1-4 pm while the Food Bank was open for
emergency assistance. Surveys were distributed on clipboards to individuals receiving
food boxes at the Gallatin Valley Food bank. Individuals were asked to fill out the
38
surveys while waiting for their food boxes. The surveys were numbered and not named in
order to maintain anonymity. Women were screened by intake workers at the Gallatin
Valley Food bank to determine if they fit the inclusion criteria. Once women fitting the
inclusion criteria agreed to participate in the study, they were given a consent form.
Following their consent, questionnaires were distributed and included a demographics
and income survey, the Pediatric Symptom Checklist, the CES-D Scale and the 18 item
Household Food Security Scale. Members of the research team were present to answer
any questions that participants had regarding the surveys and to distribute/collect
questionnaires. Participants filled out a registration form that entered them into a drawing
for gift certificates to Albertson’s grocery store. Registration forms and questionnaires
were separated from one another therefore maintaining anonymity.
To increase the sample size, we also surveyed mothers of Head Start children
residing in the same communities as those receiving food boxes at the local food bank.
We chose Head Start as a secondary site because Head Start works with low-income
families. The Director of the local program asked Head Start teachers to invite mothers to
participate in the study. Those who volunteered followed the same protocol as the
participants located at the food bank.
Data Analysis Plan
Preliminary Analysis
Prior to analyzing the data, variables were cleaned and coded. Data were then
entered and examined for errors. Prior to testing the study hypotheses, univariate statistics
were run to determine the demographic characteristics of the sample (e.g., frequencies,

39
means, and standard deviations). Using independent t-tests, demographic comparisons
were made between Food Bank and Head Start participants. Also, using cross-
tabulations, the relationships between food security level and receipt of government
assistance was reported. The final preliminary analysis included running Pearson
Product-Moment correlation coefficients to examine relationships between demographic
variables and rurality, food security, maternal depression, and child behaviors. This study
set an apriori level of significance at p < .05.
Hypothesis Testing
Next, to test the study bivariate hypotheses (1-4), correlation coefficients and
Oneway ANOVAs with Tukey HSD post hoc tests were run. To examine the multivariate
hypotheses, two regression analyses were conducted. The first was a multiple linear
regression to examine the ability of rurality and food insecurity to predict maternal
depression (Hypothesis 5). “Survey location” (Food Bank versus Head Start) was
included as a control variable in the model.
The next analysis run was a hierarchical linear regression to examine the best
predictors of child behavior problems (Hypothesis 6). Predictor variables were entered
into blocks. Initial runs included “survey location,” rurality, and total food insecurity
score in the first block; however, to present the best model, only total food insecurity was
included in the final model. Block 2 added maternal depression. The outcome variable
was child behavior problem score. The hierarchical regression analysis was chosen to
examine the relative strength of food insecurity and maternal depression to account for
the variance in child behavior problems. The rule of thumb for sample-size using

40
regression analysis according to Darlington (1990) is that the sample size should equal at
least 10 times the number of regressors. For this study, the inclusion of 2-4 regressors
was well within the limits, given the study sample size of 66 cases.

41
CHAPTER 4
RESULTS
Preliminary Analyses
Demographic Characteristics
Table 1 presents the demographic characteristics of the total sample. This sample
represents all individuals that responded to the survey both at the Gallatin Valley Food
Bank and at the Head Start Program. The mean age of respondents was 35.1 with a range
of 20 to 57 years. The education level of the sample was relatively high with a mean of
12.47 years of education. Almost 24% of the sample had achieved 14 years of education.
Forty-six percent of mothers reported being employed and 15% of the women worked 40
hours a week. Over 55% of the sample’s annual household income was less than $20,000,
which is at or below the 2006 federal poverty level for a family of four.
Given that this study was conducted at two separate locations, we compared the
demographic characteristics by survey location (see Table 2). Using independent samples
t-tests for continuous variables, and Chi-square analyses for discrete variables, there were
only four significant differences between those surveyed at the Food Bank and at the
Head Start program. Individuals surveyed at the Gallatin Valley Food Bank were
significantly older (M = 36.19, SD = 8.47) than Head Start participants (M = 31.47, SD =
5.82), t (65) = 2.02, p < .05. Food Bank participants were less likely to receive
government assistance (38.5%) than Head Start participants (80%), χ²(67) = 8.05, p < .01.
Third, Food Bank participants lived further from a major grocery store (M = 5.18, SD =

42
7.00) than Head Start participants (M = 2.66, SD = 2.59), t (61) = 2.14, p < .05 and lastly,
children at the Food bank were significantly older (M = 9.67, SD 4.07) than Head Start
children (M = 5.29, SD = 2.27), t (58) = 3.84, p<.001. Because there were few
significant differences between the two groups, we conducted most subsequent analyses
with the groups combined. However, “survey location” was included as a control variable
in certain analyses (e.g., multivariate analyses).

43
Table 1. Demographic Characteristics of the Sample (N=67)
Demographic Characteristic M (SD) or N (%) Range Age of the Sample in years 35.13 (8.2) 20-57 years Marital Status Single, living alone w/children, 21 (31.8%) divorced, separated. Married/living with 45 (68.2%) significant other Years of education 12.47 (2.8) Work situation Working for pay/employed 31 (46.3%) Unemployed 11 (16.4%) Stay at home/caregiver 22 (32.8%) Student 2 ( 3.0%) Other 1 ( 1.5%) Hours of work per week 14.78 (19.60) Annual household income $0-$10,000 13 (19.4%) $10,001-$20,000 24 (35.8%) $20,001-$30,000 18 (26.9%) $30,001-$40,000 8 (11.9%) $40,001-$50,000 2 ( 3.0%) Over $50,000 2 ( 3.0%) Children living in household 2.55 (1.47) Child’s age 8.65 (4.15) Receive government assistance: % yes 21 (47%) % no 35 (52.2%) Miles from a major grocery store 4.61 (6.35) 0-35 miles
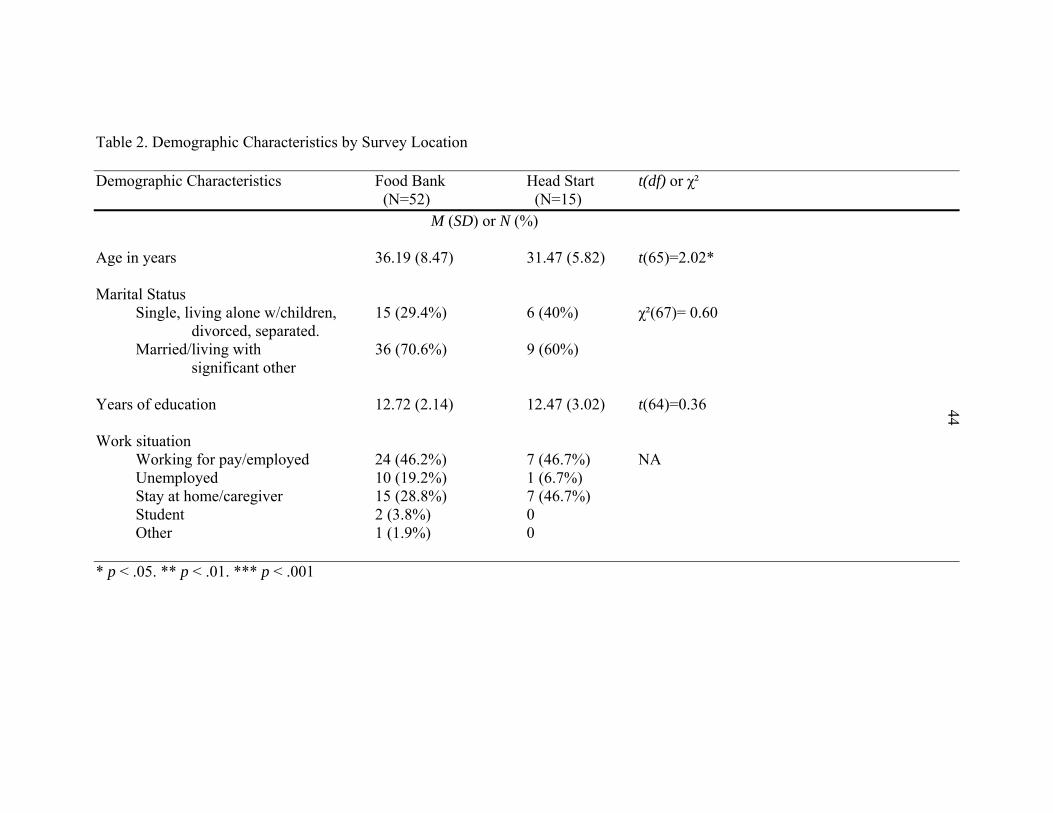
44
Table 2. Demographic Characteristics by Survey Location Demographic Characteristics Food Bank Head Start t(df) or χ² (N=52) (N=15)
M (SD) or N (%) Age in years 36.19 (8.47) 31.47 (5.82) t(65)=2.02* Marital Status Single, living alone w/children, 15 (29.4%) 6 (40%) χ²(67)= 0.60 divorced, separated. Married/living with 36 (70.6%) 9 (60%)
significant other Years of education 12.72 (2.14) 12.47 (3.02) t(64)=0.36 44 Work situation Working for pay/employed 24 (46.2%) 7 (46.7%) NA Unemployed 10 (19.2%) 1 (6.7%) Stay at home/caregiver 15 (28.8%) 7 (46.7%) Student 2 (3.8%) 0 Other 1 (1.9%) 0 * p < .05. ** p < .01. *** p < .001

45
Table 2.Continued Demographic Characteristics Food Bank Head Start t(df) or χ² (N=52) (N=15)
M (SD) or N (%) Hours of work a week 14.86 (20.32) 14.47 (17.48) t(65)=0.07 Annual household income $0-$10,000 9 (17.3%) 4 (26.7%) χ²(67)=0.25 $10,001-$20,000 19 (36.5%) 5 (33.3%) $20,001-$30,000 14 (26.9%) 4 (26.7%) $30,001-$40,000 7 (13.5%) 1 (6.7%) $40,001-$50,000 2 (3.8%) 0 (0%) $50,001-$60,000 1 (1.9%) 0 (0%) Children living in household 2.57 (1.38) 2.47 (1.64) t(64)=0.24 Child’s age 9.67 (4.07) 5.29 (2.27) t(58)=3.85*** Receive government assistance: % yes 20 (38.5%) 12 (80%) χ²(67)= 8.05** % no 32 (61.5%) 3 (20%) Miles from a major grocery store 5.18 (7.0) 2.66 (2.59) t(61)=2.14*
45
* p < .05. ** p < .01. *** p < .001.

46
Means, Standard Deviations, and Internal Consistency of Food Security, Maternal Depression and Child Behavior Scores Table 3 depicts the means and standard deviations for study variables of interest,
as well as the internal consistency reliability results (using Cronbach’s alpha). The
acceptable level for Cronbach’s alpha is .70 or above (Berg, 1995). As Table 3 shows, all
measures were found to have acceptable internal consistency with alpha scores ranging
from .88 to .92.
Table 3. Food Security, Maternal Depression, and Child Behavior Problems: Means,
Standard Deviations and Reliability Alphas
Study Variables (N=67) M (SD) Cronbach’s Alpha Total Food Security Score 3.52 (2.25) .877 Maternal Depression Total CESD Score 17.17 (11.16) .903 Child Behavior Problems PSC Score 18.31 (10.82) .918
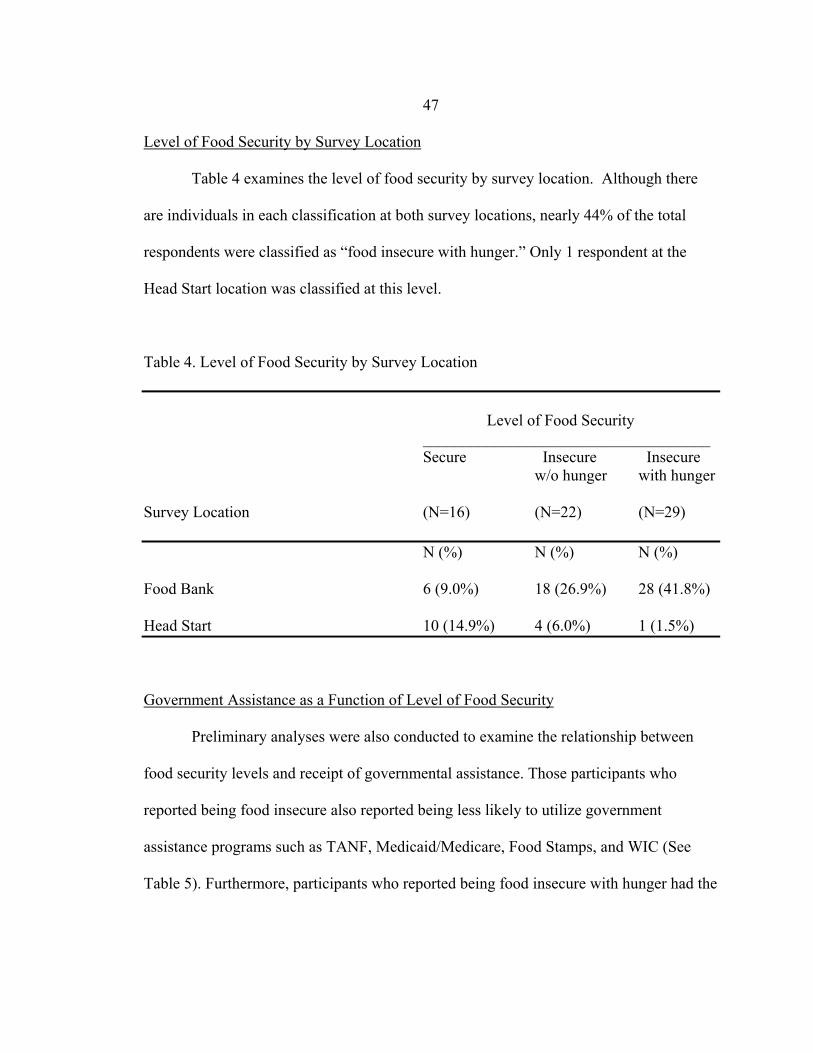
47
Level of Food Security by Survey Location
Table 4 examines the level of food security by survey location. Although there
are individuals in each classification at both survey locations, nearly 44% of the total
respondents were classified as “food insecure with hunger.” Only 1 respondent at the
Head Start location was classified at this level.
Table 4. Level of Food Security by Survey Location
Level of Food Security ____________________________________ Secure Insecure Insecure w/o hunger with hunger Survey Location (N=16) (N=22) (N=29) N (%) N (%) N (%) Food Bank 6 (9.0%) 18 (26.9%) 28 (41.8%) Head Start 10 (14.9%) 4 (6.0%) 1 (1.5%)
Government Assistance as a Function of Level of Food Security
Preliminary analyses were also conducted to examine the relationship between
food security levels and receipt of governmental assistance. Those participants who
reported being food insecure also reported being less likely to utilize government
assistance programs such as TANF, Medicaid/Medicare, Food Stamps, and WIC (See
Table 5). Furthermore, participants who reported being food insecure with hunger had the

48
lowest rates of government assistance with over 65% (n = 19) of those individuals
reporting that they did not receiving any government assistance.
Table 5. Receipt of Government Assistance as a Function of Food Security Level
Level of Food Security Secure Insecure Insecure w/o hunger with hunger Government Assistance Programs (N=16) (N=22) (N=29) N (%) N (%) N (%) Public Assistance (%Yes) 8 (50%) 14 (63.6%) 10 (34.5%) TANF (%Yes) 0 (0%) 1 (4.5%) 0 (0%) Medicaid/Medicare (%Yes) 6 (37.5%) 10 (45.5%) 7 (24.1%) Food Stamps (%Yes) 3 (18.8%) 9 (40.9%) 6 (20.7%) WIC (%Yes) 6 (37.5%) 3 (13.6%) 3 (10.3%)
Correlations between Sociodemographic and Study Variables
Pearson correlation coefficients depicting the strength and direction of the
relationships between sociodemographic characteristics and study variables are presented
in Table 6. Few demographic variables were significantly related to each other or to
maternal depression, child behavior, food security, or rurality. However, maternal age
was significantly related to their child’s age (r =.43, p < .01) ,level of education (r = .29,
p < .05) and receipt of government assistance (r = -.28, p < .05). As mothers’ aged, the
49
age of their children increased, their level of education increased and government
assistance decreased. Relatedly, education level and receipt of government assistance was
also significantly related to level of income. As mothers’ education levels increased,
mothers’ annual household income also increased (r = .33, p < .01). As mothers’
household income increased, their use of government assistance programs decreased (r =
-.32, p < .01).
Age of the child was significantly related to several variables including mothers
age (r = .43, p < .01), number of children living in the household (r = .33, p < .05),
receiving government assistance (r = -.35, p < .01), and total food security score (r = .44,
p < .01). Interestingly, as the age of the child increased, the familial food security status
decreased. Number of children in the household was significantly related to two
variables: the number of hours mothers’ reported working (r = -.28, p < .05) and their
annual household income (r = .32, p < .01). As the number of children in the household
increased, mothers’ appeared to work fewer hours, however, their income increased.
Included among the demographic variables is “miles from a grocery store,” our proxy
variable for rurality. Interestingly, there were no significant correlations among rurality
and demographic variables.
Next, sociodemographic variables were examined in relation to food security,
maternal depression, and child behaviors. Interestingly, no sociodemographic variables
were significantly correlated with food security, maternal depression, or child behavior
scores (see Table 6).

50
Bivariate Analyses: Hypothesis Testing
In order to examine the bivariate hypotheses listed below, Pearson Product
Moment correlation analyses and Oneway ANOVAs with Tukey HSD post hoc tests
were run. Results of each hypothesis is described in turn.
Hypothesis 1A and 1B: Food insecurity and maternal depression
Hypothesis 1A stated that food insecurity would be related to maternal
depression. Mothers who reported higher levels of food insecurity would experience
more depressive symptoms than their more food secure counterparts. As can be seen in
Table 5, food security was significantly positively correlated with maternal depression (r
= .38, p < .01), such that greater food insecurity was related to more depressive
symptoms. Thus Hypothesis 1A was supported by the data.
Hypothesis 1B stated that mothers included in the “food insecure without hunger”
and “food insecure with hunger” groups would display higher levels of maternal
depression than their food secure counterparts. Based on results of the Oneway ANOVAs
and Tukey HSD post hoc tests (see Table 7), maternal depression scores were
significantly different as a function of level of food security, F (2, 64) = 8.21, p < .001.
However, contrary to expectations, both mothers’ who reported being food secure (p <
.01) and mothers’ who reported experiencing food insecurity without hunger (p < .01)
reported significantly lower levels of depression than mothers who experienced food

51
insecurity with hunger in the past year. Thus, hypothesis 1B was not supported by the
data.
Hypothesis 2: Maternal depression and child behavior
Hypothesis 2 stated that, as compared to less depressed mothers, mothers who
experienced more depressive symptoms would also report that their child exhibited more
behavior problems. Based on the correlation analyses (as presented in Table 6), maternal
depression was significantly positively related to child behavior problems (r = .32, p <
.01), such that more depressed mothers reported more child behavior problems.
Hypothesis 2 was supported by the data.
Hypothesis 3A and 3B: Food insecurity and child behavior
Hypothesis 3A stated that food insecurity would be related to child behavior such
that families experiencing higher levels of food insecurity would report more child
behavior problems than families experiencing food security. Hypothesis 3A was assessed
by examining the correlation matrix presented in Table 6. Results revealed that the more
food insecure a family, the more child behavior problems were reported by mothers (r =
.25, p < .05). Thus, hypothesis 3A was supported by the data.
Hypothesis 3B stated that mothers who reported experiencing food insecurity
without or with hunger would report more behavior problems exhibited by their children
than their food secure counterparts. Based on the Oneway ANOVAs and Tukey HSD
post hoc tests (see Table 7), child behavior problems significantly differed as a function
of level of food security, F (2, 64) = 3.30, p < .05. However, the post hoc tests revealed
only a trend in the data with respect to where the differences existed. In this case,
52
mothers’ who reported experiencing food insecurity without hunger reported fewer child
behavior problems than mothers who experienced food insecurity with hunger in the past
year (p < .10). As with hypothesis 1B, this hypothesis was not supported by the data.
Hypothesis 4: Food insecurity and rurality
As stated by Hypothesis 4, it was expected that individuals residing in the most
remote areas of the county would report higher levels of food insecurity than those in
more urbanized areas. Based on the correlation results (Table 6), levels of food insecurity
was not related to rurality as measured by miles from the nearest major grocery store.
Contrary to expectations, this hypothesis was not supported.

53
Table 6. Correlation Coefficients of Study Variables
1 2 3 4 5 6 7 8 9 10 11
1. Mother’s Age -- .43** 29* .07 .05 .12 -.28* .12 .03 -.01 .20 2. Age of child -- -- .21 -.20 .19 .33* -.35** .02 .44** .14 .15
3. Education level -- -- -- -.01 .33** .05 -.23† -.08 -.02 -.23† .12
4. Hours of work per week -- -- -- -- -.05 -.28* -.18 -.10 .05 -.03 -.05
5. Annual income -- -- -- -- -- .32** -.32** .16 -.07 -.11 -.12
6. Number of children -- -- -- -- -- -- .17 -.08 .11 .16 .02
7. Government Assistance -- -- -- -- -- -- -- -.16 -.04 -.13 -.17
53
8. Rurality: Miles from grocery store -- -- -- -- -- -- -- -- -.11 -.05 -.07
9. Total Food Insecurity -- -- -- -- -- -- -- -- -- .38** .25*
10. Total CESD -- -- -- -- -- -- -- -- -- -- .32** 11. Total PSC -- -- -- -- -- -- -- -- -- -- --
† p <.10. * p < .05. ** p < .01.
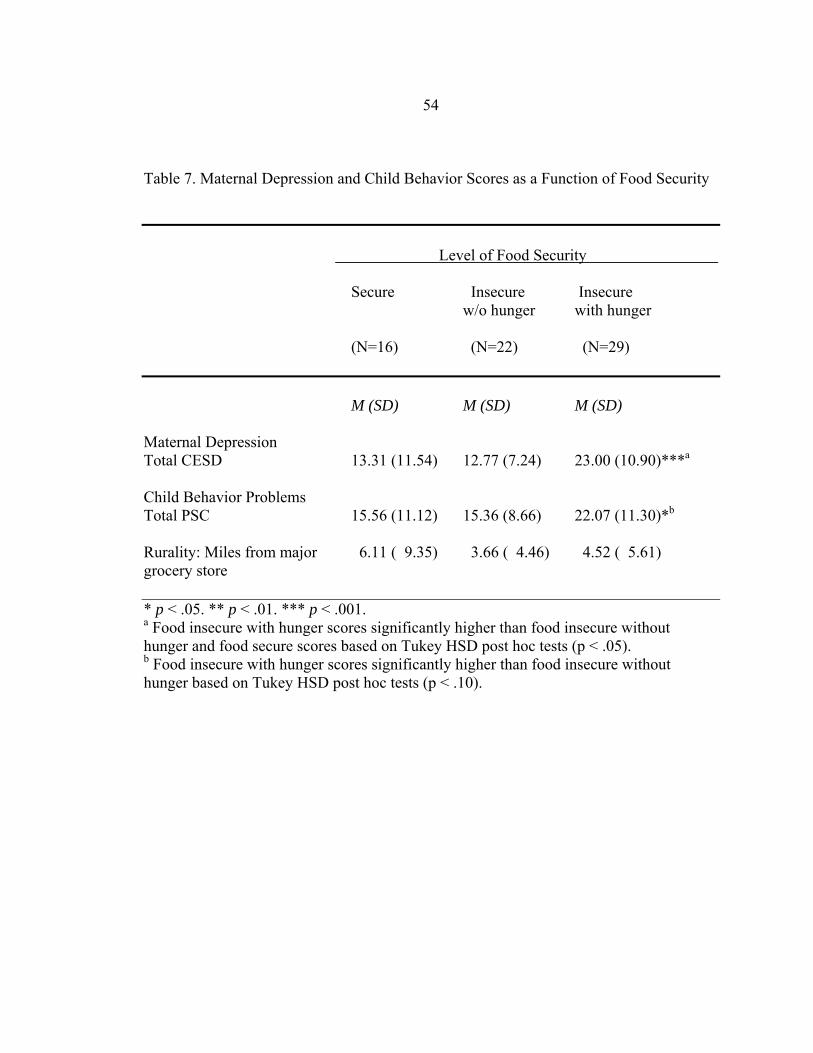
54
Table 7. Maternal Depression and Child Behavior Scores as a Function of Food Security
Level of Food Security Secure Insecure Insecure w/o hunger with hunger (N=16) (N=22) (N=29) M (SD) M (SD) M (SD) Maternal Depression Total CESD 13.31 (11.54) 12.77 (7.24) 23.00 (10.90)***a
Child Behavior Problems Total PSC 15.56 (11.12) 15.36 (8.66) 22.07 (11.30)*b
Rurality: Miles from major 6.11 ( 9.35) 3.66 ( 4.46) 4.52 ( 5.61) grocery store * p < .05. ** p < .01. *** p < .001. a Food insecure with hunger scores significantly higher than food insecure without hunger and food secure scores based on Tukey HSD post hoc tests (p < .05). b Food insecure with hunger scores significantly higher than food insecure without hunger based on Tukey HSD post hoc tests (p < .10).
55
Multivariate Analyses: Hypothesis Testing
To examine the relationships between multiple variables, a series of regression
analyses were run. The first regression examined the ability of rurality and food security
scores to predict the variance in maternal depression scores. “Survey location” (i.e., Food
Bank versus Head Start) was included as a control variable in this analysis. Initial runs
also included sociodemographic variables (e.g., mothers’ age, annual household income,
government assistance); however, because none of these variables made a significant
contribution to the model, the model was “cleaned” to present the “best” model.
Following are the results of the first regression analysis to test Hypothesis 5.
Hypothesis 5: Rurality, food insecurity, and maternal depression
It was hypothesized that both degree of rurality and level of food insecurity would
predict maternal depression such that more rural dwellers and more food insecure
mothers would report more depressive symptoms than their less rural, less food insecure
counterparts. As shown in Table 8, the regression ANOVA was significant, F (3,63) =
3.91, p < .05. However, only the total food security score made a significant contribution
to the model. As food insecurity increased, mothers’ symptoms of depression also
increased (p < .01). Contrary to expectations, rurality (as measured by miles from a major
grocery store) was not a significant predictor of maternal depression scores.
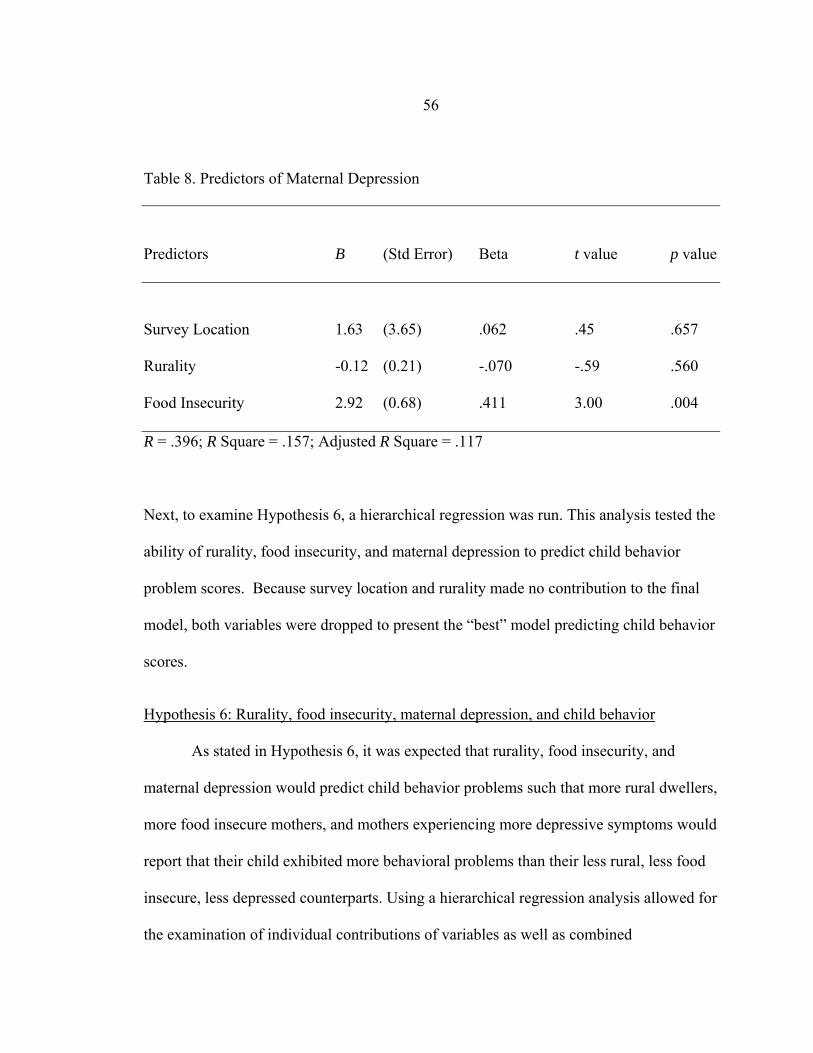
56
Table 8. Predictors of Maternal Depression
Predictors B (Std Error) Beta t value p value
Survey Location 1.63 (3.65) .062 .45 .657
Rurality -0.12 (0.21) -.070 -.59 .560
Food Insecurity 2.92 (0.68) .411 3.00 .004
R = .396; R Square = .157; Adjusted R Square = .117
Next, to examine Hypothesis 6, a hierarchical regression was run. This analysis tested the
ability of rurality, food insecurity, and maternal depression to predict child behavior
problem scores. Because survey location and rurality made no contribution to the final
model, both variables were dropped to present the “best” model predicting child behavior
scores.
Hypothesis 6: Rurality, food insecurity, maternal depression, and child behavior
As stated in Hypothesis 6, it was expected that rurality, food insecurity, and
maternal depression would predict child behavior problems such that more rural dwellers,
more food insecure mothers, and mothers experiencing more depressive symptoms would
report that their child exhibited more behavioral problems than their less rural, less food
insecure, less depressed counterparts. Using a hierarchical regression analysis allowed for
the examination of individual contributions of variables as well as combined

57
contributions of variables to the prediction of child behavior. Contrary to expectations,
rurality did not make a significant contribution to the model (data not presented in table
form); thus, Hypothesis 6 was only partially supported.
The final hierarchical regression model included only food insecurity in block 1
and maternal depression in block 2. The final regression ANOVAs were significant for
block 1 (F (1, 65) = 4.38, p < .05) and block 2 (F (2, 64) = 4.34, p < .05). When food
insecurity was added in block 1 of the final model, it was significantly related to child
behavior problems, such that as a family’s food insecurity increased, child behavior
problems increased (p < .05). The relationship between food security and child behavior
problems accounted for 6% of the model variance. However, when maternal depression
was added in block 2, total food insecurity no longer made a significant contribution to
the model. Maternal depression was the stronger and significant predictor, suggesting that
more depressed mothers reported more behavior problems exhibited by their children as
compared to the behavior problems of less depressed mothers (p < .05). The final model
accounted for 12% of the variance in child behavior problem scores.
Summary of Results
Table 10 provides a summary of the study findings by hypotheses. In the
discussion section (Chapter 5), each finding is discussed in turn, followed by implications
of study findings for researchers, practitioners, and policymakers.

58
Table 9. Hierarchical Regression Analysis of Food Insecurity and Maternal Depression as Predictors of Child Behavior Predictor Variables Block 1 Block 2 B SE Beta B SE Beta Food Insecurity 1.21 .579 .251* .736 .612 .153 Maternal Depression .251 .124 .257* Model R2 .063 .120 Model F 4.38* 4.34* * p < .05. ** p < .01 ***p < .001.
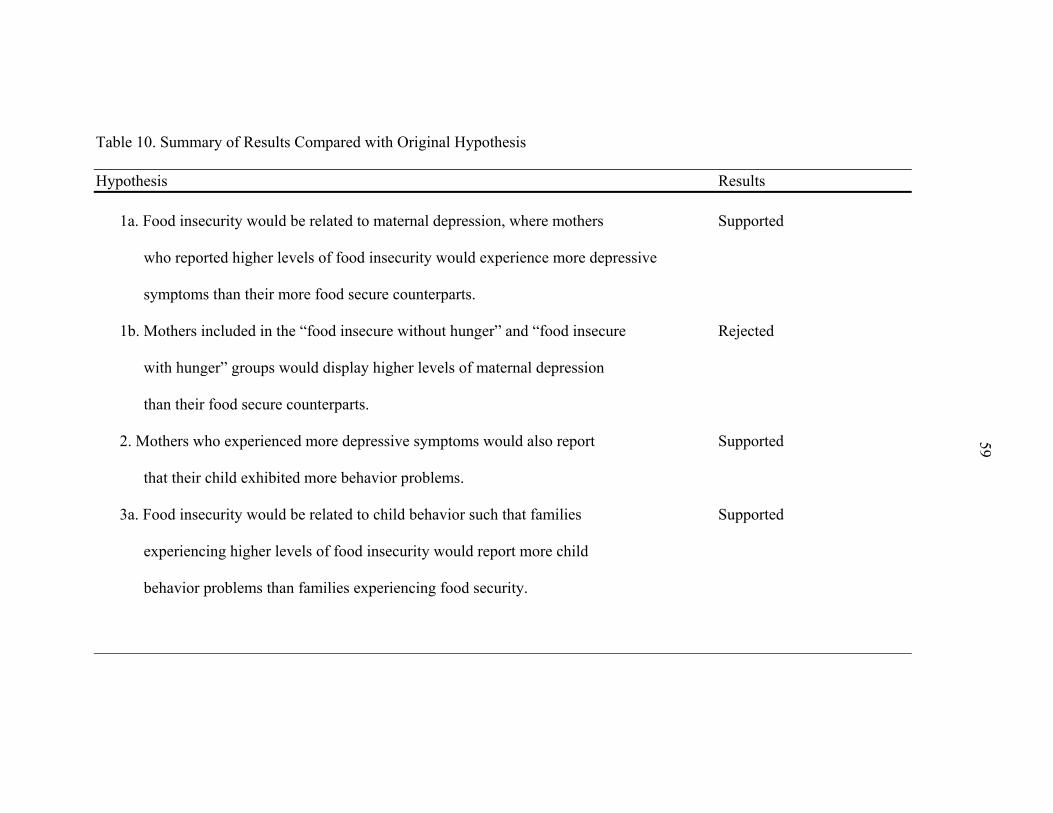
59
Table 10. Summary of Results Compared with Original Hypothesis Hypothesis Results
1a. Food insecurity would be related to maternal depression, where mothers Supported
who reported higher levels of food insecurity would experience more depressive
symptoms than their more food secure counterparts.
1b. Mothers included in the “food insecure without hunger” and “food insecure Rejected
with hunger” groups would display higher levels of maternal depression
than their food secure counterparts.
2. Mothers who experienced more depressive symptoms would also report Supported 59
that their child exhibited more behavior problems.
3a. Food insecurity would be related to child behavior such that families Supported
experiencing higher levels of food insecurity would report more child
behavior problems than families experiencing food security.
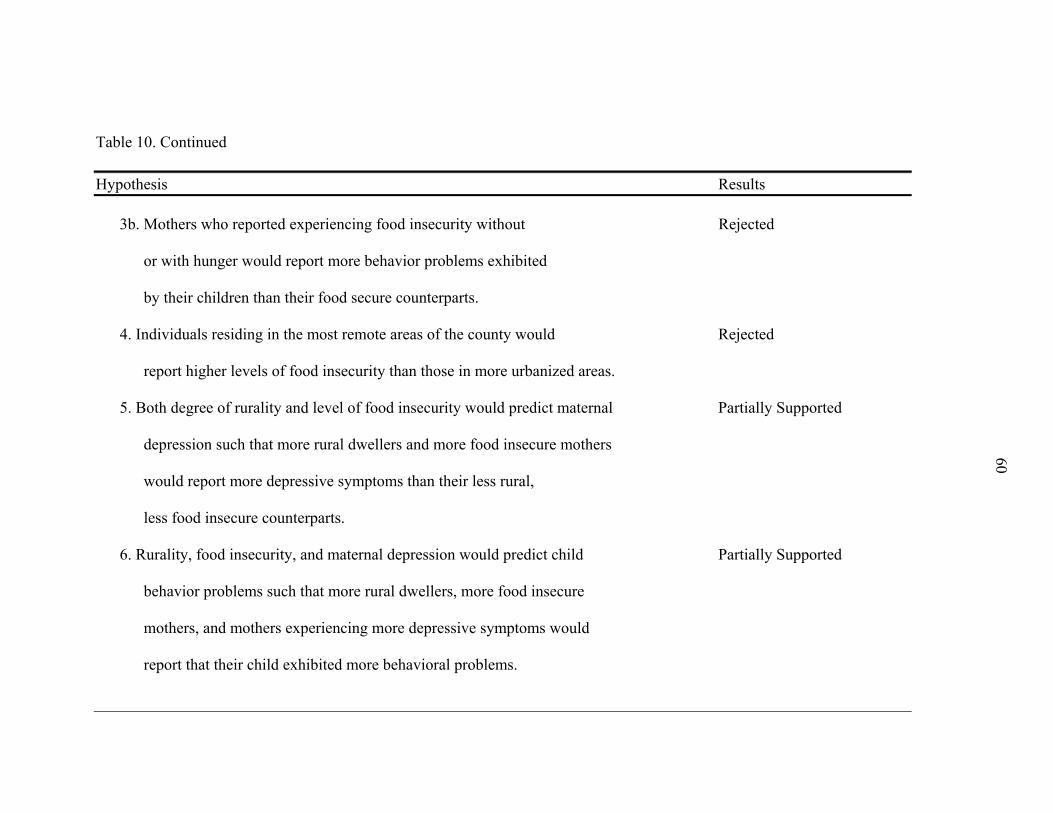
60
60
Table 10. Continued Hypothesis Results
3b. Mothers who reported experiencing food insecurity without Rejected
or with hunger would report more behavior problems exhibited
by their children than their food secure counterparts.
4. Individuals residing in the most remote areas of the county would Rejected
report higher levels of food insecurity than those in more urbanized areas.
5. Both degree of rurality and level of food insecurity would predict maternal Partially Supported
depression such that more rural dwellers and more food insecure mothers
would report more depressive symptoms than their less rural,
less food insecure counterparts.
6. Rurality, food insecurity, and maternal depression would predict child Partially Supported
behavior problems such that more rural dwellers, more food insecure
mothers, and mothers experiencing more depressive symptoms would
report that their child exhibited more behavioral problems.
61
CHAPTER 5
DISCUSSION
The purpose of this study was to examine relationships between food insecurity,
maternal depression, and child behavior problems among low-income families residing in
rural locales in the state of Montana. Although extent research has examined aspects of
these relationships, this study was unique in that it attempted to examine maternal
depression and child behavior problems as a function of level of food insecurity and
rurality. Consistent with extant research, this study found that food insecurity was related
to mothers’ mental health, that maternal depression was related to child outcomes, and
that food insecurity was related to child behavior problems. Contrary to expectations,
however, this study did not find support for a relationship between food security and
rurality. Following is a discussion of these study findings.
Food Insecurity and Maternal Depression
As hypothesized, this study found a significant relationship between food
insecurity and maternal depression. Specifically, mothers who reported higher levels of
food insecurity experienced more depressive symptoms than their more food secure
counterparts. This is consistent with past research including the findings of Siefert et al.
(2004) and Casey et al. (2004). Siefert and colleagues found an association between
household food insufficiency and poor physical and mental health outcomes among
current or recent welfare recipients in Michigan and also found that these negative
relationships worsened over time. Unlike Siefert et al.’s findings, this study did not
62
address the duration of food insecurity; however, this study did examine maternal
depression as a function of food insecurity levels.
It is important to note that our findings revealed a significant difference in
maternal depression between those mothers who experienced food insecurity with hunger
and those who experienced food insecurity without hunger. Additionally, there was a
significant difference in maternal depression scores among those women who were
classified as food secure and those who experienced food insecurity with hunger.
Interestingly, there was not a significant difference between mothers classified as food
secure and food insecure without hunger as hypothesized. It appears that only the
presence of hunger, and not being food insecure alone, correlated to higher depression
scores. This study found that mothers experiencing food insecurity with hunger had a
mean depression score of 23. This score is well above the depression cut off point of 16,
which suggests cause for clinical concern. This finding supports and expands upon the
findings of Siefert et al. (2004), who suggested that preventing food insufficiency might
lower the risk of major depression in this particular population. It seems reasonable to
conclude that the prevention of hunger and the improvement of food insecurity status
from “food insecure with hunger” to “food insecure without hunger” may help to
ameliorate depression among low-income women with children.
Maternal Depression and Child Behavior
The results of this study reconfirmed a well established link between maternal
depression and child behavior problems. Study results suggest that as maternal depression
increased so did child behavior problems. This is an important finding because studies
63
show an association between a mother’s depression and adverse outcomes for a child.
These adverse outcomes include low birth weight, behavior problems, learning
difficulties, poor growth, and higher incidences of accidents, emotional illness and
somatic complaints (Zuckerman & Bearslee, 1987). Furthermore, McLeod and
Nonnemaker (2000) have established that higher rates of parental stress and maternal
depression were associated with harsher, inconsistent, and less responsive parenting,
which can further hinder positive child development. It is important to note that mother-
child relationships are bidirectional in nature—in other words, it is possible that child
behavior problems resulted in maternal depression, perhaps because mothers grew
frustrated by or felt inadequate to sufficiently deal with their child’s problematic
behaviors. Determining causality between maternal depression and child behavior
problems requires longitudinal studies.
Food Insecurity and Child Behavior
The results of this study showed a significant relationship between child behavior
problems and food insecurity status indicating the more food insecure the family, the
more child behavior problems reported. The results were consistent with past research
indicating that children experiencing food insufficiency were more likely to have
psychosocial difficulties than their food sufficient counterparts (Alaimo et al., 2001).
However, when we examined child behavior problems as a function of the level of a
family’s food insecurity, findings were not consistent with expectations. While there was
a significant child behavior difference by food security levels, the post hoc analyses only
revealed a trend in the data, suggesting that the child behavior differences were between

64
families experiencing food insecurity with hunger and those experiencing food insecurity
without hunger. Mothers who were food insecure with hunger reported more child
behavior problems than their insecure without hunger counterparts. Such findings were
consistent with findings regarding maternal depression and suggest the need to examine
the experience of hunger (rather than food insecurity per se) as salient in understanding
familial coping and child behavioral outcomes. However, it is important to note that,
although the post hoc analyses did not show a significant difference between child
behavior problems among the “food secure” and “food insecure with hunger” groups, the
mean score of the “food secure” group was comparable to the “food insecure without
hunger” group (i.e., 15.6 and 15.4, respectively). It is possible that our sample size was
too small to detect significant differences. Future research with larger samples will likely
yield enough statistical power to detect significant differences between these groups.
Food Insecurity and Rurality
Contrary to expectations, this study did not find support for a relationship
between food security status and rurality. Previous research has found that families living
in highly rural locales are more at risk for food insecurity than those living in the suburbs,
metropolitan areas, and non-central cities (Morris et al., 1992). The lack of a significant
relationship between food security and rurality may be due to several factors. First, in this
study, a proxy measure was used to assess level of rurality. Mothers were asked to report
how many miles they lived from the nearest major grocery store. And while there was
variance in the distances reported (e.g., from less than a mile to 35 miles away), the
majority (79%) lived five miles or less from a grocery store. It is likely that this measure
65
did not significantly relate to food security levels (or maternal depression or child
behavior problems) because it did not sufficiently tap into the construct of rurality. As
mentioned previously, reliable measurements of rurality are lacking. Future research is
needed to continue to operationalize the term and ensure that we are actually measuring
the rural experience.
Second, Rank and Hirsch (1993) have shown that qualified families in rural areas
are much less likely to participate in food assistance programs such as the Food Stamp
program as compared to their more urban counterparts. Rank and Hirsch also concluded
that rural households had adverse attitudes toward welfare. It is possible that highly rural
families in our sampling area, who are less likely to participate in food assistance
programs and have negative attitudes towards government assistance, are also less likely
to utilize emergency assistance provided by the local Food Bank. Thus, it is possible that
rural residents may be underrepresented at the Food Bank and at the Head Start program.
It is also possible that, in our two week data collection window at the Food Bank, we
missed highly rural families. Future researchers should ensure that their sampling
strategies yield a representative sampling of the range of rural dwellers residing in their
targeted communities.
Predictors of Maternal Depression and Child Behavior
In addition to examining bivariate relationships between food security, maternal
depression, and child behavior problems among low-income families residing in rural
locales, this study also examined predictors of maternal depression and child behavior
problems. Consistent with the findings above, the regression analysis examining
66
predictors of maternal depression revealed that rurality as measured by miles from a
major grocery store failed to account for the variance in maternal depression. The best
and only significant predictor of maternal depression in this study was food security
status. As discussed earlier, those mothers who experienced more food insecurity also
reported experiencing greater numbers of depressive symptoms. Such findings suggest
that one’s ability to access food of high quality and adequate quantity is critical to one’s
mental health and coping abilities. Mothers who are food insecure—and especially
mothers who are food insecure and hungry—must struggle to meet their own basic needs
as well as the nutritional needs of their children. As Maslow’s (1970) Hierarchy of Needs
suggests, when one’s basic needs are not sufficiently met, coping and functioning will be
compromised.
This study also examined the best predictors of child behavior problems. While
food security status was a significant predictor of child behavior problems on its own,
when we added maternal depression in the analyses, food security status failed to account
for the variance in child behavior outcomes. It is possible that food security status and
maternal depression accounted for overlapping variance in child outcomes. In other
words, there may have been problems with multicolinearity. It is also possible that
maternal depression is the better predictor of child behavior. Perhaps the pathway is
experienced as follows: mothers who are food insecure and hungry do not have adequate
coping capacity to deal with their feelings of sadness and hopelessness; depressed
mothers then may be unable to positively cope with or meet the developmental needs of
their children, which may result in child behavior problems. Clearly, this cross-sectional

67
study with a limited sample size cannot determine whether such pathways are accurate.
Future research is needed to continue to flush out these relationships and how they
manifest in the lived experiences of low-income families. However, study findings do
hold implications for future research, practice, and policymaking.
Study Limitations and Future Research
Although this study sheds light on relationships between food security, maternal
depression, and child behavior outcomes among low-income families residing in rural
locales, there are a number of limitations that should be addressed by future research
efforts. For example, this study was limited by its small convenience sample. Although
we anticipated a larger sample from the Gallatin Valley Food Bank, after two weeks of
collecting data we were only able to obtain 52 responses (about half our anticipated
sample size). Because we were limited by time constraints to execute this study, we
extended our survey location to include mothers of children participating in Head Start.
Our rationale was that these families were also low-income and likely experienced
similar hardships associated with limited resources. Unfortunately, because we did not
establish adequate ties to the Head Start community, our participation rate was fairly low.
While Food Bank and Head Start mothers did not vary significantly in terms of their
demographic profile, Head Start mothers were less food insecure than Food Bank
participants.
The sampling limitations of this study preclude us from generalizing our findings
to larger, more diverse groups of families in Montana. Moreover, because the sample was
predominantly White, future research examining food security issues is needed among
68
more diverse racial and ethnic groups (as well as more diverse rural dwellers). In
Montana, Native American families comprise approximately 6% of the total population
in the state. Native American families often live on reservations that vary in their degree
of rurality and proximity to larger, more urbanized communities. Examining relationships
between food security status, maternal depression, and child behavior among these more
diverse groups hold implications for the ways in which we intervene in order to
ameliorate food insecurity and hunger. Thus, to obtain a more accurate picture of food
insecurity in rural Montana, a representative random sampling strategy should be
employed.
Another study limitation relates to our chosen methodology and reliance on self-
report responses from surveys. Although anonymous surveys are often the chosen
methodology when asking individuals sensitive and possibly embarrassing questions
about their personal and family lives, there is no way to know if participants were honest
with their responses. The questions about child behavior were answered by the parent and
were their opinion of their child’s behavior. Future research might consider conducting
in-depth interviews with families and also observing child behaviors and parent-child
interactions. These methods may shed additional light on familial processes and
adaptations to food insecurity.
Another limitation of this study is that we were unable to establish a response
rate. It appeared that most participants who met the inclusion criteria at the Food Bank
agreed to participate; however, we know of one participant who failed to complete the
survey and we dropped two additional surveys due to missing data. We do not know how
69
many surveys were dispersed at the Head Start location, therefore, we can not determine
the overall response rate for this study. It will be important for future research efforts to
more carefully sample participants in order to better understand which methodologies are
best suited for our population of interest. Pilot studies may be useful in this process.
Unfortunately, because of time constraints and limited resources, this study could not
address these methodological and sampling concerns adequately.
And finally, the analyses run for this study were of a correlational nature.
Therefore, the data cannot explain causality of relationships. For example, based on this
study’s findings, we cannot conclude definitively that maternal depression caused poorer
behavioral outcomes in children. To determine causality and to better understand the
complex relationships associated with food security status, future longitudinal research
efforts are needed. Other variables to be included in future research might include the
length of time families received assistance at food banks, the length of time families have
experienced food insecurity with and without hunger, changes in child behavior status
over time, and changes in maternal depression over time. And clearly, if future
researchers want to better understand the influence of rurality on food security status and
family functioning, more complex and reliable measures of rurality are needed.
Implications for Practitioners and Policymakers
Findings from this study have many implications for researchers, practitioners,
and policymakers. It is apparent from the findings of this study, as well as findings from
the extant literature, that food security status is related to maternal depression and child
behavior outcomes. These findings should be understood in terms of Maslow’s (1970)

70
Hierarchy of Needs. Before emotional needs can be addressed, basic physiological needs
must be met. Thus practitioners and policymakers alike are challenged to ameliorate food
insecurity among families and address hunger in Montana and across the nation if they
wish to improve familial coping and child well-being, especially among low-income
families.
In addition, practitioners and policymakers are challenged to better understand
why—in a nation as wealthy as ours—so many families are qualified to receive
government assistance. In other words, why are there so many low-income families in the
US? In our study, 55% of the participants met the 2006 federal poverty level for a family
of four. Eighty-two percent of the study participant’s annual income was $30,000 or less.
Additionally, only 16.4% of the sample reported being unemployed. This suggests that
those that work need access to better paying jobs and those who are unemployed should
be provided with assistance in finding gainful employment that pays a living wage.
Scholarships, grants and incentives should be provided to low income individuals to
pursue a higher education or technical degree in order to obtain a well paying job. Low
cost child care should be provided to families that want to work. If practices and policies
supported the upward mobility of families, perhaps fewer families would qualify for and
need food assistance and other government-supported services.
In conjunction, practitioners and policymakers should work together to better
understand why low-income, Food Stamp eligible families are falling through the cracks
and not accessing food assistance programs. Why is there such a high percentage of food
insecure families who are not utilizing government assistance? Looking back at our data,
71
over one-third of families were not participating in the Food Stamp program, yet reported
experiencing food insecurity. Government programs must be more accessible to qualified
individuals and policies should be written to ensure that the process of applying for
assistance is streamlined and user friendly. Moreover, practitioners should consider
reaching out to low-income and rural families to attempt to decrease the stigma
associated with receiving food assistance (or government assistance more broadly). As
the economies of rural communities struggle in the global marketplace, it is likely that
rural families will face food insecurity issues at a growing rate. Information should be
made readily available to rural and non-rural families alike regarding Federal food and
income assistance programs, including WIC, TANF, Food Stamps, and the National
School Lunch Program. All income eligible children should be participating in the
National School Lunch program (as well as Breakfast and Summer Lunch Programs). If
eligible children are able to have one or more free, substantial meals a day, perhaps
family resources could be redistributed and food insecurity reduced. Moreover, these
food assistance programs should be examined to ensure that food quantity, quality, and
suitability, as well as the psychological and social aspects of food programs, are meeting
the needs of the families they are intending to serve (Splett, 1994).
Before we can address any other human needs, we must ensure that individuals
and families are not hungry. Once food security is established, mental health
professionals may be better able to provide counseling and psychological resources
pertaining to depression and child behavior problems. However, if the root of these
problems and family challenges is not addressed, individuals may be less likely to

72
address their mental health needs and improve their individual and family functioning.
Teachers, mental health workers, and public health care professionals in general should
be educated about the increasing problem of food insecurity and the potential negative
consequences of food insecurity for families. By better understanding the challenges
faced by families—and especially low-income families—practitioners and policymakers
will be better able to support the needs of families and the larger communities in which
they live.

73
REFERENCES
Alaimo, K. (2005). Food insecurity in the United States. Topics in Clinical Nutrition, 20, 281-298.
Alaimo, K., Olson, C. M., & Frongillo, E. A. (2001). Food insufficiency and American
school- aged children’s cognitive, academic, and psychosocial development. Pediatrics, 108, 44-53.
Andrews, M., Nord, M., Bickel, G., & Carlson, S. (2000). Household food security in the
United States, 1999. Washington, DC: Economic Research Service, U.S. Department of Agriculture.
Annie E. Casey Foundation. (2005). The 2005 Montana Kids Count Databook. Retrieved
May 15, 2006 from http://www.kidscount.org. Boyle, M. A. (2003). Community Nutrition in Action: An Entrepreneurial Approach.
Belmont, CA: Thomson-Wadsworth. Brown, G. W., & Moran, P. M.(1997). Single mothers, poverty and depression.
Psychological Medicine, 27, 21-33. Casey, P., Goolsby, S., Berkowitz, C., Frank, D., Cook, J., Cutts, D., et al. (2004).
Maternal depression, changing public assistance, food security, and child health status. Pediatrics, 113, 298-304.
Campbell, C.C. (1991). Food insecurity a nutritional outcome or a predictor variable?
Journal of Nutrition, 121, 408-415. Culbertson, F. M.(1997). Depression and gender: An international review. American
Psychologist, (National Medical Expenditure Survey Research Findings 11). Rockville, MD: Public Health Service (ACPHR Pub. No. 91-0042), 52, 25-31.
Darlington, R. B. (1990). Regression and linear models. McGraw-Hill: New York. Dohrenwend, B.P., I. L. Levav, P. E. Shrout, S. Schwartz, G. Naveh, B. G. Link, A. E.
Skodol, & Stueve, A. (1992). Social Status and Psychiatric Disorders: The Causation-Selection Issue. Science 255: 946–952.
Dunifon, R., & Kowaleski-Jones, L. (2003). The influence of participation in the national
school lunch program and food insecurity on child well-being. Social Sciences Review, 77, 72-92.
74
Fendrich, M., Warner, V., & Weissman, M. M. (1990). Family risk factors, parental depression, and psychopathology in offspring. Developmental Psychology, 26, 40-50.
Gallatin Valley Food Bank. (2005). 2005 Annual Report. Retrieved January 5, 2007,
from http://www.gallatinvalleyfoodbank.org/aboutUsAwareness.cfm Gecas, V., & Schwalbe, M. L. (1983). Beyond the looking-glass self: Social structure and
efficacy-based self-esteem. Social Psychology Quarterly, 46, 77-88. Habicht, J-P., Pelto, G., Frongillo, E., & Rose, D. (2004). Conceptualization and
Instrumentation of Food Insecurity. Washington, DC: National Academy of Sciences, Committee on National Statistics, Panel to Review USDA’s Measurement of Food Insecurity and Hunger.
Hamilton, W., Cook, J., & Thompson, W., et al. (1997). Household food security in the
United States in 1995: Summary report of the food security measurement project. Alexandria, VA: US Department of Agriculture, Food and Consumer Service.
Hampl, J. S., & Hall, R. (2002). Dietetic approaches to U.S. hunger and food insecurity.
Journal of the American Dietetic Association, 102, 921. Harper, F. D., Harper, J. A., & Stills, A. B. (2003). Counseling children in crisis based on
Maslow’s hierarchy of basic needs. International Journal for the Advancement of Counselling, 25, 11-25.
Heneghan , A.. M ., Silver,E. .J., Bauman, L. J., Westbrook, L. E., & Stein, R .E. (1998).
Depressive symptoms in inner-city mothers of young children: Who is at risk?, Pediatrics, 102, 1394-1400.
Heseker H., Kubler W., Pudel V., & Westenhoffer J.(1992). Psychological disorders as
early symptoms of mild-to-moderate vitamin deficiency. Annals of the New York Academy of Sciences, 669, 352-357.
Hobfoll S.E., Ritter C., Lavin J., Hulsizer M.R., & Cameron R.P. (1995). Depression
prevalence and incidence among inner-city pregnant and postpartum women. Journal of Consulting and Clinical Psychology, 63, 445-453.
Jayakody, R., S. Danziger, & Pollak, H. (2000). Welfare reform, substance use, and
mental health. Journal of Health Politics, Policy, and Law, 25, 623–651.
Keenan, D. P., Olson, C., Hersey, J. C., & Parmer, S. M. (2001). Measures of food insecurity/security. Journal of Nutrition Education, 33, s49-s58.

75
Kessler R.C., McGonagle K.A., Zhao S., Nelson C.B., Hughes M., Eshleman S., Wittchen H.U., & Kendler K.S. (1994). Lifetime and 12-month prevalence of DSM-III-R psychiatric disorders in the United States: Results from the National Comorbidity Survey. Archives of General Psychiatry, (Suppl. 30), 51, 8-19
Kleinman, R. E., Murphy, J. M., Little, M., Pagano, M., Wehler, C. A., Regal, K., &
Jellinek, M. S. (1998). Hunger in children in the united states: Potential behavioral and emotional correlates. Pediatrics, 101. Retrieved June 14, 2006, from http://www.pediatrics.org/cgi/content/full/101/1/e3.
Kornstein, S,G., Schatzberg, A.F., Thase, M.E., Yonkers, K.A., McCullough, J.P.,
Keitner, G.I., Gelenberg, C.E., Ryan, C.E., Hess, Harrison, S.M., Davis, S.M. & Keller, M.B. (2000). Gender differences in chronic major and double depression.
Journal of Affective Disorders, 60, 1-11 Leschied, A. W., Chiodo, D., Whitehead, P. C. & Hurley, D. (2003). The relationship
between maternal depression and child outcomes in a child welfare sample: Implications for policy and treatment. The University of Western Ontario, October 2003.
Maslow, A. H. (1968). Toward a psychology of being (2nd ed.). New York: Van
Nostrand Reinhold. Maslow, A. H. (1970). Motivation and personality (2nd ed.). New York: Harper and
Row. Maxwell, D. (1996). Measuring food security: The frequency and severity of “coping
strategies.” Food Policy, 21, 291-303. McLeod, J. D., & Nonnemaker, J. M. (2000). Poverty and child emotional and behavioral
problems : Racial/ethnic differences in processes and effects. Journal of Health and Social Behavior, 41, 137-161.
Montana State Advisory Council on Food and Nutrition (2006). The state of food and
nutrition in Montana 2005-2006. Retrieved May 15, 2006 from hhtp://www.opi.mt.gov/pdf/schoolfood/AdvCouncilRpt05.pdf
Morris, P., Neuhauser, M., & Campbell, L. (1992). Food security in rural America: A
study of the availability and costs of foods. Journal of Nutrition Education, 24, 52s-58s.
Murphy, J. M., Wehler, C. A., Pagano, M. E., Little, M., Kleinman, R. E., & Jellinek, M.
S. (1998). Relationship between hunger and psychosocial functioning in low-
76
income American children. Journal of the American Academy of Child and Adolescent Psychiatry, 37, 163-170.
Nord, M., Andrews, M., & Carlson, S. (2005). Household food security in the United
States, 2004. A report from the Economic Research Service, 11. Retrieved May 1, 2006 from http://www.ers.usda.gov.
Northwest Foundation. (2004). On getting out and staying out of poverty. Annual report.
Retrieved on May 1, 2006 from http://www.nwaf.org/Resources.aspx?pg=Resources/Publications.ascx
Olson, C. M., & Radloff, L. (1977). The CES-D scale: A self-report depression scale for
research in the general population. Applied Psychological Measurement, 1, 385-401.
Olson, C. M., & Rauschenbach, B. S. (1997). Factors contributing to household food
insecurity in a rural upstate New York county. Family Economics & Nutrition Review, 10, 2-17.
Olson, C. M. (1999). Nutrition and health outcomes associated with food insecurity and
hunger. Journal of Nutrition, 129, 521-524. Olson, C. M., Anderson, K., Kiss, E., Lawrence, F. C., & Seiling, S. B. (2004). Factors
protecting against and contributing to food insecurity among rural families. Family Economics and Nutrition Review, 16, 12-20.
Petterson, S. M., & Albers, A. B. (2001). Effects of poverty and maternal depression on
early child development. Child Development, 72, 1794-1813.
Pollak, H. A., Danziger, S., Seefeldt, K. S., & Jayakody R. (2002). Substance use among welfare recipients: Trends and policy responses. Social Service Review, 76, 256–274.
Radloff, L. S. (1977). The CES-D scale: A self-report depression scale for research in the general population. Applied Psychological Measurement, 1, 385-401.
Radloff, L. S., & Locke, B. Z. (1986). The community mental health assessment survey
and the CES-D scale. In M. M. Weissman, J. K. Myers, & C. E. Ross (Eds.), Community surveys of psychiatric disorders (pp.177-189). New Brunswick, NJ: Rutgers University Press.
Rank, M.R., & Hirsch, T.A. (1993). The link between population density and welfare
participation. Demography , 30, 607-622.
77
Rose, D. (1999). Economic determinants and dietary consequences of food insecurity in the United States. Journal of Nutrition, 129, 517-520
Siefert, K, Heflin, C. M., Corcoran, M.E., & Williams, D. R. (2001). Food insufficiency and the physical and mental health of low-income women. Women and Health, 32, 159–77.
Siefert, K., Heflin, C. M., Corcoran, M. E., & Williams, D. R. (2004). Food insufficiency
and physical and mental health in a longitudinal survey of welfare recipients. Journal of Health and Social Behavior, 45, 171-186.
Splett, P.L. (1994 March/ April). Federal Food Assistance Programs: A step to food
security for many. Nutrition Today, 6-13. Strupp B., & Levitsky D.(1995). Enduring cognitive effects of early malnutrition: A
theoretical reappraisal. Journal of Nutrition, 125, 2221S-2232S. Tiemeier, H., van Tuijl, H-R., Hofman, A., Meijer, J., Kiliaan, A.J., & Breteler, M.M.
(2002). Vitamin B12, folate, and homocysteine in depression: The Rotterdam Study. American Journal of Psychiatry, 159, 2099-2101.
USDA Economic Research Service. Measuring Rurality: What is Rural? Retrieved April
6, 2007 from http://www.ers.usda.gov/Briefing/Rurality/WhatIsRural/ USDHHS. (2006). Annual update of the HHS poverty guidelines. Federal Register, 71
(15), 3848-3849. Retrieved April 6, 2007 from http://aspe.hhs.gov/poverty/06poverty.shtml
Vozoris, N. T., & Tarasuk, V. S. (2003). Household food insufficiency is associated with poorer health. Journal of Nutrition, 133, 120-126. Weissman, M.M., & Olfson, M. (1995). Depression in women: Implications for health
care research. Science, (Current Population Reports, Series P-60, No. 201). Washington, DC: U.S. Government Printing Office), 269, 799-801.
Zuckerman, B. S., & Beardslee, W. R. (1987). Maternal depression: A concern for
pediatricians. Pediatrics, 79, 110-117.

78
APPENDICES
79
APPENDIX A
HUMAN SUBJECTS APPLICATION
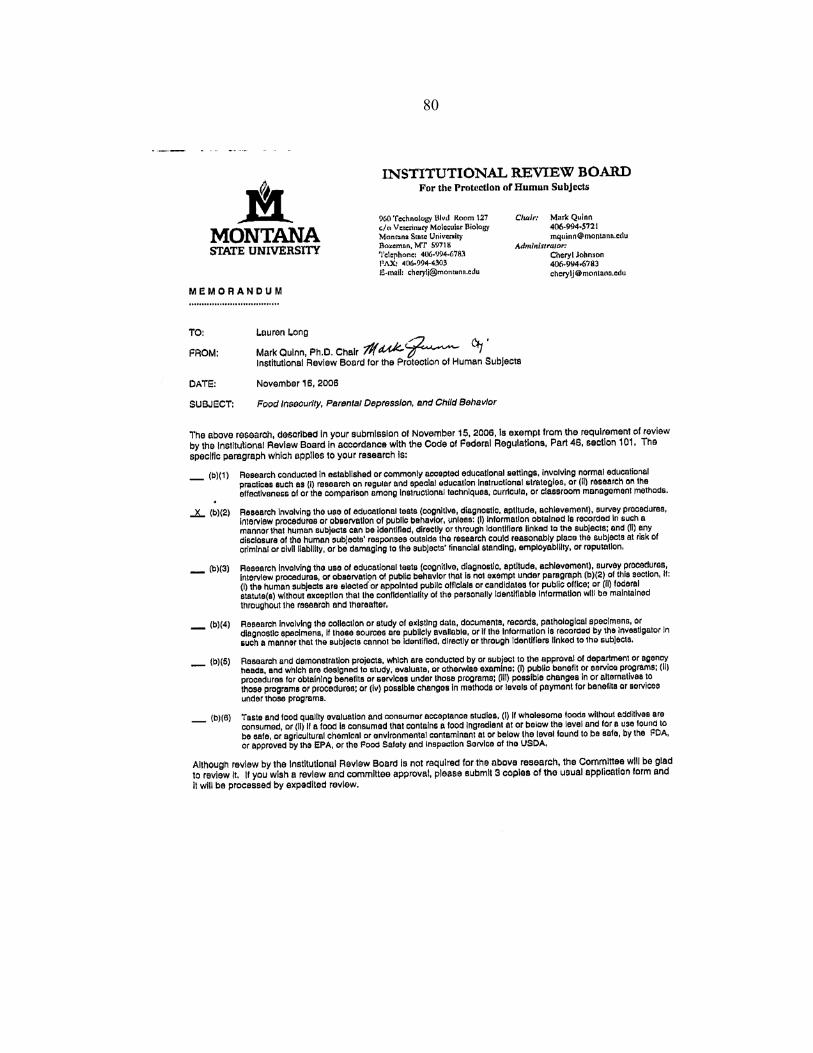
80
81
APPENDIX B
HUMAN PARTICIPANTS PROTECTIONS EDUCATION FOR RESEARCH
COMPLETION CERTIFICATE
82
Completion Certificate
This is to certify that lauren long has completed the Human Participants Protection Education for Research Teams online course, sponsored by the National Institutes of Health (NIH), on 11/12/2006. This course included the following:
• key historical events and current issues that impact guidelines and legislation on human participant protection in research.
• ethical principles and guidelines that should assist in resolving the ethical issues inherent in the conduct of research with human participants.
• the use of key ethical principles and federal regulations to protect human participants at various stages in the research process.
• a description of guidelines for the protection of special populations in research. • a definition of informed consent and components necessary for a valid consent. • a description of the role of the IRB in the research process. • the roles, responsibilities, and interactions of federal agencies, institutions, and
researchers in conducting research with human participants.
National Institutes of Health http://www.nih.gov
Home | Contact Us | Policies | Accessibility | Site Help | Site Map A Service of the National Cancer Institute

83
APPENDIX C
INFORMED CONSENT FORM
84
CONSENT FORM
FOOD AND FAMILY WELL-BEING You are being asked to participate in a study that will examine food security and family well being in the Gallatin Valley. This study will focus on women who have children between the ages of 6 and 16. Although you may not personally benefit from participating in this study, the research team hopes to better understand the relationship between food security and our family well being. If you agree to participate in this study, you will be asked to complete a questionnaire which will take a total of 15 minutes of your time. Because we appreciate your time and value your contribution to this study, you will receive a gift certificate from one of several area stores. Please note that you may refuse to answer any of the questions or stop participating without any consequence to you. All of the information obtained in this study will be kept confidential as you will remain anonymous. Only the research team will view the information gathered on the questionnaires. QUESTIONS: If you have questions regarding the research study, please contact Lauren Long at (406) 994-7396 or via email at [email protected] or Dr. Bethany Letiecq at (406) 994-7396 or via email at [email protected]. You may also contact Dr. Mark Quinn, Chair of the MSU Institutional Review Board for the Protection of Human Subjects, at (406) 994-5721. COMMUNITY RESOURCES: We also want to let you know about other resources in the community that may be able to help you meet your family’s needs. Office of Public Assistance (TANF, Food Stamps, Medicaid) 406-582-3010 Food Stamp Hotline—Citizen’s Advocate 800-332-2272 WIC (Women, Infants, Children) Office 406-582-3115 Gallatin City/County Health Department 406-582-3100 Child and Family Services 406-585-9984 MSU Human Development Clinic 406-994-4113 Bozeman Area Mental Health Center 406-522-7357 Mental Health Help Desk 800-866-0328

85
APPENDIX D
SURVEY

86
Section 1. Tell Us about Yourself and Your Family The following questions will help us gather general information about you and your family. Your answers will be kept strictly confidential. Please be as honest as possible and feel free to write comments in the margins to clarify your answers (if needed). Please fill in the blank or check the box that best reflects your experience: 1. What is your age? ____________ years 2. What is your relationship status? Married/living with significant other Single: living alone/with children, divorced, separated 3. How many years of education have you completed? _________ years of education 4. Which of the following best describes your working situation? (Please check one)
Working for pay/employed *How many hours a week do you typically work? __________hours/week
Unemployed Retired “Stay at home” parent/caregiver Student Other, please specify: ______________________
5. How many children do you have living in your household? _____________ children in my house 6. What is your annual household income range? (Please check one)
$0 - $10,000 per year $40,001 - $50,000 $10,001 - $20,000 $50,001 - $60,000 $20,001 - $30,000 over $60,000 $30,001 - $40,000 Refuse to answer this question
7. Do you or your children receive government assistance? Yes No
If yes, please check all that apply: TANF/TANF Child-Only Medicaid/Medicare Food Stamps WIC Other:_____________________________________________________
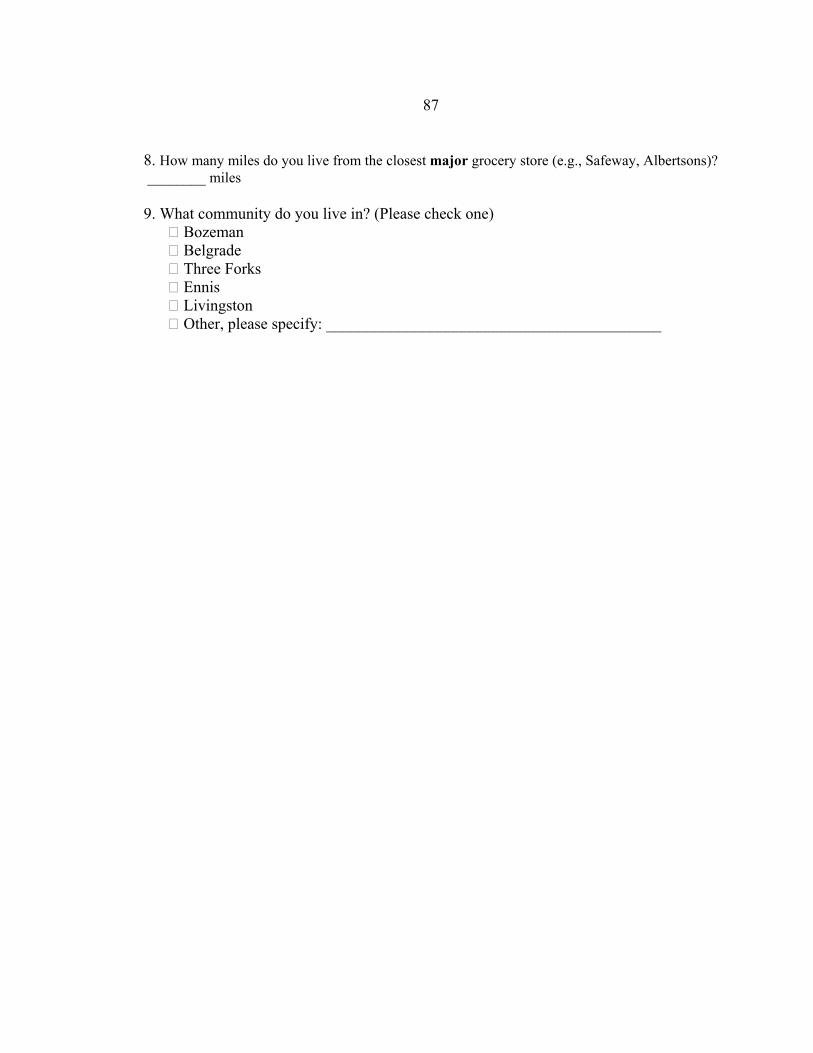
87
8. How many miles do you live from the closest major grocery store (e.g., Safeway, Albertsons)? ________ miles 9. What community do you live in? (Please check one)
Bozeman Belgrade Three Forks Ennis Livingston Other, please specify: __________________________________________
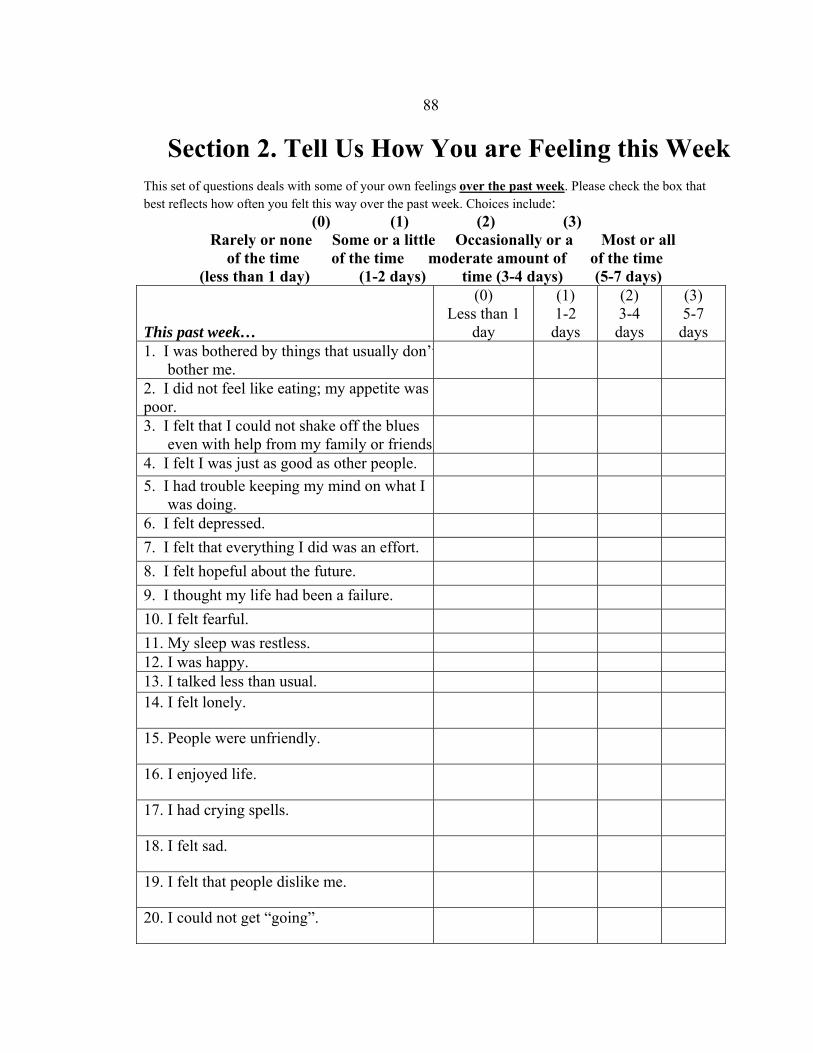
88
Section 2. Tell Us How You are Feeling this Week
This set of questions deals with some of your own feelings over the past week. Please check the box that best reflects how often you felt this way over the past week. Choices include:
(0) (1) (2) (3) Rarely or none Some or a little Occasionally or a Most or all
of the time of the time moderate amount of of the time (less than 1 day) (1-2 days) time (3-4 days) (5-7 days) This past week…
(0) Less than 1
day
(1) 1-2 days
(2) 3-4 days
(3) 5-7 days
1. I was bothered by things that usually don’tbother me.
2. I did not feel like eating; my appetite was poor.
3. I felt that I could not shake off the blues even with help from my family or friends
4. I felt I was just as good as other people. 5. I had trouble keeping my mind on what I
was doing.
6. I felt depressed. 7. I felt that everything I did was an effort. 8. I felt hopeful about the future. 9. I thought my life had been a failure. 10. I felt fearful. 11. My sleep was restless. 12. I was happy. 13. I talked less than usual. 14. I felt lonely.
15. People were unfriendly.
16. I enjoyed life.
17. I had crying spells.
18. I felt sad.
19. I felt that people dislike me.
20. I could not get “going”.
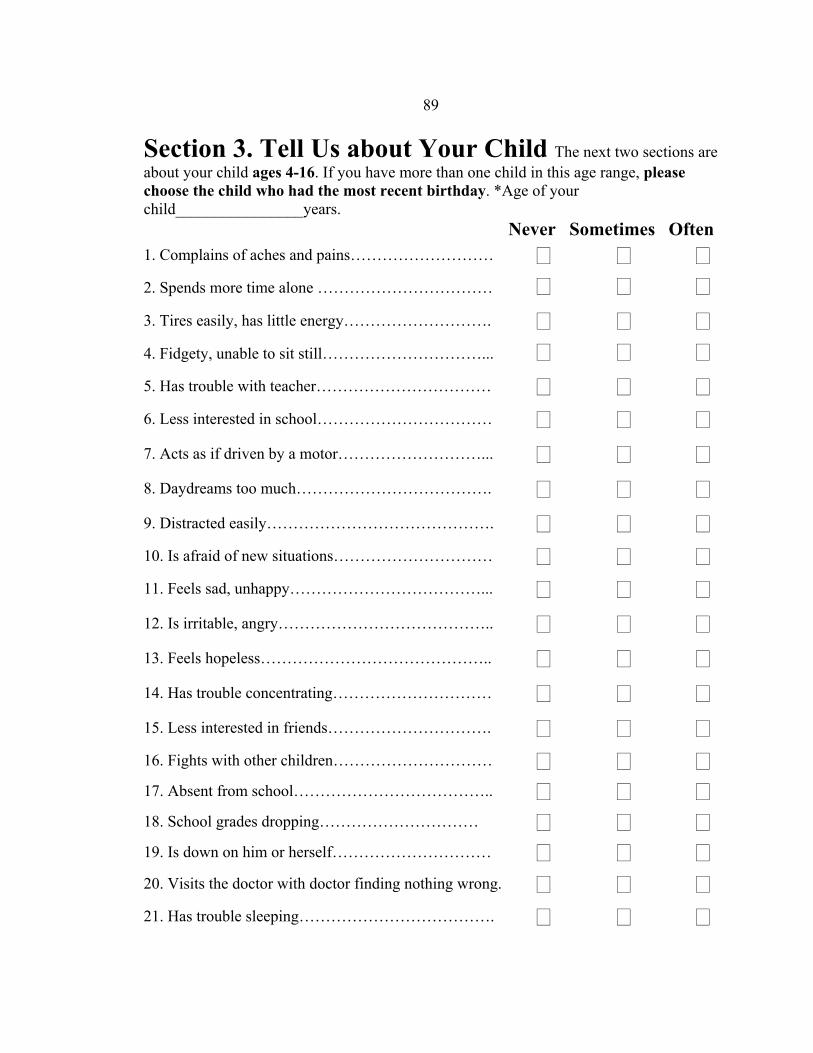
89
Section 3. Tell Us about Your Child The next two sections are about your child ages 4-16. If you have more than one child in this age range, please choose the child who had the most recent birthday. *Age of your child________________years. Never Sometimes Often1. Complains of aches and pains……………………… 2. Spends more time alone …………………………… 3. Tires easily, has little energy………………………. 4. Fidgety, unable to sit still…………………………... 5. Has trouble with teacher…………………………… 6. Less interested in school…………………………… 7. Acts as if driven by a motor………………………... 8. Daydreams too much………………………………. 9. Distracted easily……………………………………. 10. Is afraid of new situations………………………… 11. Feels sad, unhappy………………………………... 12. Is irritable, angry………………………………….. 13. Feels hopeless…………………………………….. 14. Has trouble concentrating………………………… 15. Less interested in friends…………………………. 16. Fights with other children………………………… 17. Absent from school……………………………….. 18. School grades dropping………………………… 19. Is down on him or herself………………………… 20. Visits the doctor with doctor finding nothing wrong. 21. Has trouble sleeping……………………………….

90
22. Worries a lot………………………………………. 23. Wants to be with you more than before…………... 24. Feels he or she is bad…………………………… 25. Takes unnecessary risks…………………………... 26. Gets hurt frequently………………………………. Never Sometimes Often
27. Seems to have less fun……………………………. 28. Acts younger than children his or her age……… 29. Does not listen to rules……………………………. 30. Does not show feelings…………………………… 31. Does not understand other people’s feelings……... 32. Teases others……………………………………... 33. Blames others for his or her troubles…………… 34. Takes things that do not belong to him or her……. 35. Refuses to share…………………………………… Section 4. Tell Us How You Deal with Your Child Please tell us how often you do the following with your child. Your choices are: 1 = Never 2 = Once in a While 3 = About Half of the Time 4 = Very Often 5 = Always 1 2 3 4 5 Never Always
1. I give praise when my child is good………………
2. I show patience with my child…………………….
3. I spank when my child is disobedient……………..
4. I give into my child when my child fusses………..
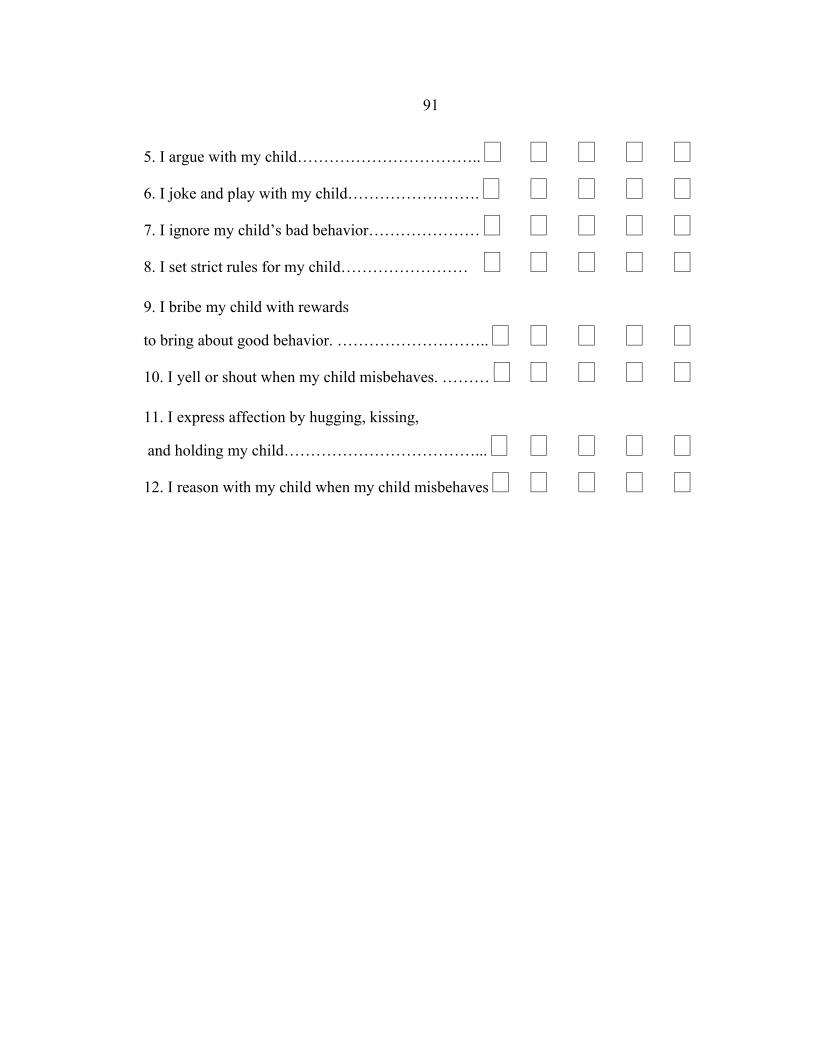
91
5. I argue with my child……………………………..
6. I joke and play with my child…………………….
7. I ignore my child’s bad behavior…………………
8. I set strict rules for my child…………………… 9. I bribe my child with rewards
to bring about good behavior. ………………………..
10. I yell or shout when my child misbehaves. ……… 11. I express affection by hugging, kissing,
and holding my child………………………………...
12. I reason with my child when my child misbehaves
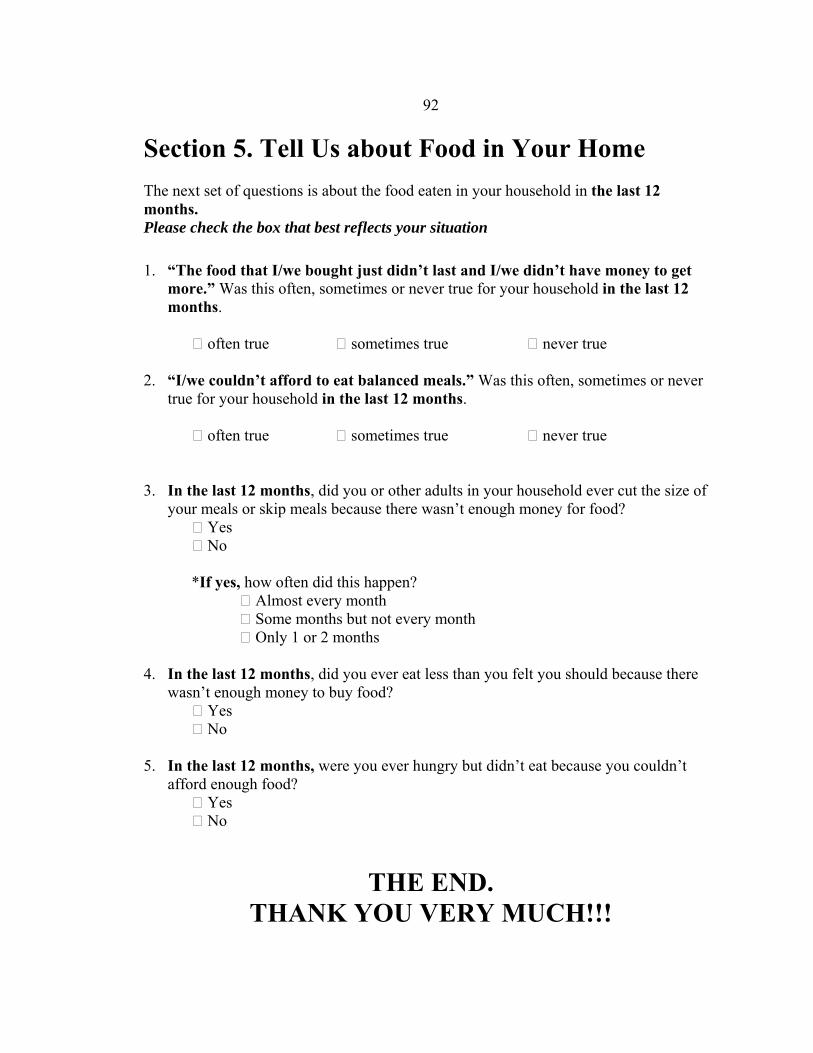
92
Section 5. Tell Us about Food in Your Home The next set of questions is about the food eaten in your household in the last 12 months. Please check the box that best reflects your situation
1. “The food that I/we bought just didn’t last and I/we didn’t have money to get
more.” Was this often, sometimes or never true for your household in the last 12 months.
often true sometimes true never true
2. “I/we couldn’t afford to eat balanced meals.” Was this often, sometimes or never true for your household in the last 12 months.
often true sometimes true never true
3. In the last 12 months, did you or other adults in your household ever cut the size of your meals or skip meals because there wasn’t enough money for food?
Yes No
*If yes, how often did this happen? Almost every month Some months but not every month Only 1 or 2 months
4. In the last 12 months, did you ever eat less than you felt you should because there wasn’t enough money to buy food?
Yes No
5. In the last 12 months, were you ever hungry but didn’t eat because you couldn’t afford enough food?
Yes No
THE END. THANK YOU VERY MUCH!!!
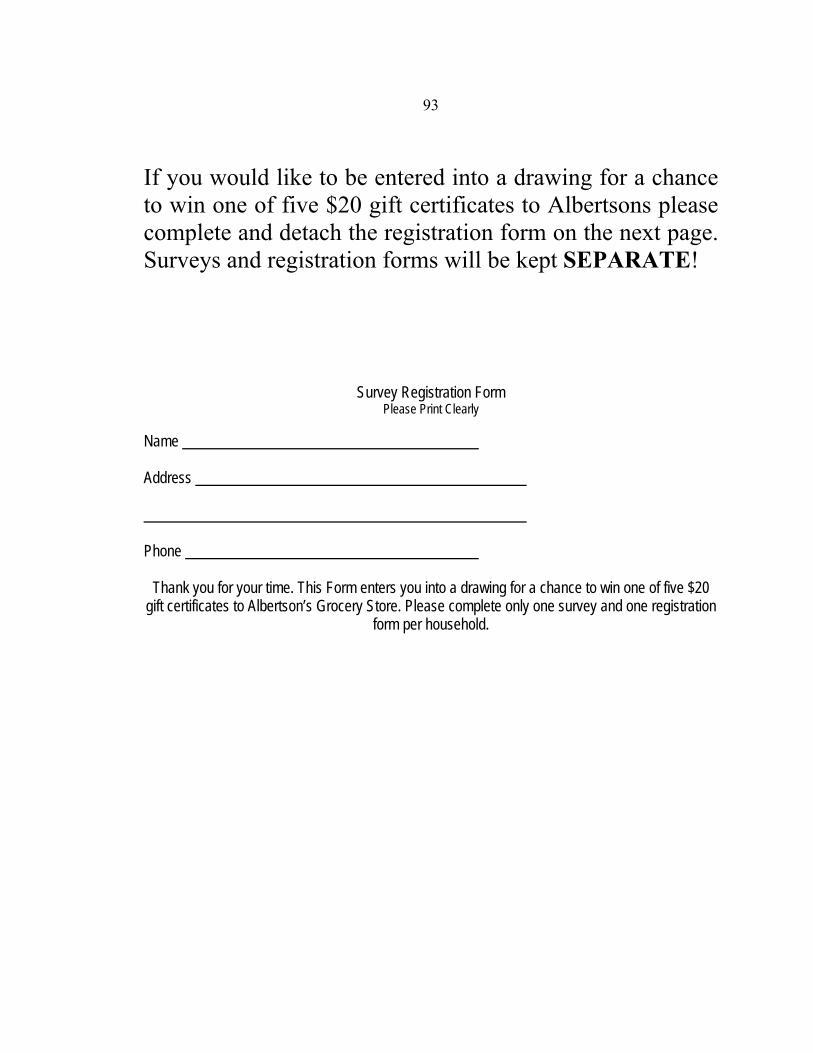
93
If you would like to be entered into a drawing for a chance to win one of five $20 gift certificates to Albertsons please complete and detach the registration form on the next page. Surveys and registration forms will be kept SEPARATE!
Survey Registration Form Please Print Clearly
Name Address Phone
Thank you for your time. This Form enters you into a drawing for a chance to win one of five $20 gift certificates to Albertson’s Grocery Store. Please complete only one survey and one registration
form per household.