food security after arra
TRANSCRIPT
8/4/2019 Food Security After ARRA
http://slidepdf.com/reader/full/food-security-after-arra 1/52
Food Security Improved
Following the 2009 ARRAIncrease in SNAP Benefits
Mark Nord
Mark Prell
EconomicResearchService
EconomicResearchReportNumber 116
April 2011
United States
Department ofAgriculture

8/4/2019 Food Security After ARRA
http://slidepdf.com/reader/full/food-security-after-arra 2/52
The U.S. Department of Agriculture (USDA) prohibits discrimination in all its programsand activities on the basis of race, color, national origin, age, disability, and, where
applicable, sex, marital status, familial status, parental status, religion, sexual
orientation, genetic information, political beliefs, reprisal, or because all or a part of anindividual's income is derived from any public assistance program. (Not all prohibited
bases apply to all programs.) Persons with disabilities who require alternative means
for communication of program information (Braille, large print, audiotape, etc.) shouldcontact USDA's TARGET Center at (202) 720-2600 (voice and TDD).
To file a complaint of discrimination write to USDA, Director, Office of Civil Rights, 1400Independence Avenue, S.W., Washington, D.C. 20250-9410 or call (800) 795-3272
(voice) or (202) 720-6382 (TDD). USDA is an equal opportunity provider and employer.
Recommended citation format for this publication:
Nord, Mark, and Mark Prell. Food Security Improved Following the2009 ARRA Increase in SNAP Benefits, ERR-116, U.S. Department
of Agriculture, Economic Research Service, April 2011.
Photo: USDA NAL Photography Center.
w w w
e r s
.
s da go
Visit Our Website To Learn More!
Find additional information
http://www.ers.usda.gov/briefing/foodsecurity

8/4/2019 Food Security After ARRA
http://slidepdf.com/reader/full/food-security-after-arra 3/52
United StatesDepartment
of Agriculture
www.ers.usda.gov
A Report from the Economic Research Service
Abstract
The American Recovery and Reinvestment Act of 2009 increased benefit levels for theSupplemental Nutrition Assistance Program (SNAP, formerly known as the Food StampProgram) and expanded SNAP eligibility for jobless adults without children. One goalof the program changes was to improve the food security of low-income households. We
find that food expenditures by low-income households increased by about 5.4 percent andtheir food insecurity declined by 2.2 percentage points from 2008 to 2009. Food securitydid not improve for households with incomes somewhat above the SNAP eligibility range.These findings, based on data from the nationally representative Current PopulationSurvey Food Security Supplement, suggest that the ARRA SNAP enhancements contrib-uted substantially to improvements for low-income households.
Keywords: Food security, food insecurity, food spending, SNAP, Supplemental NutritionAssistance Program, ARRA, American Recovery and Reinvestment Act
Acknowledgments
The authors thank Erik Scherpf and David Smallwood (Economic Research Service),Michael Wiseman (George Washington University), Bruce Webber (Oregon StateUniversity), and Bruce Meyer (University of Chicago) for their insights and suggestions.Thanks also to Angela Anderson for editorial assistance and to Wynnice Pointer-Napperfor the production and graphics work.
Mark Nord, [email protected]
Mark Prell, [email protected]
Food Security Improved
Following the 2009 ARRA
Increase in SNAP Benefits
Economic
Research
Report
Number 116
April 2011

8/4/2019 Food Security After ARRA
http://slidepdf.com/reader/full/food-security-after-arra 4/52
ii
Food Security Improved Following the 2009 ARRA Increase in SNAP Benefuts / ERR-116 Economic Research Service/USDA
Contents
Summary. . . . . . . . . . . . . . . . . . . . . . . . . . . . . . . . . . . . . . . . . . . . . . . . . . . iii
Introduction . . . . . . . . . . . . . . . . . . . . . . . . . . . . . . . . . . . . . . . . . . . . . . . . . 1
Analytic Framework, Data, and Key Variables . . . . . . . . . . . . . . . . . . . . 5Analytic Framework . . . . . . . . . . . . . . . . . . . . . . . . . . . . . . . . . . . . . . . . . 5
Data Used in the Study . . . . . . . . . . . . . . . . . . . . . . . . . . . . . . . . . . . . . . . 7Measurement of Key Variables . . . . . . . . . . . . . . . . . . . . . . . . . . . . . . . . 8
Research Challenges and Methods . . . . . . . . . . . . . . . . . . . . . . . . . . . . . . 10Unadjusted Comparisons Pre-ARRA to Post-ARRA . . . . . . . . . . . . . . . 10Multivariate (Adjusted) Comparisons Pre-ARRA to Post-ARRA . . . . . 10Difference-in-Difference Comparisons Pre-ARRA to Post-ARRA . . . . 12
SNAP Participation Increased . . . . . . . . . . . . . . . . . . . . . . . . . . . . . . . . . 13Expected Changes. . . . . . . . . . . . . . . . . . . . . . . . . . . . . . . . . . . . . . . . . . 13Findings. . . . . . . . . . . . . . . . . . . . . . . . . . . . . . . . . . . . . . . . . . . . . . . . . . 14
SNAP Benefits Increased . . . . . . . . . . . . . . . . . . . . . . . . . . . . . . . . . . . . . . 15Expected Increase . . . . . . . . . . . . . . . . . . . . . . . . . . . . . . . . . . . . . . . . . . 15Findings. . . . . . . . . . . . . . . . . . . . . . . . . . . . . . . . . . . . . . . . . . . . . . . . . . 15
TFP-Adjusted Food Expenditures Increased Among
Low-Income Households . . . . . . . . . . . . . . . . . . . . . . . . . . . . . . . . . . . . . 17Expected Changes . . . . . . . . . . . . . . . . . . . . . . . . . . . . . . . . . . . . . . . . . 17Findings. . . . . . . . . . . . . . . . . . . . . . . . . . . . . . . . . . . . . . . . . . . . . . . . . . 20
Food Security Improved Among Low-Income Households . . . . . . . . . . 23Expected Changes. . . . . . . . . . . . . . . . . . . . . . . . . . . . . . . . . . . . . . . . . . 23Findings. . . . . . . . . . . . . . . . . . . . . . . . . . . . . . . . . . . . . . . . . . . . . . . . . . 24
TFP-Adjusted Food Expenditures Increased More for SNAP
Households Than for Low-Income Non-SNAP Households . . . . . . . . . 27Expected Differences . . . . . . . . . . . . . . . . . . . . . . . . . . . . . . . . . . . . . . . 27Findings. . . . . . . . . . . . . . . . . . . . . . . . . . . . . . . . . . . . . . . . . . . . . . . . . . 27
An Historical Perspective on Pre-ARRA to Post-ARRA Changes . . . . 29
Conclusions . . . . . . . . . . . . . . . . . . . . . . . . . . . . . . . . . . . . . . . . . . . . . . . . . 31
References . . . . . . . . . . . . . . . . . . . . . . . . . . . . . . . . . . . . . . . . . . . . . . . . . . 33
Appendix: Multivariate Regression Models . . . . . . . . . . . . . . . . . . . . . . 36

8/4/2019 Food Security After ARRA
http://slidepdf.com/reader/full/food-security-after-arra 5/52
iii
Food Security Improved Following the 2009 ARRA Increase in SNAP Benefuts / ERR-116 Economic Research Service/USDA
Summary
The American Recovery and Reinvestment Act (ARRA) of 2009 increasedbenefit levels for the Supplemental Nutrition Assistance Program (SNAP,formerly known as the Food Stamp Program) and expanded SNAP eligi-bility for jobless adults without children. The changes were intended toassist those most impacted by the recession, to create and save jobs, and
to stimulate the economy. In this study, we examine whether the increasedSNAP benefits provided by ARRA improved the food security of low-income households (that is, the extent to which they were consistently ableto obtain adequate food).
What Is the Issue?
Federal policy officials and the American public want to know whetherthe funds spent under various provisions of ARRA have met the goals of Congress and the Administration. The U.S. Department of Agriculture haspreviously documented the extent and timing of the additional purchasingpower and estimated the extent of economic activity that resulted from the
SNAP changes under ARRA. This is the first study to examine how muchARRA’s SNAP enhancements may have improved the food security of low-income households.
What Did the Study Find?
The food security of low-income households (those with incomes in theeligible range for SNAP) improved from 2008 to 2009, and a substantialshare of that improvement may be due to the increase in SNAP benefitsimplemented under ARRA. From late 2008 (pre-ARRA) to late 2009 (post-ARRA), the following changes were estimated, taking into account changesin income, employment, and other household characteristics:
• Among all low-income households, the prevalence of food insecurity fellby 2.2 percentage points, and the prevalence of very low food security fellby 2.0 percentage points. Very low food security is a severe range of foodinsecurity that impacts the eating patterns of some household membersand reduces their food intake below levels they consider appropriate.
• Participation of low-income households in SNAP increased by about 3percentage points.
• The SNAP benefits received by the typical (median) participating house-hold increased by about 16 percent.
• Food expenditures by the typical (median) low-income householdincreased by 5.4 percent of which an estimated 2.2 percent may haveresulted from the ARRA SNAP changes.
• Among households with incomes just above the income-eligibilityrange for SNAP, food expenditures (adjusted for changes in foodprices) increased by a smaller percentage than among low-incomehouseholds, and the prevalence of food insecurity among such house-holds did not decline.

8/4/2019 Food Security After ARRA
http://slidepdf.com/reader/full/food-security-after-arra 6/52
iv
Food Security Improved Following the 2009 ARRA Increase in SNAP Benefuts / ERR-116 Economic Research Service/USDA
• Food spending increased more among SNAP participants than amonglow-income non-SNAP households, closing a gap in food spending thathad persisted since at least 2001.
• The combination observed in 2009 of a simultaneous increase in SNAPparticipation and an improvement in food security from the previous yearhad not occurred in any other recent year.
How Was the Study Conducted?
We analyzed data on SNAP participation, food security, food spending, andother household characteristics from the annual Current Population SurveyFood Security Supplement (CPS-FSS). The CPS-FSS is an annual supple-ment to the monthly Current Population Survey, sponsored by USDA andadministered by the U.S. Census Bureau. The CPS-FSS is a large (46,000households in 2009), nationally representative survey of the civilian, nonin-stitutionalized population of the United States and is the data source for theU.S. Department of Agriculture’s series of annual reports on the food securityof U.S. households.
The main analysis compared SNAP participation, SNAP benefits, foodspending, and food security in December 2009 (about 8 months after ARRAincreased SNAP benefits) with the corresponding statistics for December2008 (about 1 year into the recession but before SNAP benefits increased).We conducted separate analyses for all low-income households, for low-income households by SNAP participation status, and for households withincomes above the SNAP eligibility range but below the U.S. median, andused multivariate regression methods to control for changes in income,employment, and other household characteristics from 2008 to 2009.
The prevalence of very low food security declined among households
with incomes in the eligibility range for SNAP, but not for householdswith incomes somewhat higher
Percent of households with very low food security
SNAP= Supplemental Nutrition Assistance Program.
ARRA= American Recovery and Reinvestment Act.
*Percentages for 2009 were regression-adjusted for differences between years in householdincome, employment, and other household characteristics between years.
Source: USDA, Economic Research Service calculations based on Current PopulationSurvey Food Security Supplement (CPS-FSS) data.
Before ARRA (2008)
After ARRA (2009, adjusted)*
Households with incomes in theeligibility range for SNAP (less than
130 percent of the poverty line)
Households with incomes somewhatabove the eligibility range for SNAP(150-250 percent of the poverty line)
0
2
4
6
810
12
14
16

8/4/2019 Food Security After ARRA
http://slidepdf.com/reader/full/food-security-after-arra 7/52
1
Food Security Improved Following the 2009 ARRA Increase in SNAP Benefuts / ERR-116 Economic Research Service/USDA
Introduction
The American Recovery and Reinvestment Act (ARRA) of 2009 made twopolicy changes in the Supplemental Nutrition Assistance Program (SNAP,formerly known as the Food Stamp Program) to improve the food security of low-income households during a period of challenging economic conditions.ARRA increased SNAP benefit levels for all recipients and expanded SNAP
eligibility for jobless adults with no children.1
In this study, we examinedwhether, and to what extent, the food security of low-income householdsimproved, as intended, following these SNAP enhancements.
Food security means access to enough food by all people at all times for anactive, healthy life (Anderson, 1990). Households that are food secure canconsistently obtain adequate food. In contrast, households that are food inse-
cure are, at times, unable to acquire adequate food for all household membersbecause they lack the money and other resources for food.
SNAP provides monthly benefits for eligible low-income families and individ-uals (hereafter referred to as “households”) to purchase approved food items
at authorized foodstores. In an average month for fiscal year 2009 (endingSeptember 30, 2009), SNAP provided benefits to 33.5 million people in theUnited States (11 percent of the population). The average benefit was about$125 per person per month, and total Federal expenditures for the programwere $53.6 billion (USDA, Food and Nutrition Service, 2010b). SNAP isUSDA’s largest food and nutrition assistance program and is the cornerstoneof the Nation’s programs for reducing food insecurity and hunger.
One provision of ARRA (effective April 2009) increased SNAP benefits foreach household by a dollar amount equal to 13.6 percent of the maximumbenefit for that household size.2 The increase was implemented as a constantdollar amount for each household size, so the increase was 13.6 percent for
households receiving the maximum benefit, and the percentage increase wasgreater for households that had some net income and were therefore eligiblefor less than the maximum benefit. For example, a SNAP-participatinghousehold of four persons with no net income received a maximum benefit of $668 in April 2009—an increase of $80, or 13.6 percent, over the $588 thehousehold received in March 2009 (table 1). A household of the same size,but eligible for half the maximum benefit (because they had $980 monthlynet income), also received an increase of $80, amounting to 27.2 percent of the household’s pre-ARRA benefit. A prospective estimate of the averageincrease in benefits across all SNAP households in fiscal 2009 was about 19percent (USDA, Food and Nutrition Service, 2009).3
A second provision of ARRA increased SNAP eligibility for some joblessadults. Prior to ARRA, many jobless, working age, nondisabled adultswithout children were limited to 3 months of SNAP benefits within any3-year period. ARRA gave States an option to suspend that limitationthrough fiscal 2010 (USDA, Food and Nutrition Service, 2010a).
USDA sponsors an annual, nationally representative survey to monitor theextent and severity of food insecurity in U.S. households and has publishedstatistical reports on household food security in the United States for each
1
“Jobless” is a general category thatincludes the unemployed and those not
in the labor force. In other instances,
“unemployed” is used to refer to those
not employed but looking for work.
2Households are eligible to receive
SNAP benefits based on household
income, assets, and certain basic ex-
penses. Households with no net income(net of al lowable deductions) receive
the maximum SNAP benefit, which
varies depending on the number of
qualifying persons in the household. If
a household has net income, its SNAP
benefits are reduced by 30 percent
of its net income; it is expected that
household members can provide for
the remainder of their food needs from
their own income.
3ARRA specified that the SNAP
maximum monthly a llotments would
be fixed for the next several years
until inflation adjustments to the
pre-ARRA benefit levels exceed the
ARRA increase.

8/4/2019 Food Security After ARRA
http://slidepdf.com/reader/full/food-security-after-arra 8/52
2
Food Security Improved Following the 2009 ARRA Increase in SNAP Benefuts / ERR-116 Economic Research Service/USDA
year since 1995 (Nord et al., 2010). The research presented here used data forseveral years from that survey to examine pre-ARRA to post-ARRA changesin SNAP participation, food expenditures, and food security of householdswith annual incomes below 130 percent of the poverty line (hereafter referredto as “low-income households”). Multivariate analytic methods were used toaccount for changes in other factors besides ARRA that may have affectedthe outcomes, including household income, employment status, household
composition, and demographics. Then a difference-in-difference analysiscompared low-income households’ pre-ARRA-to-post-ARRA differences infood expenditures and food security with the corresponding differences forhouseholds that had incomes above the eligibility range for SNAP but wellbelow the U.S. median. The difference-in-difference analysis adjusted themultivariate results for effects of changes in other factors, such as a decline infood prices, that occurred during the study period but were not measured inthe data.
Previous Estimates of the Stimulus Effectsof the ARRA SNAP Enhancements
Measuring the effects of Government programs and policies informsCongress, the Administration, and the public on how well goals and objec-tives are being met. A 2009 memorandum from the Office of Managementand Budget to the heads of executive departments and agencies stated,“Rigorous, independent program evaluations can be a key resource in deter-mining whether Government programs are achieving their intended outcomesas well as possible and at the lowest possible cost.”
Table 1
Maximum monthly SNAP benefits pre-ARRA and post-ARRA1
Maximum monthly SNAP benefits
ARRA increase inmaximum monthly
SNAP benefitsNumber of peoplein the SNAP unit2
Pre-ARRA infiscal 2009
(October 1, 2008–March 31, 2009)
Post-ARRA(beginning
April 1, 2009)
————————— Dollars —————————
1 176 200 24
2 323 367 44
3 463 526 63
4 588 668 80
5 698 793 95
6 838 952 114
7 926 1,052 126
8 1,058 1,202 144
SNAP= Supplemental Nutrition Assistance Program.
ARRA= American Recovery and Reinvestment Act.1These benefit figures were applicable in the 48 contiguous States and the District of Columbia.Maximum benefits in Alaska and Hawaii are adjusted upward due to higher food prices.
2A SNAP unit may comprise all household members or a subset of related members who qualifyfor SNAP benefits. Each additional person beyond eight in the SNAP unit resulted in incrementsin maximum benefits of $132 pre-ARRA and $150 post-ARRA.
Source: USDA, Food and Nutrition Service, http://www.fns.usda.gov/snap/government/cola.htm.

8/4/2019 Food Security After ARRA
http://slidepdf.com/reader/full/food-security-after-arra 9/52
3
Food Security Improved Following the 2009 ARRA Increase in SNAP Benefuts / ERR-116 Economic Research Service/USDA
The objectives of the ARRA SNAP provisions, as identified in the SNAPARRA Recovery Plan (USDA, Food and Nutrition Service, 2010a), were:
1. Improve the food security of low-income households;
2. Create and save jobs;
3. Stimulate the economy; and
4. Stabilize the State agencies responsible for SNAP administration.4
In this report, we assess the extent to which the ARRA increase in SNAPbenefits and the expansion of SNAP eligibility may have met the first ARRASNAP objective—improving the food security of low-income households.
USDA has documented elsewhere the extent and timing of the purchasingpower created by the ARRA SNAP provisions and estimated the economicactivity that resulted from the ARRA SNAP provisions. The Food andNutrition Service (FNS), which administers USDA’s food assistanceprograms at the Federal level, reported on three of the four ARRA-SNAPobjectives in June 2010. With regard to the second and third objectives—
creating and saving jobs and stimulating the economy—the injection of addi-tional money into the economy began soon after the February 2009 passageof ARRA. In March 2009, USDA distributed to the States the additionaladministrative funding for fiscal 2009. In April 2009, the ARRA increasein SNAP benefits was implemented. About 97 percent of SNAP benefitsare redeemed within 30 days of issuance. Drawing on earlier ERS researchfindings (Hanson and Gundersen, 2002), FNS estimated that increasedSNAP benefits would create $36.8 billion of economic activity in the 5 yearsfollowing ARRA and create or save 100,000 jobs in the first 2 years afterimplementation (USDA, Food and Nutrition Service, 2010a).5 With regard tothe fourth objective—stabilizing State agencies responsible for SNAP admin-istration—FNS reported that the additional administrative funding specified
by ARRA for fiscal 2009 had been forwarded to the States.
USDA’s annual household food security report (Nord et al., 2010) provideda preliminary indication of progress on the first ARRA-SNAP objective—improving the food security of low-income households. The prevalence of food insecurity and very low food security (a severe subcategory of foodinsecurity) remained unchanged from 2008 to 2009 even as unemploymentcontinued to rise during the period (see box, “A Glance at Possible Effects of ARRA”). Furthermore, the prevalence of very low food security measuredduring the final 30 days prior to each survey (i.e., from mid-November tomid-December) declined somewhat from 2008 to 2009, and the decline wasgreatest for low-income households. This report documents a more rigorousanalysis of the changes in food insecurity and very low food security from2008 to 2009, disentangling, to the extent possible, the changes due to theARRA SNAP enhancements from those due to other policy and economicchanges during that period.
4For this purpose, ARRA appropri-
ated additional funds for States to
support SNAP administration.
5ERS research findings published
subsequent to this FNS report updated
the estimated relationship between
SNAP benefits and total economicactivity (Hanson, 2010). The estimates
do not differ substantially from those
used by FNS.
8/4/2019 Food Security After ARRA
http://slidepdf.com/reader/full/food-security-after-arra 10/52
4
Food Security Improved Following the 2009 ARRA Increase in SNAP Benefuts / ERR-116 Economic Research Service/USDA
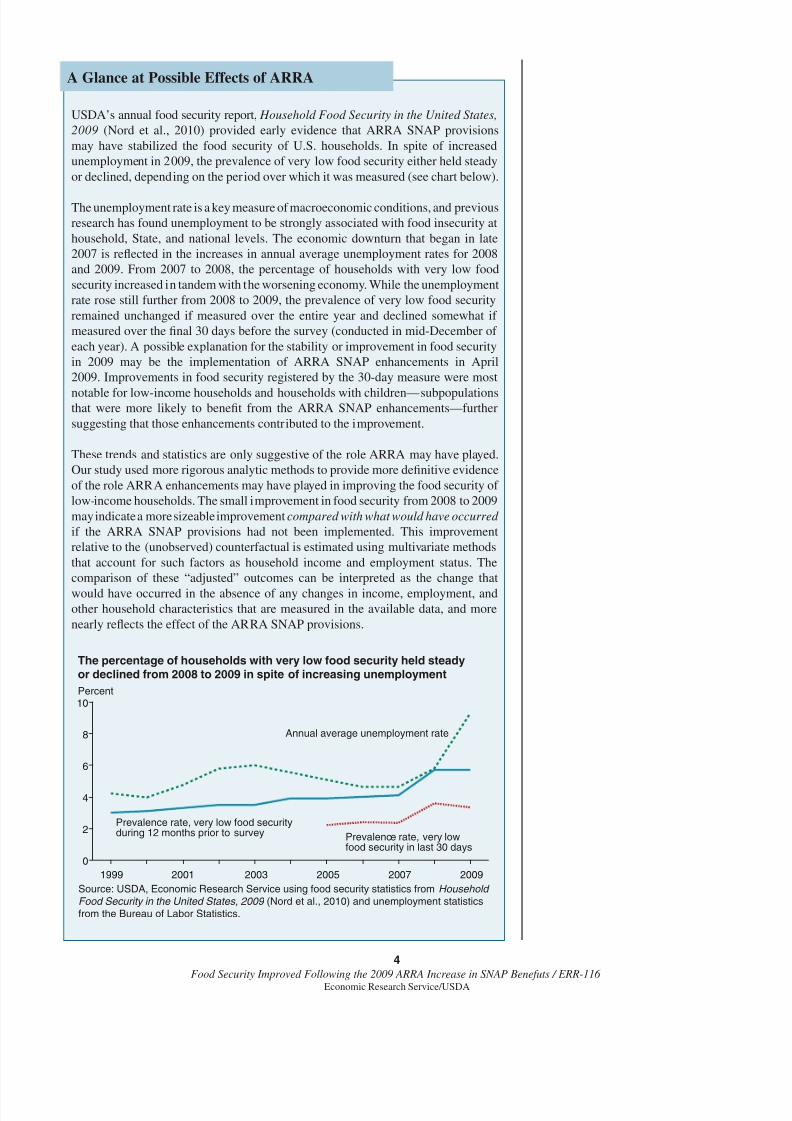
USDA’s annual food security report, Household Food Security in the United States,
2009 (Nord et al., 2010) provided early evidence that ARRA SNAP provisions
may have stabilized the food security of U.S. households. In spite of increased
unemployment in 2009, the prevalence of very low food security either held steady
or declined, depending on the per iod over which it was measured (see chart below).
The unemployment rate is a key measure of macroeconomic conditions, and previous
research has found unemployment to be strongly associated with food insecurity at
household, State, and national levels. The economic downturn that began in late
2007 is reflected in the increases in annual average unemployment rates for 2008
and 2009. From 2007 to 2008, the percentage of households with very low food
security increased in tandem with the worsening economy. While the unemployment
rate rose still further from 2008 to 2009, the prevalence of very low food security
remained unchanged if measured over the entire year and declined somewhat if
measured over the final 30 days before the survey (conducted in mid-December of
each year). A possible explanation for the stability or improvement in food security
in 2009 may be the implementation of ARRA SNAP enhancements in April
2009. Improvements in food security registered by the 30-day measure were most
notable for low-income households and households with children—subpopulationsthat were more likely to benefit from the ARRA SNAP enhancements—further
suggesting that those enhancements contributed to the improvement.
These trends and statistics are only suggestive of the role ARRA may have played.
Our study used more rigorous analytic methods to provide more definitive evidence
of the role ARRA enhancements may have played in improving the food security of
low-income households. The small improvement in food security from 2008 to 2009
may indicate a more sizeable improvementcompared with what would have occurred
if the ARRA SNAP provisions had not been implemented. This improvement
relative to the (unobserved) counterfactual is estimated using multivariate methods
that account for such factors as household income and employment status. The
comparison of these “adjusted” outcomes can be interpreted as the change that
would have occurred in the absence of any changes in income, employment, andother household characteristics that are measured in the available data, and more
nearly reflects the effect of the ARRA SNAP provisions.
A Glance at Possible Effects of ARRA
The percentage of households with very low food security held steadyor declined from 2008 to 2009 in spite of increasing unemployment
Percent
Source: USDA, Economic Research Service using food security statistics from Household Food Security in the United States, 2009 (Nord et al., 2010) and unemployment statisticsfrom the Bureau of Labor Statistics.
Annual average unemployment rate
Prevalence rate, very low food securityduring 12 months prior to survey
1999 2001 2003 2005 2007 2009
0
2
4
6
8
10
Prevalence rate, very lowfood security in last 30 days

8/4/2019 Food Security After ARRA
http://slidepdf.com/reader/full/food-security-after-arra 11/52
5
Food Security Improved Following the 2009 ARRA Increase in SNAP Benefuts / ERR-116 Economic Research Service/USDA
Analytic Framework, Data,and Key Variables
The ARRA SNAP provisions were expected to improve food security amonglow-income households through three links in a cause-and-effect chain:
1. The ARRA SNAP enhancements would increase the resources avail-
able to low-income households to buy food. This change would comefrom:
a. Increased benefits to the participants;
b. Increased participation of eligible households because the higherbenefit level makes participation more attractive; and
c. Increased eligibility of jobless households with no childrenbecause the SNAP time limits for such households weresuspended in some States.
2. Additional resources for food to low-income households wouldincrease their food expenditures.
3. Low-income households that increase their food expenditures would,ceteris paribus, experience improved food security.
Previous research supports the last two hypothesized links. However, thatresearch has not been able to convincingly sort out causal processes. TheARRA SNAP enhancements provide a rare opportunity to study all thesteps in the process jointly, and the exogenous character of the ARRA SNAPenhancements strengthens researchers’ ability to attribute causality.
Analytic Framework
We examined the extent of changes among low-income households in threeinterrelated outcomes—SNAP participation, food expenditures, and foodsecurity—and whether those changes were consistent with those that wereexpected to result from the ARRA SNAP enhancements. The changes forlow-income households were compared with changes for “nearly SNAPeligible households,” defined as those with incomes from 150 percent to 250percent of the poverty line, and therefore above the eligibility range for SNAPbut well below the national median income. We used data from the annualCurrent Population Survey Food Security Supplement (CPS-FSS, describedlater in the report) for 2001-09. The main analysis compared post-ARRAconditions in December 2009 (about 8 months after the ARRA had increasedSNAP benefits) with pre-ARRA conditions in December 2008 (about 1 year
into the recession but before SNAP benefits had increased). Year-to-yearchanges were calculated for earlier years to provide a context for interpretingthe 2008-09 changes.
Analytic complications caused by self-selection and under-reporting of SNAP participation were obviated by focusing the main analysis on changesamong all low-income households. Those complications would bias separateestimates of changes among SNAP participants and low-income non-SNAPparticipants to an unknown extent.

8/4/2019 Food Security After ARRA
http://slidepdf.com/reader/full/food-security-after-arra 12/52
6
Food Security Improved Following the 2009 ARRA Increase in SNAP Benefuts / ERR-116 Economic Research Service/USDA
Self-selection of more food-needy households into program participation isan important complicating factor in all survey-based research on the effectof food and nutrition assistance programs. For this study, accounting forself-selection would have been particularly important in separate analysesby SNAP participation status because the increase in SNAP benefits islikely to have changed the self-selection probabilities between the two timeperiods analyzed. Some households that would not have been motivated toparticipate by the pre-ARRA SNAP benefits would have participated post-ARRA due to the larger SNAP benefit. It is likely that, on average, house-holds induced to participate by the larger benefits were better off than theaverage pre-ARRA participant and worse off than the average pre-ARRAnonparticipant. Thus, their change in participation status would improve theaverage food security of each subgroup even in the absence of any actualimprovement in food security within any household due to SNAP benefits.However, the food security of all low-income households, SNAP partici-pants and nonparticipants considered jointly, would improve only if theincreased benefits and increased participation actually improved the foodsecurity of at least some households.
Both the increase in SNAP benefits for participating households and theincrease in SNAP participation among low-income households wouldincrease household food expenditures and improve household food secu-rity among low-income households as a group. The joint analysis of alllow-income households did not estimate the separate effects of these twoprocesses, but rather estimated the combined effects of the two processes onlow-income households overall.
Participation in SNAP and other programs is underreported in all surveydata, including the data used for this study. Some participating householdsdid not report that they received program benefits and therefore they incor-rectly appear in the data as nonparticipants. (Misreporting in the opposite
direction is relatively rare.) Underreporting program participation is likelyto mute the differences between reported participants and nonparticipants.Any improvement in food security due to the larger SNAP benefit would, tosome extent, be observed for reported nonparticipants as well as for reportedparticipants because some of the reported nonparticipants did, in fact, partici-pate in SNAP. Misreported SNAP participation does not, however, affect theanalytic results for all low-income households.
The results of the joint analysis of SNAP recipients and low-income nonre-cipients understate the changes within the subpopulation that participates inSNAP. To the extent that the estimates represent the effects of the ARRASNAP enhancements, the impact on SNAP participants will be diluted in
the analyses by the inclusion of many non-SNAP households that were notaffected by ARRA SNAP changes. Only about two-thirds of SNAP-eligiblehouseholds participate in the program in any given month (USDA, Foodand Nutrition Service, 2010c), and the low-income sample in the CPS-FSSincludes a substantial number of ineligible households.6 Taken together, theseproportions suggest that only around half of the low-income households in theCPS-FSS sample were, in fact, SNAP participants. Thus, the effect on SNAPparticipants would be about double the size of a correctly estimated effect onthe entire low-income CPS-FSS sample.
6Low income as measured in thisstudy is only an approximation for
SNAP eligibility. Actual eligibility
determination considers recent and
current income, rather than annual
income, and considers many factors
not measured in the CPS-FSS, such
as assets, immigration documentation
status, excess housing costs, employ-
ment costs, and child care costs.

8/4/2019 Food Security After ARRA
http://slidepdf.com/reader/full/food-security-after-arra 13/52
7
Food Security Improved Following the 2009 ARRA Increase in SNAP Benefuts / ERR-116 Economic Research Service/USDA
Although primary attention is given to estimates for all low-income house-holds, separate analyses were also conducted for SNAP participants andlow-income non-SNAP households. The results for the subgroups, however,are interpreted cautiously, recognizing that they reflect, in part, the self-selec-tion—and changes in self-selection—of more food-needy households intothe program and are further complicated by misreported SNAP participa-tion. The main conclusions of the study are based on the stronger evidence of changes among all low-income households, which are not affected by either
self-selection or underreporting because they do not rely on SNAP participa-tion status data.
Data Used in the Study
The CPS-FSS is an annual supplement to the monthly Current PopulationSurvey. The supplement is sponsored by the U.S. Department of Agriculture(USDA) and administered by the U.S. Census Bureau. The CPS-FSScollects data on household food spending, use of Federal and communityfood assistance programs, and food security (the extent to which householdsare consistently able to obtain adequate food). The CPS-FSS is nationally
representative of the civilian, noninstitutionalized population of the UnitedStates and is the datasource for USDA’s series of annual reports on the foodsecurity of U.S. households (see, for example, Nord et al., 2010). The surveyhas been conducted annually since 1995 and has been conducted consistentlyin the same time period (mid-December) since 2001. Our primary analysesused CPS-FSS data for 2008 and 2009; comparative statistics on year-to-yearchanges in food security and SNAP participation for prior years were basedon CPS-FSS data from 2001-2007. About 44,000 households were inter-viewed in the CPS-FSS for 2008, 46,000 for 2009, and an average of about48,000 households each year from 2001 to 2007.
The core labor force portion of the CPS, to which the CPS-FSS is a supple-
ment, collects information on household composition, demographics, income,employment, and other household characteristics. These data were used ascontrol variables in the multivariate analyses to account for measured factorsbesides the implementation of ARRA’s SNAP provision that can affectoutcomes of SNAP participation, food expenditures, and food security. Theincome data were also used to identify households that were likely to havehad incomes in the range eligible for SNAP and to identify nearly-SNAP-eligible households—those with incomes somewhat above that range.
All analyses used household supplement weights so that the sample repre-sented the population of interest. Variances of the participation rates andprevalence rates were estimated as:
PQ*1.6/N
where P is the weighted point estimate of the percentage, Q is the comple-ment of P (i.e., 100-P), 1.6 is the assumed design factor, and N is thenumber of unweighted households in the denominator. Variance estimatesin the multivariate analyses were not adjusted for stratification or clusteringbut are not likely to be substantially distorted by design effects in thesecomplex models.7
7The design factor of 1.6 is based
on Cohen et al., 2002. CPS-FSS data
do not include sample design data that
would allow use of standard statisti-
cal methods for correcting variance
estimates.

8/4/2019 Food Security After ARRA
http://slidepdf.com/reader/full/food-security-after-arra 14/52
8
Food Security Improved Following the 2009 ARRA Increase in SNAP Benefuts / ERR-116 Economic Research Service/USDA
Measurement of Key Variables
Income. Annual household income is reported in ranges for the core laborforce portion of the CPS. Income for each household was approximated atthe center of the reported range and was divided by a poverty line for thathousehold to adjust for household size and composition. We based householdpoverty lines on the Census Bureau’s table of poverty thresholds for individ-uals and families for the year of the survey, taking into account the numberof adults and children in the household and whether the household referenceperson was younger or older than 65.
Low-Income and Nearly-SNAP-Eligible Households. Low-income house-
holds were identified as those with annual incomes less than 130 percent of the poverty line and, therefore, likely to have been eligible for SNAP (seefootnote 5). Nearly-SNAP-eligible households were identified as those withannual incomes from 150 to 250 percent of the poverty line. These served asa comparison group for low-income households in the difference-in-differ-ence analyses.8 Low-income households made up about 20 percent of all U.S.households in 2008 and 21 percent in 2009. Nearly-SNAP-eligible households
made up about 19 percent of U.S. households in 2008 and 18 percent in 2009.
SNAP Participation. Analyses of SNAP participation were based on thereported receipt of SNAP benefits during the 30 days prior to the survey.Households in the CPS-FSS were asked whether anyone in the householdreceived benefits from SNAP, Food Stamps, or their State food assistanceprogram (if it was known by a name other than SNAP or Food Stamps). If they responded “yes,” they were asked to report which months they receivedbenefits. If they received benefits in November, but not in December, theywere asked on which day in November they received benefits. Householdswere classified as having received SNAP during the previous 30 days if theyhad received benefits within 30 days of the earliest date on which interviews
were conducted (December 14, 2008, and December 13, 2009.)
TFP-Adjusted Food Expenditures. Each household’s usual food expendi-ture was expressed relative to the cost of USDA’s Thrifty Food Plan (TFP)for that household at the time of the survey (a measure hereafter referred toas “TFP-Adjusted Food Expenditures”). This measure adjusts for differencesin household size and age/sex composition within each year and adjusts fordifferences in food prices across years. Household food needs differ dependingon the number, age, and gender of household members. The cost of the TFPprovides a basis for comparing food spending patterns across diverse house-holds within a survey year. Price inflation can cause a household’s food expen-ditures to change from one year to the next, even if it buys exactly the same
food items. The TFP-Adjusted Food Expenditure is a measure of the quantityand quality of food purchased, taking into account changes in food prices.9
Each household’s usual weekly food spending was reported by CPS-FSSrespondents after they reported their actual food spending during the previousweek. Respondents were first asked how much their household spent on foodin the week prior to the interview, including any purchases made with SNAPbenefits, at each of four kinds of places: supermarkets and grocery stores;other stores, such as meat markets, produce stands, bakeries, warehouseclubs, and convenience stores; restaurants, fast food places, cafeterias, and
8Households with income from 130
to 150 percent of the poverty line—
just above the SNAP gross income
eligibility limit—were not includedin the nearly-SNAP-eligible group
because a substantial proportion
were, in fact, eligible for SNAP, and
many participated in the program.
SNAP eligibility for such households
results from several factors, includ-
ing imprecise income measurement,
income variability during the year,
and adjunctive SNAP eligibility
due to participation in other assis-
tance programs (for which States set
eligibility criteria). Bivariate and
multivariate analyses (not shown)
of households in this income rangefound no statistically significant
changes in food expenditures or food
security. The numbers of households
in the analysis samples, however,
were relatively small (just over 1,000
in each year) so some modest-sized
changes may have occurred.
9The data used for this study cannot
differentiate between quantities and
qualities of food purchased, but the
hypothesis tests did not depend on
differentiating them. In contrast, dis-
tinguishing changes in quantities and
qualities from changes in prices was
important for the study.

8/4/2019 Food Security After ARRA
http://slidepdf.com/reader/full/food-security-after-arra 15/52
9
Food Security Improved Following the 2009 ARRA Increase in SNAP Benefuts / ERR-116 Economic Research Service/USDA
vending machines; and “any other kind of place.” Total spending for food,based on responses to this series of questions, was verified with the respon-dent, and the respondent was then asked how much the household usually spent weekly on food. Analyses by ERS researchers have found that foodexpenditures estimated from data collected by this method are consistent withestimates from the Consumer Expenditure (CE) Survey—the principal sourceof data on U.S. household expenditures for goods and services (Oliveira andRose, 1996; Nord, 2009).
The Thrifty Food Plan serves as a national standard for a nutritious, low-costdiet. It represents a set of food “market baskets” that people in specific ageand gender categories could consume at home to maintain a healthful dietthat meets current dietary standards at low cost, taking into account the foodconsumption patterns of U.S. households. The mix of foods in the ThriftyFood Plan is updated every 5 years, and, in the interim, the quantities of eachfood in the TFP market baskets are fixed. Each month, USDA’s Center forNutrition Policy and Promotion (CNPP) updates the cost of the Thrifty FoodPlan, that is, the amount of money needed to purchase the market basketsbased on national average food prices for that month.10
Food Security. Household food security—access by all household membersat all times to enough food for active healthy living—is the “bottom-line”outcome variable in this study. Food security is measured in the CPS-FSS byresponses to a series of questions about food-related conditions and behaviorsthat typically occur in households having difficulty meeting their food needs(Hamilton et al., 1997a; Hamilton et al., 1997b; Bickel et al., 2000; Nord etal., 2010). The questions cover food access problems across a wide range of severity, from worrying about running out of food to not eating for a wholeday. Each question specifies a lack of money or other resources to obtain foodas the reason for the condition or behavior, so the measure is not affected bybehaviors such as dieting to lose weight or fasting for religious reasons.
Based on the number of food-insecure conditions reported, households areclassified as either food secure or food insecure. Food-insecure householdsare further classified as having low food security or very low food security.Very low food security is a severe range of food insecurity characterized byreduced food intake and disrupted eating patterns of one or more householdmember (usually adults) due to inadequate food resources.
The standard food security measure, on which USDA’s annual food securityreports are based, represents conditions over the 12-month period prior tothe survey. Because the ARRA increase in SNAP benefits occurred part waythrough 2009 (in April), the 12-month scale for 2009 could register food
insecurity that occurred either before or after the increase. This would intro-duce an unknown amount of bias into a pre-ARRA/post-ARRA comparisonbased on the 12-month scale. To avoid this problem, we used a measure of food security based on households’ experiences over the 30-day period justprior to the survey, thus comparing conditions in mid-November to mid-December in 2009 with the same period in 2008. The 30-day scale is basedon the same concepts and statistical methods as the standard 12-month scale(Nord et al., 2006, Appendix E).11
10The CNPP updates the cost of the
TFP monthly. Year-to-year changes in
the cost of TFP are the basis by whichSNAP benefits are adjusted for food-
price inflation.
11Since December 2005, the CPS-
FSS has collected 30-day food security
data for all questions that make up the
12-month scale. These data support a
full-range 30-day scale consistent in
cognitive content with the 12-month
scale. Prior to 2005, 30-day informa-
tion was collected for only a subset of
the more severe items in the scale andsupported the more limited 30-day
scale described by Nord (2002). In this
study, the full-range 30-day scale was
used for all analyses except the year-to-
year changes in very low food security
from 2004 to 2005 and earlier years,
which used the older limited-range
30-day scale.

8/4/2019 Food Security After ARRA
http://slidepdf.com/reader/full/food-security-after-arra 16/52
10
Food Security Improved Following the 2009 ARRA Increase in SNAP Benefuts / ERR-116 Economic Research Service/USDA
Research Challenges and Methods
The period studied—from late 2008 to late 2009—was a time of unusu-ally rapid and diverse economic changes. Income and employment fell forU.S. households in general. Food prices declined. These changing economicconditions could have affected household food spending and food security,even in the absence of the ARRA SNAP provisions. For this study, we used
multivariate and difference-in-difference methods to account for changesin these economic conditions. The resulting estimates represent the effectsof the ARRA SNAP enhancements, while holding constant, to the extentpossible, other economic factors.
Unadjusted ComparisonsPre-ARRA to Post-ARRA
SNAP participation rates were calculated as percentages of householdswith incomes less than 130 percent of the poverty line. Prevalence rates of food insecurity and very low food security were calculated as percentagesof households in select income ranges and SNAP participation statuses.
Prevalence rates were compared between 2008 and 2009, and odds ratios forthe changes were calculated to compare across subpopulations with differentprevalence rates and with coefficients from the multivariate models (see box,“Using Odds Ratios to Assess Changes Over Time”).
TFP-Adjusted Food Expenditures were compared across years using mediansrather than means (averages). Medians were used because they are more robustto measurement errors, which appear to be substantial in these food expendi-ture data.12 The value of SNAP benefits were also expressed as ratios to thecost of the TFP and compared across years using both medians and means.
Multivariate (Adjusted) ComparisonsPre-ARRA to Post-ARRA
Multivariate regression methods were used to account for year-to-year differ-ences in households’ economic circumstances other than those caused by theARRA SNAP enhancements, that could have affected households’ SNAPparticipation, food spending, and food security. Logistic regression methodswere used to assess changes in SNAP participation rates and prevalence ratesof food insecurity and very low food security. Quantile regression models(estimated at the 50th percentile) were used to assess changes in the medianamount of SNAP benefits and TFP-Adjusted Food Expenditures. Linearregression models were also estimated for SNAP benefits and TFP-Adjusted
Food Expenditures as robustness checks on the quantile regression results.
The multivariate models included controls for income (quadratic in ratio of income to poverty), employment and labor force status of the adults in thehousehold (seven categories), household composition and structure (sevencategories), presence of an elderly person, race and Hispanic ethnicity (threecategories), citizenship status, education of most highly educated adult(four categories), and residence by metropolitan area (four categories) andgeographic region (four categories). The multivariate models and descriptionsof the control variables are provided in the appendix.
12Means were also compared and
adjusted means estimated as robustness
checks, using data from all households
and using “trimmed” data, omitting the
lowest and highest 5 percent of house-
holds to reduce the effects of outliersthat are more likely to be reporting or
data entry errors. The interpretation of
results, however, was based primarily
on the medians.

8/4/2019 Food Security After ARRA
http://slidepdf.com/reader/full/food-security-after-arra 17/52
11
Food Security Improved Following the 2009 ARRA Increase in SNAP Benefuts / ERR-116 Economic Research Service/USDA
Odds ratios are often used in medical and social science research to assess
the effects of treatments, policies, and programs. The use of odds ratios solves
several analytic problems that arise when comparing outcomes in percentages,
proportions, or probabilities.
A percentage is transformed to its corresponding odds by dividing by itscomplement. For example, in 2008, 25.03 percent of low-income households
were food insecure. The odds of food insecurity for this population was
0.334, calculated as 25.03/(100-25.03). In 2009, the odds of food insecurity in
low-income households was 0.314, calculated as 23.87/(100-23.87). The decline
of 1.16 percentage points in food insecurity from 2008 to 2009 can be expressed
as an odds ratio of 0.94, calculated as 0.314/0.334, and may be expressed as a
6-percent decline in the odds of food insecurity.
Odds ratios are often preferable for comparing changes in percentages across
time or in subpopulations where the base prevalence of the condition of interest
differs greatly. In many cases, program effects measured as odds ratios are
similar across subpopulations even though the base prevalence of the condition
varies widely—a trait not shared by other measures, such as the change measuredin percentage points.
A second important analytic property of odds ratios is that they give identical
results regardless of whether the occurrence of a condition or the absence of
the condition is analyzed. In the calculation above, for example, the change
of just over 1 percentage point in the prevalence of food insecurity and food
security appears larger relative to the percentage of households that were food
insecure (25.03 percent in 2008) than to the percentage that were food secure
(74.97 percent). Calculated as percentages, the change could be described
either as:
• A 4.6-percent decline in food insecurity—a drop of 1.16 percentage points
relative to an initial prevalence of 25.03 percent; or
• A 1.5-percent increase in food security—a gain of 1.16 percentage points
relative to an initial prevalence of 74.97 percent.
In principle, either statement is a valid expression of the observed change, but
it is not clear which should be used analytically. The odds ratio solves this
problem. The odds and odds ratios for food security are simply the inverse of
the corresponding statistics for food insecurity. The natural logarithms of the
odds and odds ratios (the functional form in which they are actually estimated in
multivariate analyses) are identical in magnitude for food security and for food
insecurity; they differ only in having opposite signs.
This study used odds ratios to examine pre-ARRA to post-ARRA changes in theSNAP participation rate, the prevalence of food insecurity, and the prevalence of
very low food security. In addition to the advantages described above, using odds
ratios allowed the change for each outcome on a simple “unadjusted” basis to be
compared with “adjusted” changes once factors, such as income and employment
status, were taken into account, since the analytic software calculates the results
of those multivariate analyses in odds ratios.
Using Odds Ratios To Compare Outcomes Over Time

8/4/2019 Food Security After ARRA
http://slidepdf.com/reader/full/food-security-after-arra 18/52
12
Food Security Improved Following the 2009 ARRA Increase in SNAP Benefuts / ERR-116 Economic Research Service/USDA
Each regression model included a dummy variable identifying data for house-holds in the 2009 CPS-FSS. The coefficient on this variable provides anadjusted odds ratio or adjusted change in median that represents the estimatedchange from 2008 to 2009 that would have occurred if income, employment,and other characteristics included in the models had remained the same. Forthe logistic regression models, the percentage-point change from 2008 to2009 was calculated by applying the adjusted odds ratio to the corresponding2008 percentage. For the quantile and linear regression models, the adjusted
percentage change from 2008 to 2009 was calculated as the ratio of theadjusted change in the median to the corresponding median value in 2008(multiplied by 100 to convert to percentage).
Difference-in-Difference ComparisonsPre-ARRA to Post-ARRA
Multivariate analyses can account for changes in conditions only if they varyacross households within each year and are measured in the data used for anal-ysis but cannot differentiate the effects of other factors that changed from year-to-year. The decline in food prices (described later) from 2008 to 2009 was not
accounted for by the multivariate analyses and could have important implica-tions for the study. This food price decline would probably have increased infla-tion-adjusted food expenditures and improved food security conditions amonglow-income households independent of any changes due to ARRA.
To provide an estimate of changes in food expenditures and food securitythat may be attributable to ARRA—separate from effects of the declinein food prices—we used difference-in-difference methods. Outcomes forlow-income households—the study’s primary focus—were compared withoutcomes for households with incomes from 150 to 250 percent of thepoverty line—incomes likely to make them ineligible for SNAP but wellbelow the U.S. median. (Hereafter these are referred to as “nearly-SNAP-
eligible households”). The decline in food prices is likely to have affectedfood expenditures and food security of nearly-SNAP-eligible householdssimilarly to low-income households. The ARRA SNAP enhancements,however, could not have directly affected the nearly-SNAP-eligible house-holds because almost no households in that income range were eligible forSNAP. This difference-in-difference approach nets out the effects of year-to-year changes in food prices and any other factors that impacted the twogroups similarly. Thus, the difference-in-difference results for TFP-AdjustedFood Expenditures and food security are the best estimates available in theseanalyses of the changes for low-income households that may be attributable tothe ARRA SNAP enhancements.
In the preferred specifications, difference-in-difference estimates were calcu-lated from models estimated separately for households in the two incomeranges. These models allow outcome variables to be associated with house-hold characteristics differently in the two income ranges. To check the robust-ness of the results, single-equation models were also estimated, in whichhouseholds in both income ranges were included in a single model. In thesemodels, the coefficient on an interaction variable between survey year (post-ARRA) and income range can be interpreted directly as the difference-in-difference estimate.

8/4/2019 Food Security After ARRA
http://slidepdf.com/reader/full/food-security-after-arra 19/52
13
Food Security Improved Following the 2009 ARRA Increase in SNAP Benefuts / ERR-116 Economic Research Service/USDA
SNAP Participation Increased
Expected Changes
One mechanism by which ARRA could improve food security is by attractingmore households to participate in SNAP through increased benefits. Acrossthe years, some low-income households have not participated in SNAP even
though they were eligible. Inference from economic principles suggests that thebenefits nonparticipating eligible households would receive is not sufficient tocover their application and participation costs, considering money, time, andpsychological costs (Burstein et al., 2009; Bartlett et al., 2004).13 In fiscal 2008,the year prior to ARRA, an estimated 41 million individuals were eligible forSNAP benefits in a typical month, but only 27 million (66 percent) receivedthem (USDA, Food and Nutrition Service, 2010c).14
Suspending time limits for some jobless adults without children was alsoexpected to increase SNAP participation, although the proportion of low-income households affected by this provision is relatively small.
In a post-ARRA month, the SNAP caseload can be divided conceptually intotwo groups—referred to in this report as ARRA-induced participants and nonin-
duced participants. This conceptual differentiation is useful for understandingARRA effects on observed outcomes even though the two groups cannot bereliably distinguished in the data. The ARRA increase in SNAP benefits wasexpected to change the cost-benefit calculation in favor of participation for someeligible households that otherwise would be nonparticipants. In addition, theARRA expansion of SNAP eligibility for jobless adults without children enabledsome to participate who would not otherwise have been eligible. Regardless of which ARRA provision prompted their participation, these households becameARRA-induced participants. In contrast, noninduced participants are householdsthat would have been SNAP participants regardless of whether ARRA had been
implemented. ARRA-induced participants are not equivalent to households thatentered SNAP after passage of ARRA. Some households that entered SNAPpost-ARRA would have participated in SNAP even if the pre-ARRA level of benefits had still been in effect. Such a household is both a new entrant and anoninduced participant. Some households remained in SNAP post-ARRA thatwould have left the program under pre-ARRA eligibility or benefit arrangements.They are ARRA-induced participants but are not new entrants.
According to USDA administrative data, the SNAP caseload increased from28.4 million participants in 2008 to 33.7 million in 2009, an increase of about19 percent, and one of the largest single-year increases in SNAP history(USDA, Food and Nutrition Service, 2010b). This large increase in SNAP
participation might seem to demonstrate that the ARRA SNAP changesprompted increased participation. It is impossible, however, to determine fromthe administrative data alone how much of the participation increase was attrib-utable to ARRA, and how much was due to changing economic conditions.For example, the national unemployment rate averaged 9.3 percent in 2009,compared with 5.8 percent in 2008 (U.S. Bureau of Labor Statistics, 2010),and previous research has shown that the SNAP caseload is associated with theunemployment rate (Hanson and Gundersen, 2002). Thus, the SNAP caseloadwould probably have increased from 2008 to 2009 even if the ARRA SNAP
13This description of nonparticipa-
tion assumes that the household is
making a fully informed decision
about whether to participate in SNAP.
In practice, some households might
not know they are eligible for SNAP
or may not know the amount of SNAP
benefits they would receive if they
were to apply. Outreach efforts by
FNS are designed to increase program
awareness and increase participation
by eligible households.
14Households eligible for larger
benefits, however, are more l ikely to
apply. FNS estimates that participating
households accounted for 84 percent of
the total value of benefits for which all
households (participating and nonpar-
ticipating) were eligible.

8/4/2019 Food Security After ARRA
http://slidepdf.com/reader/full/food-security-after-arra 20/52
14
Food Security Improved Following the 2009 ARRA Increase in SNAP Benefuts / ERR-116 Economic Research Service/USDA
provisions had not been implemented. The multivariate analysis accounts foreffects of changes in income, employment, and other household factors forwhich data are available in the CPS-FSS, providing an estimate of the changein SNAP participation that may be attributable to the ARRA SNAP changes.
Findings
Reported SNAP participation as a percentage of low-income households
increased by 3.3 percentage points, from 27.7 percent in 2008 to 31.0 percentin 2009 (table 2). After adjusting for changes in household conditions, SNAPparticipation increased by 3.03 percentage points from 2008 to 2009. Sincethis model took into account household income, employment, and otherhousehold factors, the results can be interpreted as an estimate of the year-to-year difference in SNAP participation among similar households in those2 years. As such, the adjusted increase must be attributable to changes from2008 to 2009 in factors other than those included in the multivariate model. Itis likely that some of the adjusted increase in SNAP participation was due toARRA, but other factors cannot be ruled out.
In past research, multivariate models have generally underestimated increasesin SNAP caseload during periods of substantial and sustained caseload growth.This may result from several processes:
• The existence of a larger pool of households with recent SNAP experi-ence who are ready and willing to rejoin if a need arises; or
• A reduction of stigma as SNAP participation is considered more sociallyacceptable when a larger share of acquaintances are participating or wheneconomic conditions are considered to be difficult.
Some of the increased SNAP participation from 2008 to 2009 could also haveresulted from increases in adjunctive eligibility. Thus, the increased SNAP
participation in 2009 is consistent with the hypothesis that the ARRA SNAPenhancements played a substantial role, but the evidence is not definitive.
Table 2
Snap participation pre-ARRA (2008) and post-ARRA (2009) among householdswith annual incomes less than 130 percent of the poverty line
Change from 2008 to 2009
SNAP participation(percent of households) Unadjusted
Adjusted for differences in income, employment,and other household characteristics1
2008 2009
Difference(percentage
points)2 Odds ratio p
Difference(percentage
points)2 Odds ratio p
27.74 31.04 3.30 1.17 <.001 3.03 1.16 <.001
SNAP= Supplemental Nutrition Assistance Program.
ARRA= American Recovery and Reinvestment Act.1The logistic regression model adjusted for household income, household employment, household composition, race and Hispanic ethnicity, U.S.citizenship, education (of most highly educated adult in the household), residence relative to metropolitan area, and census region.2Difference in percentage points corresponding to the 2009:2008 odds ratio evaluated at the 2008 percentage.
Source: USDA, Economic Research Service calculations based on data from the 2008 and 2009 Current Population Survey Food SecuritySupplement (CPS-FSS).

8/4/2019 Food Security After ARRA
http://slidepdf.com/reader/full/food-security-after-arra 21/52
15
Food Security Improved Following the 2009 ARRA Increase in SNAP Benefuts / ERR-116 Economic Research Service/USDA
SNAP Benefits Increased
Expected Increase
USDA’s Food and Nutrition Service calculated that benefits would increaseby an average of 19 percent for households in SNAP at the time the ARRAbenefit increase went into effect. However, the average percentage increase
from December 2008 to December 2009—the period that can be measuredin the CPS-FSS—is likely to have been somewhat less, because the ARRA-induced participants were likely, on average, to be somewhat better off thanthe noninduced participants and, therefore, eligible for a smaller benefit.
Findings
The median value of SNAP benefits reported by survey respondents withannual incomes less than 130 percent of the poverty line increased by 17.0percent, relative to the cost of the TFP, from 2008 to 2009 (table 3). Afteradjusting for differences in income, employment, and other household char-acteristics, SNAP benefits increased by 16.1 percent. About 4 percent of the
increase reflected a decline in TFP costs, so the increases in dollar terms(adjusted for household size but not for changes in food prices to be moredirectly comparable with the FNS prospective estimate) were about 13percent (unadjusted) and 12 percent (adjusted).
Table 3
Value of SNAP benefits relative to the cost of the Thrifty Food Plan (TFP)pre-ARRA (2008) and post-ARRA (2009) among households
that received SNAP benefits in the last 30 days before the foodsecurity surveys
Analysis sample
Value of SNAPbenefits (ratio to
cost of TFP)
Change from 2008 to 2009
UnadjustedRegression-
adjusted1
2008 2009 Percent p Percent p
Median for SNAP participanthouseholds with incomesless than 130 percent of thepoverty line .529 .619 17.0 <.001 16.1 <.001
Median for SNAP participanthouseholds at all incomelevels .500 .608 21.6 <.001 16.9 <.001
Mean for SNAP participanthouseholds with incomesless than 130 percent of the
poverty line .556 .659 18.5 <.001 18.1 <.001Mean for SNAP participanthouseholds at all income levels .530 .637 20.2 <.001 19.0 <.001
SNAP= Supplemental Nutrition Assistance Program.
ARRA= American Recovery and Reinvestment Act.1Adjusted medians were estimated using quantile regression at the 50th percentile. Adjustedmeans were estimated using linear regression. All regressions included controls for householdincome, household employment, household composition, race and Hispanic ethnicity, U.S. citizen-ship, education (of most highly educated adult in the household), residence relative to metropoli-tan area, and census region.
Source: USDA, Economic Research Service calculations based on data from the 2008 and 2009Current Population Survey Food Security Supplement (CPS-FSS).

8/4/2019 Food Security After ARRA
http://slidepdf.com/reader/full/food-security-after-arra 22/52
16
Food Security Improved Following the 2009 ARRA Increase in SNAP Benefuts / ERR-116 Economic Research Service/USDA
The increase in SNAP benefits among low-income SNAP households wassmaller than the 19 percent average projected by FNS. In part, this smallerincrease reflects the limitation of this analysis sample to households withannual incomes less than 130 percent of the poverty line. It may also reflecta change in caseload composition. The limitation of the analysis sample tolow-income SNAP households was imposed so that the results would reflectchanges in the same population as those for food expenditures and foodsecurity reported in the next section. However, some households with annual
incomes higher than 130 percent of the poverty line were eligible for SNAPduring the November-December reference period, either because their incomewas temporarily lower or because they were adjunctively eligible due toparticipation in another program. Such households were, in general, eligiblefor a smaller benefit, and, therefore experienced a larger percentage increasein benefits under ARRA. When SNAP-participant households of all incomelevels were included in the analysis sample, the adjusted increase in medianSNAP benefits relative to the cost of the TFP was 16.9 percent, correspondingto a change in dollar terms of about 12.9 percent.
Analysis of the SNAP benefits increase based on means and linear regressionmay be more directly comparable with the FNS prospective estimates. Theadjusted increase from 2008 to 2009 in the mean benefit relative to the costof the TFP was 19.0 percent, corresponding to an increase in dollar terms of about 15.0 percent. This is lower than the 19 percent estimated prospectivelyby FNS, but is near the actual change reported in FNS administrative data(14.8-percent increase in average household benefits from December 2008 toDecember 2009; USDA Food and Nutrition Service, 2010b).

8/4/2019 Food Security After ARRA
http://slidepdf.com/reader/full/food-security-after-arra 23/52
17
Food Security Improved Following the 2009 ARRA Increase in SNAP Benefuts / ERR-116 Economic Research Service/USDA
TFP-Adjusted Food Expenditures IncreasedAmong Low-Income Households
Expected Changes
Calculating the changes in TFP-Adjusted Food Expenditures that wereexpected to result from the ARRA increase in SNAP benefits and the change
in food prices involved several steps, drew on a range of previous researchevidence, and relied on several assumptions about the survey’s data.
Several previous studies examined the relationship between food expendi-tures and SNAP benefits. One review of this work stated:
“The FSP [Food Stamp Program, predecessor to SNAP] is virtu-ally certain to result in increased food purchases, if for no otherreason than that the program increases households’ incomes and theincome elasticity for food is positive. That is, increasing a household’sincome by $1,000 per year would always be expected to increase itsfood expenditures by some fraction of that amount. Economists have
debated whether giving households coupons that must be spent onfood consumed at home is more effective at increasing food expendi-tures than simply giving them a nonearmarked income supplement…a substantial body of evidence shows that coupons are more effectivethan cash in increasing food expenditures. This idea is often expressedin terms of the marginal propensity to spend on food , or MPSF.This quantity represents the increase in food expenditures per dollarincrease in income.” (Fox et al., 2004, p. 35, emphasis in original).
The conclusion of Fox et al. that food-targeted “coupons” (which now takethe form of SNAP Electronic Benefits Transfer (EBT) Cards) are “moreeffective than cash in increasing food expenditures” means that there are,
effectively, two values for the marginal propensity to spend on food, with ahigher value for SNAP benefits than for cash income. In the remainder of this report, these marginal propensities are designated as MPSFSNAP andMPSFCASH, respectively. Estimating MPSFSNAP presents considerable meth-odological challenges, and estimates using different methods have differedconsiderably. Most of the estimates summarized by Fox et al. (2004) arein the range of .25 to .50. Based on more recent research, Hanson (2010)suggests a range of .26 to .35 as most relevant to current program conditions;expectations in the present study are based on that range.
The expected size of the change in a household’s food expenditures (in dollars)due to ARRA is the product of the MPS
FSNAPfor that household and its change
in SNAP benefits (in dollars). The relationship can be written as:
[ (Food Expenditures)] = [MPSFSNAP]*[ (SNAP Benefits)].
Aggregating this expected change across SNAP participants is not straight-forward, because neither of the determinants is constant across SNAP house-holds. For any post-ARRA SNAP participant, the increase in SNAP benefitsdepends on whether or not ARRA affected the household’s participation.ARRA increased the level of SNAP benefits for noninduced participants by

8/4/2019 Food Security After ARRA
http://slidepdf.com/reader/full/food-security-after-arra 24/52
18
Food Security Improved Following the 2009 ARRA Increase in SNAP Benefuts / ERR-116 Economic Research Service/USDA
the amounts shown in the last column of table 1. ARRA-induced participantswould have received no SNAP benefits in the absence of ARRA. Therefore,for ARRA-induced participants, the increases in resources that resulted fromARRA were the full post-ARRA amounts of SNAP benefits for which theywere eligible. Thus, ARRA added relatively more to the resources of ARRA-induced participants than to those of noninduced participants eligible for thesame benefit amount and, ceteris paribus, would have added relatively moreto the food expenditures of the induced participants.
MPSFSNAP also differs across SNAP households. Noninduced SNAPhouseholds that spent little or none of their own resources for food, relyingcompletely or almost completely on SNAP benefits for their food spending,were likely to increase their food spending by the full amount of the ARRAincrease. SNAP benefits can only be spent for food, and those householdswould not have been able to reduce out-of-pocket food purchases that werealready minimal or zero. The MPSFSNAP for this subgroup would have beenat or very close to 1.0. On the other hand, households that spent substantiallymore for food than the amount of their SNAP benefits, using their own cashout-of-pocket, may not have increased food spending by the full amountof the ARRA increase. Although they were likely to increase their foodspending somewhat, this subgroup may have reduced their out-of-pocketspending for food to some extent. Research reviewed by Fox et al. (2004)supports the hypothesis that households tend to exhibit this substitutionbehavior with SNAP benefits. For those receiving relatively small SNAPbenefits, the MPSFSNAP may differ little from the expected MPSFCASH.
The expected percentage change in food expenditures by all low-incomehouseholds would be substantially smaller than the percentage change inSNAP benefits, even if food expenditures increased by the full dollar amountof the ARRA increase. Assuming that about half of low-income householdsparticipated in SNAP in 2008, and that SNAP benefits accounted for about
60 percent of their total food expenditures (based on CPS-FSS data, analysisnot shown), then total SNAP benefits accounted for approximately 30 percentof total food spending by all low-income households.
Food prices declined during the study period (2008-09), and the decline infood prices was expected to boost the quantity and quality of food purchasedby both low-income and nearly-SNAP-eligible households, as measured byTFP-Adjusted Food Expenditure (see box, “Demand for Food Was ExpectedTo Increase Due to Decline in Food Prices”). The expected increase wasestimated based on the size of the price changes and the MPSFSNAP estimatedfrom previous research. In general, the expected increase in the quantity of food purchased depends on:15
• The change in food prices relative to the prices of other goods; and
• The price elasticity of demand for food.
The change in food prices relative to the prices of other goods is approxi-mately equal to the percentage change in food prices less the percentagechange in the consumer price index (CPI) for other goods. From late-2008 tolate-2009, the change in food prices relative to other goods for low-incomehouseholds was probably between -4.4 and -5.8 percent. The former estimate
15“Quantity,” as used here, refers
not to pounds or volume of food, but
to “quality-adjusted quantity” (that is,
additional expenditure may represent
either an increase in quantity, quality, or
some mixture). This concept of quality-
adjusted quantity is represented by the
TFP-Adjusted Food Expenditure.

8/4/2019 Food Security After ARRA
http://slidepdf.com/reader/full/food-security-after-arra 25/52
19
Food Security Improved Following the 2009 ARRA Increase in SNAP Benefuts / ERR-116 Economic Research Service/USDA
is based on changes in the CPI for Food at Home and the CPI without foodand energy; the latter estimate is based on the change in the cost of the TFP(down 4.0 percent at most) and the change in CPI without food and energy.
The price elasticity of demand for food is the amount by which the quantityof food purchased changes in response to changes in food prices, so long aschanges in other factors affecting food purchases remain the same. A recentstudy estimated U.S. consumer demand systems for six broad categories of consumer goods (Taylor and Houttakker, 2009). The study’s estimates of priceelasticity of demand for food consumed at home ranged from -0.25 to -0.76 andaveraged -0.49. This means that an increase in food prices of 10 percent resultsin a decrease in quantity demanded of 4.9 percent. Based on this estimate, the
Food prices declined, on average, from late-2008 to late-2009.1 The extent of the
decline depends partly on what combination of foods—“market basket”—is used
to aggregate changes in the prices of individual food items. From December 2008
to December 2009, the cost of the Thrifty Food Plan (TFP) declined by 3.5 to
4.0 percent, depending on household composition (calculated based on data from
USDA’s Center for Nutrition Policy and Promotion). Over about the same period,
the Consumer Price Index (CPI) for Food at Home, which includes a broader set of
foods than the TFP, declined somewhat less, about 2.7 percent (calculated based
on data from the Bureau of Labor Statistics). Meanwhile, the CPI without food
and energy prices, increased from 2008 to 2009 by about 1.8 percent (calculated
based on data from the Bureau of Labor Statistics). Thus, not only did food prices
decline during the study period, but food prices fell while the prices of other goods
and services rose. Together, these two changes resulted in a decrease in the relative
price of food (relative to other goods and services) that was even larger than the
percentage decline in the cost of the TFP or the CPI for Food at Home.
According to the economic “law of demand,” a decline in the price of a product
relative to prices of other goods and services increases the quantity of that productthat households are willing and able to purchase (if other market factors remain
the same or are taken into account statistically). Therefore, it was expected
that households would, on average, have increased their TFP-Adjusted Food
Expenditures from 2008 to 2009 in the absence of any other changes.
It was important to estimate the effect of declining food prices on food expenditures
and food security so as not to attribute those changes to the ARRA SNAP
provisions that took place during the same time period. Households across the
income spectrum experienced the decline in the price of foods. The effects of the
decline in food prices on food expenditures and food security of nearly-SNAP-
eligible households (those with incomes a bit higher than the SNAP eligibility level
but below the national median) should be similar to the effects on low-income
households. Thus, changes in food expenditures and food security among nearly-SNAP-eligible households, adjusted for changes in income, employment, and other
relevant household characteristics, were considered proxies for the changes that
would have been observed in low-income households in the absence of the ARRA
SNAP provisions.
1The decline in food prices followed 2 years of unusually high food price inflation in
2007 and 2008.
Demand for Food Was Expected to IncreaseDue to Decline in Food Prices

8/4/2019 Food Security After ARRA
http://slidepdf.com/reader/full/food-security-after-arra 26/52
20
Food Security Improved Following the 2009 ARRA Increase in SNAP Benefuts / ERR-116 Economic Research Service/USDA
decline in food prices of 4.4 to 5.8 percent from late 2008 to late 2009 wouldresult in an increase in quantity demanded of 2.2 to 2.9 percent.
Based on these principles and assumptions, the expected changes in foodexpenditures by low-income households and by nearly-SNAP-eligible house-holds can be summarized as follows:
• Average TFP-adjusted SNAP benefits among all low-income households
increased by about 29 percent—the combined effects of the increase inmedian SNAP benefits among participants (16.1 percent) and the increasein participation (11 percent).16
• If average MPSFSNAP is in the range of .26 to .35, then the increase infood spending would be between 7.54 and 10.15 percent of average SNAPbenefits among all low-income households in 2008 (calculated as 29percent x .26 and 29 percent x .35).
• A change in food spending in that range would represent an increase of between 2.3 percent and 3.0 percent of average food spending for all low-income households (calculated as 30 percent of the change in averageSNAP benefits). The difference-in-difference result for low-incomehouseholds is expected to be in this range.
• An additional increase in average TFP-Adjusted Food Expenditure of 2.2 to2.9 percent is expected for both low-income households and nearly-SNAP-eligible households due to the decline in food prices. Added to the range inthe previous bullet, this gives an expected range of 4.5 to 5.9 percent for themultivariate estimate of the increase among low-income households.
Findings
Median TFP-Adjusted Food Expenditures rose by 5.4 percent from 2008 to2009 for all low-income households (adjusting for income, employment, and
other household characteristics, table 4). This change is within the rangeof the expected increase (4.5-5.9 percent). The corresponding change fornearly-SNAP-eligible households was 3.2 percent, somewhat higher than theexpected range of 2.2 to 2.9 percent.
Based on the change for nearly-SNAP-eligible households, about 3.2 percentof the increase for low-income households may have resulted from the declinein food prices (together with other factors that changed from 2008 to 2009but were not measured in the CPS-FSS data). The difference-in-differenceestimate of 2.2 percent (5.4 percent less 3.2 percent) is the best from thisstudy of the average increase in food spending by low-income households thatmay have resulted from the ARRA SNAP enhancements. The 2.2-percentestimated increase is just below the expected range (2.3-3.0 percent).Considering the uncertainties in the assumptions underlying the expectationsand the extent to which distributional issues may affect estimates based onmedians and quantile regressions, the observed increase is reasonably consis-tent with expectations.
The increase in food expenditures by SNAP participants that may be due tothe ARRA benefit increase is nearly twice the 2.2 percent estimated for all
16The combined effect is calculated
as 1.161 x 1.11.

8/4/2019 Food Security After ARRA
http://slidepdf.com/reader/full/food-security-after-arra 27/52
21
Food Security Improved Following the 2009 ARRA Increase in SNAP Benefuts / ERR-116 Economic Research Service/USDA
low-income households, considering that about half of low-income house-holds in the CPS-FSS participated in 2008 and about 56 percent in 2009.
We assessed the robustness of these results in two additional analyses. First,the models for low-income and nearly-SNAP-eligible households werere-estimated using means and linear regression models rather than mediansand quantile regression models (analysis not shown). Households with
TFP-Adjusted Food Expenditures below the 5th percentile and above the95th percentile were omitted to reduce the effects of outliers that appearedto be serious reporting errors. The results were qualitatively similar to thosein table 4. The estimated increases in TFP-Adjusted Food Expenditures weresomewhat smaller for both groups, but the difference-in-difference estimate(with adjustments for changes in household characteristics) was slightly largerin magnitude than that based on table 4 and was statistically significant.
The second robustness check was a single-equation model of the difference-in-difference. The estimates in table 4 were based on separate models forlow-income households and nearly-SNAP-eligible households. The separatemodels allow the association between each household characteristic and
food expenditure to be associated differently in the two samples. The single-equation model was estimated by including households in both income rangesin the analysis sample (analysis not shown). This model constrained theassociations of each household characteristic with food expenditure to be thesame in the two income ranges. Variables were added to the model to identifyhouseholds from the low-income sample (binary) and the interaction betweenthe low-income dummy variable and the post-ARRA variable. The coefficientof interest was that on the interaction, which can be interpreted directly as thedifference-in-difference estimate. In a second specification, two additionalinteractions were introduced—between the low-income dummy variable and
Table 4
Median food expenditures relative to the cost of the Thrifty Food Plan
(TFP) pre-ARRA (2008) and post-ARRA (2009), by income
Variable
Median
Change from 2008 to 2009
UnadjustedRegression-
adjusted1
2008 2009 Percent p Percent p
Food expenditures for house-holds with incomes less than130 percent of the poverty line(low-income households) .888 .940 5.9 <.001 5.4 <.001
Food expenditures for house-holds with incomes from 150to 250 percent of the povertyline (nearly-SNAP-eligiblehouseholds) 1.013 1.057 4.4 .010 3.2 .004
SNAP= Supplemental Nutrition Assistance Program.
ARRA= American Recovery and Reinvestment Act.1Adjusted medians were estimated using quantile regression at the 50th percentile with controlsfor household income, household employment, household composition, race and Hispanicethnicity, U.S. citizenship, education (of most highly educated adult in the household), residence
relative to metropolitan area, and census region.
Source: USDA, Economic Research Service calculations based on data from the 2008 and 2009Current Population Survey Food Security Supplement (CPS-FSS).

8/4/2019 Food Security After ARRA
http://slidepdf.com/reader/full/food-security-after-arra 28/52
22
Food Security Improved Following the 2009 ARRA Increase in SNAP Benefuts / ERR-116 Economic Research Service/USDA
income and between the low-income dummy variable and income-squared.This specification relaxed the constraint that income be associated similarlywith food expenditure in both income ranges. The results were qualitativelysimilar to those in table 4, but the difference-in-difference estimate wassmaller (1.9 percentage points in the single-equation model compared with2.5 percentage points in table 4) and was not statistically significant (p=.31).The more flexible model in table 4, however, may be a preferred specification;it seems likely that food expenditures could be associated differently with
some household characteristics in the two income ranges.

8/4/2019 Food Security After ARRA
http://slidepdf.com/reader/full/food-security-after-arra 29/52
23
Food Security Improved Following the 2009 ARRA Increase in SNAP Benefuts / ERR-116 Economic Research Service/USDA
Food Security Improved AmongLow-Income Households
Expected Changes
The increase in TFP-Adjusted Food Expenditures by low-income householdsfrom 2008 to 2009 was expected to improve the food security of low-income
households. In most households, the majority of food consumed by house-hold members is purchased—either from supermarkets or grocery storesto be eaten at home or from cafeterias, restaurants, or vending machinesto be eaten outside the home. Limited spending for food is, therefore, themain mechanism by which constrained household resources result in foodinsecurity. TFP-Adjusted Food Expenditures take into account inflation ordeflation in food prices in the TFP. Thus, from 2008 to 2009, the increase inTFP-Adjusted Food Expenditures by low-income households was expected todecrease the prevalence of food insecurity and very low food security as longas other factors affecting food security conditions remained the same or weretaken into account in the study’s multivariate methodology.
Two approaches were used to approximate the expected change in prevalencerates of food insecurity and very low food security given the 5.4-percentincrease in median TFP-Adjusted Food Expenditures. First, the associationacross years between annual statistics on median food expenditure and thetwo prevalence rates for low-income households from 2001 to 2009 wereexamined (analysis not shown). The associations implied that an increaseof 5.4 percent in median TFP-Adjusted Food Expenditures would result in adecline of 3.6 percentage points in food insecurity and 3.2 percentage pointsin very low food security. This estimate provides only a rough approxima-tion, of course, since many year-to-year differences in conditions among low-income households are not taken into account.
The second approach examined the relationships between TFP-Adjusted FoodExpenditures and prevalence rates of food insecurity and very low food secu-rity across households (fig. 1). Food insecurity was about 15 percent for house-holds that spent half the cost of the TFP, and fell to 4 percent for those spendingtwice the cost of the TFP. Very low food security fell from about 6 percent to1.7 percent across the same range. Based on the slope of the curves near thecost of the TFP (1.0 on the horizontal axis), the observed increase in medianTFP-Adjusted Food Expenditures were expected to cause a decline of 0.38percentage points in food insecurity and a decline of 0.15 percentage points invery low food security. The considerable difference between the estimates fromthese two approaches reflects limitations of observational data to shed light onthis relationship. The “natural experiment” of the ARRA SNAP enhancements
offers a rare opportunity to bring a stronger methodology to bear on the issue.
Food security was expected to improve for nearly-SNAP-eligible households,as well as for low-income households, because of the decline in food prices,although the extent of the improvement was expected to be smaller for theformer. Again, the difference in the improvement between the two groupsmay reflect the effects of ARRA SNAP enhancements on the food security of low-income households.

8/4/2019 Food Security After ARRA
http://slidepdf.com/reader/full/food-security-after-arra 30/52
24
Food Security Improved Following the 2009 ARRA Increase in SNAP Benefuts / ERR-116 Economic Research Service/USDA
Findings
From 2008 to 2009, the prevalence of food insecurity fell by 1.16 percentagepoints among low-income households, and the prevalence of very low foodsecurity fell by 1.38 percentage points (table 5). Adjusted for differences inincome, employment, and other household characteristics, these declines were
somewhat greater, 2.2 and 2.0 percentage points, respectively (table 5 and figs.2 and 3). These changes were in the range between expectations based on thetwo different approaches; they were about 60 percent of the expected declinesbased on year-to-year aggregate statistics for low-income households, and weremuch greater than expectations based on associations across households.
Food insecurity worsened somewhat from 2008 to 2009 among nearly-SNAP-eligible households in the CPS-FSS sample, rather than improving, inspite of the decline in food prices. The adjusted differences, however, wererelatively small and were not statistically significant (indicated by p valuesof .772 and .133). Thus, the food security of low-income households not onlyimproved at both levels of severity, but improved in comparison with nearly-
SNAP-eligible households.
Single-equation estimates of the difference-in-difference analysis werealmost identical to those in table 5. Difference-in-difference estimates forfood insecurity overall and for very low food security were slightly strongerbased on single-equation models.17
The 2008-09 estimated changes in food security conditions among low-income households were consistent with the expected outcomes based on
17Recognizing that interactions in lo-
gistic regression may not always admit
of direct interpretation, the single-
equation models were also estimated
as linear probability models using
ordinary least squares (OLS) regres-
sion. Those results were also consistent
with the results reported in table 5.
Figure 1
Prevalence of food insecurity and very low food security, by foodexpenditure as a ratio to the cost of the Thrifty Food Plan (TFP)
Percent of households
Notes: Depicts the bivariate relationship using data from 2005 to 2009; 2005 was the first
year for which data were collected to calculate the current 30-day measures of food security.Households were grouped in narrow ranges by TFP-Adjusted Food Expenditures, and, withineach range the prevalence rates and mean TFP-Adjusted Food Expenditures were calculated.
Source: USDA, Economic Research Service calculations based on data from the 2005-2009Current Population Survey Food Security Supplement (CPS-FSS).
0
2
4
6
8
10
12
14
16
0 0.5 1.0 1.5 2.0 2.5
Insecure, 30-day
Very low food security, 30-day
Food spending: ratio to cost of Thrifty Food Plan

8/4/2019 Food Security After ARRA
http://slidepdf.com/reader/full/food-security-after-arra 31/52
25
Food Security Improved Following the 2009 ARRA Increase in SNAP Benefuts / ERR-116 Economic Research Service/USDA
Table 5
Prevalence of food insecurity and very low food security pre-ARRA (2008) and post-ARRA (2009)
Sample and variable analyzed
Percentof households)
Bivariate(no controls)
Adjusted for differences inincome, employment, and other
household characteristics1
2008 2009 Difference2 Odds ratio p Difference2 Odds ratio p
Low-income households (incomes lessthan 130 percent of the poverty line)
(2008 N=6,998; 2009 N=7,574)
Prevalence of food insecurity 25.03 23.87 -1.16 .94 .198 -2.20 .89 .002
Prevalence of very low food security 11.27 9.89 -1.38 .86 .033 -2.00 .80 <.001
Nearly-SNAP-eligible households (incomes from 150 to 250 percent of thepoverty line)
(2008 N=7,076; 2009 N=6,980)
Prevalence of food insecurity 11.51 12.37 .86 1.09 .214 .16 1.02 .772
Prevalence of very low food security 4.22 5.08 .86 1.21 .056 .53 1.13 .133
SNAP= Supplemental Nutrition Assistance Program.
ARRA= American Recovery and Reinvestment Act.1Logistic regression models controlled for household income, household employment, household composition, race and Hispanic ethnicity, U.S.citizenship, education (of most highly educated adult in the household), residence relative to metropolitan area, and census region.2Difference in percentage points corresponding to the 2009:2008 odds ratio evaluated at the 2008 percentage.
Source: USDA, Economic Research Service calculations based on data from the 2008 and 2009 Current Population Survey Food SecuritySupplement (CPS-FSS).
Figure 2
The prevalence of food insecurity declined among households with
incomes in the eligibility range for SNAP, but not for households
with incomes somewhat higher
Percent of households food insecure
SNAP= Supplemental Nutrition Assistance Program.
ARRA= American Recovery and Reinvestment Act.
*Percentages for 2009 were regression-adjusted for differences between years in householdincome, employment, and other household characteristics.
Source: USDA, Economic Research Service calculations based on Current PopulationSurvey Food Security Supplement (CPS-FSS) data.
Households with incomesless than 130 percent of
poverty line
Households with incomes150 to 250 percent of
poverty line
0
5
10
15
20
2530 Before ARRA (2008)
After ARRA (2009, adjusted)*

8/4/2019 Food Security After ARRA
http://slidepdf.com/reader/full/food-security-after-arra 32/52
26
Food Security Improved Following the 2009 ARRA Increase in SNAP Benefuts / ERR-116 Economic Research Service/USDA
economic models of behavior. Considering that the adjusted differences takeinto account most important household-level factors, and that difference-in-difference estimates adjust to a considerable extent for changes in food pricesand other year-to-year changes that affected households across the middleand lower income range, the results strongly suggest that ARRA improvedfood security for low-income households.
Figure 3The prevalence of very low food security declined among householdswith incomes in the eligibility range for SNAP, but not for households
with incomes somewhat higher
Percent of households with very low food security
SNAP= Supplemental Nutrition Assistance Program.
ARRA= American Recovery and Reinvestment Act.
*Percentages for 2009 were regression-adjusted for differences between years in householdincome, employment, and other household characteristics.
Source: USDA, Economic Research Service calculations based on Current PopulationSurvey Food Security Supplement (CPS-FSS) data.
Before ARRA (2008)
After ARRA (2009, adjusted)*
Households with incomesless than 130 percent
of poverty line
Households with incomes150 percent to 250 percent
of poverty line
0
2
4
6
8
10
12
14
16

8/4/2019 Food Security After ARRA
http://slidepdf.com/reader/full/food-security-after-arra 33/52
27
Food Security Improved Following the 2009 ARRA Increase in SNAP Benefuts / ERR-116 Economic Research Service/USDA
TFP-Adjusted Food ExpendituresIncreased More for SNAP Households Thanfor Low-Income Non-SNAP Households
Expected Differences
Absent any misreporting of SNAP participation and changes in self-selection
into SNAP, it is clear that any changes in food expenditures and food secu-rity caused by the ARRA SNAP benefit increase would be seen only amongSNAP participants. Misreporting and changes in self-selection, however,could have substantial effects on the comparisons in outcomes betweenSNAP households and low-income non-SNAP households.
Misreporting (primarily failure to report SNAP participation) would reducethe size of pre-to-post-ARRA differences between SNAP households andlow-income non-SNAP households. The increased SNAP benefits andeligibility would improve outcomes for households that received SNAP butfailed to report it in the survey, thus registering a pre-ARRA to post-ARRAimprovement for reported nonparticipants.
It is less clear how these comparisons would be affected by the changes inself-selection that resulted from the ARRA SNAP enhancements. The effectsdepend on the characteristics of the ARRA-induced participants. Althoughthat group was probably heterogeneous, it seems likely that ARRA-inducedparticipants would, on average, have been better off than noninduced partici-pant households in 2009 and worse off than nonparticipant households;households with great unmet food needs would be more likely than better-off households to have participated even without the ARRA benefit increase.18 The change in participation status of the ARRA-induced SNAP participanthouseholds would, therefore, have improved food security for both SNAP
participants and low-income non-SNAP households in 2009, but the effect onthe difference between the two groups is not clear.
Findings
Median TFP-Adjusted Food Expenditures increased from 2008 to 2009 bya larger increment for SNAP participants than for low-income nonpartici-pants (table 6). Adjusted for differences in household income, employment,and other household characteristics, median food expenditures increased by9.1 percent among SNAP-participant households compared with 3.4 percentamong low-income non-SNAP households.
Within the CPS-FSS low-income sample, food security improved moreamong SNAP participants than among nonparticipants (table 7). Thedifference in improvement between the two groups, however, was notstatistically significant either for the prevalence of food insecurity overallor for very low food security. That is, the changes were within a rangethat could have resulted from random differences between the CPS-FSSsample and the population.
18This assumption focuses on
changes expected to result from the
ARRA increase in SNAP benefits.
Effects of the expanded eligibility for
jobless adults with no children on thefood security of SNAP participants
are difficult to predict. The number
of households that would have been
affected by this change, however,
was small relative to the total number
of SNAP households, so any effects
on the prevalence of food insecurity
among participants are likely to have
been small compared with the effects
of increased benefits.

8/4/2019 Food Security After ARRA
http://slidepdf.com/reader/full/food-security-after-arra 34/52
28
Food Security Improved Following the 2009 ARRA Increase in SNAP Benefuts / ERR-116 Economic Research Service/USDA
Table 6
Median food expenditures relative to the cost of the Thrifty Food Plan
(TFP) pre-ARRA (2008) and post-ARRA (2009) in households withannual incomes less than 130 percent of the poverty line, by SNAPparticipation status
Analysis sample
Median foodexpenditure
(ratio to TFP)
Change from 2008 to 2009
With no controls With controls1
2008 2009 Percent p Percent p
Households that receivedSNAP benefits in the 30days before the food securitysurvey .851 .944 10.9 <.001 9.1 <.001
Households that did not re-ceive SNAP benefits in the 30days before the food securitysurvey .903 .933 3.3 .052 3.4 .017
SNAP= Supplemental Nutrition Assistance Program.
ARRA= American Recovery and Reinvestment Act.1Estimated using quantile regression with controls for household income, household employment,
household composition, race and Hispanic ethnicity, U.S. citizenship, education (of most highlyeducated adult in the household), residence relative to metropolitan area, and census region.
Source: USDA, Economic Research Service calculations based on data from the 2008 and 2009Current Population Survey Food Security Supplement (CPS-FSS).
Table 7
Prevalence of food insecurity and very low food security pre-ARRA (2008) and post-ARRA (2009),
by SNAP participation status
Severity level analyzedand SNAP status
Percentof
householdsBivariate
(no controls)
Adjusted for differences in income,employment, and other household
characteristics1
2008 2009 Difference2 Odds ratio p Difference2 Odds ratio p
Food insecurity
Prevalence of food insecurity forSNAP-participant households 33.51 30.95 -2.56 .89 .159 -3.52 .85 .016
Prevalence of food insecurity forlow-income non-SNAP households 21.77 20.69 -1.08 .94 .289 -1.90 .89 .022
Very low food security
Prevalence of very low food securityfor SNAP-participant households 14.38 12.08 -2.30 .82 .082 -2.98 .77 .004
Prevalence of very low food securityfor low-income non-SNAP households 10.08 8.90 -1.18 .87 .106 -1.68 .82 .004
SNAP= Supplemental Nutrition Assistance Program.
ARRA= American Recovery and Reinvestment Act.1Regression models controlled for household income, household employment, household composition, race and Hispanic ethnicity, U.S. citizen-ship, education (of most highly educated adult in the household), residence relative to metropolitan area, and census region.2Difference in percentage points corresponding to the 2009:2008 odds ratio evaluated at the 2008 percentage.
Source: USDA, Economic Research Service calculations based on data from the 2008 and 2009 Current Population Survey Food SecuritySupplement (CPS-FSS).

8/4/2019 Food Security After ARRA
http://slidepdf.com/reader/full/food-security-after-arra 35/52
29
Food Security Improved Following the 2009 ARRA Increase in SNAP Benefuts / ERR-116 Economic Research Service/USDA
An Historical Perspectiveon Pre-ARRA to Post-ARRA Changes
The combination of a simultaneous increase in SNAP participation andimprovement in food security from the previous year that was observed in2009 has not occurred in any other recent year. In 6 of the 8 years since2001, SNAP participation, on an adjusted basis, increased year to year, as
indicated by odds ratios greater than 1.0 (table 8).19 With the exception of 2003-2004, the increases were statistically significant at the 5 percent level.However, an increase in SNAP participation was accompanied by a declinein the prevalence of very low food security among low-income householdsin only two periods (2008-09 and 2002-03) and was statistically significantonly in 2008-09. Among reported SNAP participants, the prevalence of very low food security declined in the same two periods and was statisti-cally significant in both. In all other years, the prevalence of very low foodsecurity worsened (among both low-income households overall and amonglow-income SNAP participants), although not all of the annual incrementswere statistically significant.
The uniqueness of the combination of changes from 2008 to 2009 furthersuggests that ARRA contributed to the improvement in food security amonglow-income households. The somewhat similar changes from 2002 to 2003may have resulted partly from the implementation of provisions from the2002 Farm Bill that also expanded eligibility and increased benefits for someSNAP participants.
19This analysis considered only theyears since 2001 because, prior to
2001, the CPS-FSS was not conducted
in the same month in successive years.
Table 8
Year-to-year changes in SNAP participation and the prevalence of very low food security among low-income
households, adjusted for changes in household income, employment, and other household characteristics1
Period
SNAP participation
Prevalence of very low foodsecurity (all low-income
households)
Prevalence of very low foodsecurity (low-income households
that received SNAP benefits)
Odds ratio p Odds ratio p Odds ratio p
2008-09 1.158 <.001 0.804 <.001 0.766 .004
2007-08 1.175 .001 1.366 <.001 1.115 .327
2006-07 .904 .036 1.045 .521 1.142 .237
2005-06 .960 .343 1.080 .230 1.078 .470
2004-05 1.127 .005 1.064 .283 1.134 .189
2003-04 1.014 .778 1.113 .105 1.188 .162
2002-03 1.402 <.001 .924 .236 .735 .018
2001-02 1.201 <.001 1.142 .034 1.077 .492
SNAP= Supplemental Nutrition Assistance Program.
Notes: Results in shaded cells are statistically significant with p<.10. Tabled statistics come from logistic regression models that controlled forhousehold income, household employment, household composition, race and Hispanic ethnicity, U.S. citizenship, education (of most highlyeducated adult in the household), residence relative to metropolitan area, and census region. The sample for each period included households inthe Current Population Survey Food Security Supplement for the 2 years. The statistics are for a dummy variable representing households in thesecond year.1SNAP participation and very low food security were assessed during the 30-day period prior to the food security survey (conducted in mid-December). The older 30-day food security measure described by Nord (2002) was used for comparisons from 2001-02 through 2004-05. Thefull-range 30-day measure was used for comparisons for 2005-06 through 2008-09.
Source: USDA, Economic Research Service calculations based on Current Population Survey Food Security Supplement (CPS-FSS) data.

8/4/2019 Food Security After ARRA
http://slidepdf.com/reader/full/food-security-after-arra 36/52
30
Food Security Improved Following the 2009 ARRA Increase in SNAP Benefuts / ERR-116 Economic Research Service/USDA
The larger increases in food expenditures from 2008 to 2009 by low-incomeSNAP participants relative to low-income nonparticipants resulted in medianspending becoming essentially equal by the two groups in 2009. (The samplemedian was slightly higher for SNAP participants, but the difference wassmall and was not statistically significant.) This equalization represented achange not only from 2008, but from a pattern that had persisted since at least2001 (fig. 4). From 2001 to 2008, median food spending by SNAP partici-pants ranged from 4 to 8 percent less than that by low-income non-SNAP
households. In 2009, for the first time in the decade, median food spendingby SNAP participants equaled that of non-participants.
Figure 4
Food spending relative to the cost of the Thrifty Food Plan (TFP),
by SNAP status
Ratio to cost of Thrifty Food Plan
SNAP= Supplemental Nutrition Assistance Program.
Source: USDA, Economic Research Service using statistics from USDA’s annual foodsecurity reports (Nord et al., Household Food Security in the United States, 2009 andcorresponding reports for earlier years).
2001 02 03 04 05 06 07 08 090
0.2
0.4
0.6
0.8
1.0
1.2
Received SNAP benefits in last 30 days
No SNAP benefits, income < 130 percent poverty line

8/4/2019 Food Security After ARRA
http://slidepdf.com/reader/full/food-security-after-arra 37/52
31
Food Security Improved Following the 2009 ARRA Increase in SNAP Benefuts / ERR-116 Economic Research Service/USDA
Conclusions
The food security of low-income households improved from 2008 to 2009,and our results suggest that ARRA’s SNAP increase in benefits and eligibilityplayed a substantial role in the improvement. Food security improved amonglow-income households but not among households with incomes just abovethe SNAP eligibility range. This pattern remained and was statistically signif-
icant when regression adjusted for differences in income, employment, andother household characteristics. The hypothesis that the increase in SNAPbenefits due to ARRA was largely responsible for these patterns is strength-ened by the corresponding pattern of changes in food spending. Inflation-adjusted food spending increased from 2008 to 2009 among low-incomehouseholds, and the extent of the increase was greater than that amonghouseholds with incomes just above the SNAP eligibility range but below thenational median.
In addition to assessing the effects of ARRA’s SNAP enhancements, the find-ings of this study demonstrate the effectiveness of SNAP in combating foodinsecurity. Estimating the effects of SNAP on food security is complicated
by the self-selection of more food-needy households into the program. WhileSNAP benefits presumably lessen the severity of food insecurity for partici-pants, participation in SNAP is voluntary, and households with greater unmetfood needs are, in general, more likely to participate. These two processes,self-selection and the ameliorating effect of benefits, produce opposite andpartially offsetting associations between SNAP participation and food inse-curity in observational data. Untangling the two effects has presented greatmethodological difficulties (Ratcliffe and McKernan, 2010; Nord and Golla,2009; Yen et al., 2008; Gundersen and Oliveira, 2001). The “natural experi-ment” of ARRA’s SNAP benefit increase offers the rare opportunity of anexogenous change that sheds light on the overall effects of SNAP.
If ARRA’s increase in SNAP benefits was largely responsible for thecontemporaneous improvement in food security among low-incomehouseholds, then the full effect of the program on participants must beconsiderably greater than the improvement from 2008 to 2009 among alllow-income households. The improvements would have been concentratedalmost entirely among households that participated in SNAP (approxi-mately half of low-income households). Furthermore, the improvementswould represent only the marginal effect of an increase of about 16 percentin program benefits received, while the median SNAP benefit pre-ARRAwas about three times as large as the marginal change in benefits and themaximum benefit was about six times as large as the marginal change. Withthose relationships in mind, the 20-percent decline in the odds of very low
food security and 11-percent decline in the odds of food insecurity amongall low-income households suggest a sizeable overall program effect incombating food insecurity.
Under current law, the inflation-adjusted value of SNAP benefits will declineto pre-ARRA levels over the next several years. Congress did not intend theARRA SNAP changes to be permanent. The Act specified that the maximumbenefit levels were to remain fixed in dollar terms at the higher level untilthey were surpassed by standard SNAP benefits, which were expected to

8/4/2019 Food Security After ARRA
http://slidepdf.com/reader/full/food-security-after-arra 38/52
32
Food Security Improved Following the 2009 ARRA Increase in SNAP Benefuts / ERR-116 Economic Research Service/USDA
rise due to inflation in food prices. Subsequent Congressional Acts havemandated a return to pre-ARRA benefit formulas in November 2013. Thespecial eligibility waiver for jobless adults without children lapsed in October2010. In isolation, these changes would be expected to erode the food securityimprovements realized in 2009, but the number of food-insecure householdcould still decline if improvements in the economy reduce the number of low-income households.
Our findings also raise questions about the adequacy of pre-ARRA SNAPbenefit levels for combating food insecurity and very low food security. Themarginal effect of an increase in SNAP benefits on food security may declineas benefit levels rise. At some level, further increases in benefits would havelittle to no additional effect on food security. The adequacy of SNAP benefitsvaries across households, depending on household food needs, local foodprices, nonfood consumption needs of the household, and food managementand preparation skills, among other factors. So there is no single benefit levelthat is “adequate.” The patterns of change observed in this study suggest thatpre-ARRA benefit levels were in a range where the marginal positive effectof an increase in benefits was substantial.

8/4/2019 Food Security After ARRA
http://slidepdf.com/reader/full/food-security-after-arra 39/52
33
Food Security Improved Following the 2009 ARRA Increase in SNAP Benefuts / ERR-116 Economic Research Service/USDA
References
Anderson, S.A. (ed.). “Core Indicators of Nutritional State for Difficult-To-Sample Populations,” Journal of Nutrition 120(11S): pp. 1557-1600, 1990.
Bartlett, Susan, Nancy Burstein, and William Hamilton. Food Stamp
Program Access Study: Final Report , E-FAN-03-013-3, U.S. Department
of Agriculture, Economic Research Service, 2004, http://www.ers.usda.gov/publications/efan0313/.
Bickel, G., M. Nord, C. Price, W.L. Hamilton, and J.T. Cook. Guide to
Measuring Household Food Security, Revised 2000, U.S. Department of Agriculture, Food and Nutrition Service, 2000, http://www.fns.usda.gov/ fsec/files/fsguide.pdf.
Burstein, Nancy R., Satyendra Patrabansh, Willaim L. Hamilton, and SarahY. Siegel. Understanding the Determinants of Supplemental Nutrition
Assistance Program Participation: Final Report , U.S. Department of Agriculture, Food and Nutrition Service, Office of Research and Analysis,
2009, http://www.fns.usda.gov/ora/menu/Published/SNAP/FILES/ Participation/Determinants.pdf.
Cohen, Barbara, Mark Nord, Robert Lerner, James Parry, and Kenneth Yang. Household Food Security in the United States, 1998 and 1999: Technical
Report . E-FAN-02-010, prepared by IQ Solutions and USDA, EconomicResearch Service, 2002, http://www.ers.usda.gov/publications/efan02010/.
Fox, M.K., W. Hamilton, and B. Lin. Effects of Food Assistance and
Nutrition Programs on Nutrition and Health: Volume 3, Literature
Review, FANRR-19-3, U.S. Department of Agriculture, EconomicResearch Service, 2004, http://www.ers.usda.gov/publications/fanrr19-3/.
Gundersen, C., and V. Oliveira. “The Food Stamp Program and FoodInsufficiency,” American Journal of Agricultural Economics 83:pp. 875-87, 2001.
Hamilton, W.L., J.T. Cook, W.W. Thompson, L.F. Buron, E.A. Frongillo, Jr.,C.M. Olson, and C.A. Wehler. Household Food Security in the United
States in 1995: Summary Report of the Food Security Measurement
Project , Food and Consumer Service (predecessor to USDA’s Food andNutrition Service), 1997a, http://www.fns.usda.gov/oane/menu/published/ foodsecurity/sumrpt.pdf.
Hamilton, W.L., J.T. Cook, W.W. Thompson, L.F. Buron, E.A. Frongillo, Jr.,C.M. Olson, and C.A. Wehler. Household Food Security in the United
States in 1995: Technical Report , U.S. Department of Agriculture, Foodand Consumer Service, 1997b, http://www.fns.usda.gov/oane/menu/ published/foodsecurity/tech_rpt.pdf.
Hanson, Kenneth, and Craig Gundersen. Issues in Food Assistance—How
Unemployment Affects the Food Stamp Program, FANRR 26-7, U.S.Department of Agriculture, Economic Research Service, 2002, http:// www.ers.usda.gov/publications/fanrr26/fanrr26-7/.

8/4/2019 Food Security After ARRA
http://slidepdf.com/reader/full/food-security-after-arra 40/52
34
Food Security Improved Following the 2009 ARRA Increase in SNAP Benefuts / ERR-116 Economic Research Service/USDA
Hanson, Kenneth. The Food Assistance National Input-Output Multiplier
(FANIOM) Model and Stimulus Effects of SNAP, ERR-103, U.S.Department of Agriculture, Economic Research Service, 2010, http:// www.ers.usda.gov/publications/err103.
Meyer, Bruce D., Wallace K.C. Mok, and James X. Sullivan. “TheUnder-Reporting of Transfers in Household Surveys: Its Nature andConsequences,” NBER Working Paper 15181, Cambridge, MA: National
Bureau of Economic Research, 2009, http://www.nber.org/papers/w15181/.
Nord, Mark. Food Spending Declined and Food Insecurity Increased for
Middle-Income and Low-Income Households from 2000 to 2007 , EIB-61,U.S. Department of Agriculture, Economic Research Service, 2009, http:// www.ers.usda.gov/publications/eib61/.
Nord, Mark. A 30-Day Food Security Scale for Current Population Survey
Food Security Supplement Data, E-FAN-02-015, U.S. Department of Agriculture, Economic Research Service, 2002, http://www.ers.usda.gov/ publications/efan02015/.
Nord, Mark, and Anne Marie Golla. Does SNAP Decrease Food Insecurity?
Untangling the Self-Selection Effect , ERR-85, U.S. Department of Agriculture, Economic Research Service, 2009, http://www.ers.usda.gov/ publications/err85/.
Nord, Mark, Alisha Coleman-Jensen, Margaret Andrews, and Steven Carlson. Household Food Security in the United States, 2009, ERR-108, U.S.Department of Agriculture, Economic Research Service, 2010, http:// www.ers.usda.gov/publications/err108/.
Nord, Mark, Margaret Andrews, and Steven Carlson. Household Food
Security in the United States, 2008, ERR-83, U.S. Department of Agriculture, Economic Research Service, 2009, http://www.ers.usda.gov/ publications/err83/.
Nord, Mark, Margaret Andrews, and Steven Carlson. Household Food
Security in the United States, 2005, ERR-29, U.S. Department of Agriculture, Economic Research Service, 2006, http://www.ers.usda.gov/ publications/err29/.
Oliveira, Victor. The Food Assistance Landscape: FY 2009 Annual Report ,EIB-6-7, U.S. Department of Agriculture, Economic Research Service,2010, http://www.ers.usda.gov/publications/eib6-7/.
Oliveira, Victor, and Donald Rose. Food Expenditure Estimates From the
1995 CPS Food Security Supplement: How Do They Compare with
the Consumer Expenditure Survey? Staff Report No. AGES9617, U.S.Department of Agriculture, Economic Research Service, 1996.
Ratcliffe, Caroline, and Signe-Mary McKernan. How Much Does SNAP
Reduce Food Insecurity? CCR-60, prepared by The Urban Institute undera cooperative research contract with USDA’s Economic Research Service

8/4/2019 Food Security After ARRA
http://slidepdf.com/reader/full/food-security-after-arra 41/52
35
Food Security Improved Following the 2009 ARRA Increase in SNAP Benefuts / ERR-116 Economic Research Service/USDA
Food and Nutrition Assistance Research Program, 2010, http://ddr.nal.usda.gov/dspace/bitstream/10113/42004/1/CAT31063495.pdf.
Taylor, Lester D., and H.S. Houthakker. Consumer Demand in the United
States, 3rd Edition, New York: Springer, 2009.
U.S. Department of Labor, Bureau of Labor Statistics. “Labor Force Statisticsincluding the National Unemployment Rate,” 2010, http://www.bls.gov/
cps/#data.
U.S. Department of Agriculture, Center for Nutrition Policy and Promotion.Official USDA Food Plans: Cost of Food at Home at Four Levels,
U.S. Average, December 2009, http://www.cnpp.usda.gov/Publications/ FoodPlans/2009/CostofFoodDec09.pdf.
U.S. Department of Agriculture, Food and Nutrition Service. USDA Food
and Nutrition Service Supplemental Nutrition Assistance Program (SNAP
American Recovery and Reinvestment Act Plan Update 6/18/2010, 2010a,http://www.fns.usda.gov/fns/recovery/memos/SNAP_ARRA-Plan.pdf.
U.S. Department of Agriculture, Food and Nutrition Service. Supplemental Nutrition Assistance Program Participation and Costs, 2010b, http:// www.fns.usda.gov/pd/SNAPsummary.htm.
U.S. Department of Agriculture, Food and Nutrition Service. Trends in
Supplemental Nutrition Assistance Program Participation Rates: 2001
to 2008, 2010c, http://www.fns.usda.gov/ora/MENU/Published/snap/ FILES/Participation/Trends2001-2008.pdf.
U.S. Department of Agriculture, Food and Nutrition Service. The Stimulus
Package & SNAP: How the American Recovery and Reinvestment Act
Affects SNAP Benefits and Policies, 2009, http://www.fns.usda.gov/fns/ recovery/ARRA_powerpoint.pdf.
U.S. Office of Management and Budget. Memorandum from the ExecutiveOffice of the President titled “Increased Emphasis on ProgramEvaluations,” 2009, http://www.whitehouse.gov/sites/default/files/omb/ assets/memoranda_2010/m10-01.pdf.
Wheaton, Laura. “Underreporting of Means-Tested Transfer Programs in theCPS and SIPP,” 2007 Proceedings of the American Statistical Association,Social Statistics Section, pp. 3622-29 [CD-ROM], Alexandria, VA:American Statistical Association, 2007, http://www.urban.org/ UploadedPDF/411613_transfer_programs.pdf.
Yen, Steven T., Margaret Andrews, Zhuo Chen, and David B. Eastwood.“Food Stamp Program Participation and Food Insecurity: An InstrumentalVariables Approach,” American Journal of Agricultural Economics 90(1):pp. 117-32, 2008.

8/4/2019 Food Security After ARRA
http://slidepdf.com/reader/full/food-security-after-arra 42/52
36
Food Security Improved Following the 2009 ARRA Increase in SNAP Benefuts / ERR-116 Economic Research Service/USDA
Appendix: Multivariate Regression Models
Appendix tables 1-8 present the regression models from which the adjustedodds ratios and changes in TFP-Adjusted Food Expenditures in tables 2-7were estimated.
The variables in the regression models were calculated as follows (CPS-FSS
variable names are in upper case in parentheses):
Post ARRA—This dummy variable identifies households interviewed in theDecember 2009 CPS-FSS, after the implementation of the ARRA SNAPbenefit increase (versus those interviewed in the December 2008 CPS-FSS).The coefficients on Post ARRA in the logistic regression models are theadjusted odds ratios in tables 2, 5, and 7. The coefficients on Post ARRA inthe quantile regression models were used to calculate the “changes from 2008to 2009 with controls” values in tables 3, 4, and 6.
Income (ratio to poverty line)—Combined income of all family membersfrom all sources in the 12 months prior to the survey is reported in 16 catego-
ries (HUFAMINC). We approximated income for each household at thecenter of the reported range and divided by a poverty line for that householdto adjust for household size and composition. We based household povertylines on the Census Bureau’s table of poverty thresholds for individuals andfamilies for the year of the survey, taking into account the numbers of adultsand children in the household and whether the household reference personwas younger or older than 65. The square of this ratio was also entered toallow for a nonlinear (quadratic) association.
In our analyses, we treated each household in the CPS-FSS data (comprisingall individuals living together in an owned or rented unit) as a singleeconomic unit. The CPS-FSS collects data on SNAP receipt, food spending,
and food security at the household level, so analysis at the household level isthe only feasible approach. Not all multimember households are “families”as defined in the Census Bureau poverty thresholds and poverty statistics,and may not be coterminous with SNAP units as defined for administra-tive purposes. The proportion of households with multiple economic unitsis small, however, so these approximations are not likely to distort analyticresults substantially.
Income in lowest reported category—Identifies households that reportedannual income in the lowest category (less than $5,000). Previous researchhas found that some households in this category have relatively highconsumption even though their income is low. In some cases, income may be
only temporarily low and the household can maintain consumption levels bydrawing on assets or credit.
Labor force status of primary earner—The employment/labor force statusof the primary earner in each household was assigned in a two-step process.First, the status of each adult in the household was assigned based on the“monthly labor force recode” (PEMLR) and “full-time/part-time work status” (PRWKSTAT). Those variables are, in turn, calculated by the CensusBureau based on a detailed series of questions about each adult’s employ-

8/4/2019 Food Security After ARRA
http://slidepdf.com/reader/full/food-security-after-arra 43/52
37
Food Security Improved Following the 2009 ARRA Increase in SNAP Benefuts / ERR-116 Economic Research Service/USDA
ment, working hours, unemployment, job searches, and the reasons for notworking. The categories are:
1. Employed full time;
2. Not in the labor force—retired;
3. Employed part time for noneconomic reasons (i.e., do not want towork more hours);
4. Employed part time for economic reasons (i.e., want to work more hours, unable to find a job with more hours);
5. Unemployed—looking for work;
6. Not in the labor force due to disability; and
7. Not in the labor force for reasons other than retirement ordisability.
The primary earner was then identified as the adult with the lowest numberedstatus, and that status was assigned to the household.
Household composition—Household composition was assigned in one of seven categories, depending on the number of adults, whether or not childrenwere present (and whether their parent was in the primary family), and themarital status of the household reference person. Cohabiting couples withchildren were assigned as single male with child/children, single female withchild/children, or other household with child/children, depending on the sexof the household reference person and the relationships of children in thehousehold. The categories are:
• Married couple with child/children;
• Single male with child/children;
• Single female with child/children;
• Other household with child/children (i.e., children in complex livingarrangements, such as children of unmarried partner, housemate, orborder);
• Two or more adults—no child;
• Male living alone; or
• Female living alone.
One or more elderly persons in the household —At least one person in thehousehold was 65 years old or older.
Race and Hispanic ethnicity—Based on race (PDTRACE) and Hispanicethnicity (PRDTHSP) of household reference person. Non-Hispanic personsreporting a race other than Black or more than one race were not separatelyidentified and were included with White-non-Hispanics in the reference cate-gory for the regression analyses.

8/4/2019 Food Security After ARRA
http://slidepdf.com/reader/full/food-security-after-arra 44/52
38
Food Security Improved Following the 2009 ARRA Increase in SNAP Benefuts / ERR-116 Economic Research Service/USDA
Noncitizen household reference person—Household reference personforeign born and not a citizen of the United States (PRCITSHP=5).
Educational attainment of most highly educated adult—Based on thehighest value of PEEDUCA among all adults in the household.
Metropolitan/nonmetropolitan residence—Based on variables GTCBSASTand GTMETSTA, which operationalize the 2003 Office of Management and
Budget delineation. The reference category comprises households within ametropolitan area but not in the “principal city.” In most cases, this meansin suburban or exurban areas outside of the incorporated area of any of the large densely populated cities of the metropolitan area. The category,“Metropolitan—not specifically identified” refers to households withinmetropolitan areas for which the location inside or outside of principal citieswas not identified to avoid possible breach of confidentiality (about 17 percentof metropolitan households).
Census Region—The four census regions are:
• Northeast: Connecticut, Maine, Massachusetts, New Hampshire, New
Jersey, New York, Pennsylvania, Rhode Island, Vermont
• Midwest: Illinois, Indiana, Iowa, Kansas, Michigan, Minnesota,Missouri, Nebraska, North Dakota, Ohio, South Dakota, Wisconsin
• South: Alabama, Arkansas, Delaware, District of Columbia, Florida,Georgia, Kentucky, Louisiana, Maryland, Mississippi, North Carolina,Oklahoma, South Carolina, Tennessee, Texas, Virginia, West Virginia
• West: Alaska, Arizona, California, Colorado, Hawaii, Idaho, Montana,Nevada, New Mexico, Oregon, Utah, Washington, Wyoming

8/4/2019 Food Security After ARRA
http://slidepdf.com/reader/full/food-security-after-arra 45/52
39
Food Security Improved Following the 2009 ARRA Increase in SNAP Benefuts / ERR-116 Economic Research Service/USDA
Appendix table 1
Logistic regression of SNAP participation in the 30 days prior to survey on post-ARRA versus pre-ARRA
period, with controls for household characteristics1
Characteristic Odds ratio p
Intercept 0.860 .435
Post-ARRA 1.158 <.001
Income (ratio to poverty line) 1.290 .586
Income (ratio to poverty line) squared .280 <.001Income in lowest reported category .595 <.001
Labor force status of primary earner (reference: employed full time)
Out of labor force—retired 2.143 <.001
Part-time for noneconomic reasons 1.278 .003
Part-time for economic reasons 1.817 <.001
Unemployed 2.706 <.001
Out of labor force—disabled 5.579 <.001
Out of labor force—not retired or disabled 2.087 <.001
Household composition (reference: married couple with child/children)
Single male with child/children .824 .167
Single female with child/children 1.846 <.001
Other household with child/children 1.644 <.001
Two or more adults—no child .409 <.001
Male living alone .253 <.001
Female living alone .389 <.001
One or more elderly persons in the household .659 <.001
Race and Hispanic ethnicity (reference: White non-Hispanic)
Black non-Hispanic 1.300 <.001
Hispanic 1.088 .185
Noncitizen household reference person .586 <.001
Educational attainment of most highly educated adult (reference: high school or GED)
Less than high school 1.217 <.001
Some college—no 4-year degree .890 .021
Bachelor degree or higher .444 <.001
Metropolitan/nonmetropolitan residence (reference: metropolitan, not in principle city)
Metropolitan—principal city 1.109 .056
Metropolitan—not specifically identified 1.136 .050
Not in metropolitan area 1.129 .043
Census region (reference: Northeast)
Midwest 1.005 .940
South .668 <.001
West .554 <.001Number of cases 14,572
Somers’ D .566
SNAP= Supplemental Nutrition Assistance Program.
ARRA= American Recovery and Reinvestment Act.1The sample comprised households with annual incomes less than 130 percent of the Federal poverty line.
Source: USDA, Economic Research Service calculations based on data from the December 2008 and December 2009 Current Population SurveyFood Security Supplements (CPS-FSS).

8/4/2019 Food Security After ARRA
http://slidepdf.com/reader/full/food-security-after-arra 46/52
40
Food Security Improved Following the 2009 ARRA Increase in SNAP Benefuts / ERR-116 Economic Research Service/USDA
Appendix table 2
Quantile regression at median of SNAP benefits (ratio to Thrifty Food Plan) on post-ARRA versus pre-ARRA
period, with controls for household characteristics1
Characteristic Coefficient p
Intercept 0.555 <.001
Post-ARRA .085 <.001
Income (ratio to poverty line) .334 .027
Income (ratio to poverty line) squared -.280 .006Income in lowest reported category .186 <.001
Labor force status of primary earner (reference: employed full time)
Out of labor force—retired .013 .704
Part-time for noneconomic reasons .029 .296
Part-time for economic reasons .060 .028
Unemployed .076 <.001
Out of labor force—disabled -.014 .541
Out of labor force—not retired or disabled .132 <.001
Household composition (reference: married couple with child/children)
Single male with child/children .031 .503
Single female with child/children .070 <.001
Other household with child/children .053 .020
Two or more adults—no child -.093 <.001
Male living alone .029 .414
Female living alone .059 .051
One or more elderly persons in the household -.183 <.001
Race and Hispanic ethnicity (reference: White non-Hispanic)
Black non-Hispanic -.047 .005
Hispanic -.040 .039
Noncitizen household reference person -.104 <.001
Educational attainment of most highly educated adult (reference: high school or GED)
Less than high school -.014 .384
Some college, no 4-year degree -.002 .868
Bachelor degree or higher .000 .994
Metropolitan/nonmetropolitan residence (reference: metropolitan, not in principle city)
Metropolitan—principal city .000 .985
Metropolitan—not specifically identified -.007 .743
Not in metropolitan area -.041 .010
Census region (reference: Northeast)
Midwest -.082 <.001
South -.128 <.001
West -.106 <.001Number of cases 4,091
SNAP= Supplemental Nutrition Assistance Program.
ARRA= American Recovery and Reinvestment Act.1The sample comprised households with annual incomes less than 130 percent of the Federal poverty line that received SNAP benefits in the 30days prior to the survey and reported the amount of benefit received.
Source: USDA, Economic Research Service calculations based on data from the December 2008 and December 2009 Current Population SurveyFood Security Supplements (CPS-FSS).

8/4/2019 Food Security After ARRA
http://slidepdf.com/reader/full/food-security-after-arra 47/52
41
Food Security Improved Following the 2009 ARRA Increase in SNAP Benefuts / ERR-116 Economic Research Service/USDA
Appendix table 3
Quantile regression at median of usual food spending (ratio to Thrifty Food Plan) on post-ARRA versus
pre-ARRA period, with controls for household characteristics, by income range1
Characteristic
Income <130 percentof poverty line
Income 150-250 percentof poverty line
Coefficient p Coefficient p
Intercept 0.887 <.001 0.304 .340
Post-ARRA.048 <.001 .032 .004
Income (ratio to poverty line) -.198 .135 .529 .098
Income (ratio to poverty line) squared .140 .076 -.108 .179
Income in lowest reported category -.023 .525
Labor force status of primary earner (reference: employed full time)
Out of labor force—retired -.013 .611 .007 .753
Part-time for noneconomic reasons -.040 .067 -.006 .850
Part-time for economic reasons -.057 .067 -.014 .790
Unemployed -.010 .676 -.033 .355
Out of labor force—disabled -.039 .057 -.042 .463
Out of labor force—not retired or disabled .044 .107 .061 .385
Household composition (reference: married couple with child/children)
Single male with child/children .018 .692 .043 .524
Single female with child/children .100 <.001 .127 <.001
Other household with child/children .050 .092 -.022 .540
Two or more adults—no child .097 <.001 .089 <.001
Male living alone .327 <.001 .363 <.001
Female living alone .333 <.001 .304 <.001
One or more elderly persons in the household -.085 <.001 -.063 .001
Race and Hispanic ethnicity (reference: White non-Hispanic)
Black non-Hispanic -.057 .001 -.098 <.001
Hispanic -.051 .014 -.032 .141
Noncitizen household reference person -.006 .814 -.005 .860
Educational attainment of most highly educated adult (reference: high school or GED)
Less than high school .004 .832 .004 .909
Some college, no 4-year degree .024 .115 .023 .105
Bachelor degree or higher .083 <.001 .056 <.001
Metropolitan/nonmetropolitan residence (reference: metropolitan, not in principle city)
Metropolitan—principal city .005 .778 -.015 .381
Metropolitan—not specifically identified -.022 .187 -.014 .484
Not in metropolitan area -.046 <.001 -.070 <.001
Census region (reference: Northeast)
Midwest -.087 <.001 -.049 .009South -.045 .016 .013 .503
West -.024 .269 .008 .717
Number of cases 13,773 13,435
ARRA= American Recovery and Reinvestment Act.1About 5 percent of households did not report their food spending and were omitted from these analyses.
Source: USDA, Economic Research Service calculations based on data from the December 2008 and December 2009 Current Population SurveyFood Security Supplements (CPS-FSS).

8/4/2019 Food Security After ARRA
http://slidepdf.com/reader/full/food-security-after-arra 48/52
42
Food Security Improved Following the 2009 ARRA Increase in SNAP Benefuts / ERR-116 Economic Research Service/USDA
Appendix table 4
Logistic regression of food insecurity1 in 30 days prior to survey on post-ARRA versus pre-ARRA period,
with controls for household characteristics, by income range
Characteristic
Income <130 percentof poverty line
Income 150-250 percentof poverty line
Odd ratio p Odd ratio p
Intercept 0.290 <.001 2.518 .489
Post-ARRA.886 .002 1.016 .772
Income (ratio to poverty line) 2.006 .121 .105 .099
Income (ratio to poverty line) squared .523 .017 1.524 .225
Income in lowest reported category .908 .417
Labor force status of primary earner (reference: employed full time)
Out of labor force—retired .728 .001 .414 <.001
Part-time for noneconomic reasons .883 .116 1.122 .314
Part-time for economic reasons 1.833 <.001 2.175 <.001
Unemployed 2.163 <.001 3.192 <.001
Out of labor force—disabled 2.268 <.001 1.919 <.001
Out of labor force—not retired or disabled 1.098 .265 .869 .512
Household composition (reference: married couple with child/children)
Single male with child/children 1.102 .470 1.160 .383
Single female with child/children 1.305 <.001 1.169 .110
Other household with child/children 1.012 .905 .985 .927
Two or more adults—no child .969 .640 .886 .113
Male living alone .787 .003 .651 <.001
Female living alone .918 .272 .859 .111
One or more elderly persons in the household .655 <.001 .551 <.001
Race and Hispanic ethnicity (reference: White non-Hispanic)
Black non-Hispanic 1.088 .116 .935 .410
Hispanic 1.293 <.001 1.040 .635
Noncitizen household reference person 1.014 .841 .997 .976
Educational attainment of most highly educated adult (reference: high school or GED)
Less than high school 1.027 .629 1.182 .104
Some college—no 4-year degree 1.160 .002 1.021 .738
Bachelor degree or higher .692 <.001 .588 <.001
Metropolitan/nonmetropolitan residence (reference: metropolitan, not in principle city)
Metropolitan—principal city .868 .005 1.077 .266
Metropolitan—not specifically identified .876 .034 .946 .493
Not in metropolitan area .720 <.001 .663 <.001
Census region (reference: Northeast)
Midwest .999 .990 1.236 .023South 1.003 .957 1.267 .006
West .994 .930 1.136 .173
Number of cases 14,572 14,056
Somers’ D .330 .398
ARRA= American Recovery and Reinvestment Act.1Food insecure households include both those with low and very low food security.
Source: USDA, Economic Research Service calculations based on data from the December 2008 and December 2009 Current Population SurveyFood Security Supplements (CPS-FSS).

8/4/2019 Food Security After ARRA
http://slidepdf.com/reader/full/food-security-after-arra 49/52
43
Food Security Improved Following the 2009 ARRA Increase in SNAP Benefuts / ERR-116 Economic Research Service/USDA
Appendix table 5
Logistic regression of very low food security in 30 days prior to survey on post-ARRA versus pre-ARRA
period, with controls for household characteristics, by income range
Characteristic
Income <130 percentof poverty line
Income 150-250 percentof poverty line
Odd ratio p Odd ratio p
Intercept 0.121 <.001 0.086 .222
Post-ARRA.804 <.001 1.131 .133
Income (ratio to poverty line) 1.707 .399 .922 .969
Income (ratio to poverty line) squared .538 .105 .887 .819
Income in lowest reported category .817 .214
Labor force status of primary earner (reference: employed full time)
Out of labor force—retired .632 .002 .474 <.001
Part-time for noneconomic reasons .801 .054 .904 .594
Part-time for economic reasons 1.787 <.001 2.341 <.001
Unemployed 2.148 <.001 2.682 <.001
Out of labor force—disabled 1.905 <.001 2.203 <.001
Out of labor force—not retired or disabled 1.112 .359 1.125 .683
Household composition (reference: married couple with child/children)
Single male with child/children 1.149 .470 .882 .688
Single female with child/children 1.149 .148 1.461 .014
Other household with child/children .897 .482 .799 .443
Two or more adults—no child 1.401 <.001 1.390 .007
Male living alone 1.344 .006 1.144 .371
Female living alone 1.483 <.001 1.400 .023
One or more elderly persons in the household .536 <.001 .418 <.001
Race and Hispanic ethnicity (reference: White non-Hispanic)
Black non-Hispanic .986 .845 .982 .879
Hispanic 1.065 .453 .895 .393
Noncitizen household reference person .773 .011 .848 .321
Educational attainment of most highly educated adult (reference: high school or GED)
Less than high school 1.086 .283 1.438 .012
Some college—no 4-year degree 1.192 .009 1.007 .940
Bachelor degree or higher .619 <.001 .456 <.001
Metropolitan/nonmetropolitan residence (reference: metropolitan, not in principle city)
Metropolitan—principal city .792 <.001 .950 .607
Metropolitan—not specifically identified .875 .112 .757 .028
Not in metropolitan area .654 <.001 .558 <.001
Census region (reference: Northeast)
Midwest .960 .662 1.321 .048South .973 .746 1.137 .334
West 1.076 .427 1.283 .081
Number of cases 14,572 14,056
Somers’ D .329 .437
ARRA= American Recovery and Reinvestment Act.
Source: USDA, Economic Research Service calculations based on data from the December 2008 and December 2009 Current Population SurveyFood Security Supplements (CPS-FSS).

8/4/2019 Food Security After ARRA
http://slidepdf.com/reader/full/food-security-after-arra 50/52
44
Food Security Improved Following the 2009 ARRA Increase in SNAP Benefuts / ERR-116 Economic Research Service/USDA
Appendix table 6
Quantile regression at median of usual food spending (ratio to Thrifty Food Plan) on post-ARRA versus
pre-ARRA period, with controls for household characteristics, by SNAP participation during 30 days priorto the survey1
Characteristic
SNAP-participanthouseholds
Non-SNAPhouseholds
Coefficient p Coefficient p
Intercept 0.924 <.001 0.780 <.001
Post-ARRA .077 <.001 .031 .017
Income (ratio to poverty line) -.112 .585 -.010 .958
Income (ratio to poverty line) squared .068 .613 .040 .728
Income in lowest reported category .025 .625 .012 .798
Labor force status of primary earner (reference: employed full time)
Out of labor force—retired -.079 .138 -.003 .921
Part-time for noneconomic reasons .020 .624 -.072 .010
Part-time for economic reasons -.015 .695 -.099 .003
Unemployed -.001 .973 -.022 .520
Out of labor force—disabled -.065 .036 -.005 .874
Out of labor force—not retired or disabled .068 .166 .006 .859Household composition (reference: married couple with child/children)
Single male with child/children .019 .785 .079 .206
Single female with child/children .101 <.001 .074 .002
Other household with child/children .075 .072 .012 .725
Two or more adults—no child .018 .692 .123 <.001
Male living alone .234 <.001 .361 <.001
Female living alone .323 <.001 .359 <.001
One or more elderly persons in the household -.030 .507 -.102 <.001
Race and Hispanic ethnicity (reference: White non-Hispanic)
Black non-Hispanic -.008 .816 -.090 <.001
Hispanic -.017 .655 -.047 .031Noncitizen household reference person -.049 .236 .022 .282
Educational attainment of most highly educated adult (reference: high school or GED)
Less than high school .014 .643 -.006 .789
Some college—no 4-year degree .006 .813 .053 .004
Bachelor degree or higher .088 .038 .082 .002
Metropolitan/nonmetropolitan residence (reference: metropolitan, not in principle city)
Metropolitan—principal city -.018 .595 .009 .659
Metropolitan—not specifically identified -.053 .071 -.027 .235
Not in metropolitan area -.055 .039 -.034 .063
Census region (reference: Northeast)
Midwest -.111 <.001 -.095 <.001
South -.120 <.001 -.020 .351
West -.116 .001 -.003 .906
Number of cases 4,082 9.691
SNAP= Supplemental Nutrition Assistance Program.
ARRA= American Recovery and Reinvestment Act.1Both samples were limited to households with annual incomes less than 130 percent of the Federal poverty line. About 5 percent of low-incomehouseholds did not report their food spending and were omitted from the analyses.
Source: USDA, Economic Research Service calculations based on data from the December 2008 and December 2009 Current Population SurveyFood Security Supplements (CPS-FSS).

8/4/2019 Food Security After ARRA
http://slidepdf.com/reader/full/food-security-after-arra 51/52
45
Food Security Improved Following the 2009 ARRA Increase in SNAP Benefuts / ERR-116 Economic Research Service/USDA
Appendix table 7
Logistic regression of food insecurity in 30 days prior to survey on post-ARRA versus pre-ARRA period,
with controls for household characteristics, by SNAP participation during 30 days prior to the survey1
Characteristic
SNAP-participanthouseholds
Non-SNAPhouseholds
Odd ratio p Odd ratio p
Intercept 0.407 .003 0.283 <.001
Post-ARRA .850 .016 .891 .022
Income (ratio to poverty line) .973 .970 1.535 .480
Income (ratio to poverty line) squared 1.100 .837 .577 .122
Income in lowest reported category .892 .522 .849 .317
Labor force status of primary earner (reference: employed full time)
Out of labor force—retired .809 .235 .668 <.001
Part-time for noneconomic reasons .950 .726 .857 .105
Part-time for economic reasons 1.592 .001 1.945 <.001
Unemployed 1.640 <.001 2.562 <.001
Out of labor force—disabled 2.489 <.001 1.744 <.001
Out of labor force—not retired or disabled 1.444 .006 .868 .212
Household composition (reference: married couple with child/children)
Single male with child/children 1.230 .355 1.021 .901
Single female with child/children 1.182 .116 1.438 <.001
Other household with child/children .923 .614 1.084 .547
Two or more adults—no child 1.403 .010 .893 .158
Male living alone .796 .159 .830 .048
Female living alone .950 .721 .957 .641
One or more elderly persons in the household .861 .281 .614 <.001
Race and Hispanic ethnicity (reference: White non-Hispanic)
Black non-Hispanic .921 .337 1.179 .018
Hispanic 1.073 .498 1.362 <.001
Noncitizen household reference person 1.082 .559 1.000 .996
Educational attainment of most highly educated adult (reference: high school or GED)
Less than high school .937 .467 1.074 .325
Some college—no 4-year degree 1.101 .239 1.206 .002
Bachelor degree or higher .961 .805 .673 <.001
Metropolitan/nonmetropolitan residence (reference: metropolitan, not in principle city)
Metropolitan—principal city .896 .222 .868 .023
Metropolitan—not specifically identified .874 .206 .878 .096
Not in metropolitan area .768 .008 .682 <.001
Census region (reference: Northeast)
Midwest .956 .670 1.048 .612
South .918 .377 1.135 .114
West .850 .166 1.150 .105Number of cases 4,268 10,304
Somers’ D .235 .354
SNAP= Supplemental Nutrition Assistance Program.
ARRA= American Recovery and Reinvestment Act.1Both samples were limited to households with annual incomes less than 130 percent of the Federal poverty line. Food insecure householdsinclude both those with low and very low food security.
Source: USDA, Economic Research Service calculations based on data from the December 2008 and December 2009 Current Population SurveyFood Security Supplements (CPS-FSS).

8/4/2019 Food Security After ARRA
http://slidepdf.com/reader/full/food-security-after-arra 52/52
Appendix table 8
Logistic regression of very low food security in 30 days prior to survey on post-ARRA versus pre-ARRA
period, with controls for household characteristics, by SNAP participation during 30 days prior to thesurvey1
Characteristic
SNAP-participanthouseholds
Non-SNAPhouseholds
Odd ratio p Odd ratio p
Intercept 0.150 <.001 0.129 <.001
Post-ARRA .766 .004 .818 .004
Income (ratio to poverty line) 2.562 .373 .758 .742
Income (ratio to poverty line) squared .421 .204 .874 .785
Income in lowest reported category .943 .817 .685 .087
Labor force status of primary earner (reference: employed full time)
Out of labor force—retired .736 .239 .571 .002
Part-time for noneconomic reasons .932 .739 .758 .045
Part-time for economic reasons 1.276 .252 2.038 <.001
Unemployed 1.537 .008 2.572 <.001
Out of labor force—disabled 1.878 <.001 1.611 <.001
Out of labor force—not retired or disabled 1.276 .203 1.004 .980
Household composition (reference: married couple with child/children)
Single male with child/children 1.440 .234 1.008 .973
Single female with child/children 1.009 .957 1.372 .011
Other household with child/children .821 .421 .972 .889
Two or more adults—no child 2.129 <.001 1.216 .089
Male living alone 1.452 .082 1.343 .022
Female living alone 1.487 .044 1.534 .001
One or more elderly persons in the household .603 .012 .547 <.001
Race and Hispanic ethnicity (reference: White non-Hispanic)
Black non-Hispanic .761 .022 1.146 .143
Hispanic .887 .406 1.114 .303
Noncitizen household reference person .658 .056 .809 .072Educational attainment of most highly educated adult (reference: high school or GED)
Less than high school .957 .721 1.172 .113
Some college—no 4-year degree 1.152 .206 1.229 .014
Bachelor degree or higher .771 .281 .624 <.001
Metropolitan/nonmetropolitan residence (reference: metropolitan, not in principle city)
Metropolitan—principal city .820 .109 .795 .007
Metropolitan—not specifically identified .892 .417 .868 .179
Not in metropolitan area .683 .005 .622 <.001
Census region (reference: Northeast)
Midwest .798 .114 1.121 .368
South .846 .196 1.129 .283West .852 .317 1.297 .031
Number of cases 4,268 10,304
Somers’ D .314 .359
SNAP= Supplemental Nutrition Assistance Program