food outlook - biannual report on global food markets · of economists, whose names and email...
TRANSCRIPT

November 2019
Food Outlook B IANNUAL REPORT ON GLOBAL FOOD MARKETS

ACKNOWLEDGEMENTS
The Food Outlook report is a product of the FAO Trade and Markets Division. This report is prepared under the overall guidance of Boubaker Ben-Belhassen,
Director, and Abdolreza Abbassian, Senior Economist. It is written by a team of economists, whose names and email contacts appear under their respective contributions. The report benefited from research support by many staff, namely, David Bedford, Julie Claro, Harout Dekermendjian, Lavinia Lucarelli, Emanuele Marocco, Marco Milo and the fisheries statistical team.
Special thanks go to David Bedford and Lavinia Lucarelli for preparing the charts and statistical tables and to Valentina Banti for her administrative support. Additionally, the team is grateful to Ettore Vecchione for the desktop publishing and to Clare Pedrick for her valuable editorial assistance.
Required citation:FAO. 2019 Food Outlook - Biannual Report on Global Food Markets – November 2019. Rome.
The designations employed and the presentation of material in this information product do not imply the expression of any opinion whatsoever on the part of the Food and Agriculture Organization of the United Nations (FAO) concerning the legal or development status of any country, territory, city or area or of its authorities, or concerning the delimitation of its frontiers or boundaries. The mention of specific companies or products of manufacturers, whether or not these have been patented, does not imply that these have been endorsed or recommended by FAO in preference to others of a similar nature that are not mentioned.
The views expressed in this information product are those of the author(s) and do not necessarily reflect the views or policies of FAO.
ISBN 978-92-5-131932-1© FAO, 2019
Some rights reserved. This work is made available under the Creative Commons Attribution-NonCommercial-ShareAlike 3.0 IGO licence (CC BY-NC-SA 3.0 IGO; https://creativecommons.org/licenses/by-nc-sa/3.0/igo/legalcode/legalcode).
Under the terms of this licence, this work may be copied, redistributed and adapted for non-commercial purposes, provided that the work is appropriately cited. In any use of this work, there should be no suggestion that FAO endorses any specific organization, products or services. The use of the FAO logo is not permitted. If the work is adapted, then it must be licensed under the same or equivalent Creative Commons licence. If a translation of this work is created, it must include the following disclaimer along with the required citation: “This translation was not created by the Food and Agriculture Organization of the United Nations (FAO). FAO is not responsible for the content or accuracy of this translation. The original [Language] edition shall be the authoritative edition.
Disputes arising under the licence that cannot be settled amicably will be resolved by mediation and arbitration as described in Article 8 of the licence except as otherwise provided herein. The applicable mediation rules will be the mediation rules of the World Intellectual Property Organization http://www.wipo.int/amc/en/mediation/rules and any arbitration will be conducted in accordance with the Arbitration Rules of the United Nations Commission on International Trade Law (UNCITRAL).
Third-party materials. Users wishing to reuse material from this work that is attributed to a third party, such as tables, figures or images, are responsible for determining whether permission is needed for that reuse and for obtaining permission from the copyright holder. The risk of claims resulting from infringement of any third-party-owned component in the work rests solely with the user.
Sales, rights and licensing. FAO information products are available on the FAO website (www.fao.org/publications) and can be purchased through [email protected]. Requests for commercial use should be submitted via: www.fao.org/contact-us/licence-request. Queries regarding rights and licensing should be submitted to: [email protected].
Photo credits:©FAO©Shutterstock
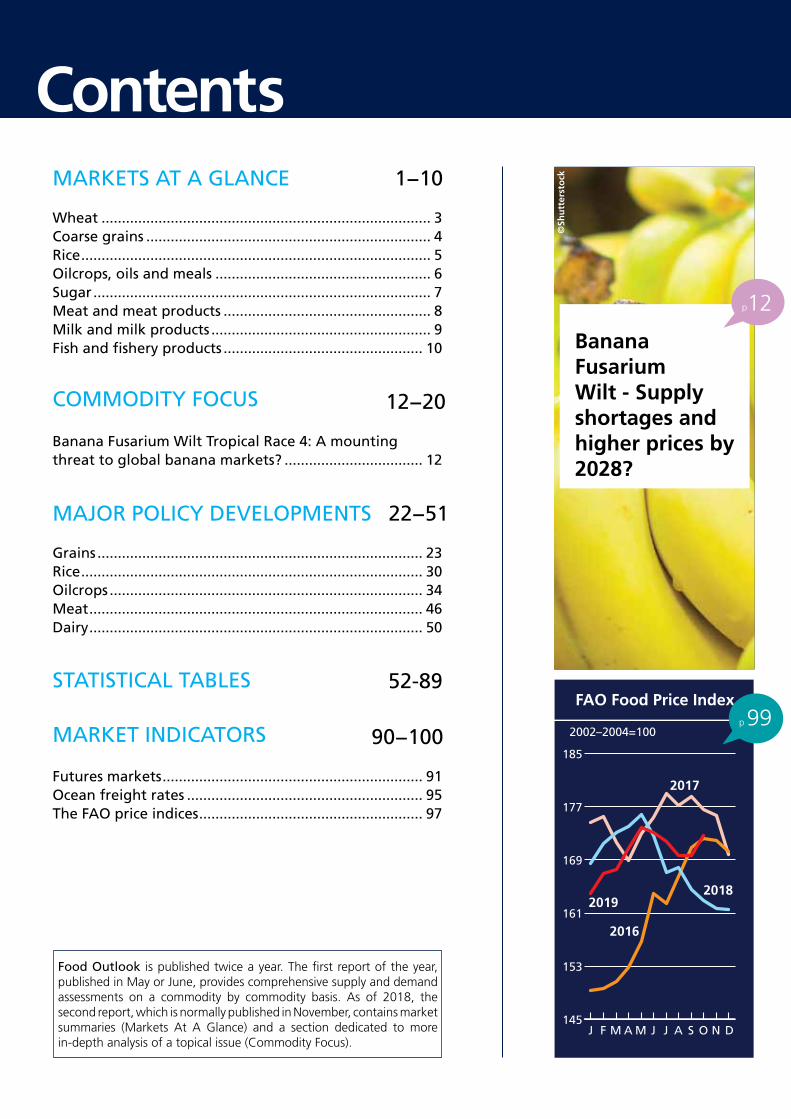
Banana Fusarium Wilt - Supply shortages and higher prices by 2028?
©Sh
utt
erst
ock
p12
Contents1−10
12−20
22−51
52-89
90−100
MARKETS AT A GLANCE
COMMODITY FOCUS
MAJOR POLICY DEVELOPMENTS
STATISTICAL TABLES
MARKET INDICATORS
Grains ................................................................................ 23Rice .................................................................................... 30Oilcrops ............................................................................. 34Meat .................................................................................. 46Dairy .................................................................................. 50
Futures markets ................................................................ 91Ocean freight rates .......................................................... 95The FAO price indices ....................................................... 97
Wheat ................................................................................. 3Coarse grains ...................................................................... 4Rice ...................................................................................... 5Oilcrops, oils and meals ..................................................... 6Sugar ................................................................................... 7Meat and meat products ................................................... 8Milk and milk products ...................................................... 9Fish and fishery products ................................................. 10
Banana Fusarium Wilt Tropical Race 4: A mounting threat to global banana markets? .................................. 12
Food Outlook is published twice a year. The first report of the year, published in May or June, provides comprehensive supply and demand assessments on a commodity by commodity basis. As of 2018, the second report, which is normally published in November, contains market summaries (Markets At A Glance) and a section dedicated to more in-depth analysis of a topical issue (Commodity Focus).
145
153
161
169
177
185
2002–2004=100
2016
20192018
2017
FAO Food Price Index
DNOSAJJMAMFJ
p 99

Ma
rke
ts a
t a
gla
nce
2 FOOD OUTLOOKNOVEMBER 2019
MAR
KETS
AT A
GLA
NCE

Ma
rke
ts at a
gla
nce
3FOOD OUTLOOKNOVEMBER 2019
Global wheat supply is forecast to recover in 2019/20, as reflected in persistent low international prices since the start of this year. At around 765.0 million tonnes, the latest FAO forecast for world wheat production in 2019 confirms the earlier projection of a strong rebound from 2018 to a new record high. An expected production recovery in the EU constitutes the bulk of the year-on-year increase in world production. However, much bigger harvests than last year are also foreseen in other top producing countries, including the Russian Federation, Ukraine and the United States.
Total wheat utilization in 2019/20 is set to reach 759.5 million tonnes, 1.5 percent higher than in 2018/19. Total food use of wheat is forecast to approach 518 million tonnes, up 1.1 percent and rising in close tandem with world population growth. However, large supplies and competitive prices are likely to drive up feed use of wheat by 2.8 percent, a faster rate than was projected earlier, while industrial use is also anticipated to register strong growth.
Based on the latest production and utilization forecasts for 2019/20, global wheat inventories could climb to almost 275 million tonnes, the second highest level on record. If realized, stocks would be up 1.9 percent from their opening levels. However, most of the projected accumulation of world wheat stocks is expected to occur in China, where carryovers could increase by 8 percent to 129.0 million tonnes. While inventories in the EU and India are also expected to expand, notable declines are anticipated in Australia, the Russian Federation, Pakistan, Morocco and Turkey.
At around 172 million tonnes, the forecast for global wheat trade in 2019/20 (July/June) has been trimmed slightly in recent months, but still up from the 2018/19 reduced level. Larger wheat imports by drought-affected Morocco and higher purchases by several countries in Asia account for most of the forecast expansion in world trade. On the export side, while the Russian Federation is seen maintaining its position as the world’s largest wheat exporter, its overall wheat sales in 2019/20 could fall short of the previous season, in view of stiffer competition from other major exporters.
For additional analyses and updates, see:
FAO Cereal Supply and Demand Brief http://www.fao.org/worldfoodsituation Crop Prospects and Food Situation http://www.fao.org/giews/reports/crop-prospectsAMIS Market Monitor http://www.amis-outlook.org/amis-monitoring
WHEAT
Contact:[email protected]
WHEAT PRODUCTION, UTILIZATION AND STOCKS
1 Trade refers to exports based on a common July/June marketing season.2 May not equal the difference between supply (defined as production plus
carryover stocks) due to differences in individual country marketing years.3 Major exporters include Argentina, Australia, Canada, EU, Kazakhstan, Russian
Fed., Ukraine and United States of America.4 Derived from the International Grains Council (IGC) wheat index.
120
165
210
255
300
400
495
590
685
780
19/2017/1815/1613/1411/1209/10
million tonnes million tonnes
f’cast
Stocks (right axis)
Production (left axis) Utilization (left axis)
2017/18 2018/19estim.
2019/20f’cast
Change: 2019/20
over 2018/19May Nov
million tonnes %
WORLD BALANCE
Production 760.0 731.9 767.0 765.0 4.5
Trade1 177.4 168.2 173.5 172.1 2.3
Total utilization 737.9 748.0 756.9 759.5 1.5
Food 509.0 512.5 519.4 517.8 1.1
Feed 137.2 140.5 143.6 144.4 2.8
Other uses 91.6 95.1 94.0 97.2 2.3
Ending stocks2 284.5 269.8 278.0 274.9 1.9
SUPPLY AND DEMAND INDICATORS
Per caput food consumption:
World (kg/yr) 67.4 67.1 67.3 67.1 0.0
LIFDC (kg/yr) 49.0 49.1 49.0 49.0 -0.2
World stocks-to-use ratio (%)
38.0 35.5 36.2 35.7
Major exporters stocks-to-disappear-ance ratio3 (%)
21.0 17.4 18.7 16.8
FAO WHEAT PRICE INDEX4
(2002−2004=100)
2017 2018 2019 Jan-Oct
%Change Jan/Oct
2019 over Jan/Oct
2018
133 148 143 -3.1
WORLD WHEAT MARKET AT A GLANCE

Ma
rke
ts a
t a
gla
nce
4 FOOD OUTLOOKNOVEMBER 2019
The global market of coarse grains in 2019/20 is set to tighten for a second consecutive season, despite an anticipated production recovery from the 2018 slump. Total production of coarse grains is forecast to reach at least 1 425 million tonnes in 2019, the second highest level on record, mostly underpinned by an increase in barley production (of 13.4 million tonnes). With record level maize production in Argentina and Brazil offsetting a poor harvest in the United States, global maize production is also set to increase, but only marginally (5 million tonnes).
Coarse grain total utilization in 2019/20 is expected to remain close to the 2018/19 level as strong growth in barley utilization, increasing by almost 5 percent from 2018/19, is likely to be countered by declining sorghum consumption, while maize use is expected to remain stable. For the first time in almost a decade, a contraction in feed use of coarse grains, especially maize, is likely in 2019/20. This is mostly because of a sharp anticipated drop in the feed use of maize in the United States from a record high level in 2018/19. In addition, maize use for feed is expected to be negatively influenced in several Asian countries, especially China because of the devastating impact of the African Swine Fever (ASF) on pig herds.
With consumption outweighing overall supplies for a second consecutive season, coarse grain inventories are forecast to fall again in 2019/20 (by 4 percent). China’s continued destocking, and a significant stock drawdown in the United States following a poor harvest, may result in a 25 million tonne contraction in global maize stocks. Reflecting this decline, the world coarse grains stocks-to-use and major exporters’ stocks-to-disappearance (defined as domestic consumption plus exports) ratios will decrease.
World trade in coarse grains in 2019/20 (July/June) is forecast to drop from the 2018/19 record, weighed down by a decline in maize trade on lower import demand especially in the EU. Reduced maize shipments from the United States, in part driven by a likely decline in this year’s production, and Ukraine are expected to be only partially offset by significant increases in maize exports from Argentina and Brazil. By contrast, increased import demand for barley in North Africa and Saudi Arabia is likely to be met by larger barley exports from Ukraine and the EU, boosting barley trade by almost 9 percent over 2018/19 levels.
For additional analyses and updates, see:
FAO Cereal Supply and Demand Brief http://www.fao.org/worldfoodsituation Crop Prospects and Food Situation http://www.fao.org/giews/reports/crop-prospects AMIS Market Monitor http://www.amis-outlook.org/amis-monitoring
COARSE GRAINS
Contact:[email protected]
COARSE GRAIN PRODUCTION, UTILIZATION AND STOCKS
120
200
280
360
440
900
1035
1170
1305
1440
19/2017/1815/1613/1511/1209/10
million tonnes million tonnes
f’cast
Stocks (right axis)
Production (left axis) Utilization (left axis)
1 Trade refers to exports based on a common July/June marketing season.2 May not equal the difference between supply (defined as production plus opening
stocks) and utilization due to differences in indivdual countries’ marketing years3 Major exporters include Argentina, Australia, Brazil, Canada, EU, Russian Fed.,
Ukraine and United States of America.
2017/18 2018/19estim.
2019/20f’cast
Change: 2019/20
over 2018/19May Nov
million tonnes %
WORLD BALANCE
Production 1 433.7 1 407.9 1 438.3 1 425.5 1.2
Trade1 196.6 197.8 190.8 195.3 -1.2
Total utilization 1 411.0 1 430.7 1 447.0 1 433.9 0.2
Food 211.7 216.2 216.9 216.4 0.1
Feed 796.2 806.4 812.1 805.0 -0.2
Other uses 403.1 408.0 418.0 412.5 1.1
Ending stocks2 421.8 409.4 390.5 393.6 -3.9
SUPPLY AND DEMAND INDICATORS
Per caput food consumption:
World (kg/yr) 28.0 28.3 28.1 28.1 -0.7
LIFDC (kg/yr) 36.5 37.1 36.4 36.3 -2.2
World stocks-to-use ratio (%)
29.5 28.6 25.7 26.2
Major exporters stocks-to-disap-pearance ratio3 (%)
15.7 15.3 14.2 14.9
FAO COARSE GRAIN PRICE INDEX
(2002−2004=100)
2017 2018 2019 Jan-Oct
%Change Jan/Oct
2019 over Jan/Oct
2018
146 156 162 3.7
WORLD COARSE GRAIN MARKET AT A GLANCE

Ma
rke
ts at a
gla
nce
5FOOD OUTLOOKNOVEMBER 2019
An erratic unfolding of the northern hemisphere spring and summer rains has deteriorated the outlook for global rice production since May, providing modest support to international rice prices in an otherwise quiet trading environment.
Based on the latest forecasts, global rice production in 2019 is set to fall 0.8 percent below the 2018 all-time high. Much of this decline is expected to occur outside Asia, particularly in Australia, Brazil, Nigeria and the United States, often as a result of adverse weather, compounding diminished producer margins. On the other hand, Asia appears headed towards another abundant harvest, with anticipation that a shortfall in China and a slight reduction in India would be largely compensated by output expansions elsewhere in the region.
Prospects of a strong trade recovery in 2020 have been tempered by expectations that ample local availabilities will keep import demand in Asian countries subdued for another year. Nonetheless, global rice flows in 2020 are still forecast to exceed their 2019 level, as imports are anticipated to expand in all other regions. This is the case of Africa in particular, where countries such as Guinea, Senegal and Nigeria would need to purchase more to compensate for reduced production levels. With the exception of Australia, Brazil and Thailand, all traditional rice suppliers are expected to boost exports in 2020, although the largest increases are predicted for India and China. Indeed, continued growth in Chinese rice exports in 2020 could essentially eliminate the trade imbalance that China has had since emerging as a net importer of rice in 2011.
Growth in the food use of rice is predicted to slightly outpace population growth in 2019/20, lifting global utilization to a level that exceeds expected production. As a result, world rice inventories at the close of 2019/20 marketing seasons could decline, albeit to a level that would still stand out as the second highest on record. Rice importers are envisaged to account for all the stock drawdown, led by reductions in China and, to a lesser extent, Bangladesh and Indonesia. By contrast, reserves held by the five major exporting countries could rise to a five-year high, primarily on the back of another foreseen build-up in India.
For additional analyses and updates, see:
AMIS Market Monitorhttp://www.amis-outlook.org/amis-monitoringCereal Supply and Demand Briefhttp://www.fao.org/worldfoodsituation/csdb/ Crop Prospects and Food Situation http://www.fao.org/giews/reports/crop-prospects
RICE
Contact:[email protected] [email protected] (Production)
RICE PRODUCTION, UTILIZATION AND STOCKS
1 Calendar year exports (second year shown).2 May not equal the difference between supply (defined as production plus
carryover stocks) due to differences in individual country marketing years.3 Major exporters include India, Pakistan, Thailand, United States of America
and Viet Nam.
30
70
110
150
190
400
430
460
490
520
19/2018/1916/1714/1512/1310/11
million tonnes, milled eq. million tonnes, milled eq.
f’cast
Stocks (right axis)
Production (left axis) Utilization (left axis)
2017/18 2018/19estim.
2019/20f’cast
Change: 2019/20
over 2018/19May Nov
million tonnes %
WORLD BALANCE
Production 509.4 517.5 516.8 513.4 -0.8
Trade1 48.4 46.2 48.9 47.7 3.1
Total utilization 506.5 510.1 518.5 515.9 1.1
Food 406.5 410.8 418.7 417.8 1.7
Ending stocks2 174.1 183.1 178.7 180.9 -1.2
SUPPLY AND DEMAND INDICATORS
Per caput food consumption:
World (kg/yr) 53.8 53.8 54.3 54.2 0.6
LIFDC (kg/yr) 57.3 57.1 58.1 57.8 1.1
World stocks-to-use ratio (%)
34.1 35.5 34.0 34.6
Major exporters stocks-to-disap-pearance ratio3 (%)
18.2 22.4 21.1 22.7
FAO RICE PRICE INDEX
(2002−2004=100)
2017 2018 2019 Jan-Oct
%Change Jan/Oct
2019 over Jan/Oct
2018
206 224 224 -1.0
WORLD RICE MARKET AT A GLANCE

Ma
rke
ts a
t a
gla
nce
6 FOOD OUTLOOKNOVEMBER 2019
FAO’s preliminary forecasts for the 2019/20 season point to relatively balanced markets for oilseeds and derived products.
After reaching an all-time high in 2018/19, global oilseed production is anticipated to contract for the first time since 2015/16, mostly reflecting expected declines in soybean and rapeseed outputs that would outweigh foreseen gains in other oilcrops. Soybean production could fall short of last season’s record level, largely as a result of both a contraction in plantings and lower yields in the United States, amid unattractive production margins and unfavourable weather conditions. Regarding rapeseed, uncertain export prospects contained plantings in Canada, while in the EU and Australia, harvests have been compromised by prolonged dryness. As for palm oil, global production could slow, tied to a deceleration in area expansion and modest yield prospects in Indonesia and Malaysia.
On the demand side, global meal utilization is forecast to resume growth, albeit timidly – after being severely affected by the outbreaks of African Swine Fever (ASF) in 2018/19. Oils/fats consumption is also poised to expand at a below-average rate, reflecting generally stagnant economic growth and more moderate uptake by the biodiesel sector. However, based on current forecasts, global utilization of meals and oils would still outstrip production, triggering sizeable year-on-year drawdowns in meal/oil reserves. Despite the predicted tightening in global carry-over stocks, major exporters’ stock-to-disappearance ratios still point to a comfortable market situation.
International trade in meals and oils is expected to continue expanding in 2019/20, though at a relatively low rate, underpinned by the predicted slowdowns in global utilization and reductions in exportable supplies. Ongoing trade tensions between individual countries are poised to continue affecting markets for oilcrops and derived products, adding uncertainty to the market outlook.
Looking ahead, prices in the coming months will be influenced by weather conditions in South America and Southeast Asia, the evolvement of the ASF epidemic, implementation of domestic biodiesel policies, and trade policy developments. Should the current forecasts of sizeable drawdowns in global inventories materialize, prices of products in the oilcrops complex could gain ground compared with recent multi-year lows.
For additional analyses and updates, see:
Oilcrops Monthly Price and Policy Update http://www.fao.org/economic/est/publications/oilcrops-publications/ monthly-price-and-policy-update/AMIS Market Monitor http://www.amis-outlook.org/amis-monitoring
OILCROPS
Contact:[email protected]@fao.org
FAO MONTHLY INTERNATIONAL PRICE INDICES FOR OILSEEDS, VEGETABLE OILS AND MEALS/CAKES (2002-2004=100)
WORLD OILCROP AND PRODUCT MARKET AT A GLANCE
2017/18 2018/19estim.
2019/20 f’cast
Change: 2019/20
over 2018/19
million tonnes %
TOTAL OILCROPS
Production 592.1 607.0 590.9 -2.7
OILS AND FATS
Production 234.3 241.0 240.2 -0.3
Supply 271.1 280.3 280.0 -0.1
Utilization 228.5 240.9 245.7 2.0
Trade 124.6 130.2 131.8 1.2
Global stocks-to-use ratio (%) 17.2 16.5 14.2
Major exporters stocks-to-disappearance ratio (%) 11.8 13.6 11.9
MEALS AND CAKES
Production 152.3 157.0 150.7 -4.0
Supply 183.2 185.3 182.8 -1.3
Utilization 152.7 153.1 155.9 1.9
Trade 97.8 98.8 99.6 0.8
Global stocks-to-use ratio (%) 18.5 20.9 16.9
Major exporters stocks-to-disappearance ratio (%) 11.3 15.3 11.5
FAO PRICE INDICES Jan–Dec (2002–2004=100)
2017 2018 2019 Jan−Oct
%Change Jan/Oct 2019
overJan/Oct 2018
Oilseeds 152 150 142 -6.4
Meals/cakes 159 184 156 -16.9
Vegetable oils 169 144 131 -11.5
Note: For explanations on definitions and coverage kindly refer to previous issues of Food Outlook.
100
140
180
220
260
300
20192018201720162015201420132012
oils
meals
seeds

Ma
rke
ts at a
gla
nce
7FOOD OUTLOOKNOVEMBER 2019
Source: Prices refer to the Sugar No. 11 contract traded at the New York Intercontinental Exchange (ICE)
International sugar markets are seen heading for a modest tightening in the 2019/20 marketing season, as production is forecast to fall below the previous season’s record level while world consumption is expected to expand. As a result, sugar inventories are predicted to decline in 2019/20.
FAO expects world sugar production to drop in 2019/20 (October/September), falling below total consumption. The forecast for global sugar production in 2019/20 has been revised downwards in recent months and is now pegged at just over 175 million tonnes, representing a 2.8 percent decrease from 2018/19. India, Thailand and Pakistan account for much of the anticipated year-on-year contraction in global sugar production. Unfavourable weather conditions during sugar cane tillering and elongation stages are largely behind the reduced output.
Global sugar consumption is set to expand by 1.4 percent in 2019/20, a modest increase compared with the growth registered in the previous season, but still below its long-term (10-year) trend, reflecting the growing consumer concerns about excess sugar consumption. Growth in sugar consumption is expected to be particularly marked in Africa, the Middle East and Latin America and the Caribbean, driven by rising per capita incomes and lower sugar prices.
World sugar trade is expected to expand in 2019/20, underpinned by a stronger import demand from the traditional sugar importing countries and ample availability in major exporting countries. The introduction of export incentives by some of the major exporting countries is also anticipated to boost global trade in sugar. Exports by Brazil and India are set to rise, prompted by abundant sugar stocks, but to fall in Thailand, the second largest sugar exporter, due to an 11 percent decrease in production. International sugar prices have followed a declining trend in recent months, weighed by large accumulated inventories in both importing and exporting countries, and a strengthening of the Brazilian real against the US dollar, which tends to stimulate shipments from Brazil, the world’s largest sugar exporter.
SUGAR
Contact:[email protected]@fao.org
INTERNATIONAL SUGAR PRICES
WORLD SUGAR MARKET AT A GLANCE
2017/18 2018/19estim.
2019/20 f’cast
Change: 2019/20
over 2018/19
million tonnes %
WORLD BALANCE
Production 183.2 180.1 175.1 -2.8
Trade 61.7 55.6 56.3 1.3
Total utilization 172.3 175.0 177.5 1.4
Ending stocks 89.0 93.9 91.4 -2.6
SUPPLY AND DEMAND INDICATORS
Per caput food consumption:
World (kg/yr) 22.9 23.0 23.0 0.26
LIFDC (kg/yr) 16.6 16.3 16.4 0.74
World stocks-to-use ratio (%)
51.7 53.7 51.5
ISA DAILY PRICEAVERAGE (US cents/lb)
2017 2018 2019Jan−Oct
%Change Jan/Oct
2019 overJan/Oct
2018
16.01 12.52 12.65 1.44
10
15
20
25
DNOSAJJMAMFJ
2016
2017
2019
2015
2018
US cents per lb.
Ma
rke
ts a
t a
gla
nce
8 FOOD OUTLOOKNOVEMBER 2019
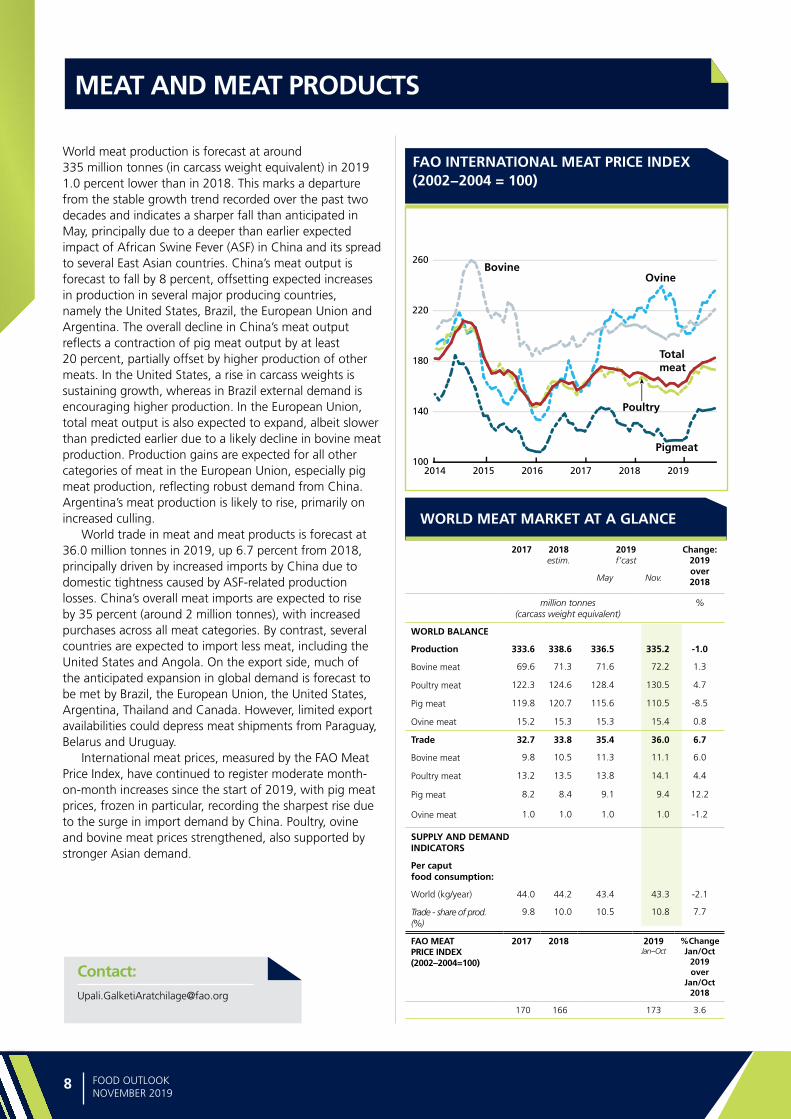
World meat production is forecast at around 335 million tonnes (in carcass weight equivalent) in 2019 1.0 percent lower than in 2018. This marks a departure from the stable growth trend recorded over the past two decades and indicates a sharper fall than anticipated in May, principally due to a deeper than earlier expected impact of African Swine Fever (ASF) in China and its spread to several East Asian countries. China’s meat output is forecast to fall by 8 percent, offsetting expected increases in production in several major producing countries, namely the United States, Brazil, the European Union and Argentina. The overall decline in China’s meat output reflects a contraction of pig meat output by at least 20 percent, partially offset by higher production of other meats. In the United States, a rise in carcass weights is sustaining growth, whereas in Brazil external demand is encouraging higher production. In the European Union, total meat output is also expected to expand, albeit slower than predicted earlier due to a likely decline in bovine meat production. Production gains are expected for all other categories of meat in the European Union, especially pig meat production, reflecting robust demand from China. Argentina’s meat production is likely to rise, primarily on increased culling.
World trade in meat and meat products is forecast at 36.0 million tonnes in 2019, up 6.7 percent from 2018, principally driven by increased imports by China due to domestic tightness caused by ASF-related production losses. China’s overall meat imports are expected to rise by 35 percent (around 2 million tonnes), with increased purchases across all meat categories. By contrast, several countries are expected to import less meat, including the United States and Angola. On the export side, much of the anticipated expansion in global demand is forecast to be met by Brazil, the European Union, the United States, Argentina, Thailand and Canada. However, limited export availabilities could depress meat shipments from Paraguay, Belarus and Uruguay.
International meat prices, measured by the FAO Meat Price Index, have continued to register moderate month-on-month increases since the start of 2019, with pig meat prices, frozen in particular, recording the sharpest rise due to the surge in import demand by China. Poultry, ovine and bovine meat prices strengthened, also supported by stronger Asian demand.
MEAT AND MEAT PRODUCTS
Contact:[email protected]
FAO INTERNATIONAL MEAT PRICE INDEX (2002−2004 = 100)
WORLD MEAT MARKET AT A GLANCE
2017 2018estim.
2019f’cast
Change: 2019 over 2018May Nov.
million tonnes (carcass weight equivalent)
%
WORLD BALANCE
Production 333.6 338.6 336.5 335.2 -1.0
Bovine meat 69.6 71.3 71.6 72.2 1.3
Poultry meat 122.3 124.6 128.4 130.5 4.7
Pig meat 119.8 120.7 115.6 110.5 -8.5
Ovine meat 15.2 15.3 15.3 15.4 0.8
Trade 32.7 33.8 35.4 36.0 6.7
Bovine meat 9.8 10.5 11.3 11.1 6.0
Poultry meat 13.2 13.5 13.8 14.1 4.4
Pig meat 8.2 8.4 9.1 9.4 12.2
Ovine meat 1.0 1.0 1.0 1.0 -1.2
SUPPLY AND DEMAND INDICATORS
Per caput food consumption:
World (kg/year) 44.0 44.2 43.4 43.3 -2.1
Trade - share of prod. (%)
9.8 10.0 10.5 10.8 7.7
FAO MEAT PRICE INDEX
(2002–2004=100)
2017 2018 2019 Jan−Oct
%Change Jan/Oct
2019 over
Jan/Oct 2018
170 166 173 3.6
100
140
180
220
260
201920182017201620152014
Bovine
Poultry
Ovine
Total meat
Pigmeat

Ma
rke
ts at a
gla
nce
9FOOD OUTLOOKNOVEMBER 2019
2017 2018estim.
2019f’cast
Change: 2019 over 2018May Nov.
million tonnes (carcass weight equivalent)
%
WORLD BALANCE
Production 333.6 338.6 336.5 335.2 -1.0
Bovine meat 69.6 71.3 71.6 72.2 1.3
Poultry meat 122.3 124.6 128.4 130.5 4.7
Pig meat 119.8 120.7 115.6 110.5 -8.5
Ovine meat 15.2 15.3 15.3 15.4 0.8
Trade 32.7 33.8 35.4 36.0 6.7
Bovine meat 9.8 10.5 11.3 11.1 6.0
Poultry meat 13.2 13.5 13.8 14.1 4.4
Pig meat 8.2 8.4 9.1 9.4 12.2
Ovine meat 1.0 1.0 1.0 1.0 -1.2
SUPPLY AND DEMAND INDICATORS
Per caput food consumption:
World (kg/year) 44.0 44.2 43.4 43.3 -2.1
Trade - share of prod. (%)
9.8 10.0 10.5 10.8 7.7
FAO MEAT PRICE INDEX
(2002–2004=100)
2017 2018 2019 Jan−Oct
%Change Jan/Oct
2019 over
Jan/Oct 2018
170 166 173 3.6
Global milk production is forecast at 852 million tonnes in 2019, an increase of 1.4 percent from 2018 – a smaller rate of growth than earlier anticipated in May, reflecting downward revisions made for India and the European Union. Much of the anticipated output expansion will originate in India, Pakistan, China, the European Union and Brazil, partially offset by declines in some countries including Australia, Colombia and Argentina. In India and Pakistan, herd expansions drive output growth, while in China, farm efficiency improvements underpin the higher growth. In the European Union, output is rising, albeit slowly as dry weather during the summer constrained milk deliveries, while in Brazil, rising dairy herd and stable milk prices support higher production. By contrast, output may decline in Australia and Colombia due to dry weather, whereas in Argentina, rising feed costs and restrained consumer demand may dampen production. Elsewhere, in the United States, higher milk yields sustain the growth momentum, whereas in New Zealand, favourable weather supports a positive production outlook.
World trade in dairy products (in milk equivalent) in 2019 is forecast at 76 million tonnes, up 0.8 percent from 2018, significantly lower than the previous growth forecast. This emanates largely from a more subdued import growth forecast for China, reflecting expected import curtailments of butter, but also of whey products due to reduced demand from piggeries. Elsewhere, the Russian Federation, the Philippines, Indonesia and Japan may purchase more dairy products in 2019. Much of the expanded global supply is likely to come from New Zealand and the European Union, thanks to increased export availabilities and new trade agreements. By contrast, retaliatory tariffs, reduced demand for whey products as hog feed and strong competition will constrain dairy exports from the United States, while tighter export availabilities weigh on exports from Australia.
International dairy prices, measured by the FAO Dairy Price Index, rose by 24 percent between January and May of this year, largely driven by a strong global demand. Since June, price quotations for butter and cheese were subject to more downward pressure due to increased export availabilities, especially from New Zealand, whereas those for Skim Milk Powder (SMP) and Whole Milk Powder (WMP) drifted higher, reflecting strong import demand from Asia.
MILK AND MILK PRODUCTS
Contact:[email protected]
FAO INTERNATIONAL DAIRY PRICE INDEX (2002−2004 = 100)
WORLD DAIRY MARKET AT A GLANCE
2017 2018estim.
2019f’cast
Change: 2019 over 2018May Nov.
million tonnes milk equivalent
%
WORLD BALANCE
Total milk production 823.9 840.5 859.0 852.0 1.4
Total trade 72.8 75.6 76.1 76.2 0.8
SUPPLY AND DEMAND INDICATORS
Per caput food consumption:
World (kg/year) 109.1 110.1 111.3 110.4 0.3
Trade - share of prod. (%) 8.8 9.0 8.9 8.9 -0.6
FAO DAIRY PRICE INDEX(2002–2004=100)
2017 2018 2019 Jan−Oct
%Change Jan/Oct
2019 overJan/Oct
2018
202 193 199 1.2
50
140
230
320
410
500
201920182017201620152014
Butter
Cheese
SMP
Dairy PriceIndex
WMP

Ma
rke
ts a
t a
gla
nce
10 FOOD OUTLOOKNOVEMBER 2019
No growth is expected for global fish production in 2019. Trade tensions are taking a heavy toll on consumers and businesses alike, with seafood trade expected to contract. 1
Global fish production is expected to be flat year-on-year for 2019, with a 3.4 percent decline in capture fisheries production offset by a 3.9 percent increase in aquaculture harvests. Cephalopods and cod are among the wild stocks for which supplies have been tight. Anchoveta production was also lower in the first fishing season (late April 2019 to late July 2019). Meanwhile, the growth trajectory of the aquaculture sector remains steady. Supplies of the major farmed finfish species will rise again in 2019, but shrimp production in Asia is expected to drop sharply. Both aquaculture and capture harvests have been affected by higher water temperatures this year.
Pressured by unfavourable macro-economic developments, in particular slower economic growth prospects and trade tensions, global trade in fish and fish products could contract this year, projected to drop by 1.2 percent in volume and 1.4 percent in value. Imports into the United States and the European Union are expected to fall marginally, while those to China are expected to increase substantially. In terms of exports however, China, will see a decline in export revenues, mainly driven by a drop in exports to the United States due to the trade war and associated tariffs.
Aside from the direct impact of tariffs on United States-China trade flows, the wider geopolitical uncertainty is translating into an increasingly cautious decision-making environment for seafood businesses, consumers and investors. The trade war is also driving potentially permanent transformations in key markets, including those for cephalopods, lobster, groundfish and tilapia, as Chinese exporters seek alternative markets and US buyers look for new suppliers. For other commodities, such as bivalves and small pelagics, the impact of trade tensions has been lower and the demand outlook is more positive.
The FAO Fish Price Index has fallen by 2.1 percent between January and September, compared with the same period last year, primarily due to price declines for many important farmed species, including shrimp, salmon, pangasius and tilapia, a consequence of both increased supplies and faltering demand. Prices are also weaker for canned tuna, with limited prospects for recovery.
1 Unless otherwise specified, the terms ‘fish’ and ‘seafood’ indicates fish, crustaceans, molluscs and other aquatic animals from farmed and wild origin, but excludes aquatic mammals, reptiles, seaweeds and other aquatic plants.
For additional analyses and updates, see:The GLOBEFISH market reports at http://www.fao.org/in-action/globefish/market-reports
FISH AND FISHERY PRODUCTS
Contact:[email protected]@fao.org
FAO FISH PRICE INDEX (2002−2004 = 100)
Source of the raw data for the FAO Fish Price Index: EUMOFA, INFOFISH, INFOPESCA, Statistics Norway.
80
105
130
155
180
2019201620142012201020082006200420022000
WORLD FISH MARKET AT A GLANCE
2017 2018estim.
2019f’cast
Change: 2019 over 2018May Nov
million tonnes (live weight) %
WORLD BALANCE
Production 172.6 177.7 177.8 177.8 0.0
Capture fisheries
92.5 94.5 91.3 91.3 -3.4
Aquaculture 80.1 83.2 86.5 86.5 3.9
Trade value (exports USD billion)
156.5 162.9 164.5 160.5 -1.4
Trade volume (live weight)
64.9 65.1 64.5 64.3 -1.2
Total utilization 172.6 177.7 177.8 177.8 0.0
Food 153.4 155.7 158.2 158.2 1.6
Feed 14.6 17.5 15.0 15.0 -14.2
Other uses 4.7 4.6 4.6 4.6 0.0
SUPPLY AND DEMAND INDICATORS
Per caput food consumption:
Food fish (kg/yr) 20.3 20.4 20.5 20.5 0.6
From capture fisheries (kg/year)
9.7 9.5 9.3 9.3 -2.0
From aquaculture (kg/year)
10.6 10.9 11.2 11.2 2.8
FAO FISH PRICE INDEX
(2002–2004=100)2017 2018 2019
Jan−Sept %Change Jan/Sept
2019 overJan/Sept
2018
158 158 156 -2.1
Source of the raw data for the FAO Fish Price Index: EUMOFA, INFOFISH, INFOPESCA, Statistics Norway. Refer to Appendix table 29 for further details.


COM
MO
DITY
FOCU
S

Co
mm
od
ity Focu
s
13FOOD OUTLOOKNOVEMBER 2019
Sabine Altendorf1 [email protected]
Commercial banana production has been subject to
intensive farming techniques since the late nineteenth
century, with the emergence of large-scale trade from
Central American and Caribbean banana producing
countries to the United States and Europe. To cater for
rapidly growing demand in mostly far distant import
markets, producers identified the Gros Michel variety as
the most suitable for monoculture propagation and long
transport routes. By 1955, the global export volume of
bananas from Central American producers had reached
approximately 3 million tonnes, making bananas the
most exported fresh fruit globally – ahead of citrus fruits
and apples – at a volume share of 40 percent in world
fresh fruit trade.2
The Fusarium wilt disease of banana, scientifically
denominated as Fusarium oxysporum f. sp. cubense
and considered among the most destructive of all plant
diseases, was first detected in banana plantations in
Australia in 1876.3 The first large-scale outbreak in export
plantations was subsequently reported in 1890 in Panama.
A soil-borne pathogen, the mycelium and spores of
Fusarium wilt spread through: infected plants and planting
materials; soil particles attached to shoes, vehicles and
tools; water, including irrigation, drainage and floods; as
well as other physical means of spread. Facilitated by the
monoculture and intensive plantation cultivation techniques
and concentrated transport routes of the commercial
banana industry, by the mid-1950s, this first strain (Race
1) of Fusarium wilt had caused such enormous damage
to the production of Gros Michel that the export industry
was forced to switch its entire production to the Fusarium
wilt-resistant Cavendish variety. Official data suggest that
total losses to trade in Gros Michel bananas at the time
amounted to a current equivalent of USD 2.3 billion.4 Given
the decades-long persistence of the Fusarium wilt fungus
in the soil, Gros Michel bananas continue to be practically
absent from world export markets to this day.
TROPICAL RACE 4 – A RENEWED CHALLENGE TO GLOBAL BANANA SUPPLY
The current strain of the Banana Fusarium Wilt disease,
described as Tropical Race 4 (TR4), was first discovered
in 1970 in Cavendish banana plantations in Taiwan, and
then on a more severe scale in Cavendish plantations in
Indonesia and Malaysia in 1992/93. By the early 2000s,
TR4 had spread to Australia, Papua New Guinea, China
and the Philippines. In 2013, TR4 was discovered on
farms in northern Mozambique and in Jordan, and in
2015 it emerged in Lebanon, Oman, India and Pakistan.
Between 2017 and 2019, TR4 was found in Laos, Viet
Nam, Myanmar and Thailand. In August 2019, the fungus
was detected for the first time on a banana plantation in
Latin America, in the northeastern region of La Guajira,
Colombia. According to official information, TR4 is currently
confirmed in 17 countries, predominantly in South and
Southeast Asia.5 This fourth race of the fungus poses
particularly elevated risks to global banana supplies, as it
can affect a much broader variety of banana and plantain
cultivars than previous strains of Fusarium wilt.6 In addition,
there is currently no effective fungicide or other eradication
method that is capable of eliminating TR4. In affected
plants, the disease can quickly cause a total yield loss. Due
to the longevity of the fungus in the soil, infected land
becomes unavailable for banana or any other cultivation
for decades, resulting in a shift of production to new,
1 The author extends sincere thanks to Dr Charles Staver, Dr Altus Viljoen, Dr Diemuth Pemsl, Dr Lorna Herradura, Dr Randy Ploetz, Dr Tony Pattison and Dr Luis Pérez Vicente for their expert inputs on the probable spread of the disease.
2 May et al. (1958)3 Ordonez et al. (2015)
4 FAO (2019)5 FAO (2019) 6 Ploetz (2005)
The recent spread and potential future impact of the disease on global banana trade
Banana Fusarium Wilt Tropical Race 4: A mounting threat to global banana markets?
Co
mm
od
ity
Focu
s
14 FOOD OUTLOOKNOVEMBER 2019
unaffected land as the only recourse. Depending on the
severity of the spread, outbreaks can result in an increasing
scarcity of pathogen-free soils. In all reported cases, once
a farm has been contaminated, managing the disease
has proved extremely challenging and costly. This poses a
particular threat to the livelihoods of smallholder banana
producers in affected regions, who often lack the financial
means to sustain operations in the face of simultaneous
yield losses and increased production costs. In this regard,
prevention, rapid containment and quarantine are
particularly important.
Given the serious implications for infected farms,
precise and complete documentation of the damage
caused by TR4 is often unavailable. In the worst cases
of disease management, farms are abandoned without
reporting and without being adequately quarantined,
further impeding rapid containment of the disease. While
no global estimates are available, figures for some countries
indicate that the disease has affected around 15 700
hectares (ha) of banana plantations (out of a total 440 000
ha) in the Philippines,7 and some 70 percent of plantations
in China’s Guangdong and Hainan provinces.8 Annual
economic losses caused by TR4 have been estimated at
USD 121 million in Indonesia, USD 253 million in Taiwan
and USD 14 million in Malaysia.9 On the infected farm
in Mozambique, TR4 caused such severe damage to the
1,500-ha plantation within 4 years of the first detection of
the disease that the farm was forced to cease operations.10
BANANA MARKETS IN THE PRESENCE OF TR4 – SUPPLY SHORTAGES AND HIGHER PRICES BY 2028?
The very recent discovery of Fusarium wilt TR4 in the
world’s most significant net exporting region, Latin America
and the Caribbean, as well as its enduring occurrence
in Asia, has caused considerable alarm in the banana
export industry. To date, few estimates of the additional
disease-related costs to producers are available. However,
industry experts believe that, given the current annual
value of production for export and the importance of
Cavendish bananas for smallholders, it is possible that TR4
will eventually cause even greater losses than the original
strain of Fusarium wilt that affected the production of Gros
Michel bananas.
7 The Southern Mindanao Agriculture, Aquatic and Natural Resources Research and Development Consortium, as quoted by Freshplaza, 10 March 2016.
8 Chen et al. (2013)9 Aquino et al. (2013)10 Altus Viljoen, Stellenbosch University, South Africa
11 www.doi.org/10.1787/agr_outlook-2019-en
To assess the potential future impacts of TR4 on global
banana markets, a partial equilibrium commodity market
model covering national and international banana markets
was used. The model adopts the basic specifications for
supply, demand, trade and prices of FAO’s commodity
simulation model (COSIMO), which is used to generate
ten-year projections for global temperate agricultural
commodities on an annual basis. The underlying
assumptions of the model concerning the global economic
and demographic projections follow those outlined in the
OECD-FAO Agricultural Outlook published in July 2019.11
The scenario presented herein regarding the hypothetical
market impact of TR4 provides suggestive rather than
predictive impact results, which should not be interpreted
as actual forecasts, but rather as an indicative basis for
informing policy decisions.
The time span for the simulation analysis covers
ten years, from 2019 to 2028, to enable a direct
comparison with the baseline projections, which were
produced in May 2019. These were based on ‘business-
as-usual’ assumptions, foreseeing normal weather,
no changes in policy, and in particular no changes in
the prevalence of crop diseases. Under the baseline
projections, global banana production will grow at an
annual rate of 1.5 percent over the ten-year period, to
reach approximately 135 million tonnes in 2028. Global
trade in bananas is projected to grow at a moderate rate
of 1 percent per year due to slowing demand in large
developed country import markets, where consumption is
forecast to reach near saturation levels.
As mentioned above, the framework underpinning
the assessment of the possible impacts of TR4 on global
banana markets is a standard multi-commodity, multi-
country partial equilibrium model. The scenario analysis
was adapted from a similar approach used by Acquaye
et al. (2005), who conducted an evaluation of the
economic consequences of an invasive species outbreak
for a large-country exporter applied to the case of
Citrus Canker. The results of the model are contingent
on the stylized assumptions of perfect competition and
homogenous world markets for bananas. In this regard,
the model deviates somewhat from the observed reality
of global banana markets, which may display regional
fragmentation and oligopolistic behaviour by large,
dominant banana corporations. However, the fundamental
conclusions reached by the analysis are consistent with
those of alternative model specifications. For example, an
uncontained spread of TR4 in fragmented markets would
lead to higher prices and larger economic losses to either

Co
mm
od
ity Focu
s
15FOOD OUTLOOKNOVEMBER 2019
Box: Bananas in food security and world markets
Bananas represent one of the most consumed and
traded fruits globally. In many developing countries,
bananas, along with their subcultivar plantains,
serve as a staple food that is included in many forms in
local diets. While precise statistics on consumption remain
sketchy due to the informality of subsistence cultivation
in many regions, Filipinos reportedly have the highest
per capita consumption of dessert bananas at around
60 kg per year, followed by Brazilians who consume a
slightly lower amount. In some African countries, such
as Angola and Rwanda, per capita consumption of all
dessert and cooking banana types combined exceeds
200 kg per year. Particularly in the rural areas of these
countries, bananas can provide up to 25 percent of daily
calorie intake.1 In tandem with the increase in the world
population to more than 7 billion people, global banana
production expanded from 21 million tonnes in 1961
to approximately 114 million tonnes in 2017. According
to some estimates, more than 100 billion bananas are
now consumed worldwide each year.2 The main driver
of this rapid rise in production has been the increasing
consumption requirements of the growing populations in
developing countries. The bulk of the global production
increase has taken place in top producing countries who
are also top consumers, such as Brazil, the Philippines
and, in particular, India and China. The total value of
global production stood at an estimated USD 38.5 billion
for bananas and USD 6.6 billion for plantains in 2016.
In addition, bananas have particular significance in
some of the least developed and low-income food-deficit
countries, where they contribute not only to household
food security as a staple, but also to income and
employment generation as a cash crop. At farmgate prices
of around USD 300-400 per tonne and typical smallholder
yields of 10-15 tonnes per hectare, bananas can generate
an estimated USD 3 000 to 6 000 per hectare per year.
Research conducted in 10 banana producing countries
revealed that revenue from banana farming can account
for some 75 percent of total monthly household income
for smallholder farmers.3 It is further estimated that
approximately 400 million workers rely on income from
direct employment in the banana industry globally.4
1 FAOSTAT2 Bananalink, http://www.bananalink.org.uk/all-about-bananas3 Bioversity (2012)4 FAO (2019)
Bananas play a similarly important role in developed
country importing markets, where they have ranked
among the most consumed fruits for decades. This is
reflected in the noticeable performance of the global
banana export market, which reached an unprecedented
19.2 million tonnes in 2018. Preliminary data for the
first half of 2019 suggest that global trade in bananas
expanded by a further 11 percent over the same period
of the previous year. Ample import demand in developed
markets, combined with strong yield-driven supply growth
in the leading exporting countries, have been the principal
factors behind this increase.
Globally, Latin America and the Caribbean ranks as the
largest banana exporting region, accounting for nearly
80 percent of world exports. Ecuador has been positioned
as the world’s leading exporter over the past several
decades, supplying an average of 5 to 6 million tonnes to
world markets per year. In 2018, Colombia ranked as the
fourth leading exporter globally with a total volume of
1.7 million tonnes, equivalent to approximately 9 percent
of global exports. Asia, the second largest supplier
of bananas for export, accounted for approximately
20 percent of global shipments in 2018, almost entirely
supplied by the Philippines, the dominant exporter in
the region. In terms of leading importers, the European
Union and the United States absorbed, respectively,
approximately 32 percent and 26 percent of total global
supplies in 2018. The Russian Federation, China and
Japan are also significant importers, albeit with single-
digit market shares in 2018.
Given the popularity of bananas in import markets,
their global value chains have been characterized by
intense competition between market actors all the way
to the retail level. This has exerted downward pressure
on prices at each stage, which resulted in producer prices
displaying little fluctuation and, by and large, remaining
at very low levels. Combined with rising production
costs, low prices and tight profit margins greatly hinder
the adequate remuneration of banana workers and
smallholder farmers and act as a major obstacle for
producers in coping with emerging challenges, in
particular the looming threat of TR4.

Co
mm
od
ity
Focu
s
16 FOOD OUTLOOKNOVEMBER 2019
producers or consumers in the respective regional producing
and trading countries. Similarly, relaxing the assumption
of perfect competition would lead to larger world price
increases, as oligopolistic behaviour would extract rents
from markets that are short in supply.
The scenario is further based on potential TR4 spread
rates and losses in harvested area in key banana producing
countries, which are provided in a CGIAR working paper
by Scheerer et al. (2018). The paper presents two spread
and loss scenarios, which are constructed from a base
probability of infection that hinges on the prevalence of
Cavendish monoculture in a producing country, as well
as internal geographical, phytosanitary, transport and
other factors.12 The high spread scenario assumes an
internal disease spread at a rate of 50 percent in five-
year time intervals up to 25 years. For the current study,
the estimated internal spread and impact on area in the
lower loss scenario presented by Scheerer et al. (2018) was
chosen, which anticipates incremental increases in losses
of 25 percent every five years. It should be noted that the
estimated internal spread rates show the area losses due to
TR4 to be increasing over time, indicating that the disease
impacts over a period beyond the ten years chosen for this
scenario would be amplified. Furthermore, although TR4
can affect a broad variety of banana cultivars, the analysis
presented in this assessment encompasses the possible
economic impact on the Cavendish variety only, which is
predominant in global trade and plays a significant role
in income and foreign exchange generation for exporting
countries.
Figure 1 shows the expected percentage of area
loss to the production of bananas in 2028 due to TR4
infection for each of the countries for which estimates are
provided. Weighted averages of the internal spread rates
of the Cavendish, AAA, Other AAA and EAH AAA banana
cultivars specified in the paper were calculated and applied
to total FAOSTAT banana production data.13 Scheerer et
al. (2018) determine that the highest rates of spread will
affect key producers in Asia, most notably China, the
Philippines, Pakistan and Viet Nam, as well as Mozambique
and Tanzania in Africa. At the time of writing, Scheerer
et al. assumed a TR4 arrival time in Colombia after ten
years. Considering the low score for the internal spread
rate identified for Latin American and Caribbean banana
producers, which results mainly from their superior internal
plant quarantine capabilities, the area loss due to TR4
infection was assumed to amount to 1.25 percent of
banana area in Colombia by 2028. Although neighbouring
key banana producing countries are at elevated risk of
contamination by TR4, most notably Ecuador, Peru, Brazil
and Panama, the current scenario does not include a
spread of TR4 outside the boundaries of Colombia. This
was based on the absence of sound scientific assessments
regarding the potential arrival of TR4 in those countries.
Information gathered by the author from leading plant
pathologists and banana experts pointed to the conclusion
that assigning a rate of spread within Latin America
and the Caribbean would at this stage be difficult and,
moreover, highly speculative, given that any hypothetical
spread may hinge on many unpredictable and virtually
unmanageable factors. Similarly, it has proved difficult to
pinpoint the precise costs of containment and prevention
of TR4. As such, in the current scenario, production
costs for both affected and unaffected countries have
not been adjusted to reflect the numerous additional
expenses arising from TR4 adaptation and mitigation. As
more information becomes available, the scenario can be
modified to reflect realistic estimates of these costs.
12 As Scheerer et al. (2018) explain, factors linked to the time lag for TR4 to reach a country include the importance of mono-cropped Cavendish bananas in the country; global banana traffic to and from a country; quality of borders and internal plant quarantine measures; and land and other links to countries where TR4 is currently present. The rate of internal spread was rated based on three factors: quality of internal quarantine measures; importance of Cavendish bananas; and the importance of banana for research investment and public policy. These two elements were then combined in an aggregated score that was used to estimate banana production area loss by country.
13 For the case of India, Scheerer et al. (2018) assume an arrival of TR4 in the country after ten years. However, official information specifies that TR4 has been present in India since 2015. In the absence of estimates for the production area lost due to TR4 in the first ten years as otherwise adapted from
Table 7 in Scheerer et al. (2018), a moderate spread rate arriving at a loss of 2.5 percent of total area as indicated in Figure 2 of the same paper was chosen as indicative of a potential spread of TR4 in India.
14 Adapted from Scheerer et al., (2018)
Figure 1. Area loss after 10 years due to Fusarium wilt TR4 at 25 percent internal spread rate14
0
5
10
15
20Co
lom
bia
Vie
t N
am
Thai
land
The
Phi
lippi
nes
Papu
a N
ew
Gui
nea
Paki
stan
Mal
aysi
a
Indo
nesi
a
Indi
a
Chin
a
Tanz
ania
Moz
ambi
que
Ken
ya
Cote
d'Iv
oire
Cam
eroo
n
Buru
ndi
Percentage area loss in 2028 relative to total area in 2019
Co
mm
od
ity Focu
s
17FOOD OUTLOOKNOVEMBER 2019
15 The implementation of a linearly increasing rather than exponential disease spread, which may be more reflective of the actual disease spread, facilitates the projected area losses after ten years as provided by Scheerer et al. (2018).
For the current scenario, the banana area response
equation of the model was shifted in linearly increasing
steps from 2019 to 2028 in each of the countries for
which data are provided, arriving at the assumed area
losses by 2028, as displayed in Figure 1.15 Compared with
the baseline projection, this would lead to a loss of an
estimated 160 000 hectares globally by 2028. Assuming
an average of 1.5 workers per hectare, this would imply
the loss of direct employment for approximately 240 000
banana workers. In terms of production volume, the
area loss would result in a 2.8 million tonne or 2 percent
reduction in global banana production by 2028. Since
markets would ration reduced supply, the decline in world
production would induce a 9.2 percent rise in the global
reference price for bananas by 2028, contingent on the
inelastic demand for bananas, which would cause prices to
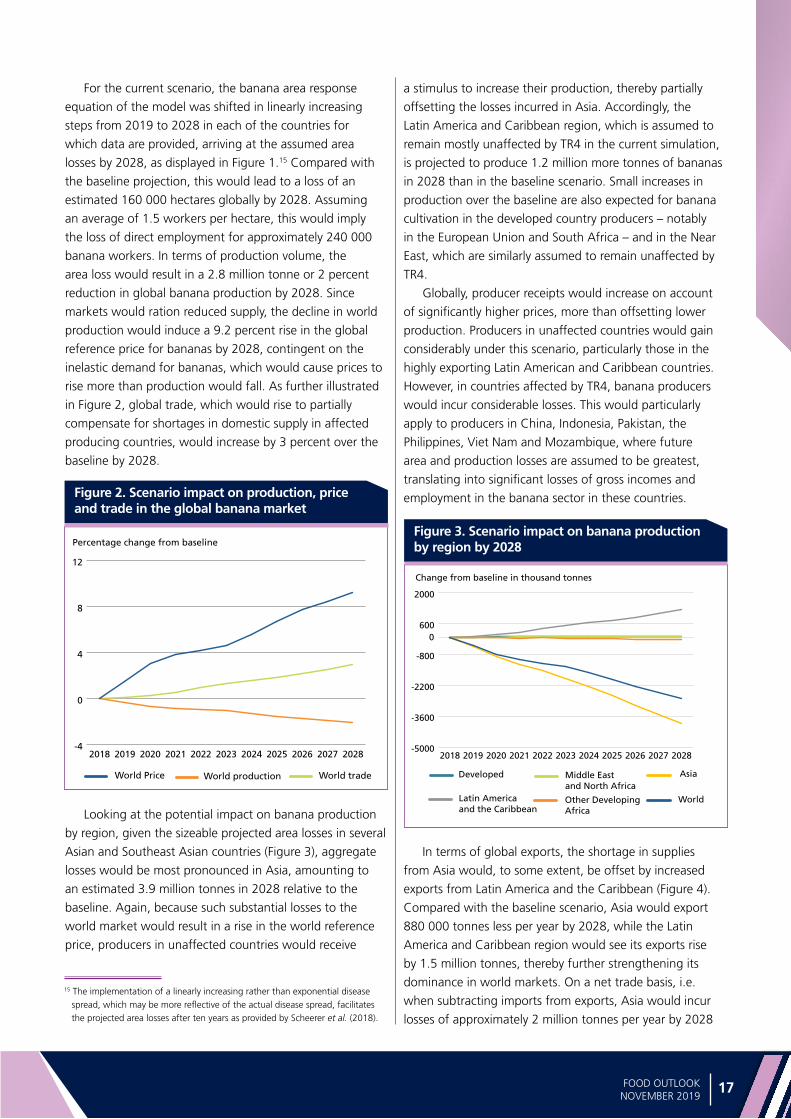
rise more than production would fall. As further illustrated
in Figure 2, global trade, which would rise to partially
compensate for shortages in domestic supply in affected
producing countries, would increase by 3 percent over the
baseline by 2028.
Looking at the potential impact on banana production
by region, given the sizeable projected area losses in several
Asian and Southeast Asian countries (Figure 3), aggregate
losses would be most pronounced in Asia, amounting to
an estimated 3.9 million tonnes in 2028 relative to the
baseline. Again, because such substantial losses to the
world market would result in a rise in the world reference
price, producers in unaffected countries would receive
a stimulus to increase their production, thereby partially
offsetting the losses incurred in Asia. Accordingly, the
Latin America and Caribbean region, which is assumed to
remain mostly unaffected by TR4 in the current simulation,
is projected to produce 1.2 million more tonnes of bananas
in 2028 than in the baseline scenario. Small increases in
production over the baseline are also expected for banana
cultivation in the developed country producers – notably
in the European Union and South Africa – and in the Near
East, which are similarly assumed to remain unaffected by
TR4.
Globally, producer receipts would increase on account
of significantly higher prices, more than offsetting lower
production. Producers in unaffected countries would gain
considerably under this scenario, particularly those in the
highly exporting Latin American and Caribbean countries.
However, in countries affected by TR4, banana producers
would incur considerable losses. This would particularly
apply to producers in China, Indonesia, Pakistan, the
Philippines, Viet Nam and Mozambique, where future
area and production losses are assumed to be greatest,
translating into significant losses of gross incomes and
employment in the banana sector in these countries.
In terms of global exports, the shortage in supplies
from Asia would, to some extent, be offset by increased
exports from Latin America and the Caribbean (Figure 4).
Compared with the baseline scenario, Asia would export
880 000 tonnes less per year by 2028, while the Latin
America and Caribbean region would see its exports rise
by 1.5 million tonnes, thereby further strengthening its
dominance in world markets. On a net trade basis, i.e.
when subtracting imports from exports, Asia would incur
losses of approximately 2 million tonnes per year by 2028
Figure 2. Scenario impact on production, price and trade in the global banana market
-4
0
4
8
12
World tradeWorld productionWorld Price
20282027202620252024202320222021202020192018
Percentage change from baseline
Figure 3. Scenario impact on banana production by region by 2028
-5000
-3600
-2200
-800
600
2000
Developed Middle Eastand North Africa
Asia
Latin Americaand the Caribbean
Other Developing Africa
World
20282027202620252024202320222021202020192018
Change from baseline in thousand tonnes
0

Co
mm
od
ity
Focu
s
18 FOOD OUTLOOKNOVEMBER 2019
under this scenario, highlighting the severely damaging
consequences of an unabated spread of TR4.
As displayed in Figure 5, in order to satisfy internal
demand, Asia would be obliged to import approximately
1.1 million tonnes per year more than it would have in the
absence of TR4. Import prices in developed countries, the
main importers of bananas, would meanwhile rise, resulting
in an estimated volume reduction of 370 000 tonnes
in 2028. In conjunction with elevated prices, the rise in
exports from Latin America and the Caribbean would
translate into considerably higher export revenues for
suppliers from this region.
On account of the resulting higher prices, the economic
costs to consumers in all regions would increase (Figure 6).
Globally, on average, while consuming almost a 2-percent
lower volume of bananas, consumers would spend
1.8 percent more on bananas by 2028 than they would
have under the baseline scenario. Regionally, the worst
impact would be felt by consumers in developed country
markets, where price elasticities for bananas tend to be
comparatively low and price transmission high, resulting in
a 3.2-percent increase from the baseline price by 2028.
The projections suggest that a further spread of TR4
would entail considerable loss of income and employment
in the banana sector in the affected countries, at varying
degrees contingent on the internal spread of the disease.
Consumers in all countries with open markets would face
rising costs due to higher prices, as market effects would
transmit across borders. In affected producing countries,
consumer costs could rise significantly as a result of possible
border controls designed to protect domestic producers.
Meanwhile, producers in unaffected countries would gain
from the higher prices induced by the global area losses
caused by TR4, and would additionally receive incentives to
increase production. Unaffected exporting countries would,
correspondingly, capture higher export revenues resulting
from higher volumes of shipments at higher unit values.
MITIGATING THE THREAT OF TR4
The simulation results suggestively illustrate the likely far-
reaching repercussions that an unmitigated spread of TR4
would have on global banana markets. The underlying
postulations of the simulation assume a low-spread
scenario, implying that the potential impact on world
banana supply and world banana markets could translate
into significantly larger effects should the disease spread
more rapidly or further afield. In particular, given the
importance of the Latin America and Caribbean region
in global banana exports, the specific outcome of the
Figure 4. Scenario change in banana exports by 2028
-1500
-800
-100
600
1300
2000
DevelopedMiddle Eastand
North Africa
AsiaLatin Americaand the
Caribbean
OtherDeveloping
Africa
World
Change from baseline in 2028 in thousand tonnes
0
Figure 5. Scenario change in banana imports by 2028
-400
-200
0
200
400
600
800
1000
1200
Change from baseline in 2028 in thousand tonnes
DevelopedMiddle Eastand
North Africa
AsiaLatin Americaand the
Caribbean
OtherDeveloping
Africa
World
Figure 6. Percentage change in consumer expenditures on bananas by 2028
0
1
2
3
4
DevelopedMENAAsiaLACDeveloping Africa
World
Percentage change from baseline in 2028
DevelopedMiddle Eastand
North Africa
AsiaLatin Americaand the
Caribbean
OtherDeveloping
Africa
World

Co
mm
od
ity Focu
s
19FOOD OUTLOOKNOVEMBER 2019
impact on global markets would hinge on whether the
recent outbreak of TR4 in Colombia can be contained
or not. In the best case scenario, the disease would not
spread further, resulting in no significant impact on global
markets diverging from the projections presented here over
the next decade.
In the worst case scenario, a wide spread of TR4 in Latin
America and the Caribbean would have a considerable
economic impact on trade, food security and the economic
wellbeing of producing countries in the region, as well as
on producers in other exporting countries and consumers
in importing countries. The potential repercussions of
infection by TR4 are of even greater concern to organic
banana production, since organic agricultural practices
do not permit genetic modifications, leaving classical
breeding of disease-resistant cultivars as the only option
for adaptation. This would be particularly alarming for the
main producing countries of organic bananas that border
Colombia, notably Peru and Ecuador.
In view of the wide-ranging potential ramifications
on both conventional and organic banana markets, the
recent outbreak of TR4 in Colombia necessitates elevated
vigilance in the banana sector, not only in Latin America
and the Caribbean, but also globally. The expertise of a
leading plant pathologist suggests that future banana
production may only become viable for growers who are
able to implement more advanced management techniques
and financially sustain significantly higher investments into
disease prevention.16 Governments of producing countries
have a key role to play in mitigating the spread of TR4
and managing the disease where it has already emerged,
particularly in view of its potential impact on smallholder
banana farmers and workers employed in the industry.
Close co-ordination of the capacity-development and
extension activities of all concerned national institutions
will be beneficial to the development of proper policies,
regulations and strategic measures that address the
challenges of TR4 in a comprehensive way. National
support schemes drawn up in strategic collaboration
with different stakeholders and designed to assist in the
implementation of adequate biosecurity measures, as
well as in the facilitation of diversified production systems
that have shown to be less susceptible to TR4 infection
than monocropping systems, may serve as responses that
can alleviate the problem. Such compensating or support
schemes may further contribute to containment of the
disease, by easing the moral hazard problem of farmers not
reporting and not treating infected plantations properly.
Markets and open trade display considerable potential
to mitigate global economic costs of a greater spread
of TR4, given the role of trade as a balancing force
between supply and demand. As previously described,
higher production in unaffected countries would largely
compensate for lower production in affected countries.
However, both national and global welfare costs can only
be efficiently contained if open trade is maintained. Closing
borders to trade would rapidly raise the economic costs of
the disease in domestic markets. As such, those developed
countries that are on a high net import position in banana
trade would benefit from investing in research on TR4
prevention and mitigation, since the impact on consumers
in developed country markets would be relatively high.
Similarly, net exporting countries stand to benefit from
investments in effective disease management strategies,
as containment of disease spread will enable exporters to
benefit from increased market access.
An assessment of the economic returns to four different
banana research investments conducted by Scheerer et
al. (2018) suggests that investments in integrated crop
and disease management, as well as in the development
of either conventional or genetically modified Fusarium-
resistant banana cultivars, would yield the highest internal
rates of return of the assessed options. The potential of
Fusarium-resistant banana cultivars in managing epidemics
of TR4 also seems evident in the progressive experiences
with somaclone varieties on some commercial farms.17 In
conjunction with stringently imposed biosecurity measures,
including early detection, effective eradication and on-
farm quarantine, the planting of the partially TR4-resistant
somaclonal Giant Cavendish Tissue Culture Variants
appears to have significantly aided in counteracting losses
from TR4. Recent advances in the development of fully
Fusarium-resistant Cavendish varieties using chemical
mutagenesis techniques or gamma radiation may offer
an even more holistic solution to abating the threat from
TR4.18 Strengthened international collaboration, particularly
with regards to enhanced data collection and information
sharing, will further support improved awareness,
prevention and containment of Fusarium wilt TR4 and
be conducive to more resilient global banana production
systems.
16 Dr Charles Staver, Bioversity International, Montpellier, France
17 www.banana-networks.org/Bapnet/2016/02/22/fusarium-wilt-resistant-cavendish-cultivars/
18 www.iaea.org/newscenter/news/iaea-fao-help-develop-bananas-resistant-to-major-fungal-disease

Co
mm
od
ity
Focu
s
20 FOOD OUTLOOKNOVEMBER 2019
REFERENCES
Acquaye, A. K. A., Alston, J. M., Lee, H. & Sumner, D. A. 2005. Economic Consequences of Invasive Species
Policies in the Presence of Commodity Programs:
Theory and Application to Citrus Canker. Review of
Agricultural Economics Volume 27, Number 3: 498-
504.
Alston, J. M., Norton, G. W., Pardey, P. G. 1998. Science
under Scarcity. Principles and Practice for Agricultural
Research Evaluation and Priority Setting. Oxford, UK.
Aquino, A. P., Bandoles, G.G. & Lim, V.A.A. 2013. R&D
and policy directions for effective control of Fusarium
Wilt Disease of Cavendish banana in the Asia-Pacific
region, retrieved 15 May 2017.
Chen, X., Dong, T., Huang, Y. & Yi, G. 2013. Socio-
economic impact of Fusarium wilt on Cavendish
banana in China. Paper presented at the Consultation-
Workshop on the Socio-economic Impacts of Fusarium
Wilt Disease of Cavendish Banana in the Asia-Pacific
Region. Davao City, Philippines, 11-15 November.
Cook, D. C., Taylor, A. S., Meldrum, R. A. & Drenth, A. 2015. Potential economic impact of Panama disease
(tropical race 4) on the Australian banana industry.
Journal of Plant Diseases and Protection, Vol. 122, No.
5/6: 229-237.
May, S. & Plaza, G. 1958. The United Fruit Company in
Latin America. National Planning Association.
Ordonez N, Seidl MF, Waalwijk C, Drenth A, Kilian A, Thomma BPHJ, et al. 2015. Worse Comes to Worst:
Bananas and Panama Disease—When Plant and
Pathogen Clones Meet. PLoS Pathog 11(11).
Pemsl, D.E. & Staver, C. 2014. Strategic assessment of
banana research priorities. Lima, CGIAR Research
Program on Roots, Tubers and Bananas (RTB). RTB
Working Paper 2014-2.
Peterson, E. & Orden, D. 2006. Linking Risk and Economic
Assessments in the Analysis of Plant Pest Regulations:
The Case of U.S. Imports of Mexican Avocados.
Selected Paper prepared for presentation at the
American Agricultural Economics Association Annual
Meeting, Long Beach, California, July 23-26.
Ploetz, R. C. & Pegg, K. 1997. Fusarium wilt of banana
and Wallace’s line: Was the disease originally restricted
to his Indo-Malayan region?. Australasion Plant
Pathology 26: 239-249.
Ploetz, R. C. 2015. Fusarium wilt of banana.
Phytopathology 102: 1512-1521.
Ploetz, R. C. 2015. Management of Fusarium wilt of
banana: A review with special reference to tropical
race 4, Crop Protection 73, 7-15.
Scheerer, L., Pemsl, D., Dita, M., Perez Vicente L. & Staver, C. 2018. A quantified approach to projecting
losses caused by Fusarium Wilt Tropical Race 4. Acta
horticulturae, 1196, March 2018.
Scheerer, L., Staver, C., Dita, M., Perez V., L. & Pemsl, D. 2018. Strategic assessment of Banana Fusarium
Wilt research priorities. A quantified approach to
project losses caused by Fusarium Wilt Tropical Race 4
& results of the ex-ante assessment of four Fusarium
research options. CGIAR Research Programme on
Roots, Tubers and Bananas (RTB). Lima, RTB Working
Paper.
Stokstad, E. 2019. Devastating banana disease may have
reached Latin America, could drive up global prices.
Sciencemag.org, 17 July 2019. (also available at www.
sciencemag.org/news/2019/07/devastating-banana-
disease-may-have-reached-latin-america-could-drive-
global-prices).

21FOOD OUTLOOKNOVEMBER 2019
Ma
jor
po
licy
de
velo
pm
en
ts
22 FOOD OUTLOOKNOVEMBER 2019
MAR
KET
POLIC
Y
DEVE
LOPM
ENTS

23FOOD OUTLOOKNOVEMBER 2019
CO
UN
TRY
DA
TEC
OM
MO
DIT
YPO
LIC
Y IN
STR
UM
ENT
DES
CR
IPTI
ON
Alg
eria
Ap
r-19
Wh
eat
Imp
ort
du
tyR
emo
ved
th
e 70
per
cen
t d
uty
on
pre
par
ed w
hea
t p
rod
uct
s d
esti
ned
fo
r d
iete
tic
foo
d f
or
spec
ial m
edic
al u
se.
An
go
laO
ct-1
9M
aize
Pro
du
ctio
n s
up
po
rtD
istr
ibu
ted
330
to
nn
es o
f fe
rtili
zer
to 6
600
far
mer
s in
th
e m
un
icip
alit
y o
f C
aála
, in
ord
er t
o e
nco
ura
ge
them
to
incr
ease
p
rod
uct
ivit
y o
f se
vera
l cro
ps,
incl
ud
ing
mai
ze.
Arg
enti
na
May
-19
Mai
zeEx
po
rt p
olic
y
Ad
op
ted
Dec
ree
208/
2019
ap
pro
vin
g n
ew e
xpo
rt-b
ased
tax
ince
nti
ves
for
smal
l an
d m
ediu
m e
nte
rpri
se (
SMEs
). T
he
new
le
gis
lati
on
allo
ws
loca
l SM
Es t
o d
edu
ct t
he
FOB
val
ue
of
the
exp
ort
tax
ad
op
ted
by
Dec
ree
793/
2018
of
3 Se
pte
mb
er 2
018.
Th
is
reg
ime
on
ly a
pp
lies
to c
om
pan
ies
that
hav
e in
crea
sed
exp
ort
s co
mp
ared
wit
h t
he
pre
vio
us
year
, or
to t
ho
se t
hat
just
sta
rted
ex
po
rtat
ion
act
ivit
ies.
Jun
-19
Gra
ins
Pro
du
ctio
n s
up
po
rtG
ran
ted
AR
S 87
mill
ion
(U
SD 1
.5 m
illio
n)
thro
ug
h t
he
Nat
ion
al F
un
d f
or
the
Mit
igat
ion
of
Ag
ricu
ltu
ral E
mer
gen
cies
an
d
Dis
aste
rs t
o a
ssis
t p
rod
uce
rs o
f al
l gra
ins
in t
he
Ch
aco
pro
vin
ce w
ho
wer
e af
fect
ed b
y se
vere
flo
od
s (R
eso
luti
on
N°.
33/
19).
Jul-
19M
aize
Pric
e su
pp
ort
Ad
op
ted
Dis
po
siti
on
119
/201
9 in
crea
sin
g t
he
pri
ce o
f su
gar
-can
e-b
ased
an
d m
aize
-bas
ed e
than
ol u
sed
in f
uel
ble
nd
ing
fo
r au
tom
ob
iles.
Th
e n
ew p
rice
s h
ave
incr
ease
d f
rom
AR
S 24
.073
to
AR
S 24
.916
(fr
om
USD
0.5
8 to
USD
0.6
) p
er li
tre,
an
d f
rom
AR
S 21
.801
to
AR
S 22
.564
(fr
om
USD
0.5
2 to
USD
0.5
4) p
er li
tre,
res
pec
tive
ly.
Sep
-19
Mai
zeG
MO
po
licy
Ap
pro
ved
a n
ew g
enet
ical
ly m
od
ified
(G
M)
mai
ze v
arie
ty f
or
com
mer
cial
pla
nti
ng
. It
pro
tect
s ag
ain
st le
pid
op
tera
inse
cts,
in
clu
din
g D
iatr
aea
sacc
har
alis
, Sp
od
op
tera
fru
gip
erd
a an
d H
elic
ove
rpa
zea
(Res
olu
tio
n N
°. 1
03/2
019)
.
Oct
-19
Gra
ins
Exp
ort
po
licy
Issu
ed a
res
olu
tio
n t
hat
cu
ts t
he
tim
e g
iven
to
exp
ort
ers
to p
ay t
axes
on
gra
in a
nd
oils
eed
exp
ort
s. T
he
reso
luti
on
will
red
uce
th
e p
erm
itte
d t
ime
for
the
reg
istr
atio
n o
f ex
po
rts
fro
m 4
5 to
30
day
s an
d f
orc
e ex
po
rter
s to
pay
th
e ta
x sh
ort
ly a
fter
th
e d
ate
of
sale
, an
d n
ot
on
th
e d
ate
of
ship
men
t, a
s is
cu
rren
tly
the
case
.
Au
stra
lia
May
-19
Wh
eat
Imp
ort
po
licy
Ap
pro
ved
per
mit
s fo
r si
ng
le im
po
rts
of
bu
lk w
hea
t fr
om
Can
ada
(su
bje
ct t
o b
iose
curi
ty r
isk
con
dit
ion
s) d
ue
to t
igh
t d
om
esti
c si
tuat
ion
cau
sed
by
last
yea
r's
dro
ug
ht-
red
uce
d c
rop
.
Sep
-19
Gra
ins
Pro
du
ctio
n s
up
po
rt
An
no
un
ced
an
aid
pac
kag
e o
f A
UD
100
mill
ion
(U
SD 6
7.5
mill
ion
) fo
r fa
rmer
s an
d c
om
mu
nit
ies
affe
cted
by
seve
re d
rou
gh
t,
of
wh
ich
AU
D 3
3 m
illio
n (
USD
22.
3 m
illio
n)
will
go
to
war
ds
resu
min
g t
he
Dro
ug
ht
Co
mm
un
ity
Sup
po
rt In
itia
tive
, un
der
wh
ich
el
igib
le h
ou
seh
old
s ar
e su
bje
ct t
o r
ecei
vin
g a
max
imu
m o
f A
UD
3 0
00 (
USD
2 0
26).
Th
e as
sist
ance
als
o in
clu
des
AU
D 1
mill
ion
(U
SD 6
75 0
00)
for
13 a
dd
itio
nal
loca
l go
vern
men
t ar
eas
for
wat
er in
fras
tru
ctu
re u
pg
rad
es a
nd
oth
er p
roje
cts.
In a
dd
itio
n,
the
Go
vern
men
t w
ill p
rovi
de
AU
D 5
1.5
mill
ion
(U
SD 3
4.8
mill
ion
) to
sim
plif
y an
d e
xten
d t
he
Farm
Ho
use
ho
ld A
llow
ance
p
rog
ram
me.
Bra
zil
May
-19
Mai
ze a
nd
wh
eat
Pro
du
ctio
n s
up
po
rtR
elea
sed
th
e b
ud
get
fo
r th
e R
ura
l In
sura
nce
Pre
miu
m P
rog
ram
me
2019
, allo
cati
ng
BR
L 12
5 m
illio
n (
USD
30.
9 m
illio
n)
to w
inte
r cr
op
s su
ch a
s su
nfl
ow
er a
nd
wh
eat,
an
d B
RL
160
mill
ion
(U
SD 3
9.6
mill
ion
) to
so
ybea
n, m
aize
, ric
e, b
ean
s an
d c
off
ee c
rop
s.
Jun
-19
Gra
ins
Go
vern
men
t su
pp
ort
Lau
nch
ed P
lan
Saf
ra 2
019/
2020
. BR
L 22
5 b
illio
n (
USD
58.
4 b
illio
n)
will
be
inve
sted
in t
he
agri
cult
ure
sec
tor,
of
wh
ich
BR
L 22
2 b
illio
n (
USD
57.
65 b
illio
n)
will
be
allo
cate
d t
o r
ura
l cre
dit
s, B
RL
1 b
illio
n (
USD
258
.1 m
illio
n)
to in
sura
nce
pre
miu
ms,
an
d B
RL
1.85
bill
ion
(U
SD 4
77.6
mill
ion
) to
mar
keti
ng
.
Gra
ins
GRA
INS:
M
AJO
R PO
LICY
DEV
ELO
PMEN
TS M
ID-A
PRIL
TO
MID
-OCT
OBE
R 20
19*

Ma
jor
po
licy
de
velo
pm
en
ts
24 FOOD OUTLOOKNOVEMBER 2019
CO
UN
TRY
DA
TEC
OM
MO
DIT
YPO
LIC
Y IN
STR
UM
ENT
DES
CR
IPTI
ON
Bra
zil
Sep
-19
Gra
ins
Go
vern
men
t su
pp
ort
Au
tho
rize
d B
RL
25.3
mill
ion
(U
SD 6
.07
mill
ion
) in
pay
men
ts t
o p
rod
uce
rs a
ffec
ted
by
seve
re d
rou
gh
t th
rou
gh
th
e H
arve
st
Gu
aran
tee
Pro
gra
m. T
he
pay
men
ts w
ere
to b
e m
ade
avai
lab
le t
o f
arm
ers
fro
m S
epte
mb
er 2
019
in t
he
no
rth
an
d t
he
no
rth
east
re
gio
ns
(Ord
inan
ce N
°. 4
315)
.
Can
ada
Jul-
19G
rain
sPr
od
uct
ion
su
pp
ort
An
no
un
ced
th
at c
rop
pro
du
cers
wh
o w
ere
imp
acte
d b
y lo
w p
rice
s, r
edu
ced
mar
keti
ng
op
po
rtu
nit
ies
or
falli
ng
inco
mes
wo
uld
b
e el
igib
le f
or
an a
dd
itio
nal
six
mo
nth
s to
rep
ay o
uts
tan
din
g 2
018
cash
ad
van
ces
un
der
th
e fi
nan
cial
loan
gu
aran
tee
init
iati
ve
(Ad
van
ce P
aym
ents
Pro
gra
m).
A s
tay
of
def
ault
sch
eme
will
pro
vid
e ad
dit
ion
al fl
exib
ility
to
rep
ay c
ash
ad
van
ces,
par
ticu
larl
y fo
r g
rain
, oils
eed
s an
d p
uls
es.
Jul-
19W
hea
tEx
po
rt p
olic
yR
esu
med
sh
ipm
ents
of
wh
eat
and
pu
lses
aft
er a
fo
ur-
year
wea
ther
-rel
ated
inte
rru
pti
on
. Reo
pen
ing
th
e Po
rt o
f C
hu
rch
ill is
ex
pec
ted
to
gen
erat
e co
nsi
der
able
effi
cien
cy g
ain
s in
ch
ann
elin
g g
rain
an
d p
uls
es t
o E
uro
pe,
No
rth
Afr
ica
and
th
e M
idd
le E
ast.
Au
g-1
9W
hea
tG
ove
rnm
ent
sup
po
rt
Step
ped
up
inve
stm
ents
in g
rain
tra
nsp
ort
infr
astr
uct
ure
, lo
gis
tics
an
d p
rod
uct
ivit
y im
pro
vem
ents
to
min
imiz
e co
ng
esti
on
in t
he
Port
of
Joh
nst
ow
n, a
str
ateg
ic e
xpo
rt g
atew
ay f
or
wh
eat,
mai
ze a
nd
so
ybea
ns
in O
nta
rio
an
d Q
ueb
ec. A
fu
rth
er C
AD
20
mill
ion
(U
SD 1
5.2
mill
ion
) w
ere
inve
sted
to
imp
rove
rai
l cap
acit
y in
Bri
tish
Co
lum
bia
, exp
and
ter
min
als
in t
he
Port
of
Van
cou
ver,
and
en
sure
th
e co
nti
nu
ed c
om
pet
itiv
enes
s an
d e
ffici
ency
of
rail
tran
spo
rt n
etw
ork
s.
Ch
ile
Jun
-19
Wh
eat
Trad
e p
olic
yIn
crea
sed
ap
plic
able
dis
cou
nts
on
cu
sto
ms
du
ties
fo
r w
hea
t an
d w
hea
t o
r m
eslin
flo
ur
fro
m U
SD 9
1.6
to U
SD 9
7.9
per
to
nn
e,
and
fro
m U
SD 1
42.9
to
USD
152
.8 p
er t
on
ne,
res
pec
tive
ly. T
hes
e d
isco
un
ts w
ere
to a
pp
ly f
or
a tw
o-m
on
th p
erio
d s
tart
ing
on
16
Jun
e 20
19.
Au
g-1
9W
hea
tTr
ade
po
licy
Red
uce
d t
he
dis
cou
nts
on
cu
sto
ms
du
ties
fo
r w
hea
t an
d w
hea
t o
r m
eslin
flo
ur.
The
dis
cou
nts
will
ap
ply
fo
r a
two
-mo
nth
per
iod
st
arte
d o
n 1
6 A
ug
ust
201
9. T
he
app
licab
le d
isco
un
ts h
ave
dec
reas
ed f
rom
USD
97.
9 to
USD
84.
6 p
er t
on
ne
of
wh
eat,
an
d f
rom
U
SD 1
52.8
to
USD
131
.9 p
er t
on
ne
of
wh
eat
or
mes
lin fl
ou
r.
Ch
ina
(Mai
nla
nd
)
May
-19
Gra
ins
Pro
du
ctio
n s
up
po
rtR
elea
sed
a w
arn
ing
ag
ain
st t
he
spre
ad o
f Fa
ll A
rmyw
orm
an
d it
s p
ote
nti
al n
egat
ive
imp
act
on
th
e o
utp
ut
and
qu
alit
y o
f g
rain
s in
no
rth
ern
are
as.
May
-19
Mai
ze a
nd
wh
eat
Imp
ort
tar
iff
Incr
ease
d t
arif
fs o
n U
SD 6
0 b
illio
n w
ort
h o
f U
S g
oo
ds,
fro
m 1
0 to
25
per
cen
t o
n L
ist
1 p
rod
uct
s, 1
0 to
20
per
cen
t o
n L
ist
2 p
rod
uct
s, a
nd
5 t
o 1
0 p
erce
nt
on
Lis
t 3
pro
du
cts,
wh
ich
incl
ud
e w
hea
t, m
aize
an
d s
oy
pro
du
cts.
Jun
-19
Gra
ins
Pro
du
ctio
n s
up
po
rt
Rec
om
men
ded
a li
st o
f 25
pes
tici
des
fo
r em
erg
ency
use
ag
ain
st a
rmyw
orm
s u
nti
l Dec
emb
er 2
020.
Jul-
19W
hea
tIm
po
rt p
olic
yA
pp
rove
d im
po
rts
of
wh
eat
fro
m R
uss
ia's
Ku
rgan
reg
ion
.
Au
g-1
9M
aize
, wh
eat
and
so
rgh
um
Imp
ort
du
tyA
nn
ou
nce
d t
hat
ad
dit
ion
al d
uti
es o
f 10
per
cen
t o
n U
S w
hea
t, m
aize
an
d s
org
hu
m w
ill e
nte
r in
to f
orc
e o
n 1
5 D
ecem
ber
201
9.
Oct
-19
Mai
zeG
ove
rnm
ent
mar
ket
inte
rven
tio
nA
nn
ou
nce
d t
hat
sta
te-h
eld
au
ctio
ns
for
mai
ze r
eser
ves
will
co
ncl
ud
e b
y 18
Oct
ob
er 2
019,
mar
kin
g a
n e
nd
to
fo
ur
year
s o
f au
ctio
ns.
Oct
-19
Wh
eat
Pro
cure
men
t p
rice
Set
the
2020
min
imu
m p
urc
has
ing
pri
ce f
or
do
mes
tic
wh
eat
at C
NY
2 2
40 (
USD
316
.08)
per
to
nn
e, t
he
sam
e le
vel a
s 20
19, b
ut
said
it w
ill c
ap t
he
volu
me
it b
uys
fro
m f
arm
ers
un
der
th
e g
uar
ante
e p
rog
ram
me
at 3
7 m
illio
n t
on
nes
.
Oct
-19
Mai
ze a
nd
wh
eat
Pro
du
ctio
n s
up
po
rtEx
ten
ded
th
e in
sura
nce
co
vera
ge
on
mai
ze a
nd
wh
eat
pla
nti
ng
s to
ove
r 70
per
cen
t b
y 20
22 a
t th
e p
rem
ium
of
1 p
erce
nt
of
valu
e-ad
ded
ag
ricu
ltu
ral o
utp
ut.

25FOOD OUTLOOKNOVEMBER 2019
Gra
ins
CO
UN
TRY
DA
TEC
OM
MO
DIT
YPO
LIC
Y IN
STR
UM
ENT
DES
CR
IPTI
ON
Egyp
t
Jul-
19W
hea
tIm
po
rt r
equ
irem
ents
Co
nfi
rmed
th
e m
ain
ten
ance
of
a 13
.5 p
erce
nt
mo
istu
re c
on
ten
t re
qu
irem
ent
in w
hea
t im
po
rts
(tri
ticu
m a
esti
vum
) u
nti
l Ap
ril
2020
.
Oct
-19
Wh
eat
Go
vern
men
t m
arke
t in
terv
enti
on
Issu
ed d
ecre
e N
°. 1
66 f
or
2019
, wh
ich
sta
tes
that
sp
ecifi
cati
on
s o
f su
bsi
diz
ed fl
ou
r ex
trac
tio
n 8
2 p
erce
nt
hav
e b
een
alt
ered
. Mill
o
wn
ers
and
man
ager
s w
ho
are
lice
nse
d t
o p
rod
uce
wh
eat
flo
ur
extr
acti
on
82
per
cen
t ar
e to
pro
du
ce fl
ou
r as
per
th
e fo
llow
ing
sp
ecifi
cati
on
s: t
he
mo
istu
re r
ate
wo
uld
no
t ex
ceed
14
per
cen
t; a
sh c
on
ten
t o
n d
ry m
atte
r b
asis
wo
uld
no
t ex
ceed
0.1
per
cen
t;
fib
res
wo
uld
no
t ex
ceed
0.4
per
cen
t; s
and
wo
uld
no
t ex
ceed
0.1
per
cen
t. T
he
flo
ur
wo
uld
be
free
of
red
sh
ort
s, a
s w
ell a
s o
f so
ft a
nd
co
arse
bra
n; c
lean
an
d f
ree
of
inse
cts
in a
ll it
s st
ages
an
d f
ree
of
fore
ign
mat
ter,
and
wo
uld
hav
e a
nat
ura
l co
lou
r an
d
od
ou
r.
Esw
atin
iJu
n-1
9M
aize
Go
vern
men
t m
arke
t in
terv
enti
on
Rai
sed
mai
ze s
ellin
g p
rice
to
SZL
4 0
00 (
USD
283
) p
er t
on
ne
and
th
e b
uyi
ng
pri
ce t
o S
ZL 2
800
(U
SD 1
98)
per
to
nn
e, a
bo
ut
15
per
cen
t an
d 8
per
cen
t h
igh
er t
han
last
yea
r's
leve
ls, r
esp
ecti
vely
.
Eth
iop
iaO
ct-1
9W
hea
tPr
od
uct
ion
su
pp
ort
Lau
nch
ed a
n in
itia
tive
to
pro
du
ce w
hea
t in
th
ree
low
lan
d b
asin
s o
f th
e co
un
try:
Aw
ash
, Wab
esh
ebel
le a
nd
Om
o b
asin
s,
loca
tio
ns
wh
ere
wh
eat
pro
du
ctio
n w
as n
ot
pre
vio
usl
y p
ract
ised
. Th
e lo
wla
nd
wh
eat
init
iati
ve w
ill c
ove
r m
ore
th
an 1
32 0
00
hec
tare
s (h
a) o
f la
nd
acr
oss
th
e th
ree
bas
ins,
an
d is
exp
ecte
d t
o p
rod
uce
nea
rly
6 m
illio
n q
uin
tals
of
wh
eat,
alo
ng
wit
h m
ore
th
an 1
00 0
00 q
uin
tals
of
imp
rove
d w
hea
t se
eds.
Euro
pea
n U
nio
n
Jun
-19
Gra
ins
Trad
e ag
reem
ent
A t
rad
e ag
reem
ent
was
sig
ned
bet
wee
n t
he
EU a
nd
So
uth
ern
Co
mm
on
Mar
ket
(MER
CO
SUR
) co
un
trie
s (A
rgen
tin
a, B
razi
l, Pa
rag
uay
an
d U
rug
uay
) th
at w
ill p
rog
ress
ivel
y en
han
ce m
arke
t ac
cess
fo
r g
oo
ds
and
ser
vice
s, w
hile
pro
mo
tin
g c
oo
per
atio
n in
cu
sto
ms
issu
es, f
oo
d s
afet
y an
d s
ust
ain
able
tra
de.
Jul-
19M
aize
GM
O p
olic
yA
pp
rove
d im
po
rts
of
new
GM
cro
ps
for
pro
cess
ing
an
d u
se in
fo
od
an
d f
eed
, in
clu
din
g 6
mai
ze t
rait
s an
d o
ne
stac
ked
-tra
it
mai
ze li
ne
(res
ult
ing
fro
m t
he
com
bin
atio
n o
f ap
pro
ved
sin
gle
tra
its)
. Im
po
rt a
pp
rova
ls f
or
foo
d a
nd
fee
d w
ere
also
ren
ewed
fo
r o
ne
GM
mai
ze li
ne
and
on
e va
riet
y o
f g
lufo
sin
ate-
tole
ran
t o
ilsee
d r
ape.
Jul-
19G
rain
sG
ove
rnm
ent
sup
po
rt
In t
he
wak
e o
f a
pro
lon
ged
dro
ug
ht,
th
e Eu
rop
ean
Co
mm
issi
on
fac
ilita
ted
th
e co
llect
ion
of
dir
ect
pay
men
ts a
nd
ru
ral
dev
elo
pm
ent
fun
ds
un
der
th
e C
om
mo
n A
gri
cult
ura
l Po
licy
(CA
P), t
hu
s al
low
ing
pro
du
cers
to
co
llect
a h
igh
er s
har
e o
f p
aym
ent
adva
nce
s in
mid
-Oct
ob
er in
stea
d o
f D
ecem
ber
. In
ad
dit
ion
, to
man
age
po
ssib
le f
od
der
sh
ort
ages
, dev
iati
on
s fr
om
cer
tain
CA
P g
reen
ing
req
uir
emen
ts w
ill b
e g
ran
ted
, fo
r ex
amp
le t
o a
llow
fal
low
lan
d t
o b
e u
sed
fo
r g
razi
ng
.
Ind
ia
Ap
r-19
Wh
eat
Imp
ort
du
tyIn
crea
sed
th
e im
po
rt d
uty
on
wh
eat
fro
m 3
0 p
erce
nt
to 4
0 p
erce
nt,
in a
n e
ffo
rt t
o c
urb
imp
ort
s an
d o
fflo
ad e
xces
s g
rain
fro
m
sto
rag
e u
nit
s.
Ap
r-19
Wh
eat
Go
vern
men
t m
arke
t in
terv
enti
on
An
no
un
ced
th
e re
serv
e p
rice
of
wh
eat
for
sale
un
der
th
e o
pen
mar
ket
sale
sch
eme
(OM
SS)
for
the
firs
t q
uar
ter
of
MY
201
9/20
(A
pri
l-Ju
ne)
at
INR
20
800
(USD
301
) p
er t
on
ne,
wit
h a
n in
crem
ent
of
INR
550
(U
SD 8
) p
er t
on
ne
in t
he
sub
seq
uen
t th
ree
qu
arte
rs.
May
-19
Wh
eat
Go
vern
men
t m
arke
t in
terv
enti
on
Fixe
d t
he
rese
rve
pri
ce o
f w
hea
t u
nd
er o
pen
mar
ket
sale
fro
m o
ffici
al s
tock
at
INR
2 0
80 p
er q
uin
tal (
USD
292
.4 p
er t
on
ne)
, m
uch
hig
her
th
an t
he
min
imu
m s
up
po
rt p
rice
, du
rin
g t
he
pro
cure
men
t p
erio
d A
pri
l–Ju
ne
and
an
no
un
ced
an
INR
55
per
qu
inta
l (U
SD 7
.7 p
er t
on
ne)
incr
ease
in e
ach
of
the
sub
seq
uen
t q
uar
ters
.
Jun
-19
Mai
zeIm
po
rt p
olic
yA
llow
ed im
po
rts
of
100
000
ton
nes
of
mai
ze, a
t a
red
uce
d im
po
rt d
uty
of
15 p
erce
nt
(60
per
cen
t st
and
ing
du
ty).
Jul-
19B
arle
y an
d m
aize
Go
vern
men
t p
rocu
rem
ent
Incr
ease
d t
he
min
imu
m s
up
po
rt p
rice
fo
r m
aize
by
3.5
per
cen
t, t
o IN
R 1
760
per
qu
inta
l (U
SD 2
45.5
per
to
nn
e), a
nd
fo
r so
rgh
um
b
y 5
per
cen
t, t
o IN
R 2
500
per
qu
inta
l (U
SD 3
51.5
per
to
nn
e).

Ma
jor
po
licy
de
velo
pm
en
ts
26 FOOD OUTLOOKNOVEMBER 2019
CO
UN
TRY
DA
TEC
OM
MO
DIT
YPO
LIC
Y IN
STR
UM
ENT
DES
CR
IPTI
ON
Jul-
19G
rain
sG
ove
rnm
ent
sup
po
rt
Rel
ease
d t
he
Un
ion
Bu
dg
et f
or
2019
–20,
allo
cati
ng
INR
1 3
04 b
illio
n (
USD
18.2
bill
ion
) to
th
e ag
ricu
ltu
re s
ecto
r. Th
e U
nio
n
Bu
dg
et in
clu
des
an
inve
stm
ent
of
INR
750
bill
ion
(U
SD 1
0.5
bill
ion
) fo
r th
e in
com
e su
pp
ort
sch
eme
(PM
-KIS
AN
); IN
R 3
5 b
illio
n
(USD
488
mill
ion
) fo
r fa
rm p
rod
uct
ivit
y; a
nd
INR
8 b
illio
n (
USD
111
.6 m
illio
n)
for
agri
cult
ure
-rel
ated
infr
astr
uct
ure
. In
ad
dit
ion
, fe
rtili
zer
sub
sid
y al
loca
tio
ns
wer
e in
crea
sed
by
INR
100
bill
ion
(U
SD 1
.4 b
illio
n)
to a
bo
ut
INR
800
bill
ion
(U
SD 1
1.2
bill
ion
).
Jul-
19M
aize
Imp
ort
du
tyLo
wer
ed t
he
imp
ort
du
ty o
n a
n a
dd
itio
nal
400
000
to
nn
es o
f fe
ed g
rad
e m
aize
to
15
per
cen
t, t
o s
tab
ilize
po
ult
ry f
eed
pri
ces.
Jul-
19G
rain
sG
ove
rnm
ent
sup
po
rt
Intr
od
uce
d a
n in
tere
st s
ub
ven
tio
n s
chem
e ap
plic
able
fo
r sh
ort
-ter
m c
rop
loan
s o
f u
p t
o IN
R 3
00 0
00 (
USD
4 1
84).
Th
e n
orm
al
inte
rest
rat
e av
aila
ble
to
far
mer
s is
7 p
erce
nt
per
an
nu
m. U
nd
er t
he
sch
eme,
th
e G
ove
rnm
ent
will
su
bsi
diz
e in
tere
st a
t th
e le
vel
of
2 p
erce
nt
per
an
nu
m o
n t
he
rest
ruct
ure
d lo
an a
mo
un
t, t
o m
itig
ate
the
effe
cts
of
nat
ura
l dis
aste
rs (
up
to
a m
axim
um
of
5 ye
ars)
. An
ad
dit
ion
al 3
per
cen
t w
ill b
e o
ffer
ed t
o in
cen
tivi
ze p
rom
pt
rep
aym
ent
by
farm
ers,
th
ereb
y re
du
cin
g t
he
effe
ctiv
e in
tere
st r
ate
to 4
per
cen
t.
Oct
-19
Wh
eat
Pro
cure
men
t p
rice
Incr
ease
d t
he
min
imu
m s
up
po
rt p
rice
of
wh
eat
by
INR
85
to 1
925
per
qu
inta
l (b
y U
SD 1
2 to
271
.8 p
er t
on
ne)
.
Ital
yJu
l-19
Wh
eat
Pro
du
ctio
n s
up
po
rtTh
e It
alia
n e
xpo
rt c
red
it a
gen
cy S
AC
E, t
og
eth
er w
ith
th
e C
assa
Dep
osi
ti e
Pre
stit
i, h
as a
nn
ou
nce
d a
n in
vest
men
t o
f EU
R 3
5 m
illio
n in
Ital
ian
wh
eat
firm
th
e C
asill
o G
rou
p. T
he
inve
stm
ent
aim
s to
su
pp
ort
tec
hn
olo
gic
al r
enew
al a
nd
str
eng
then
th
e g
rou
p’s
pro
du
ctio
n c
apac
ity
in t
he
agri
foo
d s
ecto
r, as
wel
l as
to s
up
po
rt e
xpo
rts
on
inte
rnat
ion
al m
arke
ts.
Iraq
Oct
-19
Wh
eat
Pro
du
ctio
n s
up
po
rtA
pp
rove
d a
lloca
tio
n o
f 2.
25 m
illio
n h
a o
f ag
ricu
ltu
ral l
and
fo
r w
hea
t p
lan
tin
g in
th
e 20
19–2
0 se
aso
n, 5
00 0
00 h
a m
ore
th
an t
he
pre
vio
us
seas
on
.
Jap
an
Au
g-1
9M
aize
an
d
sorg
hu
mG
ove
rnm
ent
mar
ket
inte
rven
tio
n
In r
esp
on
se t
o t
he
Fall
Arm
ywo
rm o
utb
reak
, th
e G
ove
rnm
ent
ann
ou
nce
d a
su
pp
ort
pay
men
t o
f JP
Y 5
000
(U
SD 4
6.8)
per
to
nn
e if
far
mer
s p
urc
has
e fe
ed o
ther
th
an m
aize
. It
also
pro
vid
ed fi
nan
cial
su
pp
ort
fo
r st
ora
ge
cost
s fo
r im
po
rted
fee
d, a
nd
es
tab
lish
ed a
list
of
per
mit
ted
pes
tici
des
to
use
on
mai
ze a
nd
so
rgh
um
cro
ps.
Sep
-19
Mai
ze a
nd
wh
eat
Trad
e ag
reem
ent
Sig
ned
a t
rad
e ag
reem
ent
wit
h t
he
US
on
ag
ricu
ltu
ral p
rod
uct
s an
d d
igit
al t
rad
e. T
he
agre
emen
t w
ill lo
wer
or
elim
inat
e ta
riff
s o
n s
ever
al U
S ag
ricu
ltu
ral p
rod
uct
s, in
clu
din
g s
wee
t m
aize
. Fo
r so
me
com
mo
dit
ies,
incl
ud
ing
US
wh
eat
and
mai
ze s
tarc
h,
pre
fere
nti
al m
arke
t ac
cess
will
be
pro
vid
ed t
hro
ug
h t
he
crea
tio
n o
f co
un
try-
sp
ecifi
c ta
riff
qu
ota
s.
Oct
-19
Mai
ze a
nd
wh
eat
Trad
e ag
reem
ent
Sig
ned
th
e U
S-Ja
pan
Tra
de
Ag
reem
ent
and
US-
Jap
an D
igit
al T
rad
e A
gre
emen
t. T
he
agre
emen
ts p
rovi
ded
fo
r a
du
ty-f
ree
cou
ntr
y-sp
ecifi
c ta
riff
qu
ota
of
150
000
for
US
wh
eat
imp
ort
s o
ver
a 9-
year
per
iod
. Th
e m
inim
um
sel
ling
pri
ce r
ang
es b
etw
een
JP
Y 8
.5 a
nd
9.4
per
kg
– b
etw
een
USD
78.
3 an
d U
SD 8
6.6
per
to
nn
e (r
edu
ced
by
45 p
erce
nt
for
two
cat
ego
ries
of
wh
eat
pro
du
cts)
. Sim
ilarl
y, it
pro
vid
ed f
or
a co
un
try-
spec
ific
tari
ff r
ate
qu
ota
of
3 25
0 fo
r U
S m
aize
sta
rch
imp
ort
s o
ver
a 6-
year
per
iod
.
Kaz
akh
stan
Sep
-19
Wh
eat
Pro
cure
men
t p
rice
An
no
un
ced
pro
cure
men
t p
rice
s fo
r 20
19 g
rain
s. T
he
pri
ce f
or
wh
eat
3rd
gra
de
no
w r
ang
es f
rom
KZT
70
000
(USD
179
) to
KZT
76
000
(U
SD 1
94)
per
to
nn
e, a
gai
nst
KZT
54
000
(USD
138
) to
KZT
54
300
(USD
139
) in
th
e p
ast
seas
on
, set
in N
ove
mb
er 2
018.
Pr
ices
fo
r w
hea
t 4t
h g
rad
e va
ry f
rom
KZT
62
000
(USD
158
) to
KZT
65
000
(USD
166
) p
er t
on
ne.
All
pri
ces
are
incl
usi
ve o
f V
AT.
Ken
yaM
ay-1
9M
aize
Sto
cks
rele
ase
Rel
ease
d 3
mill
ion
mai
ze b
ags
fro
m t
he
stra
teg
ic r
eser
ves
in o
rder
to
eas
e th
e g
rain
s sh
ort
age
affe
ctin
g t
he
cou
ntr
y an
d c
urb
ri
sin
g fl
ou
r p
rice
s. M
iller
s ar
e n
ow
pay
ing
KES
3 0
00 f
or
a 90
kg
bag
(U
SD 3
21.4
per
to
nn
e) o
f m
aize
, do
wn
fro
m K
ES 3
400
(U
SD
364.
2 p
er t
on
ne)
last
mo
nth
, wit
h p
rice
s ex
pec
ted
to
fal
l fu
rth
er a
s fa
rmer
s re
leas
e th
e st
ock
s th
ey h
ave
bee
n h
oar
din
g t
o t
he
mar
ket.
Ken
yaJu
l-19
Wh
eat
Pro
du
ctio
n s
up
po
rtPr
ovi
ded
pes
tici
des
wit
h a
to
tal v
alu
e o
f K
ES 2
00 m
illio
n (
USD
1.9
mill
ion
) to
co
mb
at q
uel
a b
ird
s, w
hic
h d
estr
oy
tho
usa
nd
s o
f h
ecta
res
of
wh
eat
in N
aro
k C
ou
nty
du
rin
g h
arve
st-t
ime.
Jul-
19M
aize
Imp
ort
du
tyO
pen
ed a
win
do
w f
or
du
ty-f
ree
imp
ort
of
12.5
mill
ion
bag
s o
f m
aize
sta
rtin
g a
t th
e en
d o
f Ju
ly 2
019,
to
ad
dre
ss a
sh
ort
fall
in
mai
ze. T
he
imp
ort
s w
ere
exp
ecte
d t
o la
st u
nti
l en
d o
f O
cto
ber
201
9.
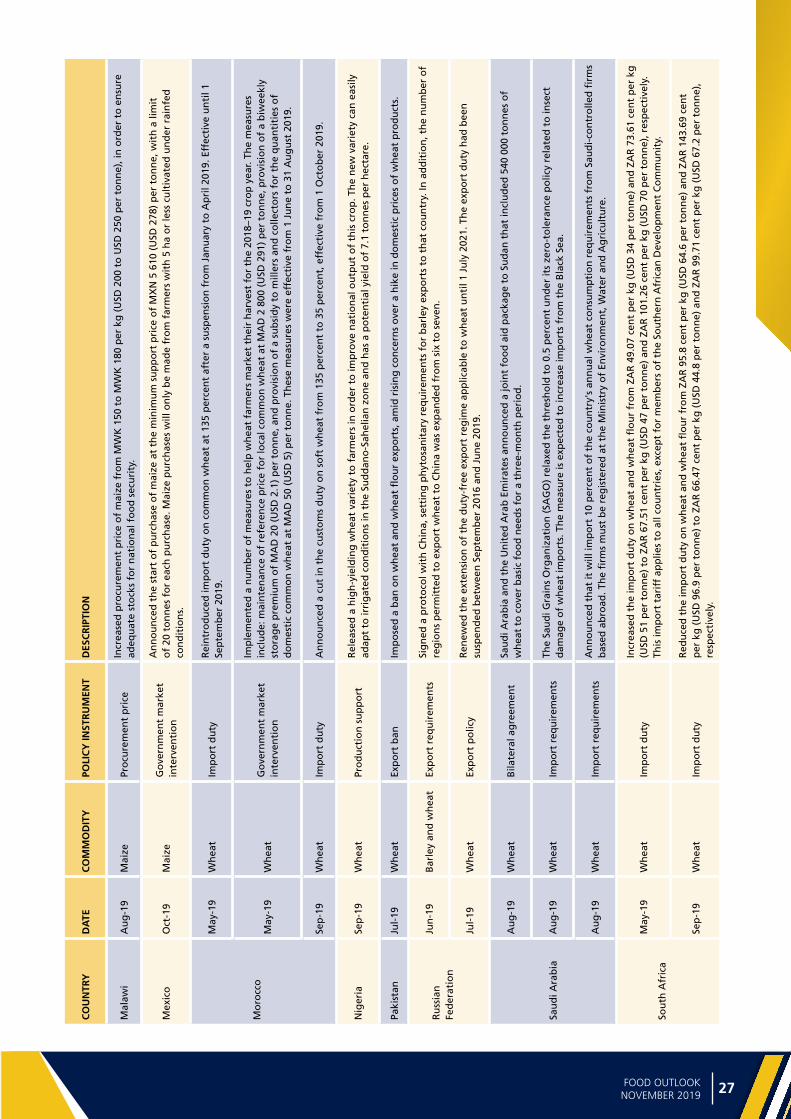
27FOOD OUTLOOKNOVEMBER 2019
Gra
ins
CO
UN
TRY
DA
TEC
OM
MO
DIT
YPO
LIC
Y IN
STR
UM
ENT
DES
CR
IPTI
ON
Mal
awi
Au
g-1
9M
aize
Pro
cure
men
t p
rice
Incr
ease
d p
rocu
rem
ent
pri
ce o
f m
aize
fro
m M
WK
150
to
MW
K 1
80 p
er k
g (
USD
200
to
USD
250
per
to
nn
e), i
n o
rder
to
en
sure
ad
equ
ate
sto
cks
for
nat
ion
al f
oo
d s
ecu
rity
.
Mex
ico
Oct
-19
Mai
zeG
ove
rnm
ent
mar
ket
inte
rven
tio
n
An
no
un
ced
th
e st
art
of
pu
rch
ase
of
mai
ze a
t th
e m
inim
um
su
pp
ort
pri
ce o
f M
XN
5 6
10 (
USD
278
) p
er t
on
ne,
wit
h a
lim
it
of
20 t
on
nes
fo
r ea
ch p
urc
has
e. M
aize
pu
rch
ases
will
on
ly b
e m
ade
fro
m f
arm
ers
wit
h 5
ha
or
less
cu
ltiv
ated
un
der
rai
nfe
d
con
dit
ion
s.
Mo
rocc
o
May
-19
Wh
eat
Imp
ort
du
tyR
ein
tro
du
ced
imp
ort
du
ty o
n c
om
mo
n w
hea
t at
135
per
cen
t af
ter
a su
spen
sio
n f
rom
Jan
uar
y to
Ap
ril 2
019.
Eff
ecti
ve u
nti
l 1
Sep
tem
ber
201
9.
May
-19
Wh
eat
Go
vern
men
t m
arke
t in
terv
enti
on
Imp
lem
ente
d a
nu
mb
er o
f m
easu
res
to h
elp
wh
eat
farm
ers
mar
ket
thei
r h
arve
st f
or
the
2018
–19
cro
p y
ear.
The
mea
sure
s in
clu
de:
mai
nte
nan
ce o
f re
fere
nce
pri
ce f
or
loca
l co
mm
on
wh
eat
at M
AD
2 8
00 (
USD
291
) p
er t
on
ne,
pro
visi
on
of
a b
iwee
kly
sto
rag
e p
rem
ium
of
MA
D 2
0 (U
SD 2
.1)
per
to
nn
e, a
nd
pro
visi
on
of
a su
bsi
dy
to m
iller
s an
d c
olle
cto
rs f
or
the
qu
anti
ties
of
do
mes
tic
com
mo
n w
hea
t at
MA
D 5
0 (U
SD 5
) p
er t
on
ne.
Th
ese
mea
sure
s w
ere
effe
ctiv
e fr
om
1 J
un
e to
31
Au
gu
st 2
019.
Sep
-19
Wh
eat
Imp
ort
du
tyA
nn
ou
nce
d a
cu
t in
th
e cu
sto
ms
du
ty o
n s
oft
wh
eat
fro
m 1
35 p
erce
nt
to 3
5 p
erce
nt,
eff
ecti
ve f
rom
1 O
cto
ber
201
9.
Nig
eria
Sep
-19
Wh
eat
Pro
du
ctio
n s
up
po
rtR
elea
sed
a h
igh
-yie
ldin
g w
hea
t va
riet
y to
far
mer
s in
ord
er t
o im
pro
ve n
atio
nal
ou
tpu
t o
f th
is c
rop
. Th
e n
ew v
arie
ty c
an e
asily
ad
apt
to ir
rig
ated
co
nd
itio
ns
in t
he
Sud
dan
o-S
ahel
ian
zo
ne
and
has
a p
ote
nti
al y
ield
of
7.1
ton
nes
per
hec
tare
.
Paki
stan
Jul-
19W
hea
tEx
po
rt b
anIm
po
sed
a b
an o
n w
hea
t an
d w
hea
t fl
ou
r ex
po
rts,
am
id r
isin
g c
on
cern
s o
ver
a h
ike
in d
om
esti
c p
rice
s o
f w
hea
t p
rod
uct
s.
Ru
ssia
n
Fed
erat
ion
Jun
-19
Bar
ley
and
wh
eat
Exp
ort
req
uir
emen
tsSi
gn
ed a
pro
toco
l wit
h C
hin
a, s
etti
ng
ph
yto
san
itar
y re
qu
irem
ents
fo
r b
arle
y ex
po
rts
to t
hat
co
un
try.
In a
dd
itio
n, t
he
nu
mb
er o
f re
gio
ns
per
mit
ted
to
exp
ort
wh
eat
to C
hin
a w
as e
xpan
ded
fro
m s
ix t
o s
even
.
Jul-
19W
hea
tEx
po
rt p
olic
yR
enew
ed t
he
exte
nsi
on
of
the
du
ty-f
ree
exp
ort
reg
ime
app
licab
le t
o w
hea
t u
nti
l 1 J
uly
202
1. T
he
exp
ort
du
ty h
ad b
een
su
spen
ded
bet
wee
n S
epte
mb
er 2
016
and
Ju
ne
2019
.
Sau
di A
rab
ia
Au
g-1
9W
hea
tB
ilate
ral a
gre
emen
tSa
ud
i Ara
bia
an
d t
he
Un
ited
Ara
b E
mir
ates
an
no
un
ced
a jo
int
foo
d a
id p
acka
ge
to S
ud
an t
hat
incl
ud
ed 5
40 0
00 t
on
nes
of
wh
eat
to c
ove
r b
asic
fo
od
nee
ds
for
a th
ree-
mo
nth
per
iod
.
Au
g-1
9W
hea
tIm
po
rt r
equ
irem
ents
The
Sau
di G
rain
s O
rgan
izat
ion
(SA
GO
) re
laxe
d t
he
thre
sho
ld t
o 0
.5 p
erce
nt
un
der
its
zero
-to
lera
nce
po
licy
rela
ted
to
inse
ct
dam
age
of
wh
eat
imp
ort
s. T
he
mea
sure
is e
xpec
ted
to
incr
ease
imp
ort
s fr
om
th
e B
lack
Sea
.
Au
g-1
9W
hea
tIm
po
rt r
equ
irem
ents
An
no
un
ced
th
at it
will
imp
ort
10
per
cen
t o
f th
e co
un
try'
s an
nu
al w
hea
t co
nsu
mp
tio
n r
equ
irem
ents
fro
m S
aud
i-co
ntr
olle
d fi
rms
bas
ed a
bro
ad. T
he
firm
s m
ust
be
reg
iste
red
at
the
Min
istr
y o
f En
viro
nm
ent,
Wat
er a
nd
Ag
ricu
ltu
re.
Sou
th A
fric
a
May
-19
Wh
eat
Imp
ort
du
tyIn
crea
sed
th
e im
po
rt d
uty
on
wh
eat
and
wh
eat
flo
ur
fro
m Z
AR
49.
07 c
ent
per
kg
(U
SD 3
4 p
er t
on
ne)
an
d Z
AR
73.
61 c
ent
per
kg
(U
SD 5
1 p
er t
on
ne)
to
ZA
R 6
7.51
cen
t p
er k
g (
USD
47
per
to
nn
e) a
nd
ZA
R 1
01.2
6 ce
nt
per
kg
(U
SD 7
0 p
er t
on
ne)
, res
pec
tive
ly.
This
imp
ort
tar
iff
app
lies
to a
ll co
un
trie
s, e
xcep
t fo
r m
emb
ers
of
the
Sou
ther
n A
fric
an D
evel
op
men
t C
om
mu
nit
y.
Sep
-19
Wh
eat
Imp
ort
du
tyR
edu
ced
th
e im
po
rt d
uty
on
wh
eat
and
wh
eat
flo
ur
fro
m Z
AR
95.
8 ce
nt
per
kg
(U
SD 6
4.6
per
to
nn
e) a
nd
ZA
R 1
43.6
9 ce
nt
per
kg
(U
SD 9
6.9
per
to
nn
e) t
o Z
AR
66.
47 c
ent
per
kg
(U
SD 4
4.8
per
to
nn
e) a
nd
ZA
R 9
9.71
cen
t p
er k
g (
USD
67.
2 p
er t
on
ne)
, re
spec
tive
ly.

Ma
jor
po
licy
de
velo
pm
en
ts
28 FOOD OUTLOOKNOVEMBER 2019
CO
UN
TRY
DA
TEC
OM
MO
DIT
YPO
LIC
Y IN
STR
UM
ENT
DES
CR
IPTI
ON
Sou
th A
fric
aO
ct-1
9W
hea
tIm
po
rt d
uty
Incr
ease
d t
he
imp
ort
du
ty o
n w
hea
t an
d w
hea
t fl
ou
r fr
om
ZA
R 6
6.47
cen
t p
er k
g (
USD
44.
8 p
er t
on
ne)
an
d Z
AR
99.
71 c
ent
per
kg
(U
SD 6
7.2
per
to
nn
e) t
o Z
AR
100
.86
cen
t p
er k
g (
USD
69.
34 p
er t
on
ne)
an
d Z
AR
151
.29
cen
t p
er k
g (
USD
104
per
to
nn
e),
resp
ecti
vely
.
Thai
lan
dA
ug
-19
Gra
ins
Pro
du
ctio
n s
up
po
rtA
ssig
ned
a b
ud
get
of
THB
25.
842
bill
ion
(U
SD 8
43.9
mill
ion
) to
su
pp
ort
nea
rly
4.3
mill
ion
fam
ily f
arm
ers
wh
o h
ave
bee
n
affe
cted
by
risi
ng
pro
du
ctio
n c
ost
s an
d a
n a
pp
reci
atio
n o
f th
e d
om
esti
c cu
rren
cy a
gai
nst
th
e U
S d
olla
r si
nce
th
e b
egin
nin
g o
f th
e ye
ar. A
n a
dd
itio
nal
TH
B 1
8.5
bill
ion
(U
SD 6
04.2
mill
ion
) w
as a
ssig
ned
to
su
pp
ort
dro
ug
ht-
affe
cted
far
min
g c
om
mu
nit
ies.
Turk
eyA
ug
-19
Mai
zePr
ocu
rem
ent
pri
ceA
nn
ou
nce
d t
he
2019
Tu
rkis
h G
rain
Bo
ard
mai
ze p
urc
has
e p
rice
of
TRY
1 1
50 (
USD
209
) p
er t
on
ne.
Th
e m
aize
pu
rch
ase
pri
ce in
20
18 w
as T
RY
950
(U
SD 1
73)
per
to
nn
e.
Ukr
ain
e
May
-19
Wh
eat
Go
vern
men
t m
arke
t in
terv
enti
on
Ad
op
ted
new
sta
nd
ard
s fo
r w
hea
t. In
par
ticu
lar,
the
nu
mb
er o
f ca
teg
ori
es f
or
soft
wh
eat
was
red
uce
d t
o f
ou
r fr
om
th
e in
itia
l si
x th
at e
xist
ed in
th
e cu
rren
t st
and
ard
. Th
e n
ew s
tan
dar
d w
as d
ue
to b
e ef
fect
ive
fro
m 1
Au
gu
st 2
019.
May
-19
Wh
eat
Go
vern
men
t m
arke
t in
terv
enti
on
Rev
ised
th
e im
ple
men
tati
on
dat
e fr
om
1 A
ug
ust
to
10
Jun
e 20
19 f
or
the
new
wh
eat
stan
dar
ds,
du
e to
co
nce
rns
fro
m g
rain
in
du
stry
rep
rese
nta
tive
s. T
he
intr
od
uct
ion
was
set
on
e m
on
th a
fter
th
e b
egin
nin
g o
f th
e m
arke
tin
g y
ear
(Ju
ly),
an
d c
ou
ld h
ave
crea
ted
issu
es w
ith
th
e m
on
ito
rin
g o
f w
hea
t d
eliv
ery
to s
ilos
follo
win
g h
arve
st.
Un
ited
Sta
tes
of
Am
eric
a
May
-19
Gra
ins
Imp
ort
tar
iff
Rai
sed
tar
iffs
fro
m 1
0 p
erce
nt
(im
po
sed
in 2
018)
to
25
per
cen
t o
n a
pp
roxi
mat
ely
USD
200
bill
ion
wo
rth
of
imp
ort
s fr
om
Ch
ina
cove
rin
g 6
000
item
s, in
clu
din
g a
lmo
st 1
000
fo
od
pro
du
cts.
May
-19
Gra
ins
Go
vern
men
t m
arke
t in
terv
enti
on
An
no
un
ced
a U
SD 1
6 b
illio
n a
id p
acka
ge
for
farm
ers
affe
cted
by
tari
ff r
etal
iati
on
. Th
e p
acka
ge
incl
ud
es t
he
Mar
ket
Faci
litat
ion
Pr
og
ram
, wh
ich
aim
s to
pro
vid
e U
SD 1
4.5
bill
ion
in d
irec
t p
aym
ents
to
pro
du
cers
(in
clu
din
g g
rain
pro
du
cers
); a
USD
1.4
bill
ion
Fo
od
Pu
rch
ase
and
Dis
trib
uti
on
Pro
gra
m t
o p
urc
has
e af
fect
ed s
urp
lus
com
mo
dit
ies
for
dis
trib
uti
on
to
fo
od
ban
ks, s
cho
ols
, an
d
ou
tlet
s se
rvin
g lo
w-i
nco
me
ind
ivid
ual
s; a
nd
USD
100
mill
ion
issu
ed t
o t
he
Ag
ricu
ltu
ral T
rad
e Pr
om
oti
on
Pro
gra
m, t
o a
ssis
t in
d
evel
op
ing
new
exp
ort
mar
kets
on
beh
alf
of
pro
du
cers
.
May
-19
Mai
ze a
nd
so
rgh
um
Imp
ort
po
licy
An
no
un
ced
th
e te
rmin
atio
n o
f In
dia
's d
esig
nat
ion
as
a b
enefi
ciar
y d
evel
op
ing
co
un
try
un
der
th
e G
ener
aliz
ed S
yste
m o
f Pr
efer
ence
s. T
his
mea
sure
to
ok
effe
ct a
s o
f 5
Jun
e 20
19, a
nd
aff
ects
sev
eral
pro
du
cts
imp
ort
ed f
rom
Ind
ia, i
ncl
ud
ing
mai
ze a
nd
so
rgh
um
.
Jun
-19
Mai
zePr
od
uct
ion
su
pp
ort
Ad
just
ed t
he
hay
ing
an
d g
razi
ng
dat
e o
n p
reve
nte
d p
lan
t ac
res
fro
m 1
No
vem
ber
to
1 S
epte
mb
er f
or
2019
. Th
e m
easu
re is
d
irec
ted
at
farm
ers
wh
o w
ere
un
able
to
pla
nt
mai
ze a
nd
so
ybea
ns
this
yea
r, d
ue
to w
ides
pre
ad fl
oo
din
g a
cro
ss t
he
US
Mid
wes
t.
Jul-
19G
rain
sG
ove
rnm
ent
sup
po
rtA
nn
ou
nce
d p
aym
ents
un
der
th
e M
arke
t Fa
cilit
atio
n P
rog
ram
to
co
mp
ensa
te f
arm
ers
affe
cted
by
reta
liato
ry t
arif
fs. P
aym
ents
ra
ng
e fr
om
USD
15
to U
SD 1
50 p
er a
cre,
wit
h in
stal
men
ts t
o b
e p
aid
mid
-to
-lat
e A
ug
ust
an
d N
ove
mb
er 2
019
and
Jan
uar
y 20
20.
The
nee
d f
or
furt
her
inst
alm
ents
will
be
asse
ssed
in t
he
ligh
t o
f fu
ture
mar
ket
dev
elo
pm
ents
.

29FOOD OUTLOOKNOVEMBER 2019
Gra
ins
CO
UN
TRY
DA
TEC
OM
MO
DIT
YPO
LIC
Y IN
STR
UM
ENT
DES
CR
IPTI
ON
Un
ited
Sta
tes
of
Am
eric
a
Au
g-1
9M
aize
Go
vern
men
t m
arke
t in
terv
enti
on
No
tifi
ed t
he
Wo
rld
Tra
de
Org
aniz
atio
n o
f m
axim
um
res
idu
e lim
its
for
mef
entr
iflu
con
azo
le o
n c
erta
in c
om
mo
dit
ies,
incl
ud
ing
m
aize
. Th
e re
gu
lati
on
est
ablis
hed
a li
mit
of
0.01
par
ts p
er m
illio
n (
pp
m)
on
mai
ze fi
eld
gra
in a
nd
mai
ze p
op
gra
in, a
nd
a li
mit
o
f 0.
03 p
pm
fo
r m
aize
mill
ed b
y-p
rod
uct
s, a
s w
ell a
s m
aize
sw
eet
kern
el a
nd
co
b w
ith
hu
sks
rem
ove
d (
G/S
PS/N
/USA
/309
4).
Au
g-1
9G
rain
sG
ove
rnm
ent
sup
po
rtIn
tro
du
ced
ad
min
istr
ativ
e fl
exib
ility
to
def
er t
he
accr
ual
of
inte
rest
on
insu
ran
ce p
rem
ium
s fo
r th
e Sp
rin
g 2
019
cro
p y
ear.
The
mea
sure
see
ks t
o e
ase
the
con
seq
uen
ces
of
del
ayed
or
pre
ven
ted
pla
nti
ng
s, a
s w
ell a
s re
du
ced
cro
p y
ield
s ca
use
d b
y se
vere
fl
oo
din
g o
r ex
trem
e d
rou
gh
t co
nd
itio
ns
thro
ug
ho
ut
2019
.
Au
g-1
9G
rain
sG
ove
rnm
ent
sup
po
rtTh
e Fa
mily
Far
mer
Rel
ief
Act
of
2019
was
sig
ned
, am
end
ing
th
e d
ebt
thre
sho
ld u
sed
to
det
erm
ine
farm
ers'
elig
ibili
ty f
or
relie
f u
nd
er e
xist
ing
far
m-s
pec
ific
ban
kru
ptc
y la
ws.
Wit
h f
arm
ers
faci
ng
su
stai
ned
dec
lines
in n
et f
arm
inco
mes
an
d a
n u
np
red
icta
ble
tr
ade
envi
ron
men
t, t
he
deb
t lim
it w
as r
aise
d f
rom
USD
4.4
mill
ion
to
USD
10
mill
ion
.
Vie
t N
amO
ct-1
9W
hea
tEx
po
rt p
olic
yA
sked
th
e R
uss
ian
Fed
erat
ion
to
tem
po
rari
ly s
usp
end
issu
ing
wh
eat
exp
ort
cer
tifi
cate
s, a
fter
fin
din
g im
po
rts
con
tain
ing
th
istl
e se
ed.
Zam
bia
May
-19
Mai
zeEx
po
rt b
anIn
crea
sed
th
e sa
le o
f g
ove
rnm
ent-
pu
rch
ased
mai
ze a
nd
imp
ose
d a
tem
po
rary
ban
on
mai
ze e
xpo
rts,
in a
n e
ffo
rt t
o b
ols
ter
do
mes
tic
avai
lab
ility
an
d e
ase
infl
atio
nar
y p
ress
ure
aft
er p
rice
s o
f m
aize
mea
l, a
stap
le f
oo
d, r
ose
sh
arp
ly in
Ap
ril.
Jul-
19M
aize
Go
vern
men
t p
rocu
rem
ent
Incr
ease
d t
he
pu
rch
asin
g p
rice
of
mai
ze b
y n
earl
y 50
per
cen
t, f
rom
ZM
W 7
5 to
ZM
W 1
10 p
er 5
0 kg
bag
(fr
om
USD
118
.6 t
o U
SD
173.
8 p
er t
on
ne)
, wit
h im
med
iate
eff
ect
and
un
til 3
1 O
cto
ber
201
9.
Au
g-1
9M
aize
Go
vern
men
t m
arke
t in
terv
enti
on
Intr
od
uce
d a
cap
on
mai
ze g
rain
pri
ces
at Z
WK
2 6
00 (
USD
198
) p
er t
on
ne.
Th
e m
easu
re a
ims
to h
alt
the
incr
easi
ng
pri
ces
of
do
mes
tic
mai
ze, w
hic
h r
each
ed r
eco
rd h
igh
s in
Sep
tem
ber
, mai
nly
du
e to
red
uce
d d
om
esti
c su
pp
lies.
Oct
-19
Mai
zePr
ocu
rem
ent
pri
ceA
gre
ed w
ith
gra
in t
rad
ers
to k
eep
th
e d
om
esti
c p
rice
of
mai
ze c
on
stan
t u
nti
l th
e n
ext
har
vest
in J
un
e 20
20. T
he
curr
ent
mai
ze
pri
ce is
set
at
ZMW
4 2
00 (
USD
317
.6 p
er t
on
ne)
.
Jun
-19
Mai
zeG
ove
rnm
ent
mar
ket
inte
rven
tio
nIs
sued
sta
tuto
ry in
stru
men
t N
°. 1
45, w
hic
h p
roh
ibit
s th
e p
urc
has
e an
d s
ale
of
mai
ze a
mo
ng
pri
vate
ind
ivid
ual
s an
d c
om
pan
ies,
le
avin
g t
he
stat
e-o
wn
ed G
rain
Mar
keti
ng
Bo
ard
as
the
on
ly e
nti
ty a
ble
to
acq
uir
e an
d s
ell m
aize
.
Sep
-19
Mai
ze a
nd
wh
eat
Bila
tera
l ag
reem
ent
Sig
ned
dea
ls w
ith
Bel
aru
s w
ort
h U
SD 3
50 m
illio
n in
ord
er t
o e
nh
ance
eco
no
mic
co
op
erat
ion
. Th
e ag
reem
ents
invo
lve
the
con
stru
ctio
n o
f a
po
wer
pla
nt,
an
d t
ran
spo
rt, l
og
isti
cal s
up
po
rt a
nd
dev
elo
pm
ent
for
agri
cult
ura
l pro
ject
s. T
he
latt
er w
ill e
nab
le
the
cou
ntr
y to
gro
w m
aize
, wh
eat
and
so
ybea
ns
for
inte
rnal
co
nsu
mp
tio
n.
Sep
-19
Wh
eat
Go
vern
men
t m
arke
t in
terv
enti
on
Tig
hte
ned
mo
nit
ori
ng
mec
han
ism
s o
n a
wh
eat
sub
sid
y m
ean
t fo
r b
read
, in
ord
er t
o p
reve
nt
its
use
fo
r o
ther
pro
du
cts,
su
ch a
s b
iscu
its,
cak
es a
nd
oth
er c
on
fect
ion
erie
s. T
he
sub
sid
y is
RTG
S 2
300
(USD
85.
3) p
er t
on
ne.
Oct
-19
Gra
ins
Pro
cure
men
t p
rice
Rai
sed
th
e d
om
esti
c p
rice
of
mai
ze a
nd
oth
er g
rain
s, in
clu
din
g s
org
hu
m a
nd
mill
et, f
rom
RTG
S 2
100
to R
TGS
4 00
0 (U
SD 8
1.1
to
USD
154
.9)
per
to
nn
e.
* A
col
lect
ion
of m
ajor
gra
in p
olic
y de
velo
pmen
ts s
tart
ing
in J
uly
2010
is a
vaila
ble
at:
http
://w
ww
.fao
.org
/eco
nom
ic/e
st/e
st-c
omm
oditi
es/c
omm
odity
-pol
icy-
arch
ive/
en/?
grou
pAN
Dco
mm
odity
=gr
ains

Ma
jor
po
licy
de
velo
pm
en
ts
30 FOOD OUTLOOKNOVEMBER 2019
RICE
: M
AJO
R PO
LICY
DEV
ELO
PMEN
TS M
ID-A
PRIL
TO
MID
-OCT
OBE
R 20
19*
Co
un
try
Dat
ePo
licy
Inst
rum
ent
Des
crip
tio
n
Arg
enti
na
Ap
r-19
Co
nsu
mer
pri
ces
An
no
un
ced
th
at it
had
rea
ched
an
ag
reem
ent
wit
h t
he
pri
vate
sec
tor
to k
eep
pri
ces
of
som
e 60
bas
ic n
eces
siti
es, i
ncl
ud
ing
ric
e, s
tead
y fo
r at
leas
t si
x m
on
ths.
Th
e m
easu
re c
om
e in
to e
ffec
t o
n 2
2 A
pri
l 201
9 an
d w
as im
ple
men
ted
wit
hin
th
e fr
amew
ork
of
the
Prec
ios
Cu
idad
os
sch
eme.
Jul-
19Ex
po
rt t
axes
Low
ered
th
e ca
p o
n e
xpo
rt t
axes
on
ric
e to
AR
S 3
for
ever
y U
S d
olla
r o
f va
lue,
or
of
the
offi
cial
fre
e-o
n-b
oar
d (
FOB
) p
rice
. Th
is c
om
par
es
wit
h a
pre
vio
usl
y ap
plic
able
cei
ling
of
AR
S 4
for
ever
y U
S d
olla
r o
f va
lue.
Th
e m
easu
re b
ecam
e ef
fect
ive
on
10
July
201
9.
Au
g-1
9Ta
x p
olic
yR
emo
ved
val
ue
add
ed t
ax (
VA
T) o
n r
ice
and
oth
er b
asic
fo
od
stu
ffs,
eff
ecti
ve f
rom
16
Au
gu
st u
nti
l 31
Dec
emb
er 2
019.
Ban
gla
des
h
May
-19
Imp
ort
tar
iff
Rai
sed
imp
ort
tar
iffs
on
ric
e (h
usk
ed, s
emi/w
ho
lly m
illed
an
d b
roke
n)
fro
m 2
8 p
erce
nt
to 5
5 p
erce
nt.
Th
e re
vise
d r
ate
con
sist
s o
f a
25
per
cen
t cu
sto
ms
du
ty, a
25
per
cen
t re
gu
lato
ry d
uty
, an
d a
5 p
erce
nt
adva
nce
inco
me
tax.
May
-19
Exp
ort
ban
Issu
ed s
tate
men
ts t
o t
he
pre
ss in
dic
atin
g a
dec
isio
n t
o a
llow
up
to
1.5
mill
ion
to
nn
es o
f ri
ce e
xpo
rts,
res
cin
din
g t
he
ban
on
no
n-a
rom
atic
ex
po
rts
that
had
bee
n in
pla
ce s
ince
May
200
8. F
urt
her
mo
re, t
o e
nco
ura
ge
sale
s ab
road
an
d m
itig
ate
falls
in p
add
y p
rice
s, it
wo
uld
co
nsi
der
ex
ten
din
g a
20–
30 p
erce
nt
ince
nti
ve f
or
rice
exp
ort
s.
Jun
-19
Go
vern
men
t p
rocu
rem
ent
Dec
ided
to
pu
rch
ase
an a
dd
itio
nal
250
000
to
nn
es o
f p
add
y fr
om
th
e 20
19 B
oro
har
vest
dir
ectl
y fr
om
far
mer
s, in
a b
id t
o h
elp
pro
du
cers
co
pe
wit
h d
eclin
es in
loca
l pri
ces.
Th
e m
ove
rai
sed
th
e ta
rget
of
volu
mes
to
be
pro
cure
d u
nd
er t
he
2019
Bo
ro d
rive
to
a t
ota
l of
400
000
ton
nes
of
pad
dy
and
1.1
5 m
illio
n t
on
nes
of
rice
.
Jun
-19
Exp
ort
du
tyA
nn
ou
nce
d t
hat
it w
ou
ld r
aise
th
e ex
po
rt d
uty
on
ric
e b
ran
fro
m 1
0 p
erce
nt
to 2
5 p
erce
nt,
as
par
t o
f it
s 20
19/2
0 b
ud
get
ary
allo
cati
on
s.
Jun
-19
Pro
du
ctio
n s
up
po
rt,
cro
p in
sura
nce
An
no
un
ced
th
at it
wo
uld
giv
e p
rio
rity
to
res
earc
h o
n fl
oo
d, d
rou
gh
t, s
alin
ity
and
tem
per
atu
re r
esis
tan
t va
riet
ies,
in a
dd
itio
n t
o s
tep
pin
g
up
inte
rven
tio
ns
to e
nco
ura
ge
cro
p d
iver
sifi
cati
on
, org
anic
pes
t m
anag
emen
t an
d f
arm
mec
han
izat
ion
. Th
e an
no
un
cem
ents
fo
rm p
art
of
the
Go
vern
men
t’s
2019
/20
bu
dg
etar
y al
loca
tio
ns,
wh
ich
als
o f
ore
see
mai
nta
inin
g lo
cal p
rice
s o
f ch
emic
al f
erti
lizer
s u
nch
ang
ed d
uri
ng
th
e 20
19/2
0 (J
uly
-Ju
ne)
fisc
al y
ear,
the
intr
od
uct
ion
of
a p
ilot
cro
p in
sura
nce
sch
eme
agai
nst
nat
ura
l dis
aste
rs, V
AT
exem
pti
on
s o
n a
gri
cult
ura
l m
ach
iner
y, a
nd
th
e p
rovi
sio
n o
f su
bsi
die
s to
pro
du
cers
to
co
ver
the
cost
s o
f fa
rm m
ach
iner
y.
Ben
inO
ct-1
9R
e-ex
po
rt r
estr
icti
on
sIs
sued
a c
ircu
lar
inst
ruct
ing
cu
sto
ms
bro
kers
an
d o
ther
op
erat
ors
to
ref
rain
fro
m is
suin
g t
ran
sit
or
re-e
xpo
rt d
ecla
rati
on
s fo
r p
arb
oile
d r
ice
des
tin
ed f
or
Nig
eria
.
Bra
zil
Jul-
19M
inim
um
su
pp
ort
p
rice
s
Set
Min
imu
m S
up
po
rt P
rice
s (M
SPs)
fo
r th
e 20
20/2
1 se
aso
n (
2019
/20
seas
on
fo
r B
razi
l), e
ffec
tive
fro
m F
ebru
ary
2020
to
Jan
uar
y 20
21. T
he
MSP
fo
r fi
ne
lon
g g
rain
pad
dy
was
rai
sed
by
8.75
per
cen
t to
BR
L 79
3 (U
SD 1
93)
per
to
nn
e fo
r th
e So
uth
Reg
ion
(ex
cep
t Pa
ran
á), a
nd
by
10.0
4 p
erce
nt
to B
RL
793
(USD
193
) p
er t
on
ne
for
all o
ther
reg
ion
s. N
o M
SP w
as s
pec
ified
fo
r lo
ng
gra
in p
add
y.
Cam
bo
dia
Ap
r-19
Pref
eren
tial
tra
de
arra
ng
emen
t,
safe
gu
ard
mea
sure
s
File
d a
ch
alle
ng
e b
efo
re t
he
Co
urt
of
Just
ice
of
the
Euro
pea
n U
nio
n r
equ
esti
ng
th
e re
pea
l of
Co
mm
issi
on
Imp
lem
enti
ng
Reg
ula
tio
n
(EU
) 20
19/6
7, t
hro
ug
h w
hic
h t
he
Euro
pea
n U
nio
n im
po
sed
saf
egu
ard
du
ties
on
sel
ecte
d c
lass
es o
f se
mi/w
ho
lly m
illed
ric
e im
po
rted
fro
m
Cam
bo
dia
an
d M
yan
mar
.
Ch
adM
ay-1
9Im
po
rt t
arif
fEx
emp
ted
ric
e fr
om
imp
ort
tar
iffs
, pre
vio
usl
y se
t at
5 p
erce
nt,
eff
ecti
ve 1
0 M
ay 2
019.
Th
e m
easu
re, w
hic
h a
lso
su
spen
ds
imp
ort
du
ties
an
d
VA
T fo
r o
ther
bas
ic f
oo
dst
uff
s, a
ims
to c
on
tain
pri
ces
of
bas
ic n
eces
siti
es.
Ch
ina
(Mai
nla
nd
)A
pr-
19Im
po
rt a
gre
emen
tA
cco
rdin
g t
o p
ress
rep
ort
s, o
ffici
als
fro
m Y
un
nan
Pro
vin
ce c
len
ched
a m
emo
ran
du
m o
f u
nd
erst
and
ing
(M
oU
) fo
r a
bar
ter
dea
l th
at w
ill s
ee
100
000
ton
nes
of
rice
ori
gin
ated
in M
yan
mar
sh
ipp
ed t
o C
hin
a o
verl
and
, alo
ng
wit
h o
ther
pro
du
cts,
in e
xch
ang
e fo
r C
hin
ese
mac
hin
ery,
fe
rtili
zers
an
d o
ther
go
od
s.

31FOOD OUTLOOKNOVEMBER 2019
Rice
Co
un
try
Dat
ePo
licy
Inst
rum
ent
Des
crip
tio
n
Ch
ina
(Mai
nla
nd
)
Ap
r-19
Imp
ort
ag
reem
ent
Sig
ned
an
Mo
U, u
nd
er w
hic
h t
he
Ch
ines
e st
ate
trad
ing
en
terp
rise
Ch
ina
Nat
ion
al C
erea
ls, O
ils a
nd
Fo
od
stu
ffs
Co
rpo
rati
on
(C
OFC
O)
wo
uld
im
po
rt 4
00 0
00 t
on
nes
of
rice
ori
gin
ated
in C
amb
od
ia b
etw
een
Au
gu
st 2
019
and
Dec
emb
er 2
020.
Jun
-19
Imp
ort
ag
reem
ent
Sig
ned
an
Mo
U, u
nd
er w
hic
h C
hin
ese
stat
e tr
adin
g e
nte
rpri
se C
OFC
O w
ou
ld im
po
rt 1
00 0
00 t
on
nes
of
rice
ori
gin
ated
in M
yan
mar
, th
rou
gh
m
arit
ime
chan
nel
s. T
he
dea
l fo
llow
s n
ews
of
Ch
ina'
s as
sen
t to
qu
adru
plin
g t
he
ann
ual
qu
ota
of
offi
cial
Ch
ines
e p
urc
has
es o
f ri
ce o
rig
inat
ed
in M
yan
mar
to
400
000
to
nn
es.
Au
g-1
9Fu
ture
s tr
ade
Lau
nch
ed a
fu
ture
s co
ntr
act
for
Jap
on
ica
rice
(ro
un
d-g
rain
, po
lish
ed)
on
th
e D
alia
n C
om
mo
dit
y Ex
chan
ge
(DC
E).
Sep
-19
Imp
ort
qu
ota
Left
th
e ta
riff
-rat
e im
po
rt q
uo
ta f
or
2020
un
chan
ged
at
5.32
mill
ion
to
nn
es.
Ap
r-19
to
O
ct-1
9St
ock
rel
ease
Sold
9.9
mill
ion
to
nn
es o
f p
add
y fr
om
go
vern
men
t re
serv
es t
hro
ug
h 5
6 au
ctio
ns
hel
d b
etw
een
16
Ap
ril 2
019
and
11
Oct
ob
er 2
019,
off
erin
g
a to
tal o
f 48
.3 m
illio
n t
on
nes
of
pad
dy
for
sale
fro
m s
tate
sto
ckp
iles.
Co
lom
bia
Sep
-19
Imp
ort
qu
ota
An
no
un
ced
th
at a
pp
licat
ion
s to
imp
ort
60
000
ton
nes
of
sem
i/wh
olly
mill
ed r
ice
(wh
eth
er p
olis
hed
or
no
t) f
rom
Per
u w
ere
op
ened
on
10
Sep
tem
ber
201
9. V
olu
mes
imp
ort
ed u
nd
er t
he
qu
ota
are
to
be
del
iver
ed b
etw
een
1 S
epte
mb
er 2
019
and
31
Au
gu
st 2
020.
Jul-
19 t
o
Sep
-19
Sup
po
rt p
rice
s,
war
eho
use
rec
eip
ts
pro
gra
mm
e
Dec
ided
to
imp
lem
ent
the
sto
rag
e in
cen
tive
pro
gra
mm
e fo
r 20
19 s
eco
nd
-sem
este
r cr
op
s in
th
e d
epar
tmen
ts o
f A
rau
ca, M
eta,
Cas
anar
e,
Vic
had
a, G
uav
iare
an
d t
he
Para
teb
uen
o m
un
icip
alit
y o
f C
un
din
amar
ca, b
etw
een
1 A
ug
ust
201
9 an
d 3
0 D
ecem
ber
201
9. C
OP
11 b
illio
n (
USD
3.
2 m
illio
n)
wer
e to
be
allo
cate
d f
or
the
pu
rpo
se. T
he
fun
ds
wo
uld
be
des
tin
ed t
o e
xten
d a
CO
P 29
000
(U
SD 8
.4)
mo
nth
ly o
utl
ay t
o c
ove
r th
e co
st o
f st
ori
ng
a t
on
ne
of
pad
dy,
fo
r u
p t
o 1
26 4
36 t
on
nes
of
dry
pad
dy
(or
its
equ
ival
ent)
. Th
e o
utl
ay w
ou
ld b
e g
ran
ted
on
co
nd
itio
n
that
th
ese
sup
plie
s ar
e p
urc
has
ed a
t re
fere
nce
pri
ces
of
CO
P 12
5 00
0–14
0 00
0 p
er 1
25 k
g o
f g
reen
pad
dy
(USD
290
–325
per
to
nn
e). A
Se
pte
mb
er d
ecis
ion
allo
cate
d a
n a
dd
itio
nal
CO
P 9.
5 b
illio
n (
USD
2.8
mill
ion
) to
th
e sc
hem
e, s
o a
s to
incr
ease
vo
lum
es c
ove
red
un
der
th
e p
rog
ram
me
to a
to
tal o
f 23
5 63
1 to
nn
es o
f d
ry p
add
y (o
r it
s eq
uiv
alen
t).
Ecu
ado
rA
pr-
19
Pro
du
ctio
n s
up
po
rt,
sup
po
rt p
rice
s,
go
vern
men
t p
rocu
rem
ent
Res
tore
d fi
xed
pro
du
cer
sup
po
rt p
rice
s fo
r p
add
y, r
esci
nd
ing
th
e p
rice
ban
d in
pla
ce s
ince
Ap
ril 2
018.
Acc
ord
ing
ly, e
ffec
tive
25
Ap
ril 2
019,
p
add
y o
f le
ss t
han
7 m
m in
len
gth
, 20
per
cen
t m
ois
ture
co
nte
nt
and
5 p
erce
nt
imp
uri
ties
wo
uld
fet
ch U
SD 2
9 p
er 2
00 lb
(U
SD 3
20 p
er
ton
ne)
, wh
ile t
he
pro
du
cer
pri
ce f
or
pad
dy
exce
edin
g 7
.1 m
m in
len
gth
, wit
h 2
0 p
erce
nt
mo
istu
re c
on
ten
t an
d 5
per
cen
t im
pu
riti
es, w
as
set
at U
SD 3
1 p
er 2
00 lb
(U
SD 3
42 p
er t
on
ne)
. Mo
reo
ver,
the
Nat
ion
al S
tora
ge
Un
it (
Un
idad
Nac
ion
al d
e A
lmac
enam
ien
to -
UN
A E
P) w
ou
ld
abso
rb t
he
equ
ival
ent
of
2 p
erce
nt
of
nat
ion
al p
rod
uct
ion
, giv
ing
pri
ori
ty in
its
pu
rch
ases
to
sm
allh
old
er p
rod
uce
rs.
Ind
ia
May
-19
Trad
e ag
reem
ent,
ex
po
rt r
estr
icti
on
sD
ecid
ed t
hat
89
454
ton
nes
of
rice
exp
ort
s to
th
e R
epu
blic
of
Mal
div
es, a
lon
g w
ith
oth
er p
rod
uct
s, w
ou
ld b
e ex
emp
ted
fro
m a
ny
exis
tin
g o
r fu
ture
res
tric
tio
n/p
roh
ibit
ion
on
exp
ort
s in
201
9/20
. Th
e m
easu
re c
ame
into
eff
ect
in A
pri
l 201
9.
Jul-
19Su
pp
ort
pri
ces,
g
ove
rnm
ent
pro
cure
men
t
Rai
sed
min
imu
m s
up
po
rt p
rice
s fo
r p
add
y b
y 3.
7 p
erce
nt,
set
tin
g t
hem
at
INR
18
150
(USD
256
) p
er t
on
ne
in t
he
case
of
com
mo
n p
add
y, a
nd
at
INR
18
350
(USD
259
) p
er t
on
ne,
in t
he
case
of
Gra
de
A p
add
y.
Jul-
19Fu
ture
s tr
ade
Lau
nch
ed a
fu
ture
s co
ntr
act
for
1121
Bas
mat
i pad
dy
on
th
e In
dia
n C
om
mo
dit
y Ex
chan
ge
Lim
ited
(IC
EX).
Ken
yaJu
n-1
9Im
po
rt t
arif
fR
enew
ed t
he
exem
pti
on
of
the
Co
mm
on
Ext
ern
al T
arif
f (C
ET)
of
the
East
Afr
ican
Co
mm
un
ity
on
ric
e im
po
rts
un
til 3
0 Ju
ne
2020
. A
cco
rdin
gly
, im
po
rts
of
pad
dy,
hu
sked
, sem
i/wh
olly
mill
ed r
ice
and
bro
ken
ric
e w
ill c
on
tin
ue
to a
ccru
e a
35 p
erce
nt
imp
ort
tar
iff
(or
USD
20
0 p
er t
on
ne,
wh
ich
ever
is h
igh
er),
inst
ead
of
the
75 p
erce
nt
tari
ff (
or
USD
345
per
met
ric
ton
ne)
th
ey w
ou
ld a
ccru
e u
nd
er t
he
CET
.
Nig
erSe
p-1
9R
e-ex
po
rt r
estr
icti
on
sA
cco
rdin
g t
o u
nco
nfi
rmed
pre
ss r
epo
rts,
issu
ed a
cir
cula
r p
roh
ibit
ing
re-
exp
ort
s o
f w
hit
e an
d p
arb
oile
d r
ice
to N
iger
ia, w
ith
imm
edia
te
effe
ct.
Nig
eria
Au
g-1
0 to
O
ct-1
9Im
po
rt r
estr
icti
on
s
Lau
nch
ed E
xerc
ise
Swif
t R
esp
on
se, a
join
t se
curi
ty o
per
atio
n b
etw
een
th
e N
iger
ia C
ust
om
s Se
rvic
e, t
he
Nig
eria
Imm
igra
tio
n S
ervi
ce, t
he
Arm
ed F
orc
es o
f N
iger
ia a
nd
oth
er e
nti
ties
, wh
ich
en
forc
ed a
par
tial
clo
sure
of
bo
rder
s w
ith
Ben
in, s
ucc
essi
vely
ext
end
ed t
o b
ord
ers
wit
h N
iger
. Th
e ai
m o
f th
e o
per
atio
n w
as t
o c
urb
sm
ug
glin
g, e
spec
ially
of
rice
, an
d it
was
to
be
com
ple
men
ted
by
oth
er a
nti
-sm
ug
glin
g
mea
sure
s, t
o b
e d
iscu
ssed
wit
h a
uth
ori
ties
in B
enin
an
d N
iger
. Offi
cial
sta
tem
ents
issu
ed in
Oct
ob
er in
dic
ated
th
at, w
ith
th
e p
arti
al c
losu
re
of
bo
rder
s w
ith
nei
gh
bo
uri
ng
co
un
trie
s, c
ross
-bo
rder
exc
han
ges
of
any
go
od
s re
mai
ned
ban
ned
fo
r an
ind
efin
ite
per
iod
.

Ma
jor
po
licy
de
velo
pm
en
ts
32 FOOD OUTLOOKNOVEMBER 2019
Co
un
try
Dat
ePo
licy
Inst
rum
ent
Des
crip
tio
n
Pan
ama
Jul-
19Pr
od
uct
ion
su
pp
ort
Dec
ided
th
at t
he
PAB
165
(U
SD 1
65)
per
to
nn
e su
bsi
dy
sch
eme
for
rice
pro
du
cers
wo
uld
co
nti
nu
e to
be
imp
lem
ente
d. P
rod
uce
rs w
ou
ld
rece
ive
the
ou
tlay
fo
r cr
op
s h
arve
sted
an
d s
old
bet
wee
n 1
Ju
ly 2
019
and
20
Jun
e 20
20.
Peru
Jun
-19
Imp
ort
tar
iff
Dec
reed
th
at t
he
ceili
ng
ap
plie
d o
n a
dd
itio
nal
du
ties
levi
ed o
n r
ice
imp
ort
s u
nd
er t
he
pri
ce b
and
mec
han
ism
wo
uld
be
mai
nta
ined
at
20
per
cen
t o
f th
e im
po
rts'
Co
st, I
nsu
ran
ce a
nd
Fre
igh
t (C
IF)
valu
e, in
stea
d o
f b
ein
g lo
wer
ed t
o 1
5 p
erce
nt
of
CIF
val
ue,
as
fore
seen
by
an e
arlie
r d
ecis
ion
. Th
e m
easu
re, w
hic
h a
lso
set
s o
ut
new
cu
sto
ms
tab
les
adju
stin
g t
he
add
itio
nal
du
ties
, will
be
in e
ffec
t u
nti
l 30
Jun
e 20
20, a
fter
w
hic
h t
he
ceili
ng
on
ad
dit
ion
al s
urc
har
ges
will
be
adju
sted
to
15
per
cen
t o
f im
po
rts'
CIF
val
ue.
Jul-
19Ta
x p
olic
yEx
emp
ted
ric
e ex
po
rts
fro
m t
he
4 p
erce
nt
sale
s ta
x o
n p
ou
nd
ed r
ice
(Im
pu
esto
a la
Ven
ta d
e A
rro
z Pi
lad
o -
IVA
P). A
cco
rdin
g t
o t
he
dec
isio
n,
trad
ers
exp
ort
ing
su
pp
lies
falli
ng
un
der
tar
iff
lines
100
6200
000,
100
6300
000,
100
6400
000
and
230
2200
000
wo
uld
be
elig
ible
fo
r a
refu
nd
on
IV
AP
taxe
s, e
ffec
tive
fro
m 1
Au
gu
st 2
019.
The
Phili
pp
ines
Sep
-19
Pro
du
ctio
n s
up
po
rt,
go
vern
men
t p
rocu
rem
ent
Lau
nch
ed t
he
Exp
and
ed S
urv
ival
an
d R
eco
very
Ass
ista
nce
Pro
gra
m f
or
Ric
e Fa
rmer
s (S
UR
E A
id P
rog
ram
), g
ran
tin
g a
on
e-ti
me,
PH
P 15
000
(U
SD 2
91)
inte
rest
-fre
e lo
an, p
ayab
le in
eig
ht
year
s, t
o r
ice
farm
ers
cult
ivat
ing
up
to
1 h
ecta
re (
ha)
. In
ad
dit
ion
to
th
e cr
edit
ass
ista
nce
, th
e p
rog
ram
me
envi
sag
es t
he
Nat
ion
al F
oo
d A
uth
ori
ty p
urc
has
ing
su
pp
lies
fro
m p
arti
cip
atin
g p
rod
uce
rs. T
he
sch
eme
aim
s to
ass
ist
farm
ers
cop
e w
ith
dec
lines
in p
add
y p
rice
s, c
om
ing
on
to
p o
f as
sist
ance
en
visa
ged
un
der
th
e R
ice
Co
mp
etit
iven
ess
Enh
ance
men
t Fu
nd
(R
CEF
) fo
r p
rod
uce
rs a
ffec
ted
by
rice
tar
iffi
cati
on
. A f
un
d o
f PH
P 1.
5 b
illio
n (
USD
29.
1 m
illio
n)
was
init
ially
set
asi
de
to im
ple
men
t th
e sc
hem
e, b
ut
a 12
Se
pte
mb
er d
ecis
ion
ap
pro
ved
an
ad
dit
ion
al P
HP
1 b
illio
n (
USD
19.
4 m
illio
n),
to
en
able
th
e p
rog
ram
me
to c
ove
r so
me
170
000
pro
du
cers
.
Sep
-19
Sto
ck r
elea
seIn
stru
cted
th
e N
atio
nal
Fo
od
Au
tho
rity
(N
FA)
to o
fflo
ad 1
80 0
00 t
on
nes
of
rice
th
at t
he
agen
cy h
eld
in s
tore
on
to t
he
mar
ket
by
10 O
cto
ber
20
19. T
he
sup
plie
s w
ou
ld b
e so
ld a
t a
con
sum
er p
rice
of
PHP
27 (
USD
0.5
2) p
er k
g.
Sep
-19
Go
vern
men
t p
rocu
rem
ent,
p
urc
has
ing
pri
ces
An
no
un
ced
th
at t
he
NFA
wo
uld
rai
se t
he
pri
ce a
t w
hic
h it
pu
rch
ases
loca
lly p
rod
uce
d p
add
y b
y 11
.8 p
erce
nt
to P
HP
19 p
er k
g (
USD
368
p
er t
on
ne)
of
clea
n d
ry p
add
y. A
t th
e sa
me
tim
e, t
he
agen
cy w
ou
ld n
o lo
ng
er o
ffer
PH
P 3.
7 (U
SD 0
.07)
per
kg
wo
rth
of
cash
ince
nti
ves
(co
nsi
stin
g o
f th
e B
uff
er S
tock
s In
cen
tive
, th
e C
oo
per
ativ
e D
evel
op
men
t In
cen
tive
Fu
nd
, dry
ing
an
d d
eliv
ery
ince
nti
ves)
th
at h
ad b
een
pai
d
on
to
p o
f g
ove
rnm
ent
pu
rch
asin
g p
rice
s. T
hu
s, t
he
ove
rall
pri
ce e
ffec
tive
ly p
aid
by
the
NFA
wh
en p
urc
has
ing
pad
dy
fro
m p
rod
uce
rs w
ou
ld
be
low
ered
by
PHP
1.7
per
kg
(U
SD 3
2.9
per
to
nn
e) t
o P
HP
19 p
er k
g (
USD
368
per
to
nn
e).
Oct
-19
Pro
du
ctio
n s
up
po
rt
An
no
un
ced
th
at it
wo
uld
pro
vid
e ri
ce p
rod
uce
rs c
ult
ivat
ing
up
to
1 h
a w
ith
a o
ne-
tim
e d
irec
t ca
sh o
utl
ay o
f PH
P 5
000
(USD
97)
to
hel
p
them
co
pe
wit
h d
eclin
es in
pad
dy
pri
ces.
Th
e ca
sh a
ssis
tan
ce w
ou
ld b
e p
rovi
ded
on
to
p o
f cr
edit
su
pp
ort
ava
ilab
le t
hro
ug
h t
he
Exp
and
ed
Surv
ival
an
d R
eco
very
Ass
ista
nce
Pro
gra
m f
or
Ric
e Fa
rmer
s (S
UR
E A
id P
rog
ram
), a
nd
wo
uld
be
fin
ance
d b
y fu
nd
s ac
cru
ed f
rom
tar
iffs
levi
ed
on
ric
e im
po
rts.
Sep
-19
to
Oct
-19
Safe
gu
ard
mea
sure
s
No
tifi
ed t
he
Wo
rld
Tra
de
Org
aniz
atio
n t
hat
on
11
Sep
tem
ber
201
9 it
beg
an a
pre
limin
ary
safe
gu
ard
inve
stig
atio
n o
n im
po
rts
of
sele
cted
cl
asse
s o
f se
mi/w
ho
lly m
illed
ric
e (t
ho
se f
allin
g u
nd
er t
arif
f lin
es 1
0063
030,
100
6304
0, 1
0063
091
and
100
6309
9). A
cco
rdin
g t
o o
ffici
als,
th
e m
ove
was
mad
e in
lig
ht
of
con
tin
uo
us
incr
ease
s in
ric
e im
po
rts,
an
d p
aral
lel f
alls
in f
arm
gat
e p
rice
s o
f p
add
y, w
ith
rel
ated
inco
me
loss
es
by
farm
ers,
as
wel
l as
an a
bru
pt
shif
t b
y tr
ader
s fr
om
pu
rch
asin
g lo
cally
pro
du
ced
pad
dy
to b
uyi
ng
imp
ort
ed r
ice.
Th
e in
vest
igat
ion
was
ex
pec
ted
to
be
com
ple
ted
by
the
clo
se o
f Se
pte
mb
er o
r ea
rly
Oct
ob
er, w
ith
ad
dit
ion
al o
pti
on
s in
clu
din
g t
he
imp
osi
tio
n o
f st
rin
gen
t sa
nit
ary
and
ph
yto
san
itar
y (S
PS)
and
insp
ecti
on
mea
sure
s. N
on
eth
eles
s, o
ffici
al s
tate
men
ts t
o t
he
pre
ss is
sued
in O
cto
ber
ind
icat
ed t
hat
a d
ecis
ion
on
w
het
her
saf
egu
ard
du
ties
wo
uld
be
imp
ose
d h
ad b
een
def
erre
d.
Rw
and
aJu
n-1
9Im
po
rt t
arif
fD
ecid
ed t
hat
imp
ort
s o
f se
mi/w
ho
lly m
illed
ric
e w
ou
ld c
on
tin
ue
to a
ttra
ct a
45
per
cen
t (o
r U
SD 3
45 p
er t
on
ne,
wh
ich
ever
is h
igh
er)
imp
ort
d
uty
fo
r an
ad
dit
ion
al y
ear,
inst
ead
of
the
75 p
erce
nt
imp
ort
tar
iff
(or
USD
345
per
met
ric
ton
ne)
th
at t
hey
acc
rue
un
der
th
e C
om
mo
n
Exte
rnal
Tar
iff
(CET
) o
f th
e Ea
st A
fric
an C
om
mu
nit
y.
Sri L
anka
May
-19
Pric
e co
ntr
ols
Set
the
max
imu
m r
etai
l pri
ce f
or
wh
ite
Sam
ba
rice
at
LKR
85
(USD
0.4
7) p
er k
g, a
t LK
R 8
0 (U
SD 0
.44)
per
kg
of
wh
ite
Nad
u r
ice,
an
d a
t LK
R
74 (
USD
0.4
1) p
er k
g o
f re
d N
adu
, eff
ecti
ve 3
1 M
ay 2
019.
Au
g-1
9Pr
od
uct
ion
su
pp
ort
Ap
pro
ved
a p
ilot
pro
gra
mm
e th
at w
ill s
ee d
ryin
g e
qu
ipm
ent
dis
trib
ute
d w
ith
pre
fere
nti
al t
erm
s to
far
mer
org
aniz
atio
ns
in t
he
Polo
nn
aru
wa
Dis
tric
t.
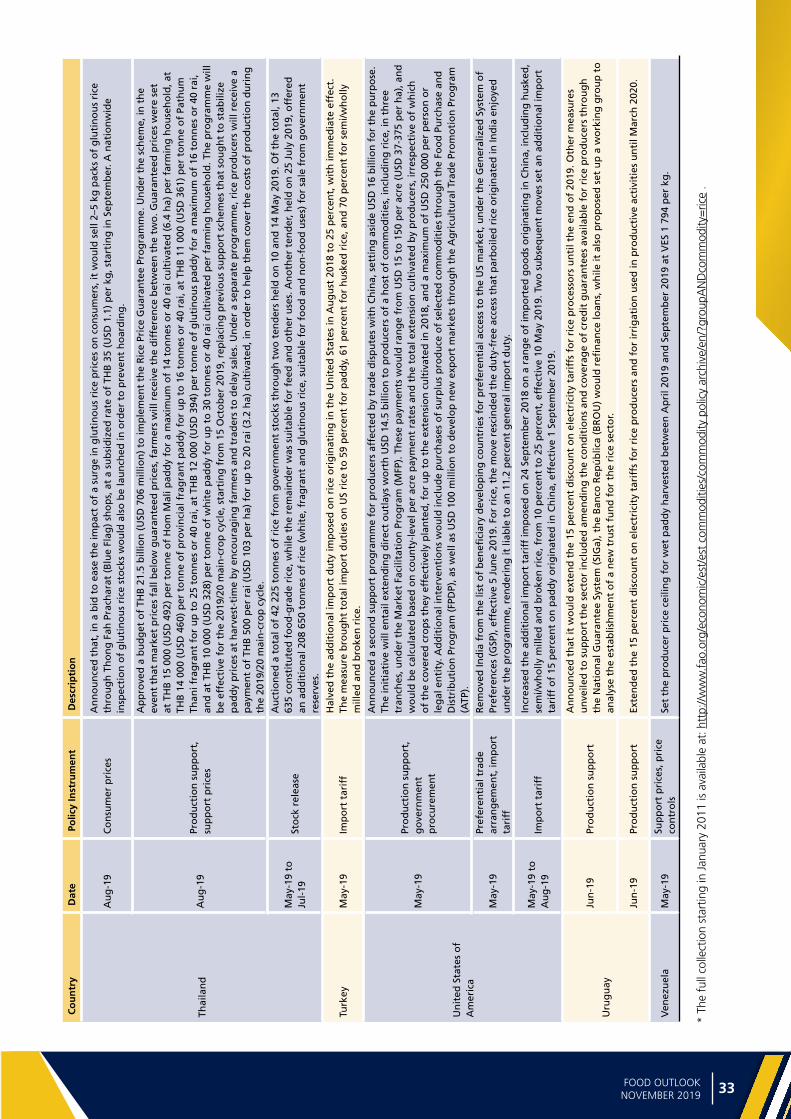
33FOOD OUTLOOKNOVEMBER 2019
Rice
* Th
e fu
ll co
llect
ion
star
ting
in J
anua
ry 2
011
is a
vaila
ble
at: h
ttp:
//ww
w.f
ao.o
rg/e
cono
mic
/est
/est
com
mod
ities
/com
mod
ity p
olic
y ar
chiv
e/en
/?gr
oupA
ND
com
mod
ity=
rice
.
Co
un
try
Dat
ePo
licy
Inst
rum
ent
Des
crip
tio
n
Thai
lan
d
Au
g-1
9C
on
sum
er p
rice
sA
nn
ou
nce
d t
hat
, in
a b
id t
o e
ase
the
imp
act
of
a su
rge
in g
luti
no
us
rice
pri
ces
on
co
nsu
mer
s, it
wo
uld
sel
l 2–5
kg
pac
ks o
f g
luti
no
us
rice
th
rou
gh
Th
on
g F
ah P
rach
arat
(B
lue
Flag
) sh
op
s, a
t a
sub
sid
ized
rat
e o
f TH
B 3
5 (U
SD 1
.1)
per
kg
, sta
rtin
g in
Sep
tem
ber
. A n
atio
nw
ide
insp
ecti
on
of
glu
tin
ou
s ri
ce s
tock
s w
ou
ld a
lso
be
lau
nch
ed in
ord
er t
o p
reve
nt
ho
ard
ing
.
Au
g-1
9Pr
od
uct
ion
su
pp
ort
, su
pp
ort
pri
ces
Ap
pro
ved
a b
ud
get
of
THB
21.
5 b
illio
n (
USD
706
mill
ion
) to
imp
lem
ent
the
Ric
e Pr
ice
Gu
aran
tee
Pro
gra
mm
e. U
nd
er t
he
sch
eme,
in t
he
even
t th
at m
arke
t p
rice
s fa
ll b
elo
w g
uar
ante
ed p
rice
s, f
arm
ers
will
rec
eive
th
e d
iffe
ren
ce b
etw
een
th
e tw
o. G
uar
ante
ed p
rice
s w
ere
set
at T
HB
15
000
(USD
492
) p
er t
on
ne
of
Ho
m M
ali p
add
y fo
r a
max
imu
m o
f 14
to
nn
es o
r 40
rai
cu
ltiv
ated
(6.
4 h
a) p
er f
arm
ing
ho
use
ho
ld, a
t TH
B 1
4 00
0 (U
SD 4
60)
per
to
nn
e o
f p
rovi
nci
al f
rag
ran
t p
add
y fo
r u
p t
o 1
6 to
nn
es o
r 40
rai
, at
THB
11
000
(USD
361
) p
er t
on
ne
of
Path
um
Th
ani f
rag
ran
t fo
r u
p t
o 2
5 to
nn
es o
r 40
rai
, at
THB
12
000
(USD
394
) p
er t
on
ne
of
glu
tin
ou
s p
add
y fo
r a
max
imu
m o
f 16
to
nn
es o
r 40
rai
, an
d a
t TH
B 1
0 00
0 (U
SD 3
28)
per
to
nn
e o
f w
hit
e p
add
y fo
r u
p t
o 3
0 to
nn
es o
r 40
rai
cu
ltiv
ated
per
far
min
g h
ou
seh
old
. Th
e p
rog
ram
me
will
b
e ef
fect
ive
for
the
2019
/20
mai
n-c
rop
cyc
le, s
tart
ing
fro
m 1
5 O
cto
ber
201
9, r
epla
cin
g p
revi
ou
s su
pp
ort
sch
emes
th
at s
ou
gh
t to
sta
bili
ze
pad
dy
pri
ces
at h
arve
st-t
ime
by
enco
ura
gin
g f
arm
ers
and
tra
der
s to
del
ay s
ales
. Un
der
a s
epar
ate
pro
gra
mm
e, r
ice
pro
du
cers
will
rec
eive
a
pay
men
t o
f TH
B 5
00 p
er r
ai (
USD
103
per
ha)
fo
r u
p t
o 2
0 ra
i (3.
2 h
a) c
ult
ivat
ed, i
n o
rder
to
hel
p t
hem
co
ver
the
cost
s o
f p
rod
uct
ion
du
rin
g
the
2019
/20
mai
n-c
rop
cyc
le.
May
-19
to
Jul-
19St
ock
rel
ease
Au
ctio
ned
a t
ota
l of
42 2
25 t
on
nes
of
rice
fro
m g
ove
rnm
ent
sto
cks
thro
ug
h t
wo
ten
der
s h
eld
on
10
and
14
May
201
9. O
f th
e to
tal,
13
635
con
stit
ute
d f
oo
d-g
rad
e ri
ce, w
hile
th
e re
mai
nd
er w
as s
uit
able
fo
r fe
ed a
nd
oth
er u
ses.
An
oth
er t
end
er, h
eld
on
25
July
201
9, o
ffer
ed
an a
dd
itio
nal
208
650
to
nn
es o
f ri
ce (
wh
ite,
fra
gra
nt
and
glu
tin
ou
s ri
ce, s
uit
able
fo
r fo
od
an
d n
on
-fo
od
use
s) f
or
sale
fro
m g
ove
rnm
ent
rese
rves
.
Turk
eyM
ay-1
9Im
po
rt t
arif
fH
alve
d t
he
add
itio
nal
imp
ort
du
ty im
po
sed
on
ric
e o
rig
inat
ing
in t
he
Un
ited
Sta
tes
in A
ug
ust
201
8 to
25
per
cen
t, w
ith
imm
edia
te e
ffec
t.
The
mea
sure
bro
ug
ht
tota
l im
po
rt d
uti
es o
n U
S ri
ce t
o 5
9 p
erce
nt
for
pad
dy,
61
per
cen
t fo
r h
usk
ed r
ice,
an
d 7
0 p
erce
nt
for
sem
i/wh
olly
m
illed
an
d b
roke
n r
ice.
Un
ited
Sta
tes
of
Am
eric
a
May
-19
Pro
du
ctio
n s
up
po
rt,
go
vern
men
t p
rocu
rem
ent
An
no
un
ced
a s
eco
nd
su
pp
ort
pro
gra
mm
e fo
r p
rod
uce
rs a
ffec
ted
by
trad
e d
isp
ute
s w
ith
Ch
ina,
set
tin
g a
sid
e U
SD 1
6 b
illio
n f
or
the
pu
rpo
se.
The
init
iati
ve w
ill e
nta
il ex
ten
din
g d
irec
t o
utl
ays
wo
rth
USD
14.
5 b
illio
n t
o p
rod
uce
rs o
f a
ho
st o
f co
mm
od
itie
s, in
clu
din
g r
ice,
in t
hre
e tr
anch
es, u
nd
er t
he
Mar
ket
Faci
litat
ion
Pro
gra
m (
MFP
). T
hes
e p
aym
ents
wo
uld
ran
ge
fro
m U
SD 1
5 to
150
per
acr
e (U
SD 3
7-37
5 p
er h
a), a
nd
w
ou
ld b
e ca
lcu
late
d b
ased
on
co
un
ty-l
evel
per
acr
e p
aym
ent
rate
s an
d t
he
tota
l ext
ensi
on
cu
ltiv
ated
by
pro
du
cers
, irr
esp
ecti
ve o
f w
hic
h
of
the
cove
red
cro
ps
they
eff
ecti
vely
pla
nte
d, f
or
up
to
th
e ex
ten
sio
n c
ult
ivat
ed in
201
8, a
nd
a m
axim
um
of
USD
250
000
per
per
son
or
leg
al e
nti
ty. A
dd
itio
nal
inte
rven
tio
ns
wo
uld
incl
ud
e p
urc
has
es o
f su
rplu
s p
rod
uce
of
sele
cted
co
mm
od
itie
s th
rou
gh
th
e Fo
od
Pu
rch
ase
and
D
istr
ibu
tio
n P
rog
ram
(FP
DP)
, as
wel
l as
USD
100
mill
ion
to
dev
elo
p n
ew e
xpo
rt m
arke
ts t
hro
ug
h t
he
Ag
ricu
ltu
ral T
rad
e Pr
om
oti
on
Pro
gra
m
(ATP
).
May
-19
Pref
eren
tial
tra
de
arra
ng
emen
t, im
po
rt
tari
ff
Rem
ove
d In
dia
fro
m t
he
list
of
ben
efici
ary
dev
elo
pin
g c
ou
ntr
ies
for
pre
fere
nti
al a
cces
s to
th
e U
S m
arke
t, u
nd
er t
he
Gen
eral
ized
Sys
tem
of
Pref
eren
ces
(GSP
), e
ffec
tive
5 J
un
e 20
19. F
or
rice
, th
e m
ove
res
cin
ded
th
e d
uty
-fre
e ac
cess
th
at p
arb
oile
d r
ice
ori
gin
ated
in In
dia
en
joye
d
un
der
th
e p
rog
ram
me,
ren
der
ing
it li
able
to
an
11.
2 p
erce
nt
gen
eral
imp
ort
du
ty.
May
-19
to
Au
g-1
9Im
po
rt t
arif
fIn
crea
sed
th
e ad
dit
ion
al im
po
rt t
arif
f im
po
sed
on
24
Sep
tem
ber
201
8 o
n a
ran
ge
of
imp
ort
ed g
oo
ds
ori
gin
atin
g in
Ch
ina,
incl
ud
ing
hu
sked
, se
mi/w
ho
lly m
illed
an
d b
roke
n r
ice,
fro
m 1
0 p
erce
nt
to 2
5 p
erce
nt,
eff
ecti
ve 1
0 M
ay 2
019.
Tw
o s
ub
seq
uen
t m
ove
s se
t an
ad
dit
ion
al im
po
rt
tari
ff o
f 15
per
cen
t o
n p
add
y o
rig
inat
ed in
Ch
ina,
eff
ecti
ve 1
Sep
tem
ber
201
9.
Uru
gu
ay
Jun
-19
Pro
du
ctio
n s
up
po
rt
An
no
un
ced
th
at it
wo
uld
ext
end
th
e 15
per
cen
t d
isco
un
t o
n e
lect
rici
ty t
arif
fs f
or
rice
pro
cess
ors
un
til t
he
end
of
2019
. Oth
er m
easu
res
un
veile
d t
o s
up
po
rt t
he
sect
or
incl
ud
ed a
men
din
g t
he
con
dit
ion
s an
d c
ove
rag
e o
f cr
edit
gu
aran
tees
ava
ilab
le f
or
rice
pro
du
cers
th
rou
gh
th
e N
atio
nal
Gu
aran
tee
Syst
em (
SIG
a), t
he
Ban
co R
epú
blic
a (B
RO
U)
wo
uld
refi
nan
ce lo
ans,
wh
ile it
als
o p
rop
ose
d s
et u
p a
wo
rkin
g g
rou
p t
o
anal
yse
the
esta
blis
hm
ent
of
a n
ew t
rust
fu
nd
fo
r th
e ri
ce s
ecto
r.
Jun
-19
Pro
du
ctio
n s
up
po
rtEx
ten
ded
th
e 15
per
cen
t d
isco
un
t o
n e
lect
rici
ty t
arif
fs f
or
rice
pro
du
cers
an
d f
or
irri
gat
ion
use
d in
pro
du
ctiv
e ac
tivi
ties
un
til M
arch
202
0.
Ven
ezu
ela
May
-19
Sup
po
rt p
rice
s, p
rice
co
ntr
ols
Set
the
pro
du
cer
pri
ce c
eilin
g f
or
wet
pad
dy
har
vest
ed b
etw
een
Ap
ril 2
019
and
Sep
tem
ber
201
9 at
VES
1 7
94 p
er k
g.

Ma
jor
po
licy
de
velo
pm
en
ts
34 FOOD OUTLOOKNOVEMBER 2019
OIL
CRO
PS:
MA
JOR
POLI
CY D
EVEL
OPM
ENTS
MID
-APR
IL T
O M
ID-O
CTO
BER
2019
*
CO
UN
TRY
DA
TEPO
LIC
Y D
OM
AIN
PRO
DU
CT
DES
CR
IPTI
ON
Afr
ica,
sel
ecte
d c
ou
ntr
ies
(Cô
te d
'Ivo
ire,
Gh
ana,
Li
ber
ia, S
ierr
a Le
on
e)M
ar-1
9Se
cto
r d
evel
op
men
t/
pro
du
ctio
n s
ust
ain
abili
ty
sup
po
rtO
il p
alm
Cô
te d
'Ivo
ire,
Gh
ana,
Lib
eria
an
d S
ierr
a Le
on
e jo
ined
fo
rces
to
imp
lem
ent
the
Sust
ain
able
Wes
t A
fric
a Pa
lm O
il Pr
og
ram
me
(SW
APP
) in
su
pp
ort
of
soci
ally
res
po
nsi
ble
an
d e
nvi
ron
men
tally
su
stai
nab
le o
il-p
alm
ex
pan
sio
n. F
ocu
sin
g o
n s
ust
ain
able
gro
wth
acr
oss
th
e p
alm
oil
valu
e ch
ain
, th
e p
rog
ram
me
is a
imed
at
imp
rovi
ng
th
e liv
elih
oo
ds
of
smal
lho
lder
far
mer
s.
Arg
enti
na
Ap
r-19
Exp
ort
po
licy
Soyo
il, s
un
flo
wer
oil
Sup
po
rted
eff
ort
s b
y th
e o
ilsee
d p
roce
ssin
g in
du
stry
to
rai
se s
ales
of
Arg
enti
ne
soy
and
su
nfl
ow
er s
eed
oil
to
Ind
ia.
Ap
r-19
Mar
ket
reg
ula
tio
nSe
lect
ed v
eget
able
oils
Fro
ze t
he
reta
il p
rice
s o
f se
lect
ed f
oo
d it
ems
– in
clu
din
g c
oo
kin
g o
ils –
fo
r a
six-
mo
nth
per
iod
, wit
h a
vie
w t
o
curb
ing
do
mes
tic
foo
d p
rice
infl
atio
n.
May
-19
Imp
ort
po
licy
Soyb
ean
sEx
emp
ted
so
ybea
ns
imp
ort
ed f
or
sub
seq
uen
t re
-exp
ort
(in
th
e fo
rm o
f so
yoil
and
mea
l) f
rom
a r
ecen
tly
imp
lem
ente
d in
crea
se in
th
e co
un
try’
s ‘s
tati
stic
s d
uty
’.
Jun
-19
Farm
er r
elie
f m
easu
res
Gra
ins,
oils
eed
sA
nn
ou
nce
d s
up
po
rt m
easu
res
for
gra
in p
rod
uce
rs in
th
e co
un
try’
s C
hac
o p
rovi
nce
wh
o w
ere
affe
cted
by
flo
od
s in
th
e 20
18/1
9 se
aso
n.
Oct
-19
Exp
ort
po
licy
Gra
ins,
oils
eed
sR
edu
ced
th
e ti
me
span
gra
nte
d t
o t
rad
ers
for
pay
ing
exp
ort
tax
es a
nd
det
erm
ined
th
at e
xpo
rter
s w
ill h
ave
to p
ay e
xpo
rt d
ues
sh
ort
ly a
fter
th
e d
ate
of
sale
, rat
her
th
an o
n t
he
dat
e o
f sh
ipm
ent.
Oct
-19
Bio
fuel
po
licy
Bio
die
sel
Rai
sed
th
e m
inim
um
pri
ce t
hat
oil
refi
nin
g c
om
pan
ies
are
req
uir
ed t
o p
ay f
or
bio
die
sel b
y a
furt
her
6
per
cen
t (f
ollo
win
g t
wo
pri
or
incr
ease
s im
ple
men
ted
in la
te 2
018)
.
Au
stra
lia
Au
g-1
9G
MO
po
licy
Rap
esee
dA
uth
ori
zed
, in
th
e st
ate
of
Sou
th A
ust
ralia
, th
e cu
ltiv
atio
n o
f g
enet
ical
ly m
od
ified
(G
M)
foo
d c
rop
s,
incl
ud
ing
GM
rap
esee
d v
arie
ties
.
Au
g-1
9H
ealt
h p
olic
yV
eget
able
oils
Co
nsi
der
ed r
evis
ing
th
e ra
nki
ng
of
ind
ivid
ual
veg
etab
le o
ils u
nd
er t
he
cou
ntr
y’s
rati
ng
sys
tem
fo
r p
acka
ged
fo
od
s, w
ith
a v
iew
to
ass
ign
ing
a t
op
sco
re t
o o
live
oil
– b
ased
on
th
e o
il’s
pro
ven
hea
lth
ben
efits
.
Sep
-19
Farm
er r
elie
f m
easu
res
Ara
ble
cro
ps
Set
asid
e fu
nd
s to
ass
ist
farm
ers
affe
cted
by
extr
eme
wea
ther
co
nd
itio
ns,
co
nce
rned
th
at e
xces
sive
dry
nes
s co
uld
th
reat
en b
usi
nes
s fo
r a
larg
e n
um
ber
of
gro
wer
s.
Sep
-19
Farm
er r
elie
f m
easu
res
Farm
pro
du
cts
An
no
un
ced
an
aid
pac
kag
e fo
r fa
rmer
s an
d c
om
mu
nit
ies
affe
cted
by
seve
re d
rou
gh
t. T
he
assi
stan
ce a
lso
in
clu
des
pay
men
ts f
or
wat
er in
fras
tru
ctu
re u
pg
rad
es a
nd
rel
ated
pro
ject
s, a
s w
ell a
s m
easu
res
to s
imp
lify
and
ext
end
th
e G
ove
rnm
ent’
s Fa
rm H
ou
seh
old
Allo
wan
ce p
rog
ram
me.
Bo
livia
(Pl
uri
nat
ion
al
Stat
e o
f)Ju
n-1
9Ex
po
rt p
olic
y/G
MO
po
licy
Soyb
ean
sD
ecid
ed –
wit
h a
vie
w t
o r
aisi
ng
th
e ex
po
rt c
om
pet
iven
ess
of
the
cou
ntr
y’s
soyb
ean
ind
ust
ry –
to
i) d
eres
tric
t u
p t
o 6
0 p
erce
nt
(or
1.6
mill
ion
to
nn
es p
er y
ear)
of
the
cou
ntr
y’s
soyb
ean
exp
ort
s, a
nd
ii)
auth
ori
ze t
he
cult
ivat
ion
of
two
new
gen
etic
ally
en
gin
eere
d s
oyb
ean
eve
nts
.
Bra
zil
Ap
r-19
Bio
fuel
po
licy
Bio
die
sel
Post
po
ned
th
e ri
se in
man
dat
ory
ble
nd
ing
of
reg
ula
r tr
ansp
ort
die
sel w
ith
bio
die
sel t
hat
was
ori
gin
ally
sc
hed
ule
d f
or
Jun
e 20
19.
Ap
r-19
Tran
spo
rt p
olic
yG
rain
s, o
ilsee
ds
Rai
sed
th
e g
ove
rnm
ent-
set
min
imu
m t
ruck
fre
igh
t ra
tes
by
4.1
per
cen
t to
co
mp
ensa
te d
rive
rs f
or
incr
ease
s in
th
e p
rice
of
tran
spo
rt d
iese
l.

35FOOD OUTLOOKNOVEMBER 2019
Oilcro
ps
CO
UN
TRY
DA
TEPO
LIC
Y D
OM
AIN
PRO
DU
CT
DES
CR
IPTI
ON
Bra
zil
May
-19
Ag
ricu
ltu
ral p
olic
yA
ll cr
op
s, li
vest
ock
pro
du
cts
Pres
ente
d t
he
agri
cult
ura
l su
pp
ort
pro
gra
mm
e fo
r th
e 20
19/2
0 se
aso
n, h
igh
ligh
tin
g t
hat
par
ticu
lar
atte
nti
on
wo
uld
be
pai
d t
o t
he
nee
ds
of
smal
l- a
nd
med
ium
-siz
ed f
arm
s an
d t
o t
he
follo
win
g a
reas
: cro
p
insu
ran
ce, l
ow
-car
bo
n a
gri
cult
ure
, tec
hn
ical
inn
ova
tio
n, i
rrig
atio
n, s
oil
imp
rove
men
t, n
ew c
red
it t
oo
ls,
fore
st p
rote
ctio
n, a
nd
dai
ry, p
ork
an
d p
ou
ltry
pro
du
ctio
n. I
nfo
rmed
th
at a
ll m
ajo
r cr
edit
pro
gra
mm
es w
ou
ld
be
exp
and
ed, a
lth
ou
gh
th
e in
tere
st r
ates
fo
r la
rger
pro
du
cers
wo
uld
be
rais
ed. W
hile
to
tal g
ove
rnm
ent
ou
tlay
s fo
r in
tere
st r
ate
sub
sid
ies
wo
uld
be
on
ly m
arg
inal
ly h
igh
er t
han
last
sea
son
, far
mer
s w
ou
ld b
enefi
t fr
om
ad
dit
ion
al o
pti
on
s to
ap
ply
fo
r p
riva
te lo
ans.
Mo
st m
arke
tin
g a
ssis
tan
ce p
rog
ram
mes
wer
e al
so r
e-au
tho
rize
d, a
lth
ou
gh
wit
h r
edu
ced
bu
dg
etar
y al
loca
tio
ns.
Ou
tlay
s fo
r cr
op
insu
ran
ce p
rog
ram
mes
, by
con
tras
t, w
ere
set
to e
xpan
d s
izea
bly
fo
r th
e se
con
d y
ear
in s
ucc
essi
on
.
May
-19
Mar
ket
reg
ula
tio
nG
rain
s, o
ilsee
ds
Red
uce
d t
he
nu
mb
er o
f p
ub
lic g
rain
sto
rag
e fa
cilit
ies
op
erat
ing
acr
oss
th
e co
un
try,
em
ph
asiz
ing
th
at t
he
clo
sure
s w
ere
envi
sag
ed in
loca
tio
ns
wh
ere
amp
le p
riva
te s
tora
ge
cap
acit
y w
as a
vaila
ble
.
May
-19
GM
O p
olic
ySo
ybea
ns
Au
tho
rize
d t
he
cult
ivat
ion
of
a n
ew t
ran
sgen
ic s
oyb
ean
var
iety
ch
arac
teri
zed
by
bo
th d
rou
gh
t to
lera
nce
an
d
resi
stan
ce t
o t
wo
wid
ely
use
d h
erb
icid
es. T
he
vari
ety’
s co
mm
erci
al d
istr
ibu
tio
n w
ou
ld s
tart
on
ce a
pp
rova
l in
ke
y im
po
rtin
g c
ou
ntr
ies
was
sec
ure
d.
Au
g-1
9B
iofu
el p
olic
yB
iod
iese
lR
aise
d, e
ffec
tive
1 S
epte
mb
er 2
019,
th
e m
and
ato
ry n
atio
nal
ble
nd
ing
rat
e fo
r b
iod
iese
l in
tra
nsp
ort
die
sel t
o
11 p
erce
nt.
Au
g-1
9B
iofu
el p
olic
yB
iod
iese
lIn
crea
sed
th
e n
um
ber
of
smal
l far
mer
co
op
erat
ives
th
at m
ay q
ual
ify
as s
up
plie
rs o
f ra
w m
ater
ials
to
th
e b
iod
iese
l in
du
stry
. Th
e m
easu
re w
as e
xpec
ted
to
lift
th
e n
um
ber
of
fam
ily f
arm
s p
arti
cip
atin
g in
th
e co
un
try’
s b
iod
iese
l pro
du
ctio
n c
hai
n t
o m
ore
th
an 1
00 0
00.
Sep
-19
Farm
er r
elie
f m
easu
res
Farm
pro
du
cts
Au
tho
rize
d o
ne-
tim
e p
aym
ents
to
far
mer
s in
th
e co
un
try’
s n
ort
her
n a
nd
no
rth
east
ern
reg
ion
s af
fect
ed b
y se
vere
dro
ug
ht.
Sep
-19
Mar
ket
reg
ula
tio
n
Soyb
ean
see
d
Ord
ered
, fo
r th
e se
con
d t
ime,
a s
eed
pro
du
cer
to d
epo
sit
roya
ltie
s co
llect
ed in
to a
n e
scro
w a
cco
un
t,
pen
din
g t
he
ou
tco
me
of
litig
atio
n o
ver
a p
aten
t d
isp
ute
.
Oct
-19
Pro
du
ctio
n s
up
po
rtFa
rm p
rod
uct
s
Lau
nch
ed a
set
of
mea
sure
s ai
med
at
exp
and
ing
fin
anci
ng
fo
r th
e ag
ricu
ltu
re s
ecto
r. In
terv
enti
on
s w
ou
ld
focu
s o
n: i
) st
imu
lati
ng
th
e p
rovi
sio
n o
f p
rod
uct
ion
loan
s b
y th
e p
riva
te s
ecto
r; ii
) re
du
cin
g in
tere
st r
ates
via
b
ette
r g
uar
ante
es f
or
len
din
g in
stit
uti
on
s; a
nd
iii)
en
han
cin
g c
om
pet
itio
n a
cro
ss r
ura
l cre
dit
op
erat
ion
s. T
he
new
po
licie
s w
ou
ld in
clu
de
the
equ
aliz
atio
n o
f in
tere
st r
ates
bet
wee
n le
nd
ing
inst
itu
tes
and
th
e p
oss
ibili
ty
of
issu
ing
sec
uri
ties
in f
ore
ign
cu
rren
cy.
Oct
-19
Mar
ket
reg
ula
tio
n/f
oo
d
stan
dar
ds
Oliv
e o
ilSu
spen
ded
an
d r
emo
ved
fro
m t
he
mar
ket
33 b
ran
ds
of
oliv
e o
il fo
un
d t
o b
e ad
ult
erat
ed w
ith
so
ybea
n o
il o
f u
nkn
ow
n o
rig
in.
Bu
rkin
a Fa
so
Sep
-19
Imp
ort
po
licy
Veg
etab
le o
ils
An
no
un
ced
pla
ns
to s
usp
end
sp
ecia
l im
po
rt p
erm
its
for
veg
etab
le o
ils (
and
su
gar
), in
su
pp
ort
of
do
mes
tic
pro
du
cers
.
Can
ada
Ap
r-19
San
itar
y st
and
ard
s/im
po
rt p
olic
ySe
lect
ed o
ilsee
ds,
mea
lsIn
tro
du
ced
str
ing
ent
qu
alit
y re
qu
irem
ents
fo
r se
lect
ed f
eed
ing
red
ien
ts –
incl
ud
ing
oils
eed
s an
d a
sso
ciat
ed
mea
ls –
imp
ort
ed f
rom
co
un
trie
s id
enti
fied
as
po
sin
g p
ote
nti
al c
on
cern
s w
ith
reg
ard
to
Afr
ican
Sw
ine
Feve
r.

Ma
jor
po
licy
de
velo
pm
en
ts
36 FOOD OUTLOOKNOVEMBER 2019
CO
UN
TRY
DA
TEPO
LIC
Y D
OM
AIN
PRO
DU
CT
DES
CR
IPTI
ON
Can
ada
Ap
r-19
Pest
icid
e re
gu
lati
on
Neo
nic
oti
no
ids
Det
erm
ined
th
at s
eed
tre
atm
ents
wit
h t
hre
e p
esti
cid
es b
elo
ng
ing
to
th
e n
eon
ico
tin
oid
s g
rou
p w
ou
ld
con
tin
ue
to b
e al
low
ed, w
hile
exi
stin
g r
estr
icti
on
s fo
r o
ther
per
mit
ted
use
s, p
roh
ibit
ion
of
sele
cted
ap
plic
atio
ns,
an
d m
axim
um
res
idu
e lim
its
wo
uld
rem
ain
in p
lace
.
May
-19
Pro
du
ctio
n s
up
po
rt
(tra
de
mit
igat
ion
m
easu
res)
R
apes
eed
Off
ered
fin
anci
al a
ssis
tan
ce t
o r
apes
eed
far
mer
s af
fect
ed b
y C
hin
a’s
rece
nt
dec
isio
n t
o s
usp
end
th
e im
po
rt
per
mit
s o
f se
lect
ed C
anad
ian
rap
esee
d s
up
plie
rs. M
ore
sp
ecifi
cally
, th
e am
ou
nt
of
fed
eral
loan
s av
aila
ble
to
al
l far
mer
s w
ou
ld b
e ra
ised
, wh
ile, f
or
rap
esee
d g
row
ers,
th
e in
tere
st-f
ree
po
rtio
n o
f su
ch lo
ans
wo
uld
be
incr
ease
d, a
nd
th
e ap
plic
atio
n d
ead
line
for
a fe
der
al in
com
e st
abili
zati
on
pro
gra
mm
e w
ou
ld b
e ex
ten
ded
. A
lso
pro
mis
ed t
o s
up
po
rt e
ffo
rts
by
the
rap
esee
d s
ecto
r to
div
ersi
fy in
to e
xpo
rt m
arke
ts o
ther
th
an C
hin
a.
Jun
-19
Pro
du
ctio
n s
up
po
rt
(tra
de
mit
igat
ion
m
easu
res)
R
apes
eed
An
no
un
ced
ad
dit
ion
al in
sura
nce
su
pp
ort
to
Can
adia
n r
apes
eed
exp
ort
ers,
in a
bid
to
hel
p r
apes
eed
ex
po
rtin
g c
om
pan
ies
man
age
un
cert
ain
ties
ass
oci
ated
wit
h t
he
exp
lora
tio
n o
f n
ew m
arke
ts –
in t
he
wak
e o
f re
cen
t sh
ipm
ent
dis
rup
tio
ns
to C
hin
a.
Jul-
19Ex
po
rt p
olic
yG
rain
s, o
ilsee
ds
Co
mm
itte
d f
un
din
g f
or
a va
riet
y o
f p
roje
cts
aim
ed a
t st
ren
gth
enin
g, d
iver
sify
ing
an
d e
xpan
din
g t
he
cou
ntr
y’s
gra
ins
and
oils
eed
s ex
po
rts.
Ben
efici
arie
s in
clu
de
the
Can
ola
Co
un
cil o
f C
anad
a, r
eflec
tin
g
go
vern
men
t ef
fort
s to
pro
mo
te t
he
cou
ntr
y’s
rap
esee
d e
xpo
rts.
Au
g-1
9Fa
rmer
rel
ief
mea
sure
sG
rain
s, o
ilsee
ds,
pu
lses
An
no
un
ced
th
at c
rop
pro
du
cers
aff
ecte
d b
y lo
w p
rice
s, r
edu
ced
mar
keti
ng
op
po
rtu
nit
ies
or
falli
ng
inco
mes
w
ou
ld b
e g
ran
ted
an
ad
dit
ion
al s
ix m
on
ths
to r
epay
ou
tsta
nd
ing
201
8 ca
sh a
dva
nce
s re
ceiv
ed u
nd
er
Can
ada’
s lo
an g
uar
ante
e p
rog
ram
me.
Au
g-1
9Tr
ansp
ort
infr
astr
uct
ure
m
easu
res
Gra
ins,
oils
eed
sSe
t as
ide
fun
ds
to u
pg
rad
e th
e co
un
try’
s p
ort
infr
astr
uct
ure
an
d e
nsu
re t
he
con
tin
ued
effi
cien
cy o
f th
e n
atio
nal
rai
l tra
nsp
ort
net
wo
rk. A
imed
at
ensu
rin
g t
hat
go
od
s ca
n m
ove
effi
cien
tly
to m
arke
ts, t
he
init
iati
ve
wo
uld
hel
p C
anad
ian
bu
sin
esse
s to
co
mp
ete
glo
bal
ly.
Sep
-19
Form
al t
rad
e co
nsu
ltat
ion
sR
apes
eed
Info
rmed
th
at it
req
ues
ted
bila
tera
l tra
de
neg
oti
atio
ns
wit
h C
hin
a at
th
e W
orl
d T
rad
e O
rgan
izat
ion
(W
TO),
to
res
olv
e q
ual
ity
con
cern
s ra
ised
by
Ch
ina
ove
r ra
pes
eed
imp
ort
ed f
rom
Can
ada.
Ch
ina(
Mai
nla
nd
)
Ap
r-19
Imp
ort
po
licy
Dis
tille
rs g
rain
sEv
alu
ated
th
e p
oss
ibili
ty o
f re
view
ing
th
e an
ti-d
um
pin
g a
nd
co
un
terv
ailin
g d
uti
es a
pp
lied
by
Ch
ina
on
im
po
rts
of
dis
tille
rs g
rain
s fr
om
th
e U
nit
ed S
tate
s.
Ap
r-19
Mar
ket
reg
ula
tio
nG
rain
s, v
eget
able
oils
Rel
ease
d a
n e
mer
gen
cy p
lan
to
reg
ula
te, i
n t
he
Bei
jing
Mu
nic
ipal
ity,
th
e su
pp
ly a
nd
pri
ces
of
gra
ins
and
co
oki
ng
oil
such
as
soyb
ean
oil.
Un
der
th
e m
easu
re, m
un
icip
al a
uth
ori
ties
wo
uld
mo
nit
or
wh
ole
sale
an
d
reta
il p
rice
s an
d m
ay r
eso
rt t
o p
rice
co
ntr
ol m
ech
anis
ms,
incl
ud
ing
th
e re
leas
e o
f g
rain
s/co
oki
ng
oil
fro
m
stat
e-o
wn
ed s
tock
pile
s.
Ch
ina(
Mai
nla
nd
)/
Mal
aysi
a
Ap
r-19
to
Ju
n-
19
Bila
tera
l, se
cto
r-sp
ecifi
c tr
ade
init
iati
ves
Palm
oil
Sig
ned
a m
emo
ran
du
m o
f u
nd
erst
and
ing
(M
oU
) w
her
eby
Ch
ina
wo
uld
ste
p u
p it
s p
urc
has
es o
f M
alay
sian
p
alm
oil
and
der
ived
pro
du
cts
ove
r th
e n
ext
5 ye
ars.
Th
e tw
o c
ou
ntr
ies
also
ag
reed
to
set
up
, in
Ch
ina,
an
av
iati
on
bio
fuel
pla
nt,
an
d t
o d
evel
op
th
e co
un
try’
s p
rod
uct
ion
of
un
satu
rate
d f
at. F
urt
her
mo
re, a
Ch
ines
e st
ate-
ow
ned
en
terp
rise
was
ch
ose
n t
o r
esu
me
con
stru
ctio
n o
f M
alay
sia’
s Ea
st C
oas
t R
ail L
ink,
alo
ng
wit
h
com
mit
men
ts b
y C
hin
a to
incr
ease
its
pu
rch
ases
of
Mal
aysi
an p
alm
oil.
Th
e tw
o c
ou
ntr
ies
also
ag
reed
to
si
mp
lify
the
pro
ced
ure
s fo
r im
po
rtin
g M
alay
sian
pal
m o
il in
to C
hin
a.

37FOOD OUTLOOKNOVEMBER 2019
Oilcro
ps
CO
UN
TRY
DA
TEPO
LIC
Y D
OM
AIN
PRO
DU
CT
DES
CR
IPTI
ON
Ch
ina(
Mai
nla
nd
)/U
nit
ed
Stat
es
May
-19
to O
ct-
19
Co
mp
reh
ensi
ve t
rad
e n
ego
tiat
ion
s So
ybea
ns,
oth
er o
ilcro
ps
and
d
eriv
ed p
rod
uct
s
Mo
ved
fo
rwar
d d
isco
nti
nu
ou
sly
wit
h t
rad
e ta
lks
that
co
mm
ence
d in
mid
-201
8. In
May
, fo
llow
ing
a
tem
po
rary
hal
t in
neg
oti
atio
ns,
th
e tw
o c
ou
ntr
ies
intr
od
uce
d a
dd
itio
nal
tra
de
mea
sure
s af
fect
ing
th
eir
resp
ecti
ve im
po
rts:
wh
ile t
he
US
rais
ed im
po
rt t
arif
fs o
n U
SD 2
00 b
illio
n w
ort
h o
f C
hin
ese
go
od
s fr
om
10
per
cen
t to
25
per
cen
t, C
hin
a in
crea
sed
tax
atio
n o
n U
S im
po
rts
wo
rth
USD
60
bill
ion
to
10–
25 p
erce
nt.
In
bo
th c
ases
, co
mm
od
itie
s af
fect
ed in
clu
de
a n
um
ber
of
oilc
rop
s an
d d
eriv
ed p
rod
uct
s, t
ran
sact
ion
s o
f w
hic
h,
ho
wev
er, h
ave
bee
n m
od
est
in r
ecen
t ye
ars.
Fo
llow
ing
a t
emp
ora
ry t
ruce
, in
Au
gu
st, n
ego
tiat
ion
s st
alle
d
agai
n, l
ead
ing
bo
th c
ou
ntr
ies
to a
nn
ou
nce
imp
lem
enta
tio
n o
f ad
dit
ion
al r
etal
iato
ry t
arif
fs o
n e
ach
oth
er’s
ex
po
rts
fro
m S
epte
mb
er. I
n t
he
case
of
Ch
ina,
th
e lis
t o
f co
mm
od
itie
s af
fect
ed w
ou
ld in
clu
de
US-
ori
gin
so
ybea
ns,
wh
ich
wo
uld
bea
r ad
dit
ion
al t
arif
fs o
f 5–
10 p
erce
nt.
Wh
en t
rad
e ta
lks
resu
med
in m
id-S
epte
mb
er,
the
US
ple
dg
ed t
o p
ost
po
ne
an in
crea
se in
ret
alia
tory
tar
iffs
sch
edu
led
fo
r O
cto
ber
, wh
ile C
hin
a co
mm
itte
d
to r
esu
me
pu
rch
ases
of
US
agri
cult
ura
l go
od
s, in
clu
din
g s
oyb
ean
s. M
ore
sp
ecifi
cally
, Ch
ina’
s tr
ade
auth
ori
ties
su
cces
sive
ly a
lloca
ted
sp
ecia
l im
po
rt q
uo
tas
for
soyb
ean
s –
com
pri
sin
g w
aive
rs o
f th
e re
leva
nt
reta
liato
ry
tari
ffs
– to
a n
um
ber
of
stat
e-ru
n, p
riva
te a
s w
ell a
s fo
reig
n-o
wn
ed b
usi
nes
ses.
Acc
ord
ing
to
th
e U
nit
ed
Stat
es D
epar
tmen
t o
f A
gri
cult
ure
(U
SDA
), b
y m
id-O
cto
ber
, so
ybea
n s
ales
to
Ch
ina
(fo
r d
eliv
ery
in t
he
2019
/20
mar
keti
ng
yea
r) h
ad r
each
ed 5
.7 m
illio
n t
on
nes
, co
mp
ared
wit
h t
o 1
.0 m
illio
n t
on
nes
a y
ear
earl
ier.
Ho
wev
er, w
ith
co
mp
reh
ensi
ve t
rad
e n
ego
tiat
ion
s st
ill u
nd
er w
ay, C
hin
a re
frai
ned
fro
m c
om
mit
tin
g t
o a
sp
ecifi
c, t
ime-
bo
un
d v
olu
me
of
US-
ori
gin
so
ybea
n p
urc
has
es.
Ch
ina(
Mai
nla
nd
)
Jun
-19
Imp
ort
po
licy
Dis
tille
rs g
rain
sD
ecid
ed n
ot
to r
emo
ve t
he
du
ties
ap
plie
d b
y C
hin
a o
n im
po
rts
of
dis
tille
rs g
rain
s fr
om
th
e U
nit
ed S
tate
s,
citi
ng
co
nti
nu
ed p
ote
nti
al d
amag
e to
do
mes
tic
pro
du
cers
.
Jun
-19
Foo
d s
tan
dar
ds
Sele
cted
oilc
rop
s, o
ils a
nd
fa
ts
No
tifi
ed t
he
WTO
of
a d
raft
nat
ion
al s
tan
dar
d o
n m
axim
um
myc
oto
xin
leve
ls in
fo
od
pro
du
cts.
Th
e p
rop
ose
d s
tan
dar
d d
eter
min
es m
axim
um
leve
ls f
or,
inte
r al
ia, s
oyb
ean
, gro
un
dn
uts
, ses
ame
and
th
eir
der
ived
pro
du
cts,
as
wel
l as
for
veg
etab
le o
ils a
nd
fat
s.
Ch
ina(
Mai
nla
nd
)/R
uss
ian
Fe
der
atio
nJu
n-1
9B
ilate
ral,
sect
or-
spec
ific
trad
e in
itia
tive
sSe
lect
ed o
ilsee
ds,
mea
lsSi
gn
ed a
bila
tera
l pro
toco
l on
ph
yto
san
itar
y st
and
ard
s ai
med
at
faci
litat
ing
exp
ort
s o
f a
nu
mb
er o
f p
rod
uct
s –
incl
ud
ing
so
ybea
ns,
rap
esee
d a
nd
su
nfl
ow
er s
eed
mea
l – f
rom
th
e R
uss
ian
Fed
erat
ion
to
Ch
ina.
Ch
ina(
Mai
nla
nd
)
Jun
-19
to S
ep-
19M
arke
t re
gu
lati
on
Soyb
ean
s, r
apes
eed
oil
Hel
d s
ever
al n
atio
nal
au
ctio
ns
fro
m s
tate
res
erve
s co
veri
ng
so
ybea
n o
il (i
n A
ug
ust
), r
apes
eed
oil
(fro
m m
id-
Jun
e to
mid
-Au
gu
st),
an
d s
oyb
ean
s (f
rom
mid
-Ju
ne
to e
arly
-Sep
tem
ber
). F
or
all t
hre
e co
mm
od
itie
s, t
ota
l vo
lum
es s
old
wer
e si
gn
ifica
ntl
y b
elo
w la
st y
ear’
s le
vels
.
Jul-
19H
ealt
h p
olic
yO
ils a
nd
fat
sR
elea
sed
a s
et o
f n
utr
itio
nal
gu
idel
ines
incl
ud
ing
am
bit
iou
s ta
rget
s fo
r lo
wer
ing
peo
ple
s’ d
ieta
ry in
take
of
oils
, sal
t an
d s
ug
ar b
y 20
30, i
n a
bid
to
min
imiz
e ad
vers
e ef
fect
s o
n h
um
an h
ealt
h.
Jul-
19
to S
ep-
19
Imp
ort
po
licy
(tra
de
mit
igat
ion
mea
sure
s)So
ybea
ns,
so
yoil,
so
ymea
l, ra
pes
eed
oil,
pal
m o
il
Lau
nch
ed n
ew e
ffo
rts
– in
par
alle
l wit
h t
he
cou
ntr
y’s
pro
trac
ted
tra
de
neg
oti
atio
ns
wit
h t
he
Un
ited
Sta
tes
– to
exp
and
th
e n
atio
n’s
imp
ort
op
tio
ns
for
oils
eed
s an
d d
eriv
ed p
rod
uct
s. M
ore
sp
ecifi
cally
, i)
imp
ort
s o
f so
ybea
ns,
so
ybea
n m
eal,
rap
esee
d m
eal a
nd
su
nfl
ow
er m
eal f
rom
th
e R
uss
ian
Fed
erat
ion
wer
e ap
pro
ved
; ii)
p
lan
s to
rem
ove
so
ybea
n o
il, r
apes
eed
oil
and
pal
m o
il fr
om
its
list
of
pro
du
cts
sub
ject
to
imp
ort
tar
iff
qu
ota
m
anag
emen
t w
ere
ann
ou
nce
d; i
ii) s
oym
eal i
mp
ort
s fr
om
sel
ecte
d c
rush
ers
in A
rgen
tin
a w
ere
app
rove
d; a
nd
iv
) th
e p
oss
ibili
ty o
f im
po
rtin
g s
oym
eal f
rom
Bra
zil w
as e
xplo
red
.
Au
g-1
9Pr
od
uct
ion
su
pp
ort
Soyb
ean
sLo
wer
ed t
he
sub
sid
ies
off
ered
to
so
ybea
n g
row
ers
in t
he
cou
ntr
y’s
key
soyb
ean
gro
win
g p
rovi
nce
H
eilo
ng
jian
g –
dri
ven
by
con
cern
s o
ver
larg
er t
han
des
ired
cu
ts in
mai
ze p
rod
uct
ion
.
Ch
ina(
Mai
nla
nd
)/
Thai
lan
dSe
p-1
9B
ilate
ral,
sect
or-
spec
ific
trad
e in
itia
tive
sPa
lm k
ern
el e
xpel
ler
Sig
ned
an
Mo
U a
llow
ing
Ch
ina
to p
rom
ote
th
e im
po
rt o
f p
alm
ker
nel
exp
elle
r (t
o b
e u
sed
as
anim
al f
eed
) fr
om
Th
aila
nd
. Th
e in
itia
tive
co
mp
lem
ents
oth
er e
ffo
rts
by
Ch
ina
to d
iver
sify
its
do
mes
tic
feed
su
pp
ly c
hai
n.

Ma
jor
po
licy
de
velo
pm
en
ts
38 FOOD OUTLOOKNOVEMBER 2019
CO
UN
TRY
DA
TEPO
LIC
Y D
OM
AIN
PRO
DU
CT
DES
CR
IPTI
ON
Egyp
tM
ay-1
9Se
cto
r d
evel
op
men
t m
easu
res
Oliv
e tr
eeA
nn
ou
nce
d p
lan
s to
bo
ost
do
mes
tic
oliv
e o
il p
rod
uct
ion
by
pro
mo
tin
g t
he
pla
nti
ng
of
oliv
e tr
ees,
wit
h a
vi
ew t
o r
edu
cin
g t
he
cou
ntr
y’s
relia
nce
on
imp
ort
s o
f ed
ible
oils
.
Euro
pea
n U
nio
n
Ap
r-19
Foo
d s
tan
dar
ds/
foo
d
safe
ty m
easu
reTr
ans
fatt
y ac
idA
pp
rove
d a
n E
U-w
ide
max
imu
m li
mit
fo
r h
arm
ful t
ran
sfat
s in
fo
od
pro
du
cts.
Un
der
th
e n
ew r
egu
lati
on
, as
of
Ap
ril 2
021,
th
e am
ou
nt
of
ind
ust
rial
ly-p
rod
uce
d t
ran
sfat
s in
pro
cess
ed f
oo
ds
may
no
t ex
ceed
2 g
per
100
g
of
fat.
May
-19
Mar
ket
con
tro
l/fo
od
st
and
ard
s O
live
oil
Dis
man
tled
an
org
aniz
ed c
rim
e g
rou
p t
rad
ing
co
un
terf
eit
oliv
e o
il b
etw
een
Ital
y an
d G
erm
any.
Th
e ca
se
con
cern
ed lo
w-q
ual
ity
oil
adu
lter
ated
wit
h v
ario
us
sub
stan
ces
and
su
bse
qu
entl
y so
ld a
s ex
tra
virg
in o
il.
May
-19
Pest
co
ntr
ol
Xyl
ella
fas
tid
iosa
Ren
ewed
its
effo
rts
to p
reve
nt
the
furt
her
sp
read
of
the
xyle
lla f
asti
dio
sa d
isea
se, e
mp
has
izin
g t
he
imp
ort
ance
of
mea
sure
s to
i) c
on
tro
l in
sect
s kn
ow
n t
o t
ran
smit
th
e p
ath
og
en, a
nd
ii)
min
imiz
e th
e d
elay
b
etw
een
det
ecti
on
an
d im
ple
men
tati
on
of
con
tro
l in
stru
men
ts, s
uch
as
rem
ovi
ng
infe
cted
pla
nts
an
d
esta
blis
hin
g d
emar
cate
d a
reas
.
Jun
-19
Bio
fuel
po
licy
Bio
die
sel
Det
erm
ined
th
at t
he
new
reg
ula
tio
ns
defi
nin
g h
igh
/low
ind
irec
t la
nd
-use
ch
ang
e (I
LUC
)-ri
sk b
iofu
el
feed
sto
cks
wo
uld
co
me
into
fo
rce
on
10
Jun
e 20
19. T
he
mea
sure
en
tails
th
at, a
s o
f 20
30, s
elec
ted
typ
es o
f b
iod
iese
l may
no
lon
ger
co
un
t to
war
ds
mee
tin
g t
he
EU’s
gre
en f
uel
co
nsu
mp
tio
n t
arg
ets.
Jun
-19
Pest
icid
e re
gu
lati
on
Dim
eth
oat
eA
nn
ou
nce
d t
hat
mem
ber
sta
tes
may
no
t re
new
au
tho
riza
tio
ns
of
inse
ctic
ides
co
nta
inin
g d
imet
ho
ate
bey
on
d
July
202
0, c
itin
g a
nim
al/h
um
an h
ealt
h c
on
cern
s.
Euro
pea
n U
nio
n/
MER
CO
SUR
Jun
-19
Co
mp
reh
ensi
ve t
rad
e ag
reem
ents
All
cro
ps,
live
sto
ck p
rod
uct
s
The
EU a
nd
th
e M
ERC
OSU
R b
loc
reac
hed
ag
reem
ent
in p
rin
cip
le o
n a
co
mp
reh
ensi
ve f
ree-
trad
e tr
eaty
. Th
e ag
reem
ent
wo
uld
pro
gre
ssiv
ely
enh
ance
mar
ket
acce
ss f
or
go
od
s an
d s
ervi
ces,
wh
ile p
rom
oti
ng
co
op
erat
ion
in
cu
sto
ms
issu
es, f
oo
d s
afet
y an
d s
ust
ain
able
tra
de.
Nex
t st
eps
incl
ud
e th
e tr
eaty
’s le
gal
rev
isio
n a
nd
p
arlia
men
tary
rat
ifica
tio
n in
all
par
tici
pat
ing
co
un
trie
s.
Euro
pea
n U
nio
n/V
iet
Nam
Jun
-19
Co
mp
reh
ensi
ve t
rad
e ag
reem
ents
Sele
cted
gra
ins,
oils
eed
sTh
e EU
an
d V
iet
Nam
sig
ned
a F
ree
Trad
e A
gre
emen
t th
at w
ou
ld li
ft t
arif
fs o
n 9
9 p
erce
nt
of
go
od
s tr
aded
, in
clu
din
g w
hea
t, r
ice,
mai
ze a
nd
so
ybea
n p
rod
uct
s. T
he
dea
l will
co
me
into
fo
rce
on
ce it
is r
atifi
ed b
y la
wm
aker
s o
n b
oth
sid
es.
Euro
pea
n U
nio
n
Jul-
19G
MO
po
licy
Soyb
ean
s, r
apes
eed
Ap
pro
ved
th
e im
po
rt o
f a
new
GM
inse
ct-r
esis
tan
t so
ybea
n v
arie
ty a
nd
ren
ewed
th
e im
po
rt p
erm
it f
or
a g
lufo
sin
ate-
tole
ran
t G
M r
apes
eed
var
iety
.
Jul-
19En
viro
nm
enta
l po
licy
Gra
ins,
oils
eed
s/o
ils/m
eals
, liv
esto
ck p
rod
uct
s, p
aper
Set
ou
t a
pla
n o
f ac
tio
n a
imed
at
con
trib
uti
ng
to
th
e p
rote
ctio
n a
nd
reh
abili
tati
on
of
the
wo
rld
’s
fore
sts,
ass
erti
ng
th
at d
eman
d f
or
foo
d, f
eed
, bio
fuel
, tim
ber
an
d o
ther
go
od
s –
and
hen
ce E
U im
po
rts
of
com
mo
dit
ies
such
as
gra
ins,
oils
eed
s, v
eget
able
oils
, bee
f o
r p
aper
– a
re a
mo
ng
th
e m
ain
dri
vers
of
glo
bal
def
ore
stat
ion
. Th
e p
lan
aim
s to
i) r
edu
ce t
he
EU’s
co
nsu
mp
tio
n f
oo
tpri
nt
on
lan
d; i
i) e
nco
ura
ge
the
con
sum
pti
on
of
pro
du
cts
fro
m d
efo
rest
atio
n-f
ree
sup
ply
ch
ain
s; a
nd
iii)
en
han
ce t
he
avai
lab
ility
of
info
rmat
ion
on
fo
rest
s an
d c
om
mo
dit
y su
pp
ly c
hai
ns.
Mea
sure
s en
visa
ged
incl
ud
e th
e se
arch
fo
r m
ean
s to
str
eng
then
cer
tifi
cati
on
sch
emes
fo
r d
efo
rest
atio
n-f
ree
pro
du
cts
and
act
ion
s to
min
imiz
e th
e ri
sk o
f d
efo
rest
atio
n a
nd
fo
rest
deg
rad
atio
n a
sso
ciat
ed w
ith
co
mm
od
ity
imp
ort
s.
Au
g-1
9Im
po
rt p
olic
y/b
iofu
el
po
licy
Bio
die
sel
Imp
ose
d p
rovi
sio
nal
co
un
terv
ailin
g d
uti
es o
n im
po
rts
of
bio
die
sel f
rom
Ind
on
esia
, aft
er d
eter
min
ing
th
at
Ind
on
esia
n b
iod
iese
l pro
du
cers
ben
efit
fro
m g
ran
ts, t
ax in
cen
tive
s an
d a
cces
s to
raw
mat
eria
ls (
no
tab
ly p
alm
o
il) b
elo
w m
arke
t p
rice
s –
a co
nd
itio
n b
elie
ved
to
infl
ict
a th
reat
of
eco
no
mic
dam
age
to E
U p
rod
uce
rs.

Oilcro
ps
39FOOD OUTLOOKNOVEMBER 2019
CO
UN
TRY
DA
TEPO
LIC
Y D
OM
AIN
PRO
DU
CT
DES
CR
IPTI
ON
Euro
pea
n U
nio
n
Au
g-1
9 to
Sep
-19
Pest
icid
e re
gu
lati
on
Gly
ph
osa
te
Info
rmed
of
pla
ns
by
a n
um
ber
of
mem
ber
sta
tes
to b
an t
he
sale
of
gly
ph
osa
te-b
ased
pes
tici
des
in t
hei
r te
rrit
ori
es –
bas
ed o
n h
um
an h
ealt
h c
on
cern
s. A
t th
e EU
leve
l, th
e h
erb
icid
e’s
auth
ori
zati
on
is s
et t
o e
xpir
e in
Dec
emb
er 2
022.
Un
less
th
e Eu
rop
ean
Co
mm
issi
on
ext
end
s th
e au
tho
riza
tio
n o
f g
lyp
ho
sate
at
EU le
vel,
or
gra
nts
imp
ort
to
lera
nce
fo
r th
e h
erb
icid
e to
th
ird
co
un
trie
s, im
pen
din
g n
atio
nal
ban
s h
ave
the
po
ten
tial
to
af
fect
exp
ort
s o
f ag
ricu
ltu
ral p
rod
uct
s to
th
e EU
.
Sep
-19
Pest
co
ntr
ol
Xyl
ella
fas
tid
iosa
Det
erm
ined
th
at It
aly
faile
d t
o c
om
ply
wit
h a
n E
U-w
ide
req
uir
emen
t to
tak
e m
easu
res
to c
on
tain
th
e sp
read
of
xyle
lla f
asti
dio
sa, t
he
bac
teri
um
th
at a
ffec
ts o
live
tree
s an
d o
ther
pla
nts
, cau
sin
g t
hei
r d
eath
by
des
icca
tio
n.
Sep
-19
Foo
d s
tan
dar
ds
Soyb
ean
sN
oti
fied
th
e W
TO a
bo
ut
new
ly e
stab
lish
ed m
axim
um
res
idu
e lim
its
for
sele
cted
fu
ng
icid
es, i
nse
ctic
ides
an
d
inse
ctic
ides
in s
oyb
ean
s an
d c
erea
ls.
Oct
-19
Mar
ket
reg
ula
tio
n
Oliv
e o
il
Co
nsi
der
ed a
ctiv
atin
g a
tem
po
rary
pri
vate
sto
rag
e m
ech
anis
m f
or
oliv
e o
il, in
a b
id t
o a
ssis
t p
rod
uce
rs –
es
pec
ially
in S
pai
n –
to
ove
rco
me
the
rece
nt
dec
line
in m
arke
t p
rice
s st
emm
ing
fro
m a
glu
t in
su
pp
lies.
Th
e EU
’s C
om
mo
n M
arke
t O
rgan
izat
ion
reg
ula
tio
n in
clu
des
pro
visi
on
s fo
r th
e sa
id p
rice
sta
bili
zati
on
mec
han
ism
, w
hic
h w
as la
st u
sed
in 2
012.
Fin
lan
dJu
n-1
9B
iofu
el p
olic
yB
iod
iese
lA
nn
ou
nce
d a
mb
itio
us
go
als
rela
ted
to
clim
ate
chan
ge,
incl
ud
ing
th
e o
blig
atio
n t
o b
len
d a
viat
ion
fu
el w
ith
30
per
cen
t re
new
able
fu
el b
y 20
30. F
eed
sto
ck s
uit
able
fo
r re
new
able
jet
fuel
incl
ud
es u
sed
co
oki
ng
oil
and
an
imal
was
te f
at.
Gh
ana
Feb
-19
Sect
or
dev
elo
pm
ent
mea
sure
sC
oco
nu
tR
enew
ed it
s ef
fort
s to
pro
mo
te t
he
cult
ivat
ion
of
coco
nu
t as
a c
ash
cro
p f
or
exp
ort
an
d d
om
esti
c co
nsu
mp
tio
n. S
up
po
rt m
easu
res
incl
ud
e th
e fr
ee d
istr
ibu
tio
n o
f h
ybri
d c
oco
nu
t se
edlin
gs
in t
he
cou
ntr
y’s
coas
tal C
entr
al R
egio
n.
Ind
ia
May
-19
Bio
fuel
po
licy
Bio
die
sel
Au
tho
rize
d n
atio
nw
ide
sale
s o
f p
ure
bio
die
sel (
B10
0) f
or
tran
spo
rtat
ion
pu
rpo
ses.
Mea
nw
hile
, th
e sa
le
of
read
y-m
ade
ble
nd
s o
f w
hat
ever
per
cen
tag
e co
nti
nu
es t
o b
e fo
rbid
den
, an
d B
100
may
no
t b
e so
ld a
s a
stan
dal
on
e re
ady-
for-
use
fu
el –
imp
lyin
g t
hat
th
e o
nu
s o
f b
len
din
g B
100
wit
h c
on
ven
tio
nal
die
sel r
ests
on
b
uye
rs.
Jun
-19
Foo
d s
tan
dar
ds/
foo
d
safe
ty m
easu
res
Veg
etab
le o
ilsA
men
ded
th
e co
un
try’
s la
bel
ling
reg
ula
tio
ns,
det
erm
inin
g t
hat
pac
kag
ed v
eget
able
oil
ble
nd
s h
ave
to b
e la
bel
led
as
such
, in
clu
din
g m
enti
on
of
bo
th t
he
typ
e o
f o
ils in
clu
ded
an
d t
he
per
cen
tag
e o
f ea
ch o
il b
y w
eig
ht.
Th
e n
ew r
egu
lati
on
cam
e in
to f
orc
e o
n 1
Ju
ly 2
019.
Jun
-19
Pro
du
ctio
n s
up
po
rtC
op
raR
epo
rted
pu
blic
pro
cure
men
t o
f co
pra
fro
m f
arm
ers
in T
amil
Nad
u s
tate
un
der
th
e n
atio
nal
Pri
ce S
up
po
rt
Sch
eme.
Wit
h p
rocu
rem
ent
pri
ces
set
at 2
7 p
erce
nt
abo
ve la
st y
ear’
s le
vel,
the
mea
sure
was
inte
nd
ed t
o h
elp
st
abili
ze c
op
ra p
rice
s o
n t
he
Ind
ian
mar
ket.
Jul-
19Pr
od
uct
ion
su
pp
ort
Gra
ins,
oils
eed
s
Sig
nifi
can
tly
rais
ed t
he
min
imu
m s
up
po
rt p
rice
s fo
r 20
19/2
0 K
har
if (
sum
mer
) o
ilsee
d c
rop
s –
in a
n e
ffo
rt
to in
cen
tivi
ze d
om
esti
c p
rod
uct
ion
an
d t
hu
s cu
rb t
he
cou
ntr
y’s
veg
etab
le o
il im
po
rts,
an
d in
form
ed t
hat
sp
ecia
lized
ag
enci
es d
esig
nat
ed b
y C
entr
al G
ove
rnm
ent
will
co
nti
nu
e to
un
der
take
pro
cure
men
t o
f o
ilsee
ds
fro
m s
mal
l an
d m
arg
inal
far
mer
s.
Jul-
19Im
po
rt p
olic
yPa
lm s
tear
inW
ith
dre
w t
he
du
ty e
xem
pti
on
pre
vio
usl
y g
ran
ted
fo
r p
alm
ste
arin
an
d p
alm
fat
ty a
cid
dis
tilla
tes
imp
ort
s.
The
mea
sure
s w
ere
mea
nt
to s
up
po
rt t
he
cou
ntr
y’s
oil
refi
nin
g in
du
stry
, wh
ich
pro
du
ces
con
sid
erab
le
volu
mes
of
pal
m s
tear
in a
nd
oth
er p
alm
pro
du
cts
by
refi
nin
g im
po
rted
pal
m o
il.
Jul-
19Se
cto
r d
evel
op
men
t m
easu
res
Co
con
ut
Ap
pro
ved
a t
hre
e-ye
ar p
roje
ct t
o s
up
po
rt t
he
coco
nu
t se
cto
r in
Ker
ala
Stat
e. T
he
pro
ject
is a
imed
at
revi
vin
g
coco
nu
t fa
rmin
g b
y su
pp
ort
ing
gro
wer
s w
ith
sci
enti
fic
pro
toco
ls f
or
valu
e ad
dit
ion
an
d p
roce
ssin
g.

Ma
jor
po
licy
de
velo
pm
en
ts
40 FOOD OUTLOOKNOVEMBER 2019
CO
UN
TRY
DA
TEPO
LIC
Y D
OM
AIN
PRO
DU
CT
DES
CR
IPTI
ON
Ind
ia
Au
g-1
9B
iofu
el p
olic
yB
iod
iese
l
Allo
wed
sta
te-o
wn
ed f
uel
co
mp
anie
s to
pro
cure
bio
die
sel m
ade
fro
m u
sed
co
oki
ng
oil
(UC
O)
at fi
xed
p
rice
s. T
he
lau
nch
of
a fo
rmal
ch
ain
fo
r th
e co
llect
ion
an
d r
ecyc
ling
of
UC
O w
as a
imed
at
bo
th lo
wer
ing
th
e co
un
try’
s m
iner
al o
il im
po
rts
and
red
uci
ng
hu
man
hea
lth
haz
ard
s th
at a
rise
fro
m t
he
rep
eate
d u
se o
f co
oki
ng
oils
.
Au
g-1
9Im
po
rt p
olic
yV
eget
able
oils
Co
nsi
der
ed le
vyin
g a
ces
s o
n a
ll ve
get
able
oil
imp
ort
s, w
ith
a v
iew
to
set
tin
g u
p a
n O
ilsee
d D
evel
op
men
t Fu
nd
, tas
ked
wit
h b
oo
stin
g t
he
cou
ntr
y’s
stag
nat
ing
oilc
rop
pro
du
ctio
n.
Au
g-1
9Se
cto
r d
evel
op
men
t m
easu
res
Oils
eed
sLa
un
ched
a p
rog
ram
me
to e
nh
ance
oils
eed
pro
du
ctio
n in
Pu
nja
b S
tate
. Th
e in
itia
tive
wo
uld
fo
cus
on
yi
eld
imp
rove
men
t m
easu
res,
en
han
cin
g p
rod
uct
ion
bo
th v
erti
cally
an
d h
ori
zon
tally
, an
d p
rom
oti
ng
m
ech
aniz
atio
n t
o m
inim
ize
po
st-h
arve
st lo
sses
.
Sep
-19
Imp
ort
po
licy
Palm
oil
Intr
od
uce
d –
eff
ecti
ve 4
Sep
tem
ber
201
9 an
d f
or
a p
erio
d o
f 18
0 d
ays
– a
5 p
erce
nt
‘saf
egu
ard
tar
iff’
on
im
po
rts
of
refi
ned
pal
m o
il fr
om
Mal
aysi
a, t
hu
s en
din
g t
he
pre
fere
nti
al t
reat
men
t M
alay
sian
exp
ort
ers
enjo
yed
sin
ce t
he
beg
inn
ing
of
2019
. Th
e sa
feg
uar
d m
easu
re r
esu
lted
in a
har
mo
niz
ed t
ota
l im
po
rt d
uty
of
50 p
erce
nt
for
refi
ned
pal
m o
il fr
om
all
ori
gin
s.
Sep
-19
Hea
lth
po
licy
Flu
id/s
olid
ed
ible
oils
D
ecla
red
, in
Pu
nja
b S
tate
, a la
rge
nu
mb
er o
f fl
uid
an
d s
olid
ed
ible
oil
bra
nd
s as
un
safe
fo
r h
um
an
con
sum
pti
on
, rem
ove
d t
hem
fro
m t
he
mar
ket
and
ban
ned
th
eir
pro
du
ctio
n a
nd
dis
trib
uti
on
un
til a
ll ap
plic
able
fo
od
sta
nd
ard
s ar
e m
et.
Ind
on
esia
/Th
e Ph
ilip
pin
esA
pr-
19B
ilate
ral,
sect
or-
spec
ific
trad
e in
itia
tive
sC
oco
nu
t p
rod
uct
sSi
gn
ed a
nu
mb
er o
f M
oU
s in
ten
ded
to
en
han
ce t
rad
e an
d in
vest
men
t b
etw
een
th
e tw
o c
ou
ntr
ies,
of
wh
ich
o
ne
pro
vid
es f
or
incr
ease
d p
urc
has
es o
f Ph
ilip
pin
e co
con
ut
oil
and
oth
er c
oco
nu
t p
rod
uct
s b
y In
do
nes
ian
co
mp
anie
s.
Ind
on
esia
Ap
r-19
Bio
fuel
po
licy
Bio
die
sel
Lau
nch
ed t
ech
nic
al t
rial
s w
ith
B10
0 (i
.e. p
ure
pal
m o
il-b
ased
bio
die
sel)
, in
a b
id t
o f
urt
her
incr
ease
do
mes
tic
up
take
of
pal
m o
il am
id in
crea
sin
gly
un
cert
ain
exp
ort
pro
spec
ts.
May
-19
to O
ct-
19
Exp
ort
po
licy
(var
iab
le
exp
ort
tax
)Pa
lm o
ilK
ept
the
cou
ntr
y’s
slid
ing
tax
on
cru
de
pal
m o
il ex
po
rts
at z
ero
, in
a b
id t
o s
tim
ula
te s
hip
men
ts a
nd
pre
ven
t d
om
esti
c st
ock
s fr
om
ris
ing
am
id h
isto
rica
lly lo
w w
orl
d m
arke
t p
rice
s. O
cto
ber
201
9 m
arke
d t
he
30th
mo
nth
in
su
cces
sio
n o
f ta
x-fr
ee p
alm
oil
exp
ort
s.
Jun
-19
Bio
fuel
po
licy
Bio
die
sel
Sup
po
rted
tes
ts o
f tr
ansp
ort
atio
n d
iese
l wit
h a
bio
-co
nte
nt
of
30 p
erce
nt,
in li
ne
wit
h r
enew
ed g
ove
rnm
ent
effo
rts
to d
evel
op
th
e d
om
esti
c m
arke
t fo
r p
alm
oil,
am
id u
nce
rtai
n e
xpo
rt p
rosp
ects
. Rep
ort
edly
, pla
ns
to e
xten
d t
he
on
go
ing
B30
tes
ts t
o t
rain
s, v
esse
ls a
nd
hea
vy m
ach
iner
y in
th
e m
inin
g in
du
stry
are
un
der
co
nsi
der
atio
n. T
he
Go
vern
men
t en
visa
ged
incr
easi
ng
th
e p
reva
ilin
g m
and
ato
ry b
len
din
g r
equ
irem
ent
of
20
per
cen
t to
30
per
cen
t in
202
0.
Jul-
19En
viro
nm
enta
l po
licy
Fore
st, p
eatl
and
Ru
led
th
at t
he
Go
vern
men
t w
as li
able
fo
r la
nd
-cle
arin
g f
ore
st fi
res
reco
rded
th
rou
gh
ou
t th
e co
un
try
in
2015
, an
d r
equ
este
d t
he
imp
lem
enta
tio
n o
f st
rin
gen
t m
easu
res
to p
reve
nt
fire
s fr
om
rec
urr
ing
– t
her
eby
com
ple
men
tin
g o
ng
oin
g p
rog
ram
mes
to
res
tore
dam
aged
pea
tlan
d a
nd
min
imiz
e h
arm
ful p
eatl
and
co
nve
rsio
n in
volv
ing
fire
s.
Au
g-1
9M
arke
t re
gu
lati
on
Palm
oil
Inst
ruct
ed r
etai
lers
to
rem
ove
fo
od
an
d c
osm
etic
pro
du
cts
carr
yin
g ‘p
alm
oil-
free
’ lab
els
fro
m t
hei
r sh
elve
s,
stat
ing
th
at t
he
term
’s u
se c
on
stit
ute
d m
isle
adin
g la
bel
ling
. Th
e m
ove
refl
ects
eff
ort
s to
pro
tect
th
e im
age
of
pal
m o
il an
d s
afeg
uar
d t
he
com
mo
dit
y’s
com
pet
itiv
enes
s.
Au
g-1
9B
iofu
el p
olic
yB
iod
iese
lA
nn
ou
nce
d p
lan
s to
incr
ease
th
e co
un
try’
s m
and
ato
ry b
iod
iese
l ble
nd
ing
req
uir
emen
t to
30
per
cen
t in
Ja
nu
ary
2020
, an
d t
o 5
0 p
erce
nt
tow
ard
s th
e en
d o
f th
at y
ear.
The
pla
nn
ed s
hif
t w
ou
ld h
elp
to
cu
rb t
he
nat
ion
’s e
ner
gy
imp
ort
s an
d b
oo
st d
om
esti
c p
alm
oil
up
take
.
Au
g-1
9En
viro
nm
enta
l po
licy
Fore
st, p
eatl
and
Co
nve
rted
th
e ex
isti
ng
tem
po
rary
mo
rato
riu
m o
n c
on
cess
ion
s to
cle
ar p
rim
ary
fore
st a
nd
co
nve
rt p
eatl
and
(f
or
any
typ
e o
f p
lan
tati
on
dev
elo
pm
ent
or
log
gin
g a
ctiv
ity)
into
a p
erm
anen
t b
an. A
cco
rdin
g t
o o
ffici
al
dat
a, t
he
8-ye
ar o
ld m
ora
tori
um
co
ntr
ibu
ted
sig
nifi
can
tly
to s
low
ing
def
ore
stat
ion
an
d p
eatl
and
co
nve
rsio
n
acro
ss t
he
cou
ntr
y.

Oilcro
ps
41FOOD OUTLOOKNOVEMBER 2019
CO
UN
TRY
DA
TEPO
LIC
Y D
OM
AIN
PRO
DU
CT
DES
CR
IPTI
ON
Ind
on
esia
Au
g-1
9La
nd
go
vern
ance
Oil
pal
m
Det
erm
ined
th
at a
larg
e p
art
of
the
cou
ntr
y’s
oil-
pal
m p
lan
tati
on
s ar
e in
bre
ach
of
a ra
ng
e o
f st
ate
reg
ula
tio
ns,
no
tab
ly r
egar
din
g c
ult
ivat
ion
per
mit
s, a
cces
s to
pro
tect
ed a
reas
, th
e al
loca
tio
n o
f la
nd
to
sm
allh
old
er f
arm
ers,
th
e ri
gh
ts o
f in
dig
eno
us
com
mu
nit
ies,
an
d n
atio
nal
su
stai
nab
ility
sta
nd
ard
s. T
o a
dd
ress
th
e is
sues
rai
sed
, th
e G
ove
rnm
ent
is c
on
sid
erin
g le
gal
act
ion
s, in
clu
din
g fi
nes
ag
ain
st n
on
-co
mp
lian
t co
mp
anie
s.
Ind
on
esia
/Mo
zam
biq
ue
Au
g-1
9B
ilate
ral,
sect
or-
spec
ific
trad
e in
itia
tive
sPa
lm o
ilSi
gn
ed a
pre
fere
nti
al t
rad
e ag
reem
ent
pro
mo
tin
g b
ilate
ral t
rad
e an
d p
rovi
din
g f
or
the
gra
du
al r
emo
val
of
imp
ort
du
ties
on
nu
mer
ou
s co
mm
od
itie
s. P
rod
uct
s fo
r w
hic
h M
oza
mb
iqu
e w
ill lo
wer
its
tari
ffs
incl
ud
e In
do
nes
ian
pal
m o
il.
Ind
on
esia
Sep
-19
Bio
fuel
po
licy
Bio
die
sel
Rel
ease
d t
he
resu
lts
of
road
tes
ts o
f d
iese
l co
nta
inin
g 3
0 p
erce
nt
of
pal
m o
il-b
ased
bio
die
sel s
ho
win
g t
hat
th
e b
iofu
el w
as s
afe
for
cars
. Co
nfi
rmed
pla
ns
to m
ake
B30
co
nsu
mp
tio
n m
and
ato
ry f
rom
Jan
uar
y 20
20, a
nd
al
loca
ted
sp
ecifi
c m
arke
tin
g q
uo
tas
to t
he
cou
ntr
y’s
oil
com
pan
ies.
Sep
-19
Exp
ort
po
licy
(var
iab
le
exp
ort
levy
)Pa
lm o
ilA
nn
ou
nce
d t
hat
– n
otw
ith
stan
din
g r
ecen
t im
wp
rove
men
ts in
mar
ket
pri
ces
– th
e co
un
try’
s va
riab
le e
xpo
rt
levy
on
fo
reig
n p
alm
oil
sale
s w
ou
ld r
emai
n s
usp
end
ed u
nti
l 1 J
anu
ary
2020
, wit
h a
vie
w t
o s
up
po
rtin
g t
he
cou
ntr
y’s
exp
ort
s an
d p
rote
ctin
g g
row
ers’
inco
mes
.
Sep
-19
Sect
or
dev
elo
pm
ent
mea
sure
sO
il p
alm
Mar
ked
ly lo
wer
ed t
he
Go
vern
men
t’s
ann
ual
tar
get
fo
r as
sist
ing
sm
allh
old
ers
in r
epla
cin
g a
ged
oil
pal
ms
wit
h m
ore
per
form
ant
vari
etie
s, c
itin
g d
iffi
cult
ies
face
d b
y sm
all g
row
ers
in p
rovi
ng
th
eir
elig
ibili
ty f
or
par
tici
pat
ing
in t
he
nat
ion
wid
e sc
hem
e. T
he
Go
vern
men
t’s
rep
lan
tin
g p
rog
ram
me
is a
imed
at
enh
anci
ng
p
rod
uct
ivit
y o
n e
xist
ing
est
ates
, wh
ile h
alti
ng
th
e ex
pan
sio
n o
f p
lan
tati
on
s.
Mal
aysi
a
Ap
r-19
Pro
du
ctio
n s
up
po
rtPa
lm o
ilPr
ovi
ded
fin
anci
al a
id t
o t
he
stat
e-o
wn
ed o
il-p
alm
ag
ency
Fed
eral
Lan
d D
evel
op
men
t A
uth
ori
ty (
FELD
A),
in
clu
din
g f
un
ds
to w
rite
off
deb
t in
tere
sts
for
FELD
A’s
sm
all s
ettl
ers,
ad
din
g t
hat
th
e ag
ency
had
bee
n
advi
sed
to
res
tru
ctu
re a
nd
del
ay p
art
of
its
deb
t.
Ap
r-19
Bio
fuel
po
licy
Bio
die
sel
Cla
imed
th
at p
alm
oil
is s
uit
able
fo
r d
irec
t b
len
din
g in
to a
viat
ion
fu
el, a
nd
th
eref
ore
ad
voca
ted
th
e o
il’s
app
rova
l by
the
Inte
rnat
ion
al C
ivil
Avi
atio
n O
rgan
izat
ion
(IC
AO
). C
urr
entl
y, IC
AO
on
ly a
ccep
ts p
alm
fat
ty
acid
dis
tilla
te a
s p
alm
oil-
bas
ed f
eed
sto
ck f
or
avia
tio
n b
iofu
el.
Ap
r-19
Exp
ort
po
licy
Palm
oil
Sup
po
rted
eff
ort
s b
y th
e co
un
try’
s p
alm
oil
ind
ust
ry t
o p
enet
rate
new
mar
kets
in S
ou
thea
st A
sia,
Afr
ica
and
Cen
tral
Asi
a, in
a b
id t
o c
ou
nte
r sl
ow
ing
gro
wth
in g
lob
al d
eman
d. R
epo
rted
ly, n
ew p
alm
oil-
bas
ed
cou
nte
rtra
de
dea
ls w
ere
sig
ned
wit
h t
he
Ru
ssia
n F
eder
atio
n, w
hile
sim
ilar
po
ssib
iliti
es w
ere
exp
lore
d in
C
hin
a, In
dia
, th
e Is
lam
ic R
epu
blic
of
Iran
, Pak
ista
n a
nd
Tu
rkey
.
Ap
r-19
Pro
du
ctio
n s
up
po
rtO
il p
alm
Esta
blis
hed
a s
oft
loan
fu
nd
tas
ked
wit
h a
ssis
tin
g s
mal
lho
lder
s in
rep
laci
ng
th
eir
un
pro
du
ctiv
e o
il p
alm
s w
ith
h
igh
er-y
ield
ing
pla
ntl
ets.
Th
e m
easu
re r
eflec
ts c
on
cern
s th
at t
he
pre
vaili
ng
dep
ress
ion
in p
alm
oil
pri
ces
cou
ld s
low
do
wn
ro
uti
ne
rep
lan
tin
g o
per
atio
ns
amo
ng
sm
allh
old
er p
rod
uce
rs.
Mal
aysi
a/C
hin
a(M
ain
lan
d)
Ap
r-19
to
Ju
n-
19
Bila
tera
l, se
cto
r- s
pec
ific
trad
e in
itia
tive
s Pa
lm o
il
Sig
ned
an
Mo
U w
her
eby
Ch
ina
wo
uld
ste
p u
p it
s p
urc
has
es o
f M
alay
sian
pal
m o
il an
d p
alm
oil-
bas
ed
pro
du
cts
ove
r th
e n
ext
5 ye
ars.
Th
e tw
o c
ou
ntr
ies
also
ag
reed
to
set
up
, in
Ch
ina,
an
avi
atio
n b
iofu
el p
lan
t,
as w
ell a
s to
dev
elo
p t
he
cou
ntr
y’s
pro
du
ctio
n o
f u
nsa
tura
ted
fat
. Fu
rth
erm
ore
, a C
hin
ese
stat
e-o
wn
ed
ente
rpri
se w
as c
ho
sen
to
res
um
e co
nst
ruct
ion
of
Mal
aysi
a’s
East
Co
ast
Rai
l Lin
k, a
lon
g w
ith
co
mm
itm
ents
b
y C
hin
a to
incr
ease
its
pu
rch
ases
of
Mal
aysi
an p
alm
oil.
Th
e tw
o c
ou
ntr
ies
also
ag
reed
to
sim
plif
y th
e p
roce
du
res
for
imp
ort
ing
Mal
aysi
an p
alm
oil
into
Ch
ina.

Ma
jor
po
licy
de
velo
pm
en
ts
42 FOOD OUTLOOKNOVEMBER 2019
CO
UN
TRY
DA
TEPO
LIC
Y D
OM
AIN
PRO
DU
CT
DES
CR
IPTI
ON
Mal
aysi
a
Jun
-19
Bio
fuel
po
licy
Bio
die
sel
Set
up
– in
vie
w o
f th
e in
crea
se in
th
e co
un
try’
s m
and
ato
ry b
iod
iese
l ble
nd
ing
rat
e fr
om
10
per
cen
t to
20
per
cen
t p
lan
ned
fo
r 20
20 –
an
inte
rmin
iste
rial
co
mm
itte
e ta
sked
wit
h m
on
ito
rin
g a
nd
en
suri
ng
th
at
do
mes
tic
cru
de
pal
m o
il p
rice
s re
mai
n s
tab
le, a
nd
th
at lo
cal b
iod
iese
l pri
ces
stay
co
mp
etit
ive.
Rep
ort
edly
, th
e co
mm
itte
e w
ou
ld lo
ok
into
th
e p
oss
ibili
ty o
f se
ttin
g u
p a
bio
die
sel s
tab
iliza
tio
n f
un
d.
Jun
-19
Man
dat
ory
cer
tifi
cati
on
(e
nvi
ron
men
tal p
olic
y)Pa
lm o
ilC
on
cern
ed a
bo
ut
del
ays
in im
ple
men
tati
on
of
Mal
aysi
a’s
man
dat
ory
su
stai
nab
le p
alm
oil
stan
dar
d,
ann
ou
nce
d a
dd
itio
nal
fin
anci
al in
cen
tive
s to
sp
eed
up
th
e ce
rtifi
cati
on
pro
cess
am
on
g s
mal
l- a
nd
med
ium
-si
zed
gro
wer
s.
Jun
-19
Exp
ort
po
licy
(var
iab
le
exp
ort
tax
)Pa
lm o
il
Exte
nd
ed t
he
susp
ensi
on
of
the
cou
ntr
y’s
slid
ing
tax
on
cru
de
pal
m o
il ex
po
rts
un
til 3
1 D
ecem
ber
201
9 –
irre
spec
tive
of
pri
ce d
evel
op
men
ts. F
irst
imp
lem
ente
d in
Sep
tem
ber
201
8 (f
ollo
win
g a
mar
ked
dec
line
in
the
com
mo
dit
y’s
wo
rld
mar
ket
pri
ce),
th
e su
spen
sio
n is
aim
ed a
t im
pro
vin
g t
he
exp
ort
co
mp
etit
iven
ess
of
Mal
aysi
an p
alm
oil
and
en
cou
rag
ing
sal
es t
o n
ew m
arke
ts, w
hile
hel
pin
g t
o lo
wer
th
e n
atio
n’s
sto
ckp
iles.
Sep
-19
Exp
ort
po
licy
Palm
ker
nel
oil
An
no
un
ced
a t
emp
ora
ry e
xpo
rt d
uty
exe
mp
tio
n f
or
cru
de
and
refi
ned
pal
m k
ern
el o
il (f
rom
1 O
cto
ber
201
9 u
nti
l 30
Jun
e 20
20),
to
sti
mu
late
exp
ort
s o
f th
e tw
o v
alu
e-ad
ded
do
wn
stre
am p
rod
uct
s.
MER
CO
SUR
/Eu
rop
ean
U
nio
nJu
n-1
9C
om
pre
hen
sive
tra
de
agre
emen
tsA
ll cr
op
s, li
vest
ock
pro
du
cts
The
EU a
nd
th
e M
ERC
OSU
R b
loc
reac
hed
ag
reem
ent
in p
rin
cip
le o
n a
co
mp
reh
ensi
ve f
ree-
trad
e tr
eaty
. Th
e ag
reem
ent
wo
uld
pro
gre
ssiv
ely
enh
ance
mar
ket
acce
ss f
or
go
od
s an
d s
ervi
ces,
wh
ile p
rom
oti
ng
co
op
erat
ion
o
n c
ust
om
s is
sues
, fo
od
saf
ety
and
su
stai
nab
le t
rad
e. N
ext
step
s in
clu
de
the
trea
ty’s
leg
al r
evis
ion
an
d
par
liam
enta
ry r
atifi
cati
on
in a
ll p
arti
cip
atin
g c
ou
ntr
ies.
Mo
zam
biq
ue/
Ind
on
esia
Au
g-1
9B
ilate
ral,
sect
or-
spec
ific
trad
e in
itia
tive
sPa
lm o
ilSi
gn
ed a
pre
fere
nti
al t
rad
e ag
reem
ent
pro
mo
tin
g b
ilate
ral t
rad
e an
d p
rovi
din
g f
or
the
gra
du
al r
emo
val
of
imp
ort
du
ties
on
nu
mer
ou
s co
mm
od
itie
s. P
rod
uct
s fo
r w
hic
h M
oza
mb
iqu
e w
ill lo
wer
its
tari
ffs
incl
ud
e In
do
nes
ian
pal
m o
il.
Nig
eria
Jun
-19
Sect
or
dev
elo
pm
ent
mea
sure
sO
il p
alm
An
no
un
ced
a c
om
pre
hen
sive
su
pp
ort
pac
kag
e ai
med
at
bo
ost
ing
do
mes
tic
pal
m o
il p
rod
uct
ion
an
d e
nd
ing
th
e n
atio
n’s
dep
end
ence
on
imp
ort
ed p
alm
oil.
Sp
ann
ing
un
til 2
027,
th
e p
acka
ge
wo
uld
incl
ud
e su
bsi
diz
ed
loan
s to
gro
wer
s, e
xten
ded
tax
bre
aks
for
oil-
pal
m p
lan
tati
on
s an
d p
roce
sso
rs, r
emo
val o
f ta
riff
reb
ates
o
n r
efin
ed p
alm
oil
imp
ort
s, a
nd
res
tric
tio
ns
on
cru
de
and
refi
ned
pal
m o
il im
po
rts
by
loca
l cru
sher
s an
d
refi
ner
s.
No
rway
Jun
-19
Bio
fuel
po
licy
Bio
die
sel
Rep
ort
ed t
hat
, in
201
8, d
om
esti
c b
iofu
el s
ales
dec
reas
ed b
y 25
per
cen
t co
mp
ared
wit
h 2
017,
pri
mar
ily
refl
ecti
ng
a s
ign
ifica
nt
dro
p in
dem
and
fo
r p
alm
oil-
bas
ed b
iod
iese
l – a
dev
elo
pm
ent
attr
ibu
ted
to
a 2
017
po
licy
chan
ge
that
ban
ned
pu
blic
pro
cure
men
t an
d u
se o
f b
iofu
el f
eed
sto
ck c
arry
ing
hig
h IL
UC
ris
ks.
Paci
fic
isla
nd
nat
ion
s
Au
g-1
9Se
cto
r d
evel
op
men
t m
easu
res
Co
con
ut
pal
m
Join
ed f
orc
es –
un
der
th
e au
spic
es o
f th
e Pa
cifi
c C
om
mu
nit
y an
d t
he
Au
stra
lian
Cen
tre
for
Inte
rnat
ion
al
Ag
ricu
ltu
ral R
esea
rch
– t
o im
ple
men
t a
5-ye
ar p
roje
ct f
or
the
safe
gu
ard
an
d d
eplo
ymen
t o
f co
con
ut
div
ersi
ty in
su
pp
ort
of
coco
nu
t-b
ased
live
liho
od
s ac
ross
th
e Pa
cifi
c re
gio
n.
Paki
stan
Oct
-19
Sect
or
dev
elo
pm
ent
mea
sure
sO
live
tree
An
no
un
ced
an
am
bit
iou
s o
live
tree
dev
elo
pm
ent
pro
gra
mm
e, t
arg
etin
g in
par
ticu
lar
smal
lho
lder
far
mer
s in
th
e co
un
try’
s d
rou
gh
t-h
it r
egio
ns,
an
d in
volv
ing
ad
van
ced
rai
nw
ater
har
vest
ing
an
d ir
rig
atio
n t
ech
niq
ues
.
The
Phili
pp
ines
/Ind
on
esia
Ap
r-19
Bila
tera
l, se
cto
r-sp
ecifi
c tr
ade
init
iati
ves
Co
con
ut
pro
du
cts
Sig
ned
a n
um
ber
of
Mo
Us
inte
nd
ed t
o e
nh
ance
tra
de
and
inve
stm
ent
bet
wee
n t
he
two
co
un
trie
s, o
f w
hic
h
on
e p
rovi
des
fo
r in
crea
sed
pu
rch
ases
of
Phili
pp
ine
coco
nu
t o
il an
d o
ther
co
con
ut
pro
du
cts
by
Ind
on
esia
n
com
pan
ies.

Oilcro
ps
43FOOD OUTLOOKNOVEMBER 2019
CO
UN
TRY
DA
TEPO
LIC
Y D
OM
AIN
PRO
DU
CT
DES
CR
IPTI
ON
The
Phili
pp
ines
Au
g-1
9Se
cto
r d
evel
op
men
t m
easu
res
Co
con
ut
pal
mPl
ans
to s
up
po
rt t
he
exp
ansi
on
in t
he
nat
ion
’s a
rea
pla
nte
d w
ith
co
con
ut
tree
s, f
ocu
sin
g o
n c
oas
tal a
reas
in
th
e co
un
try’
s n
ort
her
n p
rovi
nce
s an
d o
n p
ub
lic la
nd
s. T
he
Go
vern
men
t’s
road
map
fo
r th
e se
cto
r al
so
envi
sag
es c
om
pre
hen
sive
R&
D a
ctiv
itie
s an
d p
rom
oti
on
of
pro
du
ct d
iver
sifi
cati
on
.
Ru
ssia
n F
eder
atio
n/C
hin
a (M
ain
lan
d)
Jun
-19
Bila
tera
l, se
cto
r-sp
ecifi
c tr
ade
init
iati
ves
Sele
cted
oils
eed
s, m
eals
Sig
ned
a b
ilate
ral p
roto
col o
n p
hyt
osa
nit
ary
stan
dar
ds
aim
ed a
t fa
cilit
atin
g e
xpo
rts
of
a n
um
ber
of
pro
du
cts
– in
clu
din
g s
oyb
ean
s, r
apes
eed
an
d s
un
flo
wer
see
d m
eal –
fro
m t
he
Ru
ssia
n F
eder
atio
n t
o C
hin
a.
Ru
ssia
n F
eder
atio
nJu
l-19
Tax
po
licy
Palm
oil
An
no
un
ced
th
at, f
rom
1 O
cto
ber
201
9, p
alm
oil
sale
s w
ou
ld b
e su
bje
ct t
o t
he
reg
ula
r V
AT
rate
of
20 p
erce
nt,
th
us
end
ing
th
e ex
isti
ng
pre
fere
nti
al t
axat
ion
at
10 p
erce
nt
– a
mea
sure
aim
ed a
t su
pp
ort
ing
th
e co
un
try’
s d
airy
ind
ust
ry, w
hic
h h
as s
een
fo
od
man
ufa
ctu
rers
’ dem
and
fo
r it
s p
rod
uct
s d
eclin
e as
su
pp
lies
of
low
-pri
ced
im
po
rted
pal
m o
il ro
se.
Sin
gap
ore
May
-19
Foo
d s
afet
y m
easu
res
Tran
s fa
tty
acid
An
no
un
ced
a b
an, f
rom
Ju
ne
2021
, on
par
tial
ly h
ydro
gen
ated
oils
(PH
Os)
as
ing
red
ien
ts in
all
foo
d p
rod
uct
s so
ld in
th
e co
un
try
– w
het
her
man
ufa
ctu
red
loca
lly o
r im
po
rted
. Gen
erat
ed w
hen
pla
nt
oils
are
pro
cess
ed,
PHO
s re
pre
sen
t th
e p
rim
ary
die
tary
so
urc
e o
f h
arm
ful t
ran
sfat
s in
fo
od
pro
du
cts.
Spai
n
Jun
-19
Mar
ket
reg
ula
tio
nO
live
oil
Sup
po
rted
a p
rop
osa
l by
the
cou
ntr
y’s
oliv
e o
il in
du
stry
to
sel
f-re
gu
late
th
e d
om
esti
c o
live
oil
mar
ket.
A
imed
at
stab
ilizi
ng
su
pp
lies
and
pri
ces
at n
atio
nal
leve
l, th
e p
rop
ose
d m
ech
anis
m w
ou
ld in
clu
de
mar
ket
inte
rven
tio
ns
wh
en s
urp
lus/
sho
rtag
e co
nd
itio
ns
dev
elo
p.
Oct
-19
Sect
or
dev
elo
pm
ent
mea
sure
s O
live
tree
Intr
od
uce
d a
ces
s to
be
colle
cted
fro
m p
rod
uce
rs a
nd
op
erat
ors
acr
oss
th
e o
live
oil
sect
or,
wit
h t
he
ob
ject
ive
of
fin
anci
ng
pro
mo
tio
nal
act
ivit
ies,
alo
ng
wit
h m
arke
t st
ud
ies
and
R&
D p
rog
ram
mes
fo
cusi
ng
on
te
chn
olo
gic
al in
no
vati
on
. Th
e in
itia
tive
has
bee
n t
rig
ger
ed b
y a
pro
lon
ged
dec
line
in p
rice
s.
Sri L
anka
Feb
-19
Foo
d s
afet
y m
easu
res
Co
con
ut
oil
Info
rmed
th
at a
ll co
con
ut
oil
sold
in t
he
do
mes
tic
coo
kin
g o
il m
arke
t w
ou
ld b
e su
bje
ct t
o s
tric
t q
ual
ity
con
tro
ls, a
s w
ell a
s m
and
ato
ry c
erti
fica
tio
n a
nd
lab
ellin
g, w
ith
a v
iew
to
co
mb
atin
g p
rod
uct
ad
ult
erat
ion
an
d r
edu
cin
g in
toxi
cati
on
ris
ks.
Thai
lan
dM
ay-1
9B
iofu
el p
olic
yB
iod
iese
l
Pres
ided
ove
r th
e co
mm
erci
al la
un
ch o
f B
10 a
nd
B20
(i.e
. tra
nsp
ort
die
sel c
on
tain
ing
res
pec
tive
ly 1
0 an
d
20 p
erce
nt
of
pal
m o
il m
eth
yl e
ster
), a
nd
an
no
un
ced
pla
ns
to r
aise
th
e co
un
try’
s m
and
ato
ry b
len
din
g r
ate
fro
m t
he
pre
vaili
ng
7 p
erce
nt
to 1
0 p
erce
nt.
Th
e en
visa
ged
sh
ift
is a
imed
at
abso
rbin
g s
urp
lus
pal
m o
il p
rod
uct
ion
, th
ereb
y su
pp
ort
ing
pri
ces
of
fres
h p
alm
nu
ts a
nd
cru
de
pal
m o
il.
Thai
lan
dA
ug
-19
Pro
du
ctio
n s
up
po
rtO
il p
alm
Ap
pro
ved
a p
rice
su
pp
ort
pac
kag
e to
ass
ist
oil-
pal
m g
row
ers
affe
cted
by
dep
ress
ed f
arm
gat
e p
rice
s. U
nd
er
the
sch
eme,
reg
iste
red
oil-
pal
m f
arm
ers
wo
uld
rec
eive
cas
h c
om
pen
sati
on
s w
hen
th
e m
arke
t p
rice
fo
r fr
esh
p
alm
fru
it d
rop
s b
elo
w a
gu
aran
teed
leve
l of
THB
4 p
er k
g (
USD
132
per
to
nn
e).
Thai
lan
d/C
hin
a(M
ain
lan
d)
Sep
-19
Bila
tera
l, se
cto
r-sp
ecifi
c tr
ade
init
iati
ves
Palm
ker
nel
exp
elle
r Si
gn
ed a
n M
oU
allo
win
g C
hin
a to
pro
mo
te t
he
imp
ort
of
pal
m k
ern
el e
xpel
ler
(to
be
use
d a
s an
imal
fee
d)
fro
m T
hai
lan
d. T
he
init
iati
ve c
om
ple
men
ts o
ther
eff
ort
s b
y C
hin
a to
div
ersi
fy it
s d
om
esti
c fe
ed s
up
ply
ch
ain
.
Thai
lan
d
Oct
-19
Bio
fuel
po
licy
Bio
die
sel
Intr
od
uce
d s
ub
sid
ies
for
the
pro
du
ctio
n a
nd
sal
e o
f d
iese
l co
nta
inin
g 1
0 o
r 20
per
cen
t o
f p
alm
oil-
bas
ed
bio
die
sel –
in s
up
po
rt o
f th
e p
lan
ned
sh
ift
to m
and
ato
ry s
ales
of
10 p
erce
nt-
ble
nd
s fr
om
1 J
anu
ary
2020
.

Ma
jor
po
licy
de
velo
pm
en
ts
44 FOOD OUTLOOKNOVEMBER 2019
CO
UN
TRY
DA
TEPO
LIC
Y D
OM
AIN
PRO
DU
CT
DES
CR
IPTI
ON
Turk
eyJu
l-19
Imp
ort
po
licy
Sun
flo
wer
see
dR
aise
d t
he
cou
ntr
y’s
imp
ort
tar
iff
for
sun
flo
wer
see
d t
o 2
0 p
erce
nt.
Th
e d
uty
had
bee
n t
emp
ora
rily
low
ered
to
13
per
cen
t in
Ju
ne
2018
, wit
h a
vie
w t
o s
up
po
rtin
g d
om
esti
c cr
ush
op
erat
ion
s. T
he
hig
her
du
ty is
set
to
re
mai
n in
pla
ce u
nti
l en
d-J
anu
ary
2020
.
Un
ited
Sta
tes
of
Am
eric
a
May
-19
Pro
du
ctio
n s
up
po
rt
(tra
de
mit
igat
ion
m
easu
re)
Gra
ins,
oils
eed
s
An
no
un
ced
, fo
r th
e se
con
d y
ear
in s
ucc
essi
on
, an
aid
pac
kag
e fo
r fa
rmer
s af
fect
ed b
y m
arke
t d
isru
pti
on
s d
ue
to t
arif
fs im
po
sed
by
trad
ing
par
tner
s. T
he
pac
kag
e w
ou
ld c
on
sist
of
a M
arke
t Fa
cilit
atio
n P
rog
ram
(p
rovi
din
g c
ash
pay
men
ts t
o e
ligib
le f
arm
ers)
an
d w
ou
ld b
e co
mp
lem
ente
d b
y a
Foo
d P
urc
has
e an
d
Dis
trib
uti
on
Pro
gra
m (
task
ed w
ith
pu
rch
asin
g s
urp
lus
com
mo
dit
ies
for
dis
trib
uti
on
th
rou
gh
exi
stin
g s
oci
al
assi
stan
ce s
chem
es),
an
d a
n A
gri
cult
ura
l Tra
de
Pro
mo
tio
n P
rog
ram
(to
pro
mo
te t
he
dev
elo
pm
ent
of
new
ex
po
rt m
arke
ts o
n b
ehal
f o
f p
rod
uce
rs).
May
-19
Pest
icid
e re
gu
lati
on
Gly
ph
osa
teR
epo
rted
a t
hir
d c
on
secu
tive
co
urt
ver
dic
t ag
ain
st t
he
man
ufa
ctu
rer
of
Ro
un
du
p, t
he
gly
ph
osa
te-b
ased
h
erb
icid
e al
leg
ed t
o c
ause
can
cer.
Acc
ord
ing
to
th
e ju
ry, t
he
her
bic
ide
was
def
ecti
vely
des
ign
ed a
nd
th
e m
anu
fact
ure
r ac
ted
neg
ligen
tly
and
fai
led
to
war
n c
on
sum
ers
abo
ut
po
ssib
le c
ance
r ri
sks.
Un
ited
Sta
tes
of
Am
eric
a/C
hin
a(M
ain
lan
d)
May
-19
to O
ct-
19
Co
mp
reh
ensi
ve t
rad
e n
ego
tiat
ion
s So
ybea
ns,
oth
er o
ilcro
ps
and
d
eriv
ed p
rod
uct
s
Mo
ved
fo
rwar
d d
isco
nti
nu
ou
sly
wit
h t
rad
e ta
lks
that
co
mm
ence
d in
mid
-201
8. In
May
, fo
llow
ing
a
tem
po
rary
hal
t in
neg
oti
atio
ns,
th
e tw
o c
ou
ntr
ies
intr
od
uce
d a
dd
itio
nal
tra
de
mea
sure
s af
fect
ing
th
eir
resp
ecti
ve im
po
rts:
wh
ile t
he
US
rais
ed im
po
rt t
arif
fs o
n U
SD 2
00 b
illio
n w
ort
h o
f C
hin
ese
go
od
s fr
om
10
per
cen
t to
25
per
cen
t, C
hin
a in
crea
sed
tax
atio
n o
n U
S im
po
rts
wo
rth
USD
60
bill
ion
to
10–
25 p
erce
nt.
In
bo
th c
ases
, co
mm
od
itie
s af
fect
ed in
clu
de
a n
um
ber
of
oilc
rop
s an
d d
eriv
ed p
rod
uct
s, t
ran
sact
ion
s o
f w
hic
h, h
ow
ever
, hav
e b
een
mo
des
t in
rec
ent
year
s. F
ollo
win
g a
tem
po
rary
tru
ce, i
n A
ug
ust
, neg
oti
atio
ns
stal
led
ag
ain
, lea
din
g b
oth
co
un
trie
s to
an
no
un
ce im
ple
men
tati
on
of
add
itio
nal
ret
alia
tory
tar
iffs
on
eac
h
oth
er’s
exp
ort
s fr
om
Sep
tem
ber
. In
th
e ca
se o
f C
hin
a, t
he
list
of
com
mo
dit
ies
affe
cted
wo
uld
incl
ud
e U
S-o
rig
in s
oyb
ean
s, w
hic
h w
ou
ld b
ear
add
itio
nal
tar
iffs
of
5–10
per
cen
t. W
hen
tra
de
talk
s re
sum
ed in
mid
-Se
pte
mb
er, t
he
US
ple
dg
ed t
o p
ost
po
ne
an in
crea
se in
ret
alia
tory
tar
iffs
sch
edu
led
fo
r O
cto
ber
, wh
ile C
hin
a co
mm
itte
d t
o r
esu
me
pu
rch
ases
of
US
agri
cult
ura
l go
od
s, in
clu
din
g s
oyb
ean
s. M
ore
sp
ecifi
cally
, Ch
ina’
s tr
ade
auth
ori
ties
su
cces
sive
ly a
lloca
ted
sp
ecia
l im
po
rt q
uo
tas
for
soyb
ean
s –
com
pri
sin
g w
aive
rs o
f th
e re
leva
nt
reta
liato
ry t
arif
fs –
to
a n
um
ber
of
stat
e-ru
n, p
riva
te a
s w
ell a
s fo
reig
n-o
wn
ed b
usi
nes
ses.
Acc
ord
ing
to
th
e U
SDA
, by
mid
-Oct
ob
er, s
oyb
ean
sal
es t
o C
hin
a (f
or
del
iver
y in
th
e 20
19/2
0 m
arke
tin
g y
ear)
had
rea
ched
5.7
m
illio
n t
on
nes
, wh
ich
co
mp
ares
wit
h 1
.0 m
illio
n t
on
nes
a y
ear
earl
ier.
Ho
wev
er, w
ith
co
mp
reh
ensi
ve t
rad
e n
ego
tiat
ion
s st
ill u
nd
er w
ay, C
hin
a re
frai
ned
fro
m c
om
mit
tin
g t
o a
sp
ecifi
c, t
ime-
bo
un
d v
olu
me
of
US-
ori
gin
so
ybea
n p
urc
has
es.
Un
ited
Sta
tes
of
Am
eric
a
Jun
-19
Farm
er r
elie
f m
easu
res
Gra
ins,
oils
eed
sLa
un
ched
th
e D
isas
ter
Rel
ief
Act
to
co
mp
ensa
te f
arm
ers
imp
acte
d b
y n
atu
ral d
isas
ters
th
rou
gh
ou
t 20
18 a
nd
20
19.
Jun
-19
GM
O p
olic
yG
M c
rop
sD
irec
ted
co
nce
rned
fed
eral
ag
enci
es t
o e
ase
rule
s fo
r ap
pro
vin
g G
M c
rop
s an
d r
elat
ed a
gri
cult
ura
l b
iote
chn
olo
gy.
Th
e m
od
ified
rev
iew
pro
cess
aim
s at
avo
idin
g d
elay
s, r
edu
cin
g d
evel
op
er c
ost
s, e
nab
ling
p
red
icta
bili
ty a
nd
fac
ilita
tin
g t
he
dev
elo
pm
ent
of
GM
pla
nts
th
at d
o n
ot
po
se p
lan
t p
est
risk
s.
Jul-
19B
iofu
el p
olic
yB
iod
iese
lPu
blis
hed
dra
ft m
inim
um
am
ou
nts
of
ren
ewab
le f
uel
s th
at w
ou
ld n
eed
to
be
sup
plie
d t
o t
he
mar
ket
in
2020
, as
wel
l as
dra
ft b
len
din
g o
blig
atio
ns
for
bio
mas
s-b
ased
bio
die
sel i
n 2
021.
Jul-
19Im
po
rt p
olic
y/b
iofu
el
po
licy
Bio
die
sel
Prel
imin
arily
det
erm
ined
th
e fo
llow
ing
wit
h r
esp
ect
to t
he
anti
-du
mp
ing
an
d c
ou
nte
rvai
ling
du
ties
ap
plie
d
to im
po
rts
of
bio
die
sel f
rom
Arg
enti
na:
i)
that
rec
ent
chan
ges
in A
rgen
tin
a’s
exp
ort
tax
reg
ime
had
led
to
a
cutb
ack
in t
he
cou
ntr
y’s
sub
sid
ies,
hen
ce w
arra
nti
ng
a r
edu
ctio
n in
th
e U
S co
un
terv
ailin
g r
ates
; an
d ii
) th
at
circ
um
stan
ces
war
ran
tin
g c
han
ges
did
no
t ex
ist
in r
esp
ect
of
the
US
anti
-du
mp
ing
du
ties
.

Oilcro
ps
45FOOD OUTLOOKNOVEMBER 2019
CO
UN
TRY
DA
TEPO
LIC
Y D
OM
AIN
PRO
DU
CT
DES
CR
IPTI
ON
Un
ited
Sta
tes
of
Am
eric
a
Au
g-1
9G
MO
po
licy
GM
cro
ps
Au
tho
rize
d t
he
com
mer
cial
izat
ion
of
a ra
pes
eed
var
iety
ric
h in
om
ega-
3 fa
tty
acid
s an
d a
dro
ug
ht-
tole
ran
t so
ybea
n v
arie
ty d
evel
op
ed in
Arg
enti
na.
Au
g-1
9Fa
rmer
rel
ief
mea
sure
sG
rain
s, o
ilsee
ds
Rel
ease
d t
he
Fam
ily F
arm
er R
elie
f A
ct o
f 20
19, w
ith
a v
iew
to
hel
pin
g t
o a
void
mas
s liq
uid
atio
ns
and
fu
rth
er
con
solid
atio
n in
th
e ag
ricu
ltu
re s
ecto
r, as
far
mer
s ar
e fa
ced
wit
h d
eclin
es in
net
far
m in
com
es a
nd
an
in
crea
sin
gly
un
pre
dic
tab
le t
rad
e en
viro
nm
ent.
Au
g-1
9 to
Sep
-19
Farm
er r
elie
f m
easu
res
Gra
ins,
oils
eed
s
Dec
ided
to
def
er t
he
accr
ual
of
inte
rest
on
far
mer
s’ in
sura
nce
pre
miu
ms
for
the
spri
ng
201
9 cr
op
yea
r. Th
e m
easu
re s
eeks
to
eas
e th
e co
nse
qu
ence
s o
f d
elay
ed o
r p
reve
nte
d p
lan
tin
gs,
as
wel
l as
red
uce
d c
rop
yie
lds
cau
sed
by
seve
re fl
oo
din
g o
r ex
trem
e d
rou
gh
t co
nd
itio
ns
in 2
019.
Fu
rth
erm
ore
, to
p-u
p p
aym
ents
hav
e b
een
g
ran
ted
to
pro
du
cers
par
tici
pat
ing
in f
eder
al c
rop
insu
ran
ce, w
ho
se p
lan
tin
gs
wer
e p
reve
nte
d b
y fl
oo
din
g
and
exc
ess
mo
istu
re.
Sep
-19
Mar
ket
reg
ula
tio
n/f
oo
d
stan
dar
ds
Oliv
e o
ilA
nn
ou
nce
d n
ew m
and
ato
ry la
bel
ling
req
uir
emen
ts f
or
larg
e-sc
ale
pro
du
cers
in t
he
stat
e o
f C
alif
orn
ia. T
he
new
lab
els
wo
uld
be
aim
ed a
t b
ette
r in
form
ing
co
nsu
mer
s ab
ou
t th
e p
rove
nan
ce a
nd
qu
alit
y o
f o
live
oil.
Oct
-19
Sect
or
dev
elo
pm
ent
mea
sure
sR
apes
eed
Ap
pro
ved
fu
nd
ing
fo
r a
rese
arch
an
d e
xten
sio
n p
roje
ct a
imed
at
enh
anci
ng
rap
esee
d p
rod
uct
ion
an
d
pro
fita
bili
ty in
th
e n
ort
h-c
entr
al p
art
of
the
cou
ntr
y.
Oct
-19
Bio
fuel
po
licy
Bio
fuel
Pr
op
ose
d a
nd
so
ug
ht
com
men
ts o
n a
dju
stm
ents
to
th
e w
ay t
hat
an
nu
al r
enew
able
fu
el b
len
din
g o
blig
atio
ns
are
det
erm
ined
in t
he
futu
re. M
ore
sp
ecifi
cally
, co
mm
ents
wer
e in
vite
d o
n a
pro
po
sed
mec
han
ism
to
off
set
smal
l refi
ner
y ex
emp
tio
ns
wh
en d
eter
min
ing
fu
ture
ble
nd
ing
ob
ligat
ion
s.
Oct
-19
Imp
ort
po
licy
(tra
de
dis
pu
te)
Oliv
e o
il
Pub
lish
ed a
list
of
pro
du
cts
imp
ort
ed f
rom
th
e Eu
rop
ean
Un
ion
th
at w
ou
ld a
ttra
ct c
orr
ecti
ve t
arif
fs a
s o
f 18
O
cto
ber
201
9, in
ret
alia
tio
n f
or
sub
sid
ies
– ru
led
ille
git
imat
e b
y th
e W
TO –
th
at t
he
EU h
ad p
rovi
ded
to
its
avia
tio
n in
du
stry
. Th
e lis
t in
clu
des
vir
gin
an
d n
on
-vir
gin
oliv
e o
il p
rod
uce
d in
Sp
ain
an
d s
old
in c
on
tain
ers
of
up
to
18
kg.
Vie
t N
am/E
uro
pea
n
Un
ion
Jun
-19
Co
mp
reh
ensi
ve t
rad
e ag
reem
ents
Sele
cted
gra
ins,
oils
eed
sV
iet
Nam
an
d t
he
EU s
ign
ed a
Fre
e Tr
ade
Ag
reem
ent
that
wo
uld
lift
tar
iffs
on
99
per
cen
t o
f g
oo
ds
trad
ed,
incl
ud
ing
wh
eat,
ric
e, m
aize
an
d s
oyb
ean
pro
du
cts.
Th
e d
eal w
ill c
om
e in
to f
orc
e o
nce
it is
rat
ified
by
law
mak
ers
on
bo
th s
ides
.
Vie
t N
am
Sep
-19
GM
O p
olic
ies
Soyb
ean
sA
pp
rove
d t
he
imp
ort
atio
n o
f tw
o n
ew G
M h
erb
icid
e-to
lera
nt
soyb
ean
eve
nts
, th
ereb
y p
rovi
din
g a
ssu
ran
ce
to p
rod
uce
rs in
exp
ort
ing
co
un
trie
s th
at t
rad
e in
th
ese
vari
etie
s ca
n c
on
tin
ue.
Inte
rgo
vern
men
tal
Jul-
19Fo
od
sta
nd
ard
sV
eget
able
oils
The
WH
O/F
AO
Co
dex
Alim
enta
riu
s C
om
mis
sio
n a
pp
rove
d a
nu
mb
er o
f re
visi
on
s to
its
Stan
dar
d f
or
Nam
ed V
eget
able
Oils
, co
nce
rnin
g, i
nte
r al
ia, h
igh
-ole
ic p
alm
oil,
vir
gin
pal
m o
il, c
rud
e p
alm
ker
nel
oil,
p
alm
su
per
ole
in, a
nd
flax
/lin
seed
oil.
Mo
reo
ver,
the
bo
dy
issu
ed a
co
de
of
pra
ctic
e fo
r th
e re
du
ctio
n o
f 3-
mo
no
chlo
rop
rop
aned
iol (
3-M
CPD
est
ers)
an
d g
lyci
dyl
est
ers
(GEs
) in
refi
ned
oils
an
d f
oo
d p
rod
uct
s m
ade
wit
h r
efin
ed o
ils.
Au
g-1
9Pe
stic
ide
reg
ula
tio
nX
ylel
la f
asti
dio
sa
FAO
su
pp
ort
ed p
reve
nti
ve m
easu
res
in A
lger
ia, E
gyp
t, L
eban
on
, Lib
ya, M
oro
cco
an
d T
un
isia
to
mit
igat
e th
e p
ote
nti
al t
hre
at o
f th
e xy
lella
fas
tid
iosa
dis
ease
. Ap
ply
ing
mo
der
n d
etec
tio
n t
ech
no
log
ies,
co
un
trie
s re
ceiv
ed a
ssis
tan
ce in
tes
tin
g im
po
rted
pla
nti
ng
mat
eria
ls in
a m
ore
acc
ura
te, e
con
om
ical
an
d s
imp
lified
w
ay. F
urt
her
mo
re, i
nd
ust
ry s
take
ho
lder
s re
ceiv
ed t
rain
ing
on
imp
rove
d s
urv
eilla
nce
, dia
gn
osi
s an
d
man
agem
ent
pra
ctic
es, w
hile
loca
l au
tho
riti
es w
ere
pro
vid
ed w
ith
su
pp
ort
reg
ard
ing
ph
yto
san
itar
y le
gis
lati
on
, po
rt in
spec
tio
n r
ule
s an
d t
he
form
ula
tio
n o
f co
nti
ng
ency
pla
ns.
* A
det
aile
d de
scrip
tion
of m
ajor
pol
icy
deve
lopm
ents
sta
rtin
g in
Jan
uary
201
1 is
ava
ilabl
e at
:
http
://w
ww
.fao
.org
/eco
nom
ic/e
st/e
st-c
omm
oditi
es/c
omm
odity
-pol
icy-
arch
ive/
en/?
grou
pAN
Dco
mm
odity
=O
ilsee
ds,%
20oi
ls%
20an
d%20
mea
ls

Ma
jor
po
licy
de
velo
pm
en
ts
46 FOOD OUTLOOKNOVEMBER 2019
MEA
T:
MA
JOR
POLI
CY D
EVEL
OPM
ENTS
: MID
-APR
IL T
O M
ID-O
CTO
BER
2019
*
CO
UN
TRY
DA
TEPR
OD
UC
TPO
LIC
Y IN
STR
UM
ENT
DES
CR
IPTI
ON
Arg
enti
na
Ap
r-19
Pig
mea
t Tr
ade
agre
emen
tA
nn
ou
nce
d a
dea
l wit
h C
hin
ese
auth
ori
ties
to
exp
ort
pig
mea
t to
Ch
ina
fro
m 2
5 o
f th
e co
un
try'
s m
eatp
acki
ng
p
lan
ts.
Sep
-19
All
Trad
e ag
reem
ent
An
no
un
ced
th
at, a
fter
a fi
rst
ship
men
t in
Ju
ne,
15
Arg
enti
nia
n m
eat
pro
cess
ing
pla
nts
wer
e cl
eare
d t
o s
up
ply
b
ovi
ne
and
po
ult
ry m
eat
to C
hin
a.
Bra
zil
Sep
-19
All
Mar
ket
acce
ssA
nn
ou
nce
d t
hat
25
mea
t p
roce
ssin
g p
lan
ts in
th
e co
un
try
hav
e re
ceiv
ed a
uth
ori
zati
on
to
exp
ort
to
Ch
ina.
Can
ada
May
-19
All
Tari
ff li
fted
Lift
ed t
arif
f o
n U
S b
ovi
ne
and
pig
mea
t, u
nd
er a
dea
l sig
ned
wit
h t
he
Un
ited
Sta
tes
to r
emo
ve it
s ta
riff
s o
n s
teel
an
d a
lum
iniu
m im
po
rts
fro
m C
anad
a.
Jun
-19
All
Exp
ort
ban
Ag
reed
to
su
spen
d p
erm
its
for
mea
t ex
po
rts
to C
hin
a af
ter
a re
qu
est
fro
m C
hin
ese
auth
ori
ties
du
e to
a d
etec
ted
ca
se o
f ra
cto
pam
ine,
a f
eed
ad
dit
ive
ban
ned
in C
hin
a.
Ch
ina
(Mai
nla
nd
)
Ap
r-19
Pig
mea
t Im
po
rt b
anA
nn
ou
nce
d a
n im
po
rt b
an o
n m
eat
pro
du
cts
der
ived
fro
m p
igs
and
wild
bo
ars
fro
m C
amb
od
ia, a
fter
det
ecti
on
of
a ca
se o
f A
fric
an S
win
e Fe
ver
(ASF
).
Jun
-19
Pig
mea
t Im
po
rt b
anA
nn
ou
nce
d a
n im
po
rt b
an o
n m
eat
pro
du
cts
der
ived
fro
m p
igs
and
wild
bo
ars
fro
m t
he
Lao
Peo
ple
’s D
emo
crat
ic
Rep
ub
lic d
ue
to A
SF o
utb
reak
s re
po
rted
by
the
cou
ntr
y.
Au
g-1
9Pi
g m
eat
Imp
ort
ban
An
no
un
ced
an
imp
ort
ban
on
mea
t p
rod
uct
s d
eriv
ed f
rom
pig
s an
d w
ild b
oar
s fr
om
Mya
nm
ar d
ue
to c
on
cern
s o
ver
ASF
.
Au
g-1
9Pi
g m
eat
Imp
ort
ban
An
no
un
ced
an
imp
ort
ban
on
mea
t p
rod
uct
s d
eriv
ed f
rom
pig
s an
d w
ild b
oar
s fr
om
Slo
vaki
a, a
fter
a c
ase
of
ASF
w
as d
etec
ted
in a
bac
kyar
d s
win
e h
erd
.
Au
g-1
9A
llTa
riff
An
no
un
ced
an
ext
ra 1
0 p
erce
nt
tari
ff o
n b
ovi
ne
and
pig
mea
t im
po
rts
fro
m t
he
Un
ited
Sta
tes,
sta
rtin
g f
rom
Se
pte
mb
er 1
, 201
9. T
his
is in
ad
dit
ion
to
th
e 25
per
cen
t re
talia
tory
tar
iff
imp
ose
d b
y C
hin
a o
n m
eat
imp
ort
s fr
om
th
e U
nit
ed S
tate
s in
Ju
ly 2
018.
Sep
-19
Pig
mea
t Pr
od
uct
ion
su
pp
ort
An
no
un
ced
th
e im
ple
men
tati
on
of
a se
ries
of
po
licie
s ai
med
at
sup
po
rtin
g n
atio
nal
pig
mea
t p
rod
uct
ion
, in
clu
din
g
sub
sid
ies
for
con
stru
ctin
g la
rge
pig
far
ms
and
sim
plif
yin
g p
roce
du
res
for
ob
tain
ing
an
d r
edu
cin
g t
he
cost
of
lan
d
for
pig
far
ms.
Sep
-19
Bo
vin
e m
eat
Mar
ket
acce
ssA
pp
rove
d im
po
rts
of
bo
vin
e m
eat
fro
m t
hre
e U
krai
nia
n p
lan
ts.
Sep
-19
Bo
vin
e m
eat
Mar
ket
acce
ssA
uth
ori
zed
firs
t b
ovi
ne
mea
t im
po
rts
fro
m L
ith
uan
ia f
ollo
win
g a
n a
ud
it b
y C
hin
ese
insp
ecto
rs.
Sep
-19
Pig
mea
t Im
po
rt b
anB
ann
ed p
ig m
eat
imp
ort
s fr
om
th
e R
epu
blic
of
Ko
rea
ove
r A
SF c
on
cern
s.
Egyp
t M
ay-1
9B
ovi
ne
mea
tIm
po
rt p
olic
yD
elis
ted
all
com
pan
ies
that
pro
vid
ed h
alal
cer
tifi
cati
on
fo
r U
S b
ovi
ne
mea
t ex
po
rts
and
ob
ligat
ed e
xpo
rter
s to
o
bta
in t
he
hal
al c
erti
fica
te f
rom
a s
ing
le c
om
pan
y.

47FOOD OUTLOOKNOVEMBER 2019
Me
at
CO
UN
TRY
DA
TEPR
OD
UC
TPO
LIC
Y IN
STR
UM
ENT
DES
CR
IPTI
ON
Esw
atin
i Ju
n-1
9Pi
g m
eat
Imp
ort
ban
Ban
ned
imp
ort
s o
f liv
e p
igs
fro
m S
ou
th A
fric
a af
ter
a re
po
rted
ou
tbre
ak o
f A
SF.
Euro
pea
n U
nio
n
Ap
r-19
All
Imp
ort
po
licy
Ag
reed
on
a s
erie
s o
f ch
ang
es t
o r
ule
s o
n im
po
rts
of
anim
al p
rod
uct
s fr
om
co
un
trie
s in
clu
din
g A
rgen
tin
a, t
he
Ru
ssia
n F
eder
atio
n a
nd
Eg
ypt.
In t
he
case
of
Arg
enti
na,
th
e Eu
rop
ean
Un
ion
(EU
) h
as a
gre
ed t
o a
llow
fre
sh b
on
e-in
m
eat
fro
m ‘P
atag
on
ia N
ort
e A
’, a
reg
ion
dec
lare
d f
ree
fro
m f
oo
t-an
d-m
ou
th d
isea
se (
FMD
).
Jun
-19
All
Trad
e ag
reem
ent
Sig
ned
a t
rad
e ag
reem
ent
and
an
inve
stm
ent
pro
tect
ion
ag
reem
ent
wit
h V
iet
Nam
on
30
Jun
e 20
19, a
imed
at
gra
nti
ng
pre
fere
nti
al t
reat
men
t fo
r g
oo
ds
and
ser
vice
s an
d e
limin
atin
g n
on
-tar
iff
bar
rier
s en
cou
nte
red
by
bo
th
sid
es. F
or
the
mea
t se
cto
r, th
e ag
reem
ents
off
er d
uty
-fre
e ac
cess
into
Vie
t N
am f
or
EU f
roze
n p
ig m
eat
afte
r 7
year
s, a
nd
pro
vid
e fo
r p
ou
ltry
mea
t to
be
fully
lib
eral
ized
aft
er 1
0 ye
ars.
Jun
-19
All
Trad
e ag
reem
ent
Rea
ched
an
ag
reem
ent
wit
h S
ou
ther
n C
om
mo
n M
arke
t (M
ERC
OSU
R),
co
mp
risi
ng
Arg
enti
na,
Bra
zil,
Para
gu
ay a
nd
U
rug
uay
, aim
ed a
t re
mo
vin
g t
he
maj
ori
ty o
f ta
riff
s, s
imp
lifyi
ng
cu
sto
ms
pro
ced
ure
s an
d p
rote
ctin
g g
eog
rap
hic
al
ind
icat
ors
. In
th
e m
eat
sect
or,
MER
CO
SUR
co
un
trie
s w
ill c
om
man
d a
42.
5 p
erce
nt
shar
e o
f th
e n
ew 9
9 00
0 to
nn
e an
nu
al q
uo
ta f
or
bo
vin
e m
eat
exp
ort
s to
EU
mem
ber
co
un
trie
s, w
ith
a t
arif
f ra
te o
f 7.
5 p
erce
nt.
On
ce
imp
lem
ente
d, t
he
agre
emen
t w
ill r
edu
ce t
he
bo
vin
e m
eat
qu
ota
levy
, kn
ow
n a
s th
e H
ilto
n q
uo
ta, f
rom
20
per
cen
t to
zer
o.
Au
g-1
9B
ovi
ne
mea
tTr
ade
agre
emen
t
Sig
ned
an
ag
reem
ent
wit
h t
he
Un
ited
Sta
tes,
rev
iew
ing
th
e fu
nct
ion
ing
of
the
exis
tin
g q
uo
ta t
o im
po
rt h
orm
on
e-fr
ee b
eef
into
th
e EU
. Th
e ag
reem
ent
esta
blis
hes
th
at 3
5 00
0 to
nn
es o
f th
e n
on
-ho
rmo
ne
trea
ted
qu
ota
ou
t o
f th
e to
tal o
f 45
000
will
be
allo
cate
d t
o t
he
US,
ph
ased
ove
r a
7-ye
ar p
erio
d, w
ith
th
e re
mai
nin
g a
mo
un
t m
ade
avai
lab
le
to a
ll o
ther
exp
ort
ers.
Ind
on
esia
A
ug
-19
All
Imp
ort
ban
lift
edR
eop
ened
its
mar
ket
to s
hip
men
ts o
f b
ovi
ne
and
po
ult
ry m
eat
fro
m B
razi
l, fo
llow
ing
a r
ulin
g b
y th
e d
isp
ute
se
ttle
men
t b
od
y o
f th
e W
orl
d T
rad
e O
rgan
izat
ion
in f
avo
ur
of
Bra
zil.
Jap
an
May
-19
All
Tari
ff r
ate
qu
ota
An
no
un
ced
th
e sa
feg
uar
d (
SG)
trig
ger
leve
ls f
or
bo
vin
e an
d p
ig m
eat
for
the
fou
rth
qu
arte
r o
f Ja
pan
ese
fisc
al y
ear
2019
(Ja
nu
ary
2020
–Mar
ch 2
020)
. Th
e b
ovi
ne
mea
t SG
tri
gg
er is
set
at
117
per
cen
t o
f th
e p
revi
ou
s ye
ar’s
tra
de,
w
hile
th
e p
ig m
eat
SG t
rig
ger
leve
l is
set
at 1
19 p
erce
nt
of
the
aver
age
of
the
thre
e p
revi
ou
s ye
ars
of
trad
e.
May
-19
Bo
vin
e m
eat
Mar
ket
acce
ssLi
fted
th
e ag
e re
stri
ctio
n o
n C
anad
ian
bo
vin
e m
eat
exp
ort
s. U
nd
er t
he
rule
in p
lace
sin
ce 2
003
afte
r th
e d
etec
tio
n
of
bo
vin
e sp
on
gif
orm
en
cep
hal
op
ath
y (B
SE),
Jap
an o
nly
imp
ort
ed b
ovi
ne
mea
t d
eriv
ed f
rom
cat
tle
less
th
an 3
0 m
on
ths-
old
.
Jul-
19O
vin
e m
eat
Mar
ket
acce
ssA
uth
ori
zed
imp
ort
s o
f o
vin
e m
eat
fro
m Ir
elan
d.
Jul-
19Po
ult
ry m
eat
Imp
ort
ban
Imp
ose
d a
tem
po
rary
ban
on
imp
ort
s o
f p
ou
ltry
mea
t an
d e
gg
s fr
om
Den
mar
k, f
ollo
win
g a
rec
ent
ou
tbre
ak o
f lo
w
pat
ho
gen
ic a
vian
flu
(LP
AI)
.
Sep
-19
Pou
ltry
mea
tIm
po
rt b
anSu
spen
ded
imp
ort
s o
f p
ou
ltry
mea
t an
d e
gg
pro
du
cts
fro
m C
hile
, fo
llow
ing
an
ou
tbre
ak o
f H
7 LP
AI.
Rep
ub
lic o
f K
ore
a Se
p-1
9B
ovi
ne
mea
tIm
po
rt b
an li
fted
Rem
ove
d r
estr
icti
on
s fo
r b
ovi
ne
mea
t im
po
rts
fro
m t
he
EU, i
n p
lace
sin
ce 2
001
du
e to
BSE
.

Ma
jor
po
licy
de
velo
pm
en
ts
48 FOOD OUTLOOKNOVEMBER 2019
CO
UN
TRY
DA
TEPR
OD
UC
TPO
LIC
Y IN
STR
UM
ENT
DES
CR
IPTI
ON
Mex
ico
May
-19
Pou
ltry
mea
tTa
riff
rat
e q
uo
taA
nn
ou
nce
d a
n in
crea
se o
f th
e ta
riff
rat
e q
uo
ta (
TRQ
) fo
r p
ou
ltry
mea
t b
y an
ad
dit
ion
al 5
5 00
0 m
etri
c to
nn
es,
bri
ng
ing
th
e to
tal T
RQ
to
355
000
met
ric
ton
nes
.
May
-19
All
Trad
e ta
riff
lift
edLi
fted
tar
iffs
on
US
bo
vin
e an
d p
ig m
eat,
in r
esp
on
se t
o t
he
rem
ova
l of
tari
ffs
imp
ose
d b
y th
e U
nit
ed S
tate
s o
n s
teel
an
d a
lum
iniu
m im
po
rts
fro
m M
exic
o.
The
Phili
pp
ines
Sep
-19
Pig
mea
t Im
po
rt b
an
Susp
end
ed p
ig m
eat
imp
ort
s fr
om
th
e R
epu
blic
of
Ko
rea,
Mya
nm
ar a
nd
Ser
bia
du
e to
co
nce
rns
ove
r A
SF, f
ollo
win
g
ban
s b
y m
any
cou
ntr
ies
for
the
sam
e re
aso
n a
t d
iffe
ren
t ti
mes
incl
ud
ing
Bel
giu
m, B
ulg
aria
, Ch
ina,
Cze
chia
, G
erm
any,
Hu
ng
ary,
Dem
ocr
atic
Peo
ple
’s R
epu
blic
of
Ko
rea,
th
e La
o P
eop
le’s
Dem
ocr
atic
Rep
ub
lic, L
atvi
a, M
old
ova
, M
on
go
lia, P
ola
nd
, Ro
man
ia, t
he
Ru
ssia
n F
eder
atio
n, S
ou
th A
fric
a, U
krai
ne,
Vie
t N
am a
nd
Zam
bia
.
Ru
ssia
n F
eder
atio
n
Ap
r-19
Pou
ltry
mea
tTr
ade
agre
emen
tA
gre
ed w
ith
Ch
ina
to b
uy
each
oth
er's
po
ult
ry a
nd
rel
ated
pro
du
cts.
May
-19
All
Mar
ket
acce
ssC
on
firm
ed t
hat
26
mea
tpac
kin
g p
lan
ts w
ere
app
rove
d b
y C
hin
a, H
on
g K
on
g S
AR
to
exp
ort
pig
mea
t an
d b
ovi
ne
mea
t to
th
e co
un
try.
Jun
-19
All
Imp
ort
ban
ext
end
edEx
ten
ded
un
til t
he
end
of
2020
th
e b
an o
n t
he
imp
ort
of
agri
cult
ura
l pro
du
cts,
incl
ud
ing
mea
t, f
rom
co
un
trie
s th
at
app
lied
eco
no
mic
san
ctio
ns
agai
nst
th
e R
uss
ian
Fed
erat
ion
.
Au
g-1
9B
ovi
ne
mea
tM
arke
t ac
cess
Gra
nte
d m
arke
t ac
cess
fo
r o
ne
Bra
zilia
n fi
rm t
o s
up
ply
bo
vin
e m
eat
pro
du
cts
to it
s m
arke
t, b
y si
gn
ing
th
e ve
teri
nar
y ce
rtifi
cate
s.
Au
g-1
9Pi
g m
eat
Imp
ort
ban
Ban
ned
imp
ort
s o
f p
ig m
eat
fro
m S
erb
ia f
ollo
win
g n
ews
that
ASF
had
rea
ched
th
e B
alka
n c
ou
ntr
y fo
r th
e fi
rst
tim
e.
Sau
di A
rab
ia
Oct
-19
Pou
ltry
mea
tIm
po
rt b
an li
fted
Lift
ed a
ban
on
imp
ort
s o
f h
atch
ing
eg
gs
and
day
-old
-ch
icks
fro
m s
ever
al c
ou
ntr
ies,
incl
ud
ing
Den
mar
k, It
aly
and
th
e R
uss
ian
Fed
erat
ion
, as
thes
e co
un
trie
s h
ave
bee
n f
ree
of
hig
hly
pat
ho
gen
ic a
vian
flu
fo
r at
leas
t th
ree
mo
nth
s.
Serb
iaA
ug
-19
Pig
mea
t Ex
po
rt b
anH
alte
d p
ig m
eat
exp
ort
s to
Bo
snia
an
d H
erze
go
vin
a, N
ort
h M
aced
on
ia a
nd
Mo
nte
neg
ro d
ue
to r
epo
rted
cas
es o
f A
SF.
Sin
gap
ore
Jul-
19Po
ult
ry m
eat
Mar
ket
acce
ssA
uth
ori
zed
imp
ort
s o
f fr
oze
n p
ou
ltry
mea
t fr
om
th
e R
uss
ian
Fed
erat
ion
, fo
llow
ing
rec
og
nit
ion
th
at a
vian
flu
is
pre
sen
t in
on
ly o
ne
reg
ion
of
the
cou
ntr
y.
Sou
th A
fric
aJu
l-19
Bo
vin
e m
eat
Mar
ket
acce
ssR
esu
med
bo
vin
e m
eat
exp
ort
s to
Ch
ina,
fo
llow
ing
th
e re
mo
val o
f a
ban
imp
ose
d o
n it
s ex
po
rts
du
e to
an
ou
tbre
ak
of
FMD
in J
anu
ary.
Thai
lan
d
Jun
-19
Pig
mea
t Im
po
rt b
anB
ann
ed im
po
rts
of
live
pig
s an
d w
ild b
oar
s fr
om
th
e La
o P
eop
le’s
Dem
ocr
atic
Rep
ub
lic f
or
90 d
ays,
aft
er t
he
cou
ntr
y co
nfi
rmed
its
firs
t ca
se o
f A
SF.
Au
g-1
9Pi
g m
eat
Imp
ort
ban
Ban
ned
imp
ort
s o
f liv
e p
igs
and
wild
bo
ars
fro
m M
yan
mar
fo
r 90
day
s, a
fter
th
e co
un
try
con
firm
ed it
s fi
rst
case
of
ASF
.
Un
ited
Sta
tes
of
Am
eric
aA
pr-
19A
llM
arke
t ac
cess
Fin
aliz
ed e
xpo
rt c
erti
fica
tes
wit
h t
he
Go
vern
men
t o
f Tu
nis
ia, a
llow
ing
exp
ort
s o
f b
ovi
ne,
po
ult
ry m
eat
and
eg
g
pro
du
cts.

49FOOD OUTLOOKNOVEMBER 2019
Me
at
* A
col
lect
ion
of m
ajor
mea
t po
licy
deve
lopm
ents
sta
rtin
g in
Jan
uary
201
1 is
ava
ilabl
e at
: h
ttp:
//ww
w.f
ao.o
rg/e
cono
mic
/est
/est
-com
mod
ities
/com
mod
ity-p
olic
y-ar
chiv
e/en
/?gr
oupA
ND
com
mod
ity=
Mea
t
CO
UN
TRY
DA
TEPR
OD
UC
TPO
LIC
Y IN
STR
UM
ENT
DES
CR
IPTI
ON
Ukr
ain
e
Au
g-1
9Po
ult
ry m
eat
Mar
ket
acce
ssO
bta
ined
fo
rmal
ap
pro
val t
o e
xpo
rt p
ou
ltry
mea
t to
Jap
an f
or
the
firs
t ti
me
afte
r th
e tw
o c
ou
ntr
ies
agre
ed o
n
req
uir
ed v
eter
inar
y ce
rtifi
cate
s.
Au
g-1
9Po
ult
ry m
eat
Trad
e ag
reem
ent
Rat
ified
a t
rad
e ag
reem
ent
wit
h Is
rael
incl
ud
ing
tar
iff-
rate
qu
ota
fo
r p
ou
ltry
mea
t ex
po
rts.
Vie
t N
am
Sep
-19
All
Mar
ket
acce
ssA
uth
ori
zed
imp
ort
s o
f m
eat
fro
m L
ith
uan
ia a
fter
Vie
tnam
ese
insp
ecto
rs g
ave
a p
osi
tive
ass
essm
ent
of
con
tro
l sy
stem
s in
th
e B
alti
c co
un
try.

Ma
jor
po
licy
de
velo
pm
en
ts
50 FOOD OUTLOOKNOVEMBER 2019
DA
IRY:
M
AJO
R PO
LICY
DEV
ELO
PMEN
TS M
ID-A
PRIL
TO
MID
-OCT
OBE
R 20
19*
CO
UN
TRY
DA
TEPR
OD
UC
TPO
LIC
Y IN
STR
UM
ENT
DES
CR
IPTI
ON
Bel
aru
s A
pr-
19D
airy
pro
du
cts
Mar
ket
acce
ssSi
gn
ed a
pro
toco
l wit
h C
hin
a o
n q
uar
anti
ne
and
hea
lth
req
uir
emen
ts t
o e
xpo
rt d
airy
fo
dd
er
pro
du
cts.
Bra
zil
Sep
-19
Dai
ry p
rod
uct
sM
arke
t ac
cess
An
no
un
ced
th
e re
op
enin
g o
f th
e Eg
ypti
an m
arke
t fo
r it
s d
airy
pro
du
cts
follo
win
g a
ccep
tan
ce
of
the
Inte
rnat
ion
al H
ealt
h C
erti
fica
te, w
hic
h is
req
uir
ed f
or
exp
ort
s to
Eg
ypt.
Exp
ort
s o
f d
airy
pro
du
cts
fro
m B
razi
l to
Eg
ypt
had
bee
n s
usp
end
ed s
ince
201
5.
Ch
ina
(M
ain
lan
d)
Sep
-19
Wh
eyTa
riff
rat
eEx
emp
ted
US
feed
wh
ey f
rom
tar
iffs
.
Euro
pea
n U
nio
n
Jun
-19
Dai
ry p
rod
uct
sTr
ade
agre
emen
tSi
gn
ed a
tra
de
agre
emen
t an
d a
n in
vest
men
t p
rote
ctio
n a
gre
emen
t, o
ffer
ing
du
ty-f
ree
acce
ss
for
dai
ry (
curr
entl
y u
p t
o 2
0 p
erce
nt
tari
ff)
into
Vie
t N
am o
ver
a 5-
year
per
iod
.
Jun
-19
Dai
ry p
rod
uct
sTr
ade
agre
emen
tR
each
ed a
n a
gre
emen
t w
ith
th
e So
uth
ern
Co
mm
on
Mar
ket
(MER
CO
SUR
), c
om
pri
sin
g
Arg
enti
na,
Bra
zil,
Para
gu
ay a
nd
Uru
gu
ay, a
imed
at
stre
ng
then
ing
tra
de
and
gu
aran
teei
ng
Eu
rop
ean
geo
gra
ph
ical
ind
icat
ors
, in
clu
din
g f
or
dai
ry p
rod
uct
s.
Ind
ia
Ap
r-19
Dai
ry p
rod
uct
sIm
po
rt b
an e
xten
ded
Exte
nd
ed t
he
ban
on
imp
ort
s o
f m
ilk a
nd
its
pro
du
cts
fro
m C
hin
a, w
hic
h w
as fi
rst
imp
ose
d
du
e to
th
e p
rese
nce
of
mel
amin
e in
so
me
milk
co
nsi
gn
men
ts f
rom
Ch
ina
in 2
008.
Jap
an
Oct
-19
Milk
po
wd
erIm
po
rt q
uo
taLo
wer
ed t
he
amo
un
t o
f p
lan
ned
ski
mm
ed m
ilk p
ow
der
(SM
P) im
po
rt v
olu
mes
in J
apan
ese
fisc
al y
ear
2019
fro
m 2
0 00
0 to
nn
es t
o 1
6 00
0 to
nn
es.
Mex
ico
M
ay-1
9D
airy
pro
du
cts
Imp
ort
ban
lift
edR
emo
ved
ret
alia
tory
tar
iffs
on
US
pro
du
cts,
incl
ud
ing
dai
ry p
rod
uct
s, o
n M
ay 2
0 20
19, i
n
resp
on
se t
o t
he
lifti
ng
of
tari
ffs
imp
ose
d b
y th
e U
nit
ed S
tate
s o
n s
teel
an
d a
lum
iniu
m.
Ru
ssia
n F
eder
atio
n
Jun
-19
Dai
ry p
rod
uct
sIm
po
rt b
an e
xten
ded
Exte
nd
ed t
he
ban
un
til t
he
end
of
2020
on
imp
ort
s o
f ag
ricu
ltu
ral p
rod
uct
s, in
clu
din
g d
airy
p
rod
uct
s, f
rom
co
un
trie
s th
at a
pp
lied
eco
no
mic
san
ctio
ns
agai
nst
th
e R
uss
ian
Fed
erat
ion
.
Serb
ia
Jun
-19
Dai
ry p
rod
uct
sTr
ade
agre
emen
tA
nn
ou
nce
d a
n a
gre
emen
t en
ablin
g e
xpo
rts
of
dai
ry p
rod
uct
s to
Ch
ina.
Slo
vaki
a A
pr-
19D
airy
pro
du
cts
Mar
ket
acce
ssSi
gn
ed a
n a
gre
emen
t w
ith
Ch
ina,
allo
win
g e
xpo
rts
of
dai
ry p
rod
uct
s to
Ch
ina.
Turk
ey
Sep
-19
Dai
ry p
rod
uct
sM
arke
t ac
cess
Rea
ched
an
ag
reem
ent
wit
h C
hin
a to
exp
ort
dai
ry p
rod
uct
s, w
hic
h w
ill a
llow
th
ose
Tu
rkis
h
firm
s re
gis
tere
d w
ith
Ch
ina’
s fo
od
imp
ort
sys
tem
(C
IFER
) to
beg
in e
xpo
rts,
fo
llow
ing
ap
pro
val
fro
m t
he
Ch
ines
e au
tho
riti
es.
Ukr
ain
e
May
-19
Dai
ry p
rod
uct
sM
arke
t ac
cess
Ag
reed
wit
h B
osn
ia a
nd
Her
zeg
ovi
na
on
issu
ing
vet
erin
ary
cert
ifica
tes
to e
xpo
rt m
ilk a
nd
d
airy
pro
du
cts.
Au
g-1
9D
airy
pro
du
cts
Trad
e ag
reem
ent
Rat
ified
a t
rad
e ag
reem
ent
wit
h Is
rael
incl
ud
ing
tar
iff
rate
qu
ota
fo
r d
airy
pro
du
ct e
xpo
rts.
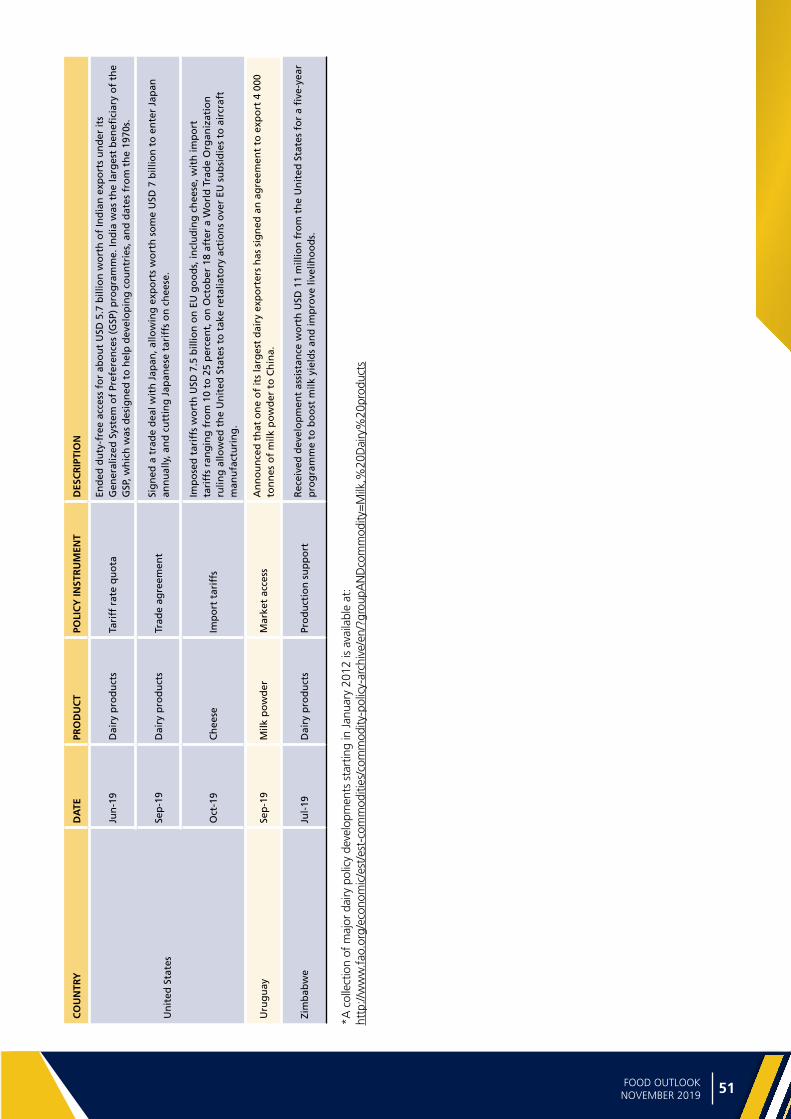
51FOOD OUTLOOKNOVEMBER 2019
Da
iry
*A c
olle
ctio
n of
maj
or d
airy
pol
icy
deve
lopm
ents
sta
rtin
g in
Jan
uary
201
2 is
ava
ilabl
e at
: ht
tp://
ww
w.f
ao.o
rg/e
cono
mic
/est
/est
-com
mod
ities
/com
mod
ity-p
olic
y-ar
chiv
e/en
/?gr
oupA
ND
com
mod
ity=
Milk
,%20
Dai
ry%
20pr
oduc
ts
CO
UN
TRY
DA
TEPR
OD
UC
TPO
LIC
Y IN
STR
UM
ENT
DES
CR
IPTI
ON
Un
ited
Sta
tes
Jun
-19
Dai
ry p
rod
uct
sTa
riff
rat
e q
uo
taEn
ded
du
ty-f
ree
acce
ss f
or
abo
ut
USD
5.7
bill
ion
wo
rth
of
Ind
ian
exp
ort
s u
nd
er it
s G
ener
aliz
ed S
yste
m o
f Pr
efer
ence
s (G
SP)
pro
gra
mm
e. In
dia
was
th
e la
rges
t b
enefi
ciar
y o
f th
e G
SP, w
hic
h w
as d
esig
ned
to
hel
p d
evel
op
ing
co
un
trie
s, a
nd
dat
es f
rom
th
e 19
70s.
Sep
-19
Dai
ry p
rod
uct
sTr
ade
agre
emen
tSi
gn
ed a
tra
de
dea
l wit
h J
apan
, allo
win
g e
xpo
rts
wo
rth
so
me
USD
7 b
illio
n t
o e
nte
r Ja
pan
an
nu
ally
, an
d c
utt
ing
Jap
anes
e ta
riff
s o
n c
hee
se.
Oct
-19
Ch
eese
Imp
ort
tar
iffs
Imp
ose
d t
arif
fs w
ort
h U
SD 7
.5 b
illio
n o
n E
U g
oo
ds,
incl
ud
ing
ch
eese
, wit
h im
po
rt
tari
ffs
ran
gin
g f
rom
10
to 2
5 p
erce
nt,
on
Oct
ob
er 1
8 af
ter
a W
orl
d T
rad
e O
rgan
izat
ion
ru
ling
allo
wed
th
e U
nit
ed S
tate
s to
tak
e re
talia
tory
act
ion
s o
ver
EU s
ub
sid
ies
to a
ircr
aft
man
ufa
ctu
rin
g.
Uru
gu
ay
Sep
-19
Milk
po
wd
erM
arke
t ac
cess
An
no
un
ced
th
at o
ne
of
its
larg
est
dai
ry e
xpo
rter
s h
as s
ign
ed a
n a
gre
emen
t to
exp
ort
4 0
00
ton
nes
of
milk
po
wd
er t
o C
hin
a.
Zim
bab
we
Jul-
19D
airy
pro
du
cts
Pro
du
ctio
n s
up
po
rtR
ecei
ved
dev
elo
pm
ent
assi
stan
ce w
ort
h U
SD 1
1 m
illio
n f
rom
th
e U
nit
ed S
tate
s fo
r a
five
-yea
r p
rog
ram
me
to b
oo
st m
ilk y
ield
s an
d im
pro
ve li
velih
oo
ds.
Sta
tist
ica
l a
pp
en
dix
52 53FOOD OUTLOOKNOVEMBER 2019
FOOD OUTLOOKNOVEMBER 2019
Appendix Table 1 (A & B): Cereal statistics 54-55
Appendix Table 2 (A & B): Wheat statistics 56-57
Appendix Table 3 (A & B): Coarse grains statistics 58-59
Appendix Table 4 (A & B): Maize statistics 60-61
Appendix Table 5 (A & B): Barley statistics 62-63
Appendix Table 6 (A & B): Sorghum statistics 64-65
Appendix Table 7 (A & B): Other Coarse grains statistics 64-65
Appendix Table 8 (A & B): Rice statistics 66-67
Appendix Table 9: Cereal supply and utilization in main exporting countries 68
Appendix Table 10: Total oilcrops statistics 69
Appendix Table 11: Total oils and fats statistics 70
Appendix Table 12: Total meals and cakes statistics 71
Appendix Table 13: Sugar statistics 72
Appendix Table 14: Total meat statistics 73
Appendix Table 15: Bovine meat statistics 74
Appendix Table 16: Ovine meat statistics 75
Appendix Table 17: Pigmeat statistics 76
Appendix Table 18: Poultry meat statistics 77
Appendix Table 19: Milk and milk products statistics 78
Appendix Table 20: Fish and fishery products statistics 79
Appendix Table 21: Selected international prices for wheat and coarse grains 80
Appendix Table 22: Wheat and maize futures prices 80
Appendix Table 23: Selected international prices for rice and price indices 81
Appendix Table 24: Selected international prices for oilcrop products and price indices 82
Appendix Table 25: Selected international prices for sugar and sugar price index 83
Appendix Table 26: Selected international prices for milk products and dairy price indices 84
Appendix Table 27: Selected international meat prices 85
Appendix Table 28: Selected international meat prices and FAO meat price index 86
Appendix Table 29: Fish price indices 87
Appendix Table 30: Selected international commodity prices 88
Statistical appendix tables
52 53FOOD OUTLOOKNOVEMBER 2019
FOOD OUTLOOKNOVEMBER 2019
GENERAL
• FAO estimates and forecasts are
based on official and unofficial
sources.
• Unless otherwise stated - all charts
and tables refer to FAO data as
source.
• Estimates of world imports and exports
may not always match - mainly
because shipments and deliveries
do not necessarily occur in the same
marketing year.
• Tonnes refer to metric tonnes.
• All totals are computed from
unrounded data.
• Regional totals may include estimates
for countries not listed. The countries
shown in the tables were chosen
based on their importance of either
production or trade in each region.
The totals shown for Central America
include countries in the Caribbean.
• Estimates for China also include
those for the Taiwan Province - Hong
Kong SAR and Macao SAR - unless
otherwise stated.
• Up to 2012/13 - the European
Union includes 27 member states.
From 2013/14 - the European Union
includes 28 member states.
• ‘-‘ means nil or negligible.
• Cereals include wheat - rice and
coarse grains. Coarse grains include
maize - barley - sorghum - millet
- rye - oats and NES (not elsewhere
specified).
Production• Cereals: Data refer to the calendar
year in which the whole harvest or
bulk of harvest takes place.
Utilization• Cereals: Data are on individual
country’s marketing year basis.
Trade• Trade between European Union
member states is excluded - unless
otherwise stated.
• Wheat: Trade data include wheat
flour in wheat grain equivalent. The
time reference period is July/June -
unless otherwise stated.
• Coarse grains: The time reference
period is July/June - unless otherwise
stated.
• Rice, dairy and meat products:
The time reference period is January/
December.
• Oilseeds, oils/fats and meals: The
time reference period is October/
September - unless otherwise stated.
Stocks• Cereals: Data refer to carry-overs at
the close of national crop seasons
ending in the year shown.
Price indices• The FAO price indices are calculated
using the Laspeyres formula; the weights used are based on the average export value of each commodity for the 2002-2004
period.
COUNTRY CLASSIFICATION
In the presentation of statistical
material, references are made to
special country groupings: Low-
Income Food-Deficit Countries (LIFDCs)
- Least Developed Countries (LDCs).
The LIFDCs include 51 countries that
are net importers of basic foodstuffs
with per caput income below the
level used by the World Bank to
determine eligibility for International
Development Aid (IDA) assistance (i.e.
USD 1 945 in 2011). The LDCs group
currently includes 47 countries with
low income as well as weak human
resources and low level of economic
diversification. The list is reviewed
every three years by the Economic and
Social Council of the United Nations.
DISCLAIMER
The designations employed and
the presentation of material in
this publication do not imply the
expression of any opinion whatsoever
on the part of the Food and
Agriculture Organization of the United
Nations concerning the legal status of
any country - territory - city or area
or of its authorities - or concerning
the delimitation of its frontiers or
boundaries.
NOTES

Sta
tist
ica
l a
pp
en
dix
54 55FOOD OUTLOOKNOVEMBER 2019
FOOD OUTLOOKNOVEMBER 2019
APPENDIX TABLE 1(A): CEREAL STATISTICS
2015-2017
average2018 2019
15/16-17/18average
2018/19 2019/2015/16-17/18
average2018/19 2019/20
estim. f'cast estim. f'cast estim. f'cast
ASIA 1 184.5 1 200.0 1 209.7 207.4 203.0 206.4 59.5 61.9 59.9Bangladesh 38.7 40.4 41.2 7.8 7.5 7.8 - - -China 552.2 545.3 543.0 34.8 25.2 24.5 1.6 3.5 3.9India 244.7 261.7 262.1 2.9 0.2 0.2 13.0 12.6 13.4Indonesia 67.3 72.4 73.1 12.7 12.8 12.5 0.2 0.1 0.2Iran, Islamic Republic of 17.8 19.1 20.6 12.0 13.6 14.4 0.5 0.1 0.1Iraq 3.7 3.0 5.5 4.1 5.2 4.3 - - -Japan 8.7 8.4 8.4 23.4 24.0 24.8 0.3 0.3 0.3Kazakhstan 19.1 19.6 17.7 0.1 0.1 0.1 8.9 10.6 7.5Korea, Republic.of 4.4 4.1 4.1 14.6 14.3 15.2 0.1 0.1 0.1Myanmar 19.7 21.2 21.3 0.5 0.5 0.5 3.5 3.7 3.8Pakistan 39.1 39.1 39.3 0.2 0.2 0.2 4.7 5.1 5.2Philippines 19.6 20.0 20.0 7.5 10.8 11.0 0.1 - 0.1Saudi Arabia 0.3 0.8 1.0 17.4 15.2 17.5 - - -Thailand 25.2 26.4 26.6 4.4 3.6 4.1 11.4 9.0 8.9Turkey 36.3 34.0 33.9 6.9 9.6 9.9 4.9 4.7 4.5Viet Nam 33.6 33.5 33.6 13.6 13.9 14.8 6.6 7.5 7.5
AFRICA 176.8 193.8 182.9 92.4 89.7 95.6 6.6 6.5 6.0Algeria 3.6 6.0 6.1 13.3 12.5 12.2 - - -Egypt 21.9 20.2 20.9 20.9 22.1 22.6 0.2 - -Ethiopia 25.8 27.7 27.5 1.8 1.8 2.0 1.2 1.3 1.3Morocco 8.3 10.5 6.0 7.3 6.2 8.5 0.1 0.1 0.1Nigeria 22.5 24.7 24.1 7.7 8.0 8.1 0.7 0.7 0.7South Africa 14.3 15.6 14.0 4.2 2.8 3.2 1.5 1.7 1.6Sudan 6.0 8.3 6.7 2.8 2.8 2.9 0.3 0.4 0.2
CENTRAL AMERICA 43.2 42.2 41.1 33.3 36.2 37.9 2.9 1.3 2.2Mexico 36.8 35.7 34.7 20.9 23.1 24.6 2.7 1.1 2.0
SOUTH AMERICA 192.1 196.5 227.2 31.5 32.9 32.6 71.2 77.1 92.7Argentina 65.7 71.2 84.7 0.1 0.1 0.1 37.4 44.3 50.1Brazil 98.4 97.7 115.8 9.6 10.0 9.4 28.1 27.9 37.2Chile 3.8 3.4 3.3 3.1 3.5 3.6 0.1 0.1 0.1Colombia 3.1 3.1 3.0 7.3 7.6 7.7 - - -Peru 4.2 4.4 4.1 5.6 6.0 6.1 0.1 0.1 0.1Venezuela 1.6 0.9 0.8 3.5 3.4 3.5 - - -
NORTH AMERICA 503.2 497.2 482.5 9.7 10.3 10.3 116.6 122.1 107.4Canada 56.3 58.5 61.1 1.8 3.2 2.2 26.2 31.0 29.8United States of America 446.8 438.7 421.4 7.8 7.1 8.1 90.4 91.0 77.6
EUROPE 511.8 497.7 530.9 27.6 38.2 30.6 124.3 129.3 132.1European Union 309.0 294.6 316.8 23.4 33.1 26.0 37.8 31.1 35.2Russian Federation 116.8 109.5 116.3 0.9 0.6 0.6 41.2 43.9 43.5Serbia 8.7 10.5 9.8 0.1 0.1 0.1 2.7 3.6 2.1Ukraine 62.1 69.3 72.5 0.2 0.1 0.2 41.5 49.5 50.2
OCEANIA 41.0 29.9 29.7 1.7 1.8 1.8 26.1 14.1 14.7Australia 40.0 28.8 28.6 0.2 0.2 0.2 26.1 14.1 14.7
WORLD 2 652.5 2 657.3 2 704.0 403.6 412.2 415.1 407.3 412.2 415.1LIFDC 448.6 474.4 476.2 71.4 70.1 71.7 23.8 24.5 25.0LDC 175.3 187.7 186.6 39.0 39.1 40.0 9.4 9.8 9.7
APPENDIX TABLE 1(A): CEREAL STATISTICS
Production Imports Exports
(. . . . . . . . . . . . . . . . . . . . . . . . . . . . . . . . . . . . . . . . . . million tonnes . . . . . . . . . . . . . . . . . . . . . . . . . . . . . . . . . . . . . . . . . . )

54 55FOOD OUTLOOKNOVEMBER 2019
FOOD OUTLOOKNOVEMBER 2019
APPENDIX TABLE 1(B): CEREAL STATISTICS
15/16-17/18
average2018/19 2019/20
2016-2018average
2019 202015/16-17/18
average2018/19 2019/20
estim. f'cast estim. f'cast estim. f'cast
ASIA 1 309.1 1 342.8 1 362.0 551.6 569.4 562.3 158.0 157.8 158.2Bangladesh 46.0 48.8 49.5 8.0 8.8 8.2 214.2 216.1 217.8China 553.8 568.8 572.5 405.8 426.0 417.2 154.6 153.4 153.5India 236.6 241.8 247.0 39.7 50.3 52.4 146.8 146.5 147.1Indonesia 79.8 85.8 86.0 9.5 10.4 9.6 188.5 189.8 190.8Iran, Islamic Republic of 31.1 33.3 34.7 8.2 5.1 4.9 202.9 203.4 203.7Iraq 8.5 8.5 9.3 0.7 0.4 0.9 188.3 187.9 188.5Japan 32.1 32.1 32.8 6.9 6.5 6.5 93.6 93.3 93.0Kazakhstan 10.5 10.1 9.7 4.1 3.0 3.7 157.0 156.5 156.5Korea, Republic.of 19.1 18.7 19.0 3.9 2.5 2.6 128.1 126.2 124.7Myanmar 16.9 17.5 17.9 2.9 3.3 3.5 211.0 214.0 214.6Pakistan 35.1 35.5 35.9 5.8 3.8 2.2 147.5 147.0 146.7Philippines 27.0 30.3 31.3 3.9 4.9 4.9 156.8 159.7 162.5Saudi Arabia 18.2 16.7 17.7 7.0 5.4 6.1 143.6 139.9 139.4Thailand 21.6 20.0 21.4 10.5 7.9 7.9 117.7 117.2 120.1Turkey 38.6 39.1 40.1 6.8 6.7 5.5 239.1 238.5 238.4Viet Nam 39.8 41.7 41.2 5.2 3.9 3.9 177.7 177.9 176.9
AFRICA 259.3 274.0 275.7 56.5 60.7 56.3 148.2 149.1 147.8Algeria 16.7 17.4 18.2 5.5 6.4 6.4 227.3 227.7 227.5Egypt 42.4 43.2 43.5 6.8 5.5 5.6 269.2 270.3 267.2Ethiopia 25.6 27.6 28.0 4.9 6.3 6.5 187.1 192.7 193.5Morocco 15.2 15.9 15.6 7.0 7.2 6.0 236.0 237.3 237.5Nigeria 29.5 30.4 31.4 2.8 3.7 3.6 125.6 122.6 121.7South Africa 16.4 17.7 16.9 3.5 3.6 2.3 163.8 165.1 164.5Sudan 8.4 9.6 9.4 3.0 3.3 2.5 179.0 182.4 179.3
CENTRAL AMERICA 72.7 77.1 77.8 10.8 11.4 10.7 159.5 162.5 162.2Mexico 54.1 57.3 58.1 6.2 7.5 6.9 186.2 186.9 187.6
SOUTH AMERICA 150.8 163.3 163.9 39.0 44.2 45.2 118.9 119.7 119.5Argentina 27.8 32.6 32.2 9.2 12.1 12.3 135.1 135.6 134.9Brazil 80.7 84.1 86.1 15.6 16.8 18.7 113.1 112.3 111.7Chile 6.1 7.2 7.0 4.1 4.3 3.9 145.1 147.6 147.5Colombia 9.9 10.6 10.7 2.1 2.5 2.5 107.8 119.5 119.8Peru 9.5 10.2 10.5 1.0 1.1 1.0 149.9 152.2 152.9Venezuela 5.5 4.6 4.3 0.9 0.3 0.2 115.9 109.4 108.5
NORTH AMERICA 388.3 395.6 389.3 98.1 97.9 90.7 110.1 110.1 110.0Canada 31.5 33.0 32.8 11.2 9.3 10.1 96.2 96.3 96.3United States of America 356.9 362.7 356.5 86.9 88.6 80.6 111.7 111.7 111.6
EUROPE 413.9 418.3 422.8 74.4 71.3 77.9 133.3 133.3 133.6European Union 294.4 297.7 302.6 40.7 45.1 50.1 133.8 134.1 134.4Russian Federation 73.2 75.6 74.9 18.3 13.5 12.0 126.5 126.1 126.1Serbia 6.4 6.5 6.5 1.0 1.1 2.4 173.8 175.4 172.6Ukraine 23.0 21.6 21.7 7.9 4.8 5.6 144.1 143.2 143.6
OCEANIA 16.7 17.7 17.8 8.5 7.3 6.3 93.1 93.1 93.2Australia 14.2 15.0 15.1 8.0 6.8 5.8 102.9 102.9 103.0
WORLD 2 610.9 2 688.8 2 709.2 838.7 862.3 849.5 149.1 149.3 149.3LIFDC 494.8 514.5 521.2 92.2 103.8 104.7 149.4 150.0 149.9LDC 203.5 216.3 218.3 41.9 45.3 43.0 154.5 155.8 154.9
APPENDIX TABLE 1(B): CEREAL STATISTICS
Total Utilization Stocks ending in Per caput food use
(. . . . . . . . . . . . . . . . . . . . . . . . . million tonnes . . . . . . . . . . . . . . . . . . . . . . . . . ) (. . . . . . . . . . . Kg/year . . . . . . . . . . . )

Sta
tist
ica
l a
pp
en
dix
56 57FOOD OUTLOOKNOVEMBER 2019
FOOD OUTLOOKNOVEMBER 2019
APPENDIX TABLE 2(A): WHEAT STATISTICS
2015-2017
average2018 2019
15/16-17/18average
2018/19 2019/2015/16-17/18
average2018/19 2019/20
estim. f'cast estim. f'cast estim. f'cast
ASIA 326.1 326.7 336.3 86.0 85.1 85.7 16.7 17.1 14.2Bangladesh 1.3 1.1 1.3 5.3 5.6 5.8 - - -China 133.4 131.4 134.0 5.7 4.9 5.4 0.3 0.4 0.3 of which Taiwan Prov. - - - 1.4 1.4 1.4 - - -India 92.4 99.9 102.2 2.6 - - 0.6 0.5 0.5Indonesia - - - 10.2 11.3 11.2 0.1 0.1 0.1Iran, Islamic Republic of 11.7 13.4 14.5 2.1 0.1 0.1 0.5 0.1 0.1Iraq 2.9 2.2 4.3 2.8 3.7 2.7 - - -Japan 0.9 0.8 0.8 5.6 5.5 5.6 0.2 0.2 0.2Kazakhstan 14.5 13.9 11.5 0.1 0.1 0.1 7.8 8.6 6.0Korea, Republic of - - - 4.3 3.7 4.5 - - -Pakistan 25.8 25.1 25.2 - - - 0.8 0.7 0.6Philippines - - - 5.5 7.1 7.4 0.1 - -Saudi Arabia - 0.5 0.7 3.3 2.9 3.2 - - -Thailand - - - 3.9 2.8 3.3 - - -Turkey 21.6 20.0 19.0 4.8 6.5 6.3 4.7 4.6 4.4
AFRICA 26.4 29.3 27.3 49.3 48.3 48.9 0.9 0.8 0.9Algeria 2.5 3.9 4.0 8.3 7.4 7.0 - - -Egypt 9.1 8.6 9.0 11.9 12.5 12.5 - - -Ethiopia 4.6 4.8 4.8 1.3 1.3 1.5 - - -Morocco 6.0 7.3 4.5 4.5 3.7 5.0 0.1 0.1 0.1Nigeria 0.1 0.1 0.1 4.9 5.1 4.8 0.4 0.4 0.4South Africa 1.6 1.9 1.8 1.8 1.6 1.6 0.1 0.1 0.1Tunisia 1.0 1.1 1.7 2.1 1.9 1.7 0.1 - -
CENTRAL AMERICA 3.7 2.9 3.3 9.0 9.3 9.5 1.3 0.6 1.4Cuba - - - 0.8 0.8 0.8 - - -Mexico 3.7 2.9 3.3 5.0 5.0 5.2 1.2 0.5 1.3
SOUTH AMERICA 25.3 28.9 28.5 14.7 15.3 15.4 13.1 13.8 15.2Argentina 16.1 19.5 19.6 - - - 11.4 12.4 14.0Brazil 5.5 5.4 5.1 6.7 7.3 7.3 0.6 0.6 0.5Chile 1.5 1.4 1.4 1.2 1.1 1.2 - - -Colombia - - - 1.9 1.7 1.7 - - -Peru 0.2 0.2 0.2 2.0 2.1 2.1 - - -Venezuela - - - 1.3 1.4 1.4 - - -
NORTH AMERICA 85.5 83.5 85.9 3.7 3.6 4.0 45.8 50.5 50.3Canada 30.0 32.2 32.5 0.1 0.1 0.1 21.0 24.4 24.1United States of America 55.4 51.3 53.4 3.6 3.5 3.9 24.8 26.1 26.2
EUROPE 260.5 242.9 265.8 8.1 8.2 7.6 78.4 75.6 80.6European Union 152.5 138.6 154.0 5.7 5.4 5.0 27.7 22.4 27.0Russian Federation 73.7 72.1 75.5 0.5 0.4 0.3 31.3 35.7 33.5Ukraine 26.3 24.6 28.0 - - - 17.8 15.9 18.5
OCEANIA 25.4 17.7 17.9 0.9 0.9 0.9 17.8 9.8 9.5Australia 25.0 17.3 17.5 - - - 17.8 9.8 9.5
WORLD 752.9 731.9 765.0 171.9 170.6 172.1 173.9 168.2 172.1LIFDC 116.6 121.4 127.3 38.7 36.5 36.3 1.5 1.4 1.4LDC 13.7 12.7 14.6 22.4 23.4 22.7 0.1 0.1 0.1
APPENDIX TABLE 2(A): WHEAT STATISTICS
Production Imports Exports
(. . . . . . . . . . . . . . . . . . . . . . . . . . . . . . . . . . . . . . . . . . million tonnes . . . . . . . . . . . . . . . . . . . . . . . . . . . . . . . . . . . . . . . . . . )

56 57FOOD OUTLOOKNOVEMBER 2019
FOOD OUTLOOKNOVEMBER 2019
APPENDIX TABLE 2(B): WHEAT STATISTICS
15/16-17/18
average2018/19 2019/20
2016-2018average
2019 202015/16-17/18
average2018/19 2019/20
estim. f'cast estim. f'cast estim. f'cast
ASIA 382.2 392.5 399.7 157.5 174.3 181.9 65.8 65.8 66.0Bangladesh 6.1 7.2 7.4 1.9 1.9 1.6 29.6 32.5 32.8China 122.6 128.3 129.6 95.8 119.7 129.1 64.8 63.6 63.7 of which Taiwan Prov. 1.4 1.4 1.4 0.4 0.4 0.4 45.7 45.6 45.7India 96.0 97.9 100.4 17.2 19.5 20.8 59.8 59.9 60.1Indonesia 9.8 11.1 11.1 1.1 1.1 1.0 25.5 26.4 26.3Iran, Islamic Republic of 14.6 14.6 14.8 5.8 2.1 1.8 166.4 166.4 166.4Iraq 6.2 6.2 6.5 0.6 0.2 0.7 149.3 148.7 149.0Japan 6.3 6.3 6.3 1.6 1.4 1.1 40.5 40.6 40.6Kazakhstan 6.9 6.4 6.2 3.6 2.6 2.0 142.6 142.0 142.0Korea, Republic of 4.1 3.7 4.3 0.9 1.0 1.1 47.8 47.7 47.6Pakistan 25.4 25.4 25.9 3.8 2.4 1.0 124.4 124.2 124.1Philippines 5.4 7.0 7.4 0.8 1.1 1.0 23.3 24.0 24.5Saudi Arabia 3.5 3.6 3.6 3.2 2.8 3.1 99.2 98.6 98.4Thailand 3.6 2.9 3.3 1.6 1.7 1.7 16.3 16.3 16.8Turkey 21.8 22.1 22.2 4.7 4.5 3.3 210.0 210.0 209.7
AFRICA 73.5 76.3 76.7 21.7 19.4 17.3 50.3 50.1 49.7Algeria 10.6 10.8 10.9 3.8 4.3 4.3 208.8 209.5 209.5Egypt 21.0 21.6 21.8 4.6 3.4 3.2 185.9 186.2 186.3Ethiopia 5.8 6.3 6.4 0.9 0.8 0.6 45.5 48.2 48.1Morocco 9.9 10.7 10.4 5.6 5.6 4.6 205.1 206.1 206.1Nigeria 4.0 4.1 4.3 0.2 0.2 0.2 20.3 20.0 20.2South Africa 3.2 3.4 3.3 0.6 0.5 0.4 56.5 56.6 56.8Tunisia 3.0 3.0 3.1 0.5 0.4 0.6 209.4 209.3 209.6
CENTRAL AMERICA 11.2 11.7 11.8 2.2 2.2 2.0 44.0 45.6 45.4Cuba 0.8 0.8 0.8 0.1 0.1 0.1 58.1 60.5 61.3Mexico 7.3 7.4 7.6 1.0 1.1 1.0 48.6 48.9 49.1
SOUTH AMERICA 27.7 29.6 29.0 7.0 7.6 7.7 59.4 60.2 60.2Argentina 5.7 6.2 5.8 1.7 2.0 2.3 117.5 117.7 117.8Brazil 11.5 11.9 11.9 1.9 2.0 2.0 53.1 53.6 53.7Chile 2.5 3.1 2.8 1.1 0.8 0.6 108.8 109.9 110.2Colombia 1.7 1.8 1.7 0.9 0.9 0.9 32.1 33.9 31.5Peru 2.2 2.2 2.3 0.3 0.3 0.3 63.9 64.6 65.9Venezuela 1.3 1.4 1.4 0.1 0.1 0.1 41.5 42.6 42.1
NORTH AMERICA 40.0 38.5 40.5 35.7 35.3 34.4 82.7 82.5 82.3Canada 9.0 8.5 8.7 6.2 5.9 6.0 81.1 81.2 81.1United States of America 31.0 30.0 31.8 29.5 29.4 28.4 82.9 82.6 82.5
EUROPE 186.6 189.0 191.2 34.3 26.6 28.2 107.7 107.6 107.9European Union 128.3 127.2 129.6 16.6 14.5 17.0 109.4 109.5 109.7Russian Federation 40.4 44.7 44.2 12.6 8.0 6.2 100.1 99.9 99.9Ukraine 9.6 8.7 8.8 2.9 2.1 2.8 112.0 111.7 112.0
OCEANIA 9.2 10.4 10.5 5.3 4.5 3.3 68.9 68.7 68.8Australia 7.9 9.1 9.2 5.0 4.2 3.0 82.5 82.4 82.5
WORLD 730.4 748.0 759.5 263.8 269.8 274.9 67.3 67.1 67.1LIFDC 154.5 158.1 161.5 33.6 32.3 32.3 48.9 49.1 49.0LDC 35.4 37.3 38.0 10.6 8.7 7.4 30.4 31.1 31.1
APPENDIX TABLE 2(B): WHEAT STATISTICS
Total Utilization Stocks ending in Per caput food use
(. . . . . . . . . . . . . . . . . . . . . . . . . million tonnes . . . . . . . . . . . . . . . . . . . . . . . . . ) (. . . . . . . . . . . Kg/year . . . . . . . . . . . )

Sta
tist
ica
l a
pp
en
dix
58 59FOOD OUTLOOKNOVEMBER 2019
FOOD OUTLOOKNOVEMBER 2019
APPENDIX TABLE 3(A): COARSE GRAIN STATISTICS
2015-2017
average2018 2019
15/16-17/18average
2018/19 2019/2015/16-17/18
average2018/19 2019/20
estim. f'cast estim. f'cast estim. f'cast
ASIA 404.3 406.5 407.3 100.0 97.8 100.8 4.7 6.0 5.4China 272.4 267.3 264.4 23.0 15.9 15.0 0.1 0.1 0.1 of which Taiwan Prov. 0.2 0.2 0.2 4.4 5.1 5.1 - - -India 43.3 45.4 44.1 0.3 0.2 0.2 0.9 0.9 0.8Indonesia 21.4 25.7 26.3 1.2 1.1 0.9 0.2 - 0.1Iran, Islamic Republic of 4.3 3.7 4.1 9.3 11.9 12.9 - - -Japan 0.2 0.2 0.2 17.2 17.8 18.5 - - -Korea, Republic of 0.2 0.2 0.2 9.9 10.1 10.4 - - -Malaysia 0.1 0.1 0.1 3.8 3.5 3.6 - - -Pakistan 6.3 6.8 6.8 0.2 0.2 0.2 - - -Philippines 7.5 7.8 7.7 0.7 0.7 0.7 - - -Saudi Arabia 0.3 0.3 0.3 12.8 11.0 12.9 - - -Thailand 4.9 5.2 5.3 0.2 0.4 0.4 0.4 0.2 0.3Turkey 14.2 13.4 14.3 1.8 2.8 3.3 0.1 0.1 0.1Viet Nam 5.2 4.9 4.9 8.6 9.9 10.1 0.1 0.4 0.3
AFRICA 129.2 142.5 134.2 26.9 24.1 28.0 5.1 5.2 4.9Algeria 1.0 2.0 2.1 4.9 5.0 5.1 - - -Egypt 8.5 8.3 8.4 8.8 8.9 9.7 - - -Ethiopia 21.1 22.8 22.6 - - - 1.2 1.3 1.3Morocco 2.3 3.1 1.4 2.8 2.5 3.5 - - -Nigeria 17.8 19.2 19.2 0.5 0.4 0.4 0.2 0.2 0.2South Africa 12.6 13.7 12.2 1.5 0.3 0.7 1.4 1.7 1.5Sudan 5.4 7.6 6.0 0.3 0.2 0.3 0.3 0.4 0.2Tanzania, United Rep. of 7.0 7.3 7.4 - - - 0.3 0.3 0.3
CENTRAL AMERICA 37.7 37.3 35.8 21.8 24.6 26.0 1.5 0.6 0.8Mexico 32.9 32.6 31.2 15.2 17.4 18.7 1.4 0.6 0.8
SOUTH AMERICA 150.0 150.8 183.2 14.8 15.7 15.1 54.8 60.0 74.1Argentina 48.6 50.8 64.3 0.1 0.1 0.1 25.6 31.5 35.6Brazil 84.9 84.1 103.5 2.2 1.9 1.2 26.7 26.6 36.0Chile 2.1 1.9 1.7 1.7 2.3 2.3 0.1 0.1 0.1Colombia 1.4 1.3 1.2 5.2 5.6 5.7 - - -Peru 1.8 1.8 1.8 3.3 3.6 3.7 - - -Venezuela 1.3 0.7 0.6 1.8 1.6 1.6 - - -
NORTH AMERICA 411.4 406.6 390.6 4.8 5.4 5.0 67.6 68.6 54.0Canada 26.3 26.3 28.6 1.3 2.7 1.7 5.1 6.6 5.7United States of America 385.1 380.3 362.0 3.4 2.7 3.3 62.5 62.0 48.3
EUROPE 248.8 252.4 262.6 17.0 27.3 20.2 45.4 53.2 51.0European Union 154.8 154.3 161.1 15.8 25.5 18.8 9.8 8.5 7.9Russian Federation 42.4 36.6 40.1 0.2 0.1 0.1 9.8 8.0 9.9Serbia 6.2 7.6 7.3 0.1 0.1 0.1 1.7 2.5 1.1Ukraine 35.8 44.6 44.5 0.1 0.1 0.1 23.7 33.6 31.7
OCEANIA 15.2 11.7 11.7 0.3 0.3 0.3 8.2 4.2 5.2Australia 14.6 11.1 11.1 - - - 8.2 4.2 5.2
WORLD 1 396.5 1 407.9 1 425.5 185.6 195.3 195.3 187.3 197.8 195.3LIFDC 141.8 152.9 148.7 16.8 18.4 19.0 3.9 4.5 4.1LDC 86.4 95.5 92.1 4.7 5.0 5.6 5.0 5.2 5.0
APPENDIX TABLE 3(A): COARSE GRAIN STATISTICS
Production Imports Exports
(. . . . . . . . . . . . . . . . . . . . . . . . . . . . . . . . . . . . . . . . . . million tonnes . . . . . . . . . . . . . . . . . . . . . . . . . . . . . . . . . . . . . . . . . . )
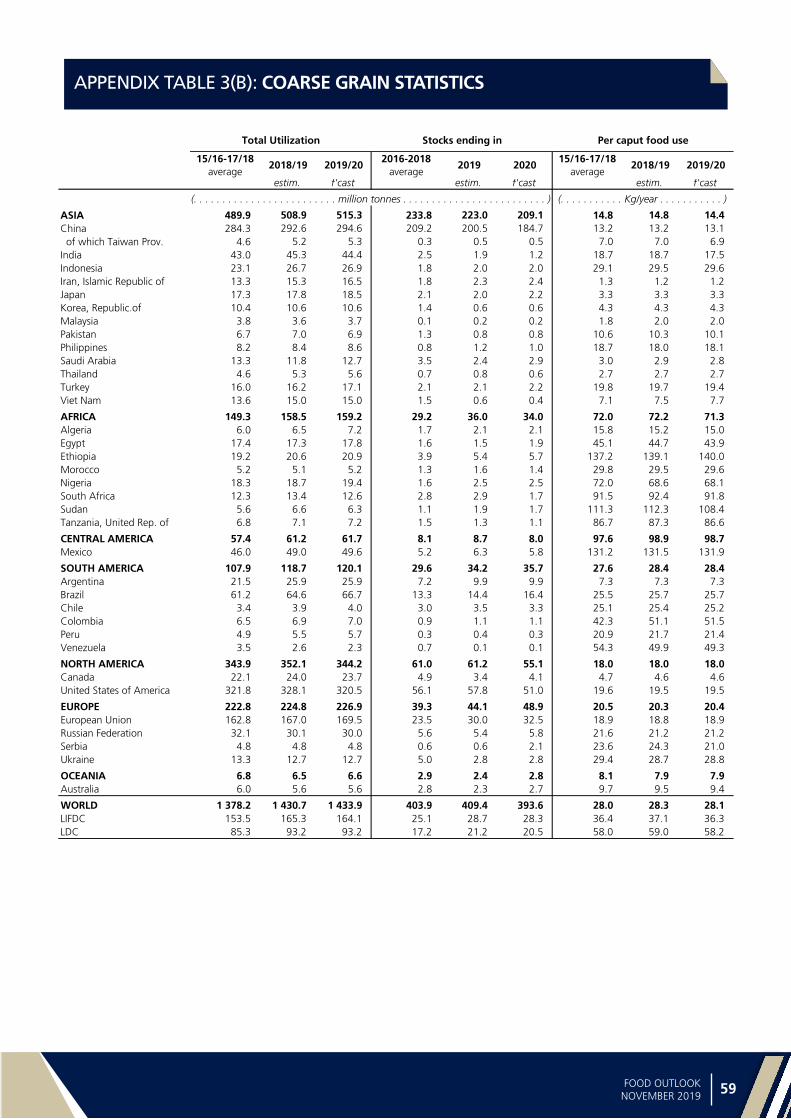
58 59FOOD OUTLOOKNOVEMBER 2019
FOOD OUTLOOKNOVEMBER 2019
APPENDIX TABLE 3(B): COARSE GRAIN STATISTICS
15/16-17/18
average2018/19 2019/20
2016-2018average
2019 202015/16-17/18
average2018/19 2019/20
estim. f'cast estim. f'cast estim. f'cast
ASIA 489.9 508.9 515.3 233.8 223.0 209.1 14.8 14.8 14.4China 284.3 292.6 294.6 209.2 200.5 184.7 13.2 13.2 13.1 of which Taiwan Prov. 4.6 5.2 5.3 0.3 0.5 0.5 7.0 7.0 6.9India 43.0 45.3 44.4 2.5 1.9 1.2 18.7 18.7 17.5Indonesia 23.1 26.7 26.9 1.8 2.0 2.0 29.1 29.5 29.6Iran, Islamic Republic of 13.3 15.3 16.5 1.8 2.3 2.4 1.3 1.2 1.2Japan 17.3 17.8 18.5 2.1 2.0 2.2 3.3 3.3 3.3Korea, Republic.of 10.4 10.6 10.6 1.4 0.6 0.6 4.3 4.3 4.3Malaysia 3.8 3.6 3.7 0.1 0.2 0.2 1.8 2.0 2.0Pakistan 6.7 7.0 6.9 1.3 0.8 0.8 10.6 10.3 10.1Philippines 8.2 8.4 8.6 0.8 1.2 1.0 18.7 18.0 18.1Saudi Arabia 13.3 11.8 12.7 3.5 2.4 2.9 3.0 2.9 2.8Thailand 4.6 5.3 5.6 0.7 0.8 0.6 2.7 2.7 2.7Turkey 16.0 16.2 17.1 2.1 2.1 2.2 19.8 19.7 19.4Viet Nam 13.6 15.0 15.0 1.5 0.6 0.4 7.1 7.5 7.7
AFRICA 149.3 158.5 159.2 29.2 36.0 34.0 72.0 72.2 71.3Algeria 6.0 6.5 7.2 1.7 2.1 2.1 15.8 15.2 15.0Egypt 17.4 17.3 17.8 1.6 1.5 1.9 45.1 44.7 43.9Ethiopia 19.2 20.6 20.9 3.9 5.4 5.7 137.2 139.1 140.0Morocco 5.2 5.1 5.2 1.3 1.6 1.4 29.8 29.5 29.6Nigeria 18.3 18.7 19.4 1.6 2.5 2.5 72.0 68.6 68.1South Africa 12.3 13.4 12.6 2.8 2.9 1.7 91.5 92.4 91.8Sudan 5.6 6.6 6.3 1.1 1.9 1.7 111.3 112.3 108.4Tanzania, United Rep. of 6.8 7.1 7.2 1.5 1.3 1.1 86.7 87.3 86.6
CENTRAL AMERICA 57.4 61.2 61.7 8.1 8.7 8.0 97.6 98.9 98.7Mexico 46.0 49.0 49.6 5.2 6.3 5.8 131.2 131.5 131.9
SOUTH AMERICA 107.9 118.7 120.1 29.6 34.2 35.7 27.6 28.4 28.4Argentina 21.5 25.9 25.9 7.2 9.9 9.9 7.3 7.3 7.3Brazil 61.2 64.6 66.7 13.3 14.4 16.4 25.5 25.7 25.7Chile 3.4 3.9 4.0 3.0 3.5 3.3 25.1 25.4 25.2Colombia 6.5 6.9 7.0 0.9 1.1 1.1 42.3 51.1 51.5Peru 4.9 5.5 5.7 0.3 0.4 0.3 20.9 21.7 21.4Venezuela 3.5 2.6 2.3 0.7 0.1 0.1 54.3 49.9 49.3
NORTH AMERICA 343.9 352.1 344.2 61.0 61.2 55.1 18.0 18.0 18.0Canada 22.1 24.0 23.7 4.9 3.4 4.1 4.7 4.6 4.6United States of America 321.8 328.1 320.5 56.1 57.8 51.0 19.6 19.5 19.5
EUROPE 222.8 224.8 226.9 39.3 44.1 48.9 20.5 20.3 20.4European Union 162.8 167.0 169.5 23.5 30.0 32.5 18.9 18.8 18.9Russian Federation 32.1 30.1 30.0 5.6 5.4 5.8 21.6 21.2 21.2Serbia 4.8 4.8 4.8 0.6 0.6 2.1 23.6 24.3 21.0Ukraine 13.3 12.7 12.7 5.0 2.8 2.8 29.4 28.7 28.8
OCEANIA 6.8 6.5 6.6 2.9 2.4 2.8 8.1 7.9 7.9Australia 6.0 5.6 5.6 2.8 2.3 2.7 9.7 9.5 9.4
WORLD 1 378.2 1 430.7 1 433.9 403.9 409.4 393.6 28.0 28.3 28.1LIFDC 153.5 165.3 164.1 25.1 28.7 28.3 36.4 37.1 36.3LDC 85.3 93.2 93.2 17.2 21.2 20.5 58.0 59.0 58.2
APPENDIX TABLE 3(B): COARSE GRAIN STATISTICS
Total Utilization Stocks ending in Per caput food use
(. . . . . . . . . . . . . . . . . . . . . . . . . million tonnes . . . . . . . . . . . . . . . . . . . . . . . . . ) (. . . . . . . . . . . Kg/year . . . . . . . . . . . )

Sta
tist
ica
l a
pp
en
dix
60 61FOOD OUTLOOKNOVEMBER 2019
FOOD OUTLOOKNOVEMBER 2019
APPENDIX TABLE 4(A): MAIZE STATISTICS
2015-2017
average2018 2019
15/16-17/18average
2018/19 2019/2015/16-17/18
average2018/19 2019/20
estim. f'cast estim. f'cast estim. f'cast
ASIA 356.1 357.9 357.5 67.7 76.4 77.4 3.4 3.8 3.9China 262.7 257.3 254.2 7.9 9.5 8.1 0.1 - - of which Taiwan Prov. 0.2 0.2 0.2 4.3 5.0 5.0 - - -India 25.8 27.2 28.4 0.2 0.1 0.1 0.7 0.7 0.8Indonesia 21.4 25.7 26.3 1.2 1.0 0.8 0.2 - 0.1Iran, Islamic Republic of 1.2 0.9 1.1 7.4 9.2 9.9 - - -Japan - - - 15.2 16.0 16.5 - - -Korea, Republic.of 0.1 0.1 0.1 9.8 10.0 10.2 - - -Malaysia 0.1 0.1 0.1 3.8 3.5 3.6 - - -Pakistan 5.8 6.3 6.3 - - - - - -Philippines 7.5 7.8 7.7 0.6 0.7 0.7 - - -Thailand 4.7 5.0 5.1 0.1 0.4 0.4 0.4 0.2 0.2Turkey 6.2 5.7 6.0 1.5 2.5 3.0 0.1 - 0.1Viet Nam 5.2 4.9 4.9 8.5 9.8 10.0 0.1 0.4 0.3
AFRICA 76.7 83.0 78.8 22.7 20.5 23.8 3.8 3.8 3.6Algeria - - - 4.2 4.4 4.5 - - -Egypt 7.6 7.3 7.4 8.8 8.9 9.7 - - -Ethiopia 8.0 9.5 9.4 - - - 0.7 0.8 0.8Kenya 3.4 4.0 3.2 1.1 0.7 1.2 - - -Morocco 0.1 0.1 0.1 2.2 2.3 2.6 - - -Nigeria 10.1 11.0 11.0 0.4 0.4 0.4 0.2 0.2 0.2South Africa 12.1 13.1 11.6 2.1 0.2 0.5 1.3 1.6 1.5Tanzania, United Rep. of 5.9 6.1 6.2 - - - 0.3 0.3 0.3
CENTRAL AMERICA 31.4 31.1 29.9 21.1 23.9 25.3 1.5 0.6 0.8Mexico 26.9 26.7 25.6 14.5 16.8 18.0 1.4 0.6 0.8
SOUTH AMERICA 136.8 137.0 169.5 13.4 14.3 13.8 51.3 56.8 71.1Argentina 41.0 43.5 57.0 - - - 22.3 28.5 32.8Brazil 82.2 80.7 100.0 1.5 1.2 0.6 26.7 26.5 36.0Chile 1.3 1.1 1.0 1.6 2.1 2.2 - - -Colombia 1.4 1.2 1.2 4.8 5.3 5.4 - - -Peru 1.6 1.6 1.5 3.2 3.4 3.6 - - -Venezuela 1.3 0.7 0.6 1.7 1.6 1.6 - - -
NORTH AMERICA 381.0 380.2 362.1 2.6 3.4 2.6 56.8 61.7 47.6Canada 13.9 13.9 14.1 1.2 2.6 1.6 1.6 2.2 1.6United States of America 367.1 366.3 348.0 1.4 0.7 1.0 55.1 59.5 46.0
EUROPE 110.9 128.2 124.3 15.7 25.2 18.4 28.1 39.1 34.4European Union 62.5 69.3 66.7 14.9 24.2 17.5 2.2 3.5 2.0Russian Federation 13.9 11.4 13.0 0.1 - - 5.3 2.9 4.4Serbia 5.6 7.0 6.7 - - - 1.6 2.4 1.0Ukraine 25.4 35.8 34.0 0.1 - - 18.6 29.8 26.5
OCEANIA 0.6 0.6 0.6 0.2 0.2 0.2 0.1 0.1 0.1
WORLD 1 093.5 1 118.1 1 122.6 143.3 163.8 161.5 144.9 165.9 161.5LIFDC 81.9 88.6 87.9 15.0 16.6 17.6 2.6 3.0 2.9LDC 47.3 52.2 51.4 3.9 4.3 4.7 3.8 3.9 3.9
APPENDIX TABLE 4(A): MAIZE STATISTICS
Production Imports Exports
(. . . . . . . . . . . . . . . . . . . . . . . . . . . . . . . . . . . . . . . . . . million tonnes . . . . . . . . . . . . . . . . . . . . . . . . . . . . . . . . . . . . . . . . . . )

60 61FOOD OUTLOOKNOVEMBER 2019
FOOD OUTLOOKNOVEMBER 2019
APPENDIX TABLE 4(B): MAIZE STATISTICS
15/16-17/18
average2018/19 2019/20
2016-2018average
2019 202015/16-17/18
average2018/19 2019/20
estim. f'cast estim. f'cast estim. f'cast
ASIA 410.7 439.9 448.0 221.1 211.9 193.5 9.3 9.4 9.3China 260.3 275.9 279.4 205.3 196.7 179.0 9.9 9.9 9.9 of which Taiwan Prov. 4.4 5.1 5.2 0.3 0.5 0.5 5.5 5.5 5.5India 25.1 27.1 28.3 1.4 1.5 1.0 6.3 6.4 6.4Indonesia 23.0 26.7 26.8 1.8 2.0 2.0 28.8 29.2 29.3Iran, Islamic Republic of 8.5 9.9 10.6 1.0 1.5 1.5 0.9 0.9 0.9Japan 15.2 15.7 16.3 1.8 1.7 1.9 0.8 0.8 0.8Korea, Republic.of 10.1 10.3 10.3 1.4 0.6 0.5 1.9 2.0 1.9Malaysia 3.8 3.6 3.7 0.1 0.2 0.2 1.8 2.0 2.0Pakistan 6.0 6.3 6.2 1.3 0.8 0.8 8.3 8.3 8.1Philippines 8.1 8.4 8.6 0.8 1.2 1.0 18.6 17.9 18.1Thailand 4.4 5.1 5.4 0.7 0.8 0.6 1.2 1.2 1.2Turkey 7.7 8.2 8.5 1.0 1.0 1.0 16.1 16.1 15.9Viet Nam 13.5 14.9 14.9 1.5 0.6 0.4 7.0 7.5 7.7
AFRICA 93.6 99.4 100.4 18.0 21.9 20.4 39.5 39.6 39.6Algeria 4.2 4.4 4.5 1.3 1.2 1.2 3.4 3.3 3.3Egypt 16.4 16.3 16.8 1.5 1.4 1.8 42.0 41.8 41.0Ethiopia 7.2 8.2 8.3 0.7 1.3 1.6 44.3 48.3 48.1Kenya 4.4 4.8 4.7 0.5 0.4 0.2 81.7 83.0 82.9Morocco 2.3 2.2 2.7 0.7 1.1 1.2 10.2 10.4 10.4Nigeria 10.4 10.6 11.2 1.2 2.0 2.0 33.0 31.1 31.1South Africa 11.6 12.5 11.8 2.5 2.7 1.5 88.8 89.7 89.1Tanzania, United Rep. of 5.7 5.9 6.0 1.3 1.1 1.0 69.7 69.6 69.1
CENTRAL AMERICA 50.4 54.4 55.0 7.7 8.1 7.5 96.8 98.2 98.0Mexico 39.3 42.6 43.2 4.9 5.8 5.4 130.8 131.2 131.5
SOUTH AMERICA 96.3 107.2 108.5 26.9 31.5 33.1 25.9 26.8 26.8Argentina 16.9 22.0 22.0 6.3 9.0 9.0 7.1 7.1 7.1Brazil 57.8 60.5 62.5 12.8 14.0 16.0 24.1 24.2 24.2Chile 2.5 3.0 3.1 2.4 2.8 2.8 21.2 21.4 21.2Colombia 6.1 6.6 6.6 0.9 1.1 1.1 41.3 50.6 51.0Peru 4.6 5.1 5.4 0.3 0.4 0.3 14.5 15.4 15.8Venezuela 3.4 2.6 2.2 0.7 - - 53.8 49.4 48.8
NORTH AMERICA 322.0 330.3 320.9 54.7 55.7 48.8 14.8 14.8 14.8Canada 13.1 15.2 14.0 2.4 2.0 1.8 3.2 3.2 3.1United States of America 308.9 315.2 307.0 52.3 53.7 47.0 16.1 16.1 16.1
EUROPE 99.2 109.6 108.0 18.7 27.3 27.5 8.1 8.1 8.1European Union 74.8 85.7 83.7 11.3 20.0 18.5 9.5 9.5 9.5Russian Federation 8.5 8.1 8.5 1.2 1.7 1.8 1.4 1.4 1.4Serbia 4.2 4.3 4.3 0.6 0.5 1.9 21.8 22.5 19.2Ukraine 7.9 7.6 7.6 3.3 1.0 0.9 11.2 11.1 11.1
OCEANIA 0.7 0.7 0.7 0.1 0.1 0.1 2.3 2.3 2.3
WORLD 1 072.9 1 141.6 1 141.5 347.0 356.4 331.0 17.9 18.1 18.2LIFDC 93.0 102.6 103.5 13.9 15.5 14.6 17.3 17.7 17.8LDC 46.9 52.4 52.8 8.2 9.9 9.2 27.6 28.1 28.1
APPENDIX TABLE 4(B): MAIZE STATISTICS
Total Utilization Stocks ending in Per caput food use
(. . . . . . . . . . . . . . . . . . . . . . . . . million tonnes . . . . . . . . . . . . . . . . . . . . . . . . . ) (. . . . . . . . . . . Kg/year . . . . . . . . . . . )

Sta
tist
ica
l a
pp
en
dix
62 63FOOD OUTLOOKNOVEMBER 2019
FOOD OUTLOOKNOVEMBER 2019
APPENDIX TABLE 5(A): BARLEY STATISTICS
2015-2017
average2018 2019
15/16-17/18average
2018/19 2019/2015/16-17/18
average2018/19 2019/20
estim. f'cast estim. f'cast estim. f'cast
ASIA 20.6 20.6 24.2 24.0 19.6 20.8 1.0 1.8 1.4China 1.9 1.8 2.0 7.9 5.5 5.5 - - -India 1.6 1.8 1.8 0.3 0.1 0.1 - - -Iran, Islamic Republic of 3.1 2.8 3.0 1.9 2.7 3.0 - - -Iraq 0.4 0.4 0.7 - - - - - -Japan 0.2 0.2 0.2 1.2 1.2 1.3 - - -Kazakhstan 3.1 4.0 4.5 - - - 1.0 1.8 1.3Saudi Arabia - - - 9.1 6.5 7.7 - - -Syrian Arab Republic 0.6 0.4 2.0 0.4 0.6 - - - -Turkey 7.3 7.0 7.6 0.5 0.3 0.3 - - -
AFRICA 6.2 7.7 6.5 3.1 2.5 3.0 - - -Algeria 1.0 2.0 2.0 0.7 0.6 0.6 - - -Ethiopia 2.0 1.8 1.8 - - - - - -Libya 0.1 0.1 0.1 1.1 1.0 1.0 - - -Morocco 2.2 2.9 1.3 0.6 0.2 0.8 - - -Tunisia 0.4 0.3 0.7 0.6 0.7 0.5 - - -
CENTRAL AMERICA 0.9 1.0 1.0 0.2 - - - - -Mexico 0.9 1.0 1.0 0.2 - - - - -
SOUTH AMERICA 5.1 6.5 6.4 1.1 1.2 1.1 2.8 3.0 2.6Argentina 4.0 5.1 5.0 - - - 2.7 2.9 2.5
NORTH AMERICA 12.4 11.7 13.7 0.3 0.2 0.3 1.7 2.5 2.0Canada 8.3 8.4 10.0 0.1 - - 1.6 2.4 1.9United States of America 4.1 3.3 3.7 0.3 0.1 0.3 0.1 0.1 0.1
EUROPE 90.6 83.3 93.0 0.7 0.5 1.0 16.5 12.9 15.8Belarus 1.5 0.9 1.5 0.1 0.2 0.1 - - -European Union 60.2 56.5 61.9 0.4 0.1 0.7 7.2 4.6 5.5Russian Federation 18.7 17.0 19.0 0.1 - - 4.3 4.6 5.2Ukraine 8.7 7.3 9.0 - - - 4.8 3.6 5.0
OCEANIA 11.0 8.7 8.4 - - - 7.0 3.8 4.5Australia 10.6 8.3 8.0 - - - 7.0 3.8 4.5
WORLD 146.9 139.6 153.1 29.3 24.1 26.2 29.1 24.1 26.2LIFDC 5.4 4.9 6.6 0.8 0.9 0.4 - - -LDC 2.5 2.0 2.0 - - - - - -
APPENDIX TABLE 5(A): BARLEY STATISTICS
Production Imports Exports
(. . . . . . . . . . . . . . . . . . . . . . . . . . . . . . . . . . . . . . . . . . million tonnes . . . . . . . . . . . . . . . . . . . . . . . . . . . . . . . . . . . . . . . . . . )
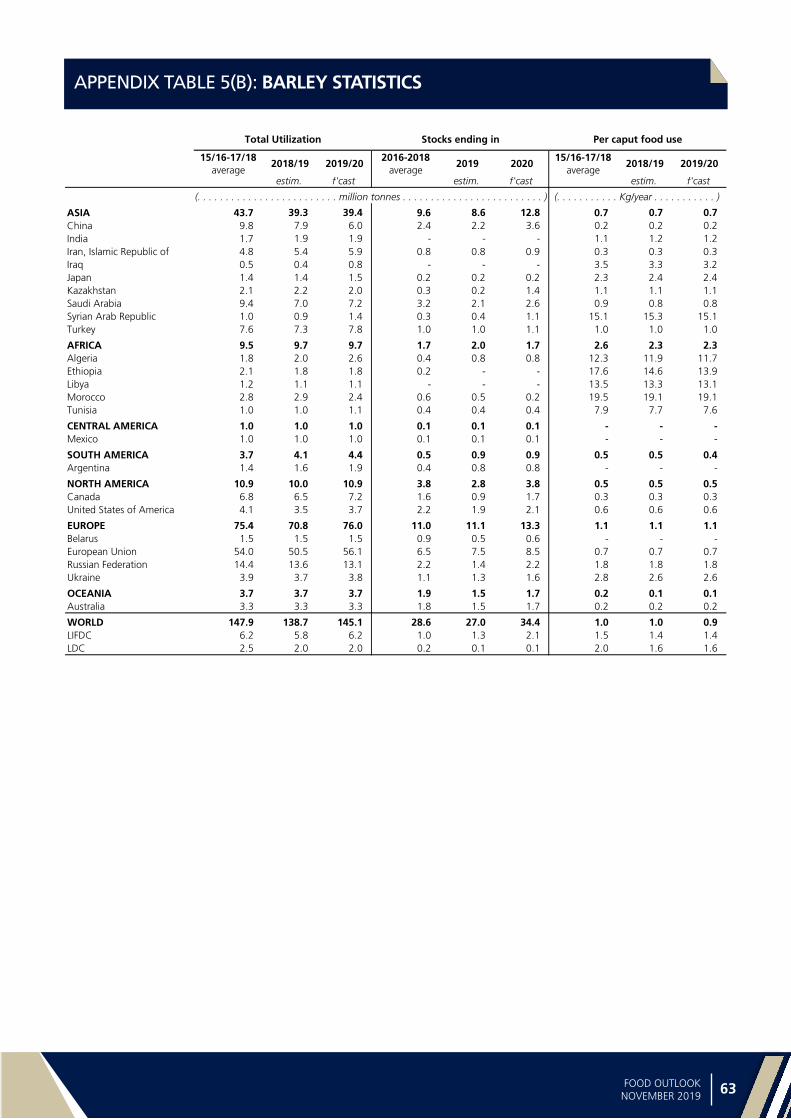
62 63FOOD OUTLOOKNOVEMBER 2019
FOOD OUTLOOKNOVEMBER 2019
APPENDIX TABLE 5(B): BARLEY STATISTICS
15/16-17/18
average2018/19 2019/20
2016-2018average
2019 202015/16-17/18
average2018/19 2019/20
estim. f'cast estim. f'cast estim. f'cast
ASIA 43.7 39.3 39.4 9.6 8.6 12.8 0.7 0.7 0.7China 9.8 7.9 6.0 2.4 2.2 3.6 0.2 0.2 0.2India 1.7 1.9 1.9 - - - 1.1 1.2 1.2Iran, Islamic Republic of 4.8 5.4 5.9 0.8 0.8 0.9 0.3 0.3 0.3Iraq 0.5 0.4 0.8 - - - 3.5 3.3 3.2Japan 1.4 1.4 1.5 0.2 0.2 0.2 2.3 2.4 2.4Kazakhstan 2.1 2.2 2.0 0.3 0.2 1.4 1.1 1.1 1.1Saudi Arabia 9.4 7.0 7.2 3.2 2.1 2.6 0.9 0.8 0.8Syrian Arab Republic 1.0 0.9 1.4 0.3 0.4 1.1 15.1 15.3 15.1Turkey 7.6 7.3 7.8 1.0 1.0 1.1 1.0 1.0 1.0
AFRICA 9.5 9.7 9.7 1.7 2.0 1.7 2.6 2.3 2.3Algeria 1.8 2.0 2.6 0.4 0.8 0.8 12.3 11.9 11.7Ethiopia 2.1 1.8 1.8 0.2 - - 17.6 14.6 13.9Libya 1.2 1.1 1.1 - - - 13.5 13.3 13.1Morocco 2.8 2.9 2.4 0.6 0.5 0.2 19.5 19.1 19.1Tunisia 1.0 1.0 1.1 0.4 0.4 0.4 7.9 7.7 7.6
CENTRAL AMERICA 1.0 1.0 1.0 0.1 0.1 0.1 - - -Mexico 1.0 1.0 1.0 0.1 0.1 0.1 - - -
SOUTH AMERICA 3.7 4.1 4.4 0.5 0.9 0.9 0.5 0.5 0.4Argentina 1.4 1.6 1.9 0.4 0.8 0.8 - - -
NORTH AMERICA 10.9 10.0 10.9 3.8 2.8 3.8 0.5 0.5 0.5Canada 6.8 6.5 7.2 1.6 0.9 1.7 0.3 0.3 0.3United States of America 4.1 3.5 3.7 2.2 1.9 2.1 0.6 0.6 0.6
EUROPE 75.4 70.8 76.0 11.0 11.1 13.3 1.1 1.1 1.1Belarus 1.5 1.5 1.5 0.9 0.5 0.6 - - -European Union 54.0 50.5 56.1 6.5 7.5 8.5 0.7 0.7 0.7Russian Federation 14.4 13.6 13.1 2.2 1.4 2.2 1.8 1.8 1.8Ukraine 3.9 3.7 3.8 1.1 1.3 1.6 2.8 2.6 2.6
OCEANIA 3.7 3.7 3.7 1.9 1.5 1.7 0.2 0.1 0.1Australia 3.3 3.3 3.3 1.8 1.5 1.7 0.2 0.2 0.2
WORLD 147.9 138.7 145.1 28.6 27.0 34.4 1.0 1.0 0.9LIFDC 6.2 5.8 6.2 1.0 1.3 2.1 1.5 1.4 1.4LDC 2.5 2.0 2.0 0.2 0.1 0.1 2.0 1.6 1.6
APPENDIX TABLE 5(B): BARLEY STATISTICS
Total Utilization Stocks ending in Per caput food use
(. . . . . . . . . . . . . . . . . . . . . . . . . million tonnes . . . . . . . . . . . . . . . . . . . . . . . . . ) (. . . . . . . . . . . Kg/year . . . . . . . . . . . )

Sta
tist
ica
l a
pp
en
dix
64 65FOOD OUTLOOKNOVEMBER 2019
FOOD OUTLOOKNOVEMBER 2019
APPENDIX TABLE 6(A): SORGHUM STATISTICS
APPENDIX TABLE 7(A): OTHER COARSE GRAIN STATISTICS: MILLET - RYE - OATS AND OTHER GRAINS
2015-2017
average2018 2019
15/16-17/18average
2018/19 2019/2015/16-17/18
average2018/19 2019/20
estim. f'cast estim. f'cast estim. f'cast
ASIA 8.7 9.2 8.2 7.6 1.1 1.8 0.1 0.2 -China 3.0 3.4 3.5 6.9 0.5 1.1 - - -India 4.7 4.8 3.8 - - - 0.1 0.1 -Japan - - - 0.6 0.5 0.6 - - -
AFRICA 26.9 28.6 27.7 1.0 1.0 1.1 0.8 1.0 0.8Burkina Faso 1.5 1.9 1.6 - - - - - -Ethiopia 4.9 5.0 5.0 - - - 0.4 0.5 0.5Nigeria 6.2 6.0 6.3 - - - - - -Sudan 4.4 5.0 4.5 0.2 0.2 0.3 0.3 0.3 0.2
CENTRAL AMERICA 5.4 5.1 4.8 0.4 0.4 0.5 - - -Mexico 5.0 4.8 4.5 0.4 0.4 0.5 - - -
SOUTH AMERICA 5.8 4.9 4.9 0.1 0.1 0.1 0.6 0.1 0.3Argentina 2.9 1.6 1.6 - - - 0.6 0.1 0.3Brazil 1.7 2.1 2.1 - - - - - -Venezuela 0.1 - - - - - - - -
NORTH AMERICA 12.2 9.3 8.9 0.1 - - 7.0 2.2 2.1United States of America 12.2 9.3 8.9 0.1 - - 7.0 2.2 2.1
EUROPE 1.1 1.1 1.2 0.2 0.8 0.3 0.2 0.1 0.1European Union 0.7 0.8 1.0 0.2 0.8 0.2 - - -
OCEANIA 1.7 1.3 1.3 0.1 - - 0.7 0.2 0.4Australia 1.7 1.3 1.3 - - - 0.7 0.2 0.4
WORLD 61.7 59.4 57.0 9.5 3.4 3.8 9.5 3.8 3.8LIFDC 24.9 26.7 24.6 0.8 0.8 0.9 0.8 1.0 0.8LDC 19.0 20.6 19.6 0.7 0.6 0.8 0.7 0.9 0.7
APPENDIX TABLE 6(A): SORGHUM STATISTICS
Production Imports Exports
(. . . . . . . . . . . . . . . . . . . . . . . . . . . . . . . . . . . . . . . . . . million tonnes . . . . . . . . . . . . . . . . . . . . . . . . . . . . . . . . . . . . . . . . . . )
2015-2017 average
2018 201915/16-17/18
average2018/19 2019/20
15/16-17/18average
2018/19 2019/20
estim. f'cast estim. f'cast estim. f'cast
ASIA 18.9 18.8 17.4 0.8 0.7 0.8 0.2 0.2 #VALUE!
AFRICA 19.4 23.2 21.2 0.2 0.1 0.1 0.5 0.4 0.5
CENTRAL AMERICA 0.1 0.1 0.1 0.1 0.3 0.2 - - -
SOUTH AMERICA 2.4 2.4 2.4 0.2 0.1 0.1 0.1 0.1 0.1
NORTH AMERICA 5.7 5.4 5.9 1.8 1.8 2.1 2.1 2.2 2.3
EUROPE 46.1 39.8 44.1 0.4 0.8 0.5 0.7 1.1 0.7
OCEANIA 1.9 1.1 1.4 - 0.1 0.1 0.3 0.1 0.2
WORLD 94.4 90.8 92.8 3.5 4.0 3.8 3.8 4.0 3.8
APPENDIX TABLE 7(A): OTHER COARSE GRAIN STATISTICS: MILLET, RYE, OATS AND OTHER GRAINS
Production Imports Exports
(. . . . . . . . . . . . . . . . . . . . . . . . . . . . . . . . . . . . . . . . . . million tonnes . . . . . . . . . . . . . . . . . . . . . . . . . . . . . . . . . . . . . . . . . . )

64 65FOOD OUTLOOKNOVEMBER 2019
FOOD OUTLOOKNOVEMBER 2019
APPENDIX TABLE 7(B): OTHER COARSE GRAIN STATISTICS: MILLET - RYE - OATS AND OTHER GRAINS
APPENDIX TABLE 6(B): SORGHUM STATISTICS
15/16-17/18
average2018/19 2019/20
2016-2018average
2019 202015/16-17/18
average2018/19 2019/20
estim. f'cast estim. f'cast estim. f'cast
ASIA 15.6 10.0 9.3 1.2 1.4 2.0 1.3 1.3 1.1China 9.1 3.8 4.0 0.8 1.0 1.6 0.5 0.5 0.5India 4.7 4.7 3.8 0.4 - - 3.5 3.4 2.7Japan 0.6 0.5 0.6 0.1 0.1 0.1 - - -
AFRICA 27.7 28.7 28.3 3.9 3.7 3.4 18.0 17.7 17.3Burkina Faso 1.6 1.8 1.6 0.4 0.5 0.5 74.4 84.8 72.8Ethiopia 4.4 4.5 4.5 0.6 0.8 0.8 32.4 31.7 31.8Nigeria 6.4 6.0 6.3 0.1 - - 32.2 28.6 29.2Sudan 4.7 5.2 4.8 0.7 0.3 0.1 95.3 92.8 89.4
CENTRAL AMERICA 5.8 5.4 5.4 0.3 0.5 0.4 0.6 0.5 0.5Mexico 5.5 5.1 5.1 0.2 0.4 0.3 - - -
SOUTH AMERICA 5.7 5.0 4.6 1.6 1.1 1.1 0.1 0.0 0.0Argentina 2.4 1.6 1.2 0.5 0.1 0.1 - - -Brazil 1.8 2.1 2.1 0.3 0.2 0.2 - - -Venezuela 0.1 - 0.1 - - - - - -
NORTH AMERICA 5.5 6.2 6.6 0.9 1.6 1.3 0.1 0.1 0.1United States of America 5.5 6.2 6.6 0.9 1.6 1.3 0.1 0.1 0.1
EUROPE 1.2 1.4 1.0 0.3 0.8 1.1 0.2 0.2 0.2European Union 0.9 1.3 0.8 0.2 0.7 1.1 0.3 0.3 0.3
OCEANIA 0.8 0.9 0.8 0.8 0.7 0.9 0.2 0.2 0.2Australia 0.7 0.9 0.8 0.8 0.7 0.9 - - -
WORLD 62.2 57.6 56.1 9.1 9.7 10.2 3.8 3.8 3.6LIFDC 25.4 26.6 25.0 4.0 3.7 3.4 8.2 8.3 7.7LDC 19.2 20.5 19.9 3.6 3.5 3.2 15.0 15.3 14.7
APPENDIX TABLE 6(B): SORGHUM STATISTICS
Total Utilization Stocks ending in Per caput food use
(. . . . . . . . . . . . . . . . . . . . . . . . . million tonnes . . . . . . . . . . . . . . . . . . . . . . . . . ) (. . . . . . . . . . . Kg/year . . . . . . . . . . . )
15/16-17/18average
2018/19 2019/202016-2018
average2019 2020
15/16-17/18average
2018/19 2019/20
estim. f'cast estim. f'cast estim. f'cast
ASIA 20.0 19.7 18.6 1.9 1.1 0.8 3.5 3.4 3.3
AFRICA 18.5 20.7 20.8 5.5 8.4 8.5 11.8 12.6 12.1
CENTRAL AMERICA 0.3 0.4 0.3 - - - 0.2 0.2 0.2
SOUTH AMERICA 2.3 2.4 2.6 0.7 0.7 0.6 1.1 1.1 1.2
NORTH AMERICA 5.4 5.6 5.8 1.7 1.1 1.2 2.6 2.6 2.6
EUROPE 47.1 43.0 41.9 9.3 4.9 7.0 11.0 10.9 11.0
OCEANIA 1.6 1.2 1.4 0.1 0.1 0.1 5.5 5.3 5.3
WORLD 95.2 92.8 91.2 19.2 16.3 18.0 5.3 5.4 5.4
APPENDIX TABLE 7(B): OTHER COARSE GRAIN STATISTICS: MILLET, RYE, OATS AND OTHER GRAINS
Total Utilization Stocks ending in Per caput food use
(. . . . . . . . . . . . . . . . . . . . . . . . . million tonnes . . . . . . . . . . . . . . . . . . . . . . . . . ) (. . . . . . . . . . . Kg/year . . . . . . . . . . . )
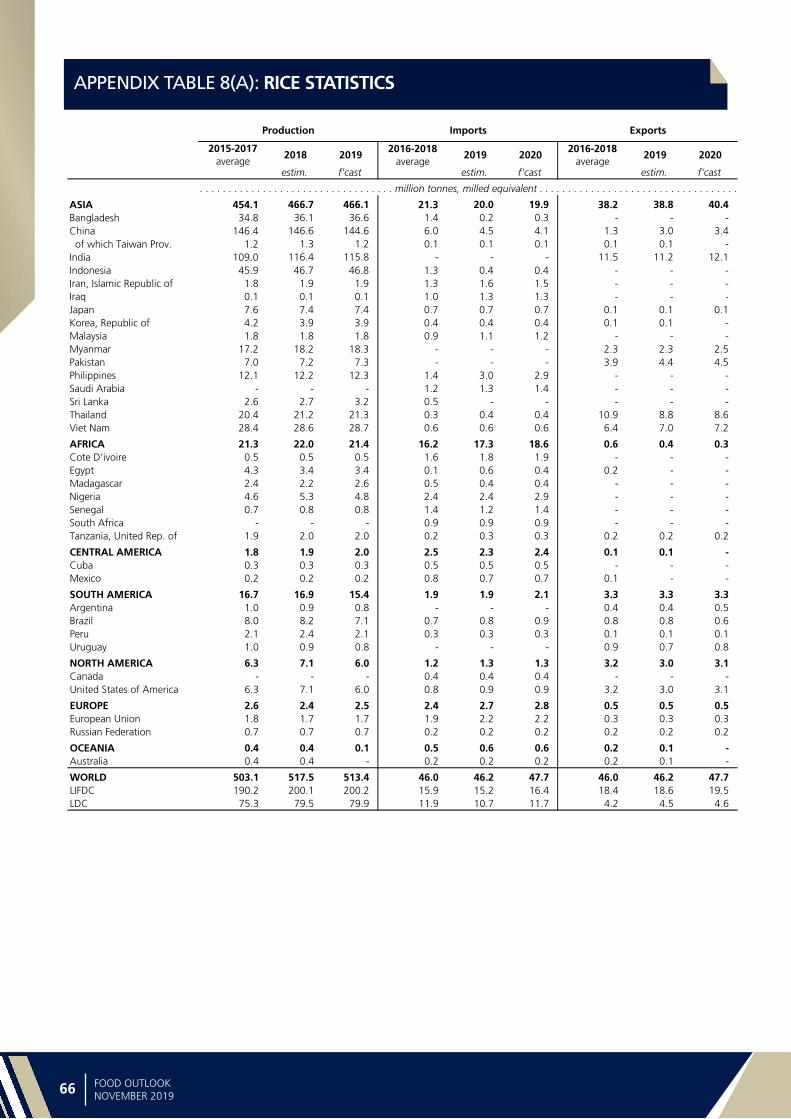
Sta
tist
ica
l a
pp
en
dix
66 67FOOD OUTLOOKNOVEMBER 2019
FOOD OUTLOOKNOVEMBER 2019
APPENDIX TABLE 8(A): RICE STATISTICS
2015-2017
average2018 2019
2016-2018average
2019 20202016-2018
average2019 2020
estim. f'cast estim. f'cast estim. f'cast
ASIA 454.1 466.7 466.1 21.3 20.0 19.9 38.2 38.8 40.4Bangladesh 34.8 36.1 36.6 1.4 0.2 0.3 - - -China 146.4 146.6 144.6 6.0 4.5 4.1 1.3 3.0 3.4 of which Taiwan Prov. 1.2 1.3 1.2 0.1 0.1 0.1 0.1 0.1 -India 109.0 116.4 115.8 - - - 11.5 11.2 12.1Indonesia 45.9 46.7 46.8 1.3 0.4 0.4 - - -Iran, Islamic Republic of 1.8 1.9 1.9 1.3 1.6 1.5 - - -Iraq 0.1 0.1 0.1 1.0 1.3 1.3 - - -Japan 7.6 7.4 7.4 0.7 0.7 0.7 0.1 0.1 0.1Korea, Republic of 4.2 3.9 3.9 0.4 0.4 0.4 0.1 0.1 -Malaysia 1.8 1.8 1.8 0.9 1.1 1.2 - - -Myanmar 17.2 18.2 18.3 - - - 2.3 2.3 2.5Pakistan 7.0 7.2 7.3 - - - 3.9 4.4 4.5Philippines 12.1 12.2 12.3 1.4 3.0 2.9 - - -Saudi Arabia - - - 1.2 1.3 1.4 - - -Sri Lanka 2.6 2.7 3.2 0.5 - - - - -Thailand 20.4 21.2 21.3 0.3 0.4 0.4 10.9 8.8 8.6Viet Nam 28.4 28.6 28.7 0.6 0.6 0.6 6.4 7.0 7.2
AFRICA 21.3 22.0 21.4 16.2 17.3 18.6 0.6 0.4 0.3Cote D'ivoire 0.5 0.5 0.5 1.6 1.8 1.9 - - -Egypt 4.3 3.4 3.4 0.1 0.6 0.4 0.2 - -Madagascar 2.4 2.2 2.6 0.5 0.4 0.4 - - -Nigeria 4.6 5.3 4.8 2.4 2.4 2.9 - - -Senegal 0.7 0.8 0.8 1.4 1.2 1.4 - - -South Africa - - - 0.9 0.9 0.9 - - -Tanzania, United Rep. of 1.9 2.0 2.0 0.2 0.3 0.3 0.2 0.2 0.2
CENTRAL AMERICA 1.8 1.9 2.0 2.5 2.3 2.4 0.1 0.1 -Cuba 0.3 0.3 0.3 0.5 0.5 0.5 - - -Mexico 0.2 0.2 0.2 0.8 0.7 0.7 0.1 - -
SOUTH AMERICA 16.7 16.9 15.4 1.9 1.9 2.1 3.3 3.3 3.3Argentina 1.0 0.9 0.8 - - - 0.4 0.4 0.5Brazil 8.0 8.2 7.1 0.7 0.8 0.9 0.8 0.8 0.6Peru 2.1 2.4 2.1 0.3 0.3 0.3 0.1 0.1 0.1Uruguay 1.0 0.9 0.8 - - - 0.9 0.7 0.8
NORTH AMERICA 6.3 7.1 6.0 1.2 1.3 1.3 3.2 3.0 3.1Canada - - - 0.4 0.4 0.4 - - -United States of America 6.3 7.1 6.0 0.8 0.9 0.9 3.2 3.0 3.1
EUROPE 2.6 2.4 2.5 2.4 2.7 2.8 0.5 0.5 0.5European Union 1.8 1.7 1.7 1.9 2.2 2.2 0.3 0.3 0.3Russian Federation 0.7 0.7 0.7 0.2 0.2 0.2 0.2 0.2 0.2
OCEANIA 0.4 0.4 0.1 0.5 0.6 0.6 0.2 0.1 -Australia 0.4 0.4 - 0.2 0.2 0.2 0.2 0.1 -
WORLD 503.1 517.5 513.4 46.0 46.2 47.7 46.0 46.2 47.7LIFDC 190.2 200.1 200.2 15.9 15.2 16.4 18.4 18.6 19.5LDC 75.3 79.5 79.9 11.9 10.7 11.7 4.2 4.5 4.6
APPENDIX TABLE 8(A): RICE STATISTICS
Production Imports Exports
(. . . . . . . . . . . . . . . . . . . . . . . . . . . . . . . . . . . million tonnes, milled equivalent . . . . . . . . . . . . . . . . . . . . . . . . . . . . . . . . . . . )

66 67FOOD OUTLOOKNOVEMBER 2019
FOOD OUTLOOKNOVEMBER 2019
APPENDIX TABLE 8(B): RICE STATISTICS
15/16-17/18
average2018/19 2019/20
2016-2018average
2019 202015/16-17/18
average2018/19 2019/20
estim. f'cast estim. f'cast estim. f'cast
ASIA 437.0 441.3 447.0 160.3 172.2 171.4 77.4 77.2 77.8Bangladesh 36.2 36.8 37.1 5.8 6.6 6.4 180.7 180.3 181.7China 146.9 147.9 148.3 100.6 105.9 103.4 76.6 76.6 76.6 of which Taiwan Prov. 1.3 1.3 1.3 0.2 0.3 0.3 48.3 48.4 48.7India 97.6 98.6 102.2 20.1 28.8 30.4 68.2 68.0 69.5Indonesia 46.8 47.9 47.9 6.6 7.3 6.6 133.9 133.9 134.9Iran, Islamic Republic of 3.2 3.3 3.4 0.6 0.7 0.8 35.3 35.7 36.1Iraq 1.2 1.3 1.4 0.1 0.1 0.1 33.0 33.5 34.0Japan 8.5 8.0 7.9 3.2 3.0 3.2 49.9 49.3 49.1Korea, Republic of 4.7 4.5 4.2 1.6 0.8 0.9 76.0 74.2 72.8Malaysia 2.7 2.8 2.8 0.3 0.2 0.3 80.2 79.5 81.2Myanmar 15.0 15.4 15.6 2.7 3.0 3.3 193.8 196.7 197.1Pakistan 3.0 3.1 3.1 0.7 0.6 0.4 12.6 12.5 12.5Philippines 13.5 14.9 15.3 2.3 2.6 2.9 114.9 117.7 119.9Saudi Arabia 1.4 1.3 1.3 0.4 0.1 0.1 41.5 38.4 38.2Sri Lanka 3.0 2.8 3.0 0.5 0.3 0.5 123.1 122.7 124.8Thailand 13.4 11.8 12.5 8.2 5.4 5.6 98.8 98.2 100.6Viet Nam 22.0 22.4 22.1 3.1 3.0 3.2 154.0 153.3 152.0
AFRICA 36.4 39.2 39.7 5.6 5.4 4.9 25.9 26.8 26.8Cote D'ivoire 2.1 2.3 2.4 0.4 0.4 0.4 80.6 86.3 87.4Egypt 4.0 4.3 4.0 0.7 0.6 0.5 38.2 39.4 37.0Madagascar 2.8 2.8 3.0 0.3 0.2 0.3 99.0 97.5 99.2Nigeria 7.2 7.7 7.7 1.0 1.0 0.9 33.4 34.1 33.4Senegal 2.0 2.2 2.2 0.4 0.3 0.3 118.8 122.0 121.2South Africa 0.9 0.9 0.9 0.1 0.2 0.1 15.7 16.0 15.9Tanzania, United Rep. of 2.0 2.0 2.1 0.4 0.3 0.3 27.3 28.2 28.8
CENTRAL AMERICA 4.1 4.2 4.3 0.5 0.6 0.6 17.8 17.9 18.1Cuba 0.8 0.8 0.8 0.1 - 0.1 67.4 67.0 67.0Mexico 0.8 0.9 0.9 0.1 0.1 0.1 6.4 6.4 6.6
SOUTH AMERICA 15.2 15.0 14.8 2.4 2.4 1.9 31.9 31.1 30.9Argentina 0.5 0.6 0.5 0.3 0.2 0.1 10.3 10.7 9.8Brazil 7.9 7.6 7.4 0.5 0.5 0.4 34.5 33.0 32.3Peru 2.4 2.5 2.4 0.3 0.4 0.3 65.2 65.9 65.5Uruguay 0.1 0.1 0.1 0.2 0.1 0.1 10.9 11.8 12.0
NORTH AMERICA 4.4 5.0 4.6 1.3 1.5 1.2 9.4 9.7 9.7Canada 0.4 0.4 0.4 0.1 - - 10.4 10.5 10.6United States of America 4.0 4.6 4.2 1.3 1.4 1.2 9.3 9.6 9.6
EUROPE 4.5 4.6 4.7 0.7 0.7 0.8 5.2 5.4 5.4European Union 3.3 3.5 3.6 0.5 0.6 0.7 5.5 5.8 5.8Russian Federation 0.8 0.8 0.8 0.1 0.1 0.1 4.9 4.9 4.9
OCEANIA 0.7 0.7 0.7 0.2 0.3 0.2 16.0 16.4 16.6Australia 0.3 0.3 0.3 0.2 0.3 0.2 10.8 11.1 11.2
WORLD 502.2 510.1 515.9 171.1 183.1 180.9 53.8 53.8 54.2LIFDC 186.9 191.2 195.6 33.4 42.8 44.1 64.1 63.8 64.6LDC 82.7 85.8 87.1 14.1 15.3 15.1 66.1 65.6 65.6
Note: Totals and percentage changes are computed from unrounded data.
APPENDIX TABLE 8(B): RICE STATISTICS
Total Utilization Stocks ending in Per caput food use
(. . . . . . . . . . . . . . . . . . . million tonnes, milled equivalent . . . . . . . . . . . . . . . . . . )(. . . . . . . . . . . . Kg/year . . . . . . . . . . . . )

Sta
tist
ica
l a
pp
en
dix
68 69FOOD OUTLOOKNOVEMBER 2019
FOOD OUTLOOKNOVEMBER 2019
APPENDIX TABLE 9: CEREAL SUPPLY AND UTILIZATION IN SELECTED EXPORTERS (million tonnes)
2017/18 2018/19 2019/20 2017/18 2018/19 2019/20 2017/18 2018/19 2019/20estim. f'cast estim. f'cast estim. f'cast
Opening Stocks 32.1 29.9 29.4 62.2 57.9 57.8 1.5 0.9 1.4Production 47.4 51.3 53.4 384.8 380.3 362.0 5.7 7.1 6.0Imports 4.3 3.7 3.3 3.0 2.7 3.5 0.9 0.9 0.9
Total Supply 83.8 84.9 86.1 450.0 440.9 423.3 8.1 8.9 8.3Domestic use 29.2 30.0 31.8 324.7 328.1 320.5 4.3 4.6 4.2Exports 24.7 25.5 25.9 67.3 55.0 51.7 2.8 3.0 3.0Closing stocks 29.9 29.4 28.4 57.9 57.8 51.0 0.9 1.4 1.2
Opening Stocks 6.9 6.5 5.9 5.5 4.6 3.4 8.2 5.6 5.4Production 30.4 32.2 32.5 26.4 26.3 28.6 21.8 21.2 21.3Imports 0.1 0.1 0.1 1.8 2.9 1.7 0.2 0.3 0.4
Total Supply 37.4 38.8 38.5 33.7 33.8 33.7 30.2 27.1 27.1Domestic use 9.0 8.5 8.7 23.2 24.0 23.7 13.2 11.8 12.5Exports 21.9 24.3 23.8 5.9 6.3 5.9 11.5 9.9 9.0Closing stocks 6.5 5.9 6.0 4.6 3.4 4.1 5.6 5.4 5.6
Opening Stocks 1.3 1.6 2.0 5.9 10.6 9.9 19.5 21.8 28.8Production 18.5 19.5 19.6 56.4 50.8 64.3 112.8 116.4 115.8Imports 0.0 0.0 0.0 0.1 0.1 0.1 0.0 0.0 0.0
Total Supply 19.8 21.1 21.6 62.4 61.5 74.3 132.3 138.2 144.6Domestic use 5.8 6.2 5.8 22.7 25.9 25.9 98.2 98.6 102.2Exports 12.5 12.8 13.5 29.0 25.7 38.4 12.3 10.8 12.0Closing stocks 1.6 2.0 2.3 10.6 9.9 9.9 21.8 28.8 30.4
Opening Stocks 6.0 4.4 4.2 3.0 3.2 2.3 0.7 0.9 0.6Production 20.9 17.3 17.5 12.1 11.1 11.1 7.5 7.2 7.3Imports 0.0 0.0 0.0 0.0 0.0 0.0 0.0 0.0 0.0
Total Supply 26.9 21.7 21.7 15.1 14.3 13.4 8.2 8.1 7.9Domestic use 8.7 9.1 9.2 5.7 5.6 5.6 3.1 3.1 3.1Exports 13.8 8.5 9.5 6.2 6.4 5.1 4.1 4.4 4.4Closing stocks 4.4 4.2 3.0 3.2 2.3 2.7 0.9 0.6 0.4
Opening Stocks 12.9 20.2 14.5 21.9 24.9 30.0 3.3 3.1 3.0Production 152.0 138.6 154.0 156.0 154.3 161.1 27.8 28.6 28.7Imports 5.5 5.4 5.0 18.4 25.9 18.8 0.7 0.6 0.6
Total Supply 170.4 164.2 173.5 196.3 205.1 209.9 31.8 32.3 32.3Domestic use 127.4 127.2 129.6 164.3 167.0 169.5 22.3 22.4 22.1Exports 22.7 22.6 27.0 7.1 8.0 7.9 6.3 6.8 7.0Closing stocks 20.2 14.5 17.0 24.9 30.0 32.5 3.1 3.0 3.2
Opening Stocks 59.2 62.6 56.0 98.5 101.2 103.4 33.2 32.3 39.2Production 269.2 258.9 277.0 635.7 622.8 627.1 175.6 180.5 179.1Imports 9.9 9.2 8.4 23.3 31.6 24.1 1.8 1.8 1.9
Total Supply 338.3 330.7 341.4 757.5 755.6 754.6 210.6 214.6 220.2Domestic use 180.1 181.0 185.1 540.6 550.6 545.2 141.1 140.5 144.1Exports 95.6 93.7 99.7 115.5 101.4 109.0 37.0 34.9 35.4Closing stocks 62.6 56.0 56.7 101.2 103.4 100.2 32.3 39.2 40.81 Trade data include wheat flour in wheat grain equivalent. For the EU semolina is also included.
CANADA (August/July) CANADA THAILAND (Aug/July)
ARGENTINA (Dec./Nov.) ARGENTINA INDIA (Oct./Sept.)
APPENDIX TABLE 9: CEREAL SUPPLY AND UTILIZATION IN SELECTED EXPORTERS (million tonnes)
Wheat 1 Coarse Grains 2 Rice (milled basis)
UNITED STATES of AMERICA (Aug/Jul)UNITED STATES of AMERICA (Jun/May) UNITED STATES of AMERICA
2 Argentina (December/November) for rye, barley and oats, (March/February) for maize and sorghum. Australia (November/October) for rye, barley and oats, (March/February) for maize and sorghum. Canada (August/July), EU (July/June), United States of America(June/May) for rye, barley and oats, (September/August) for maize and sorghum.
PAKISTAN (Sept./Aug.)
EU (July/June) EU VIET NAM (Jan./Dec.)
TOTAL OF ABOVE TOTAL OF ABOVE TOTAL OF ABOVE
AUSTRALIA (Oct./Sept.) AUSTRALIA

68 69FOOD OUTLOOKNOVEMBER 2019
FOOD OUTLOOKNOVEMBER 2019
APPENDIX TABLE 10: TOTAL OILCROPS STATISTICS (million tonnes)
15/16-17/18
average2018/19 2019/20
15/16-17/18 average
2018/19 2019/2015/16-17/18
average2018/19 2019/20
estim. f'cast estim. f'cast estim. f'cast
ASIA 133.7 143.2 145.2 128.4 123.8 126.8 3.8 3.6 3.5China 58.0 61.5 63.0 98.5 90.7 93.1 1.0 0.8 0.8 of which Taiwan Prov. 0.1 0.1 0.1 2.6 2.6 2.7 - - -India 38.0 41.2 41.1 0.4 0.2 0.4 1.2 1.2 1.1Indonesia 11.7 13.4 13.8 2.7 3.0 3.3 0.1 0.1 0.1Iran, Islamic Republic of 0.8 0.9 0.9 2.2 2.4 2.5 0.1 0.1 0.1Japan 0.3 0.2 0.2 6.0 6.1 6.2 - - -Korea, Republic of 0.2 0.2 0.2 1.6 1.6 1.7 - - -Malaysia 4.9 5.3 5.2 0.9 1.0 1.0 0.1 - -Pakistan 4.2 4.3 4.5 3.0 4.0 3.8 - - -Thailand 1.1 1.2 1.2 2.8 2.9 3.0 - - -Turkey 3.3 3.6 3.7 3.0 3.3 2.9 0.2 0.2 0.2
AFRICA 20.4 21.2 20.9 3.9 5.4 6.1 0.8 1.0 0.9Nigeria 4.6 4.7 4.6 0.1 0.1 0.1 0.1 0.1 0.1
CENTRAL AMERICA 2.1 2.0 2.1 7.0 8.8 8.7 0.2 0.2 0.2Mexico 1.4 1.3 1.4 6.3 7.9 7.8 - - -
SOUTH AMERICA 186.3 198.0 206.2 4.3 8.8 5.7 80.4 93.3 94.8Argentina 55.4 61.0 59.3 2.3 6.7 3.5 7.2 10.0 10.1Brazil 114.1 121.4 128.3 0.3 0.2 0.2 64.9 75.3 75.4Paraguay 10.1 8.7 10.8 - - - 5.7 5.2 5.5Uruguay 2.7 3.1 3.3 - - - 2.4 2.7 2.8
NORTH AMERICA 153.3 160.2 135.6 2.3 2.7 2.1 74.4 65.7 65.0Canada 27.9 28.9 27.0 0.7 1.5 0.7 16.2 16.2 15.3United States of America 125.3 131.3 108.6 1.6 1.3 1.4 58.2 49.5 49.7
EUROPE 70.8 78.8 77.0 23.1 25.5 26.4 7.0 9.3 9.6European Union 33.5 33.6 30.5 20.3 22.0 22.9 1.0 0.9 0.9Russian Federation 15.5 19.4 20.6 2.1 2.7 2.7 0.9 2.2 2.5Ukraine 19.5 22.7 22.8 - - - 4.4 5.3 5.4
OCEANIA 5.4 3.6 3.9 - - - 3.0 1.9 1.6Australia 5.0 3.1 3.4 - - - 2.9 1.8 1.5
WORLD 571.9 607.0 590.9 168.9 175.1 175.5 169.6 175.1 175.5LIFDC 55.2 58.3 58.4 4.2 4.4 4.9 2.1 2.2 2.0LDC 32.9 33.7 34.1 9.8 13.0 13.6 1.4 1.7 1.5
1 The split years bring together northern hemisphere annual crops harvested in the latter part of the first year shown, with southern hemisphere annual crops harvested in the early part of the second year shown; for tree crops which are produced throughout the year, calendar year production for the second year shown is used.
APPENDIX TABLE 10: TOTAL OILCROPS STATISTICS (million tonnes)
Production 1 Imports Exports

Sta
tist
ica
l a
pp
en
dix
70 71FOOD OUTLOOKNOVEMBER 2019
FOOD OUTLOOKNOVEMBER 2019
APPENDIX TABLE 11: TOTAL OILS AND FATS STATISTICS1 (million tonnes)
15/16-17/18
average2018/19 2019/20
15/16-17/18 average
2018/19 2019/2015/16-17/18
average2018/19 2019/20
estim. f'cast estim. f'cast estim. f'cast
ASIA 47.4 53.8 55.2 50.8 56.3 57.2 116.4 130.1 134.1Bangladesh 2.3 2.6 2.7 - - - 2.7 3.0 3.1China 9.8 12.9 13.7 0.6 0.5 0.5 40.3 44.1 45.2 of which Taiwan Prov. 0.5 0.5 0.5 - - - 0.9 1.0 1.0India 15.3 15.7 16.2 0.2 0.2 0.1 25.2 26.7 27.3Indonesia 0.1 0.1 0.1 28.6 31.8 33.1 12.8 17.1 18.7Iran, Islamic Republic of 1.2 1.7 1.4 0.1 - - 2.0 2.4 2.4Japan 1.3 1.4 1.4 - - - 3.3 3.4 3.4Korea, Republic of 1.2 1.4 1.4 - - - 1.6 1.7 1.7Malaysia 1.3 1.9 1.8 17.7 19.9 19.5 4.9 5.4 5.8Pakistan 3.3 3.5 3.6 0.1 0.1 0.1 5.2 5.7 5.7Philippines 1.2 1.4 1.4 0.8 1.1 0.9 2.1 2.4 2.3Singapore 0.8 0.8 0.8 0.2 0.2 0.2 0.7 0.7 0.7Turkey 1.8 1.7 1.7 0.6 0.5 0.6 3.2 3.3 3.3
AFRICA 11.5 12.2 12.2 1.8 1.9 2.0 18.8 19.7 20.0Algeria 0.9 1.0 1.0 0.1 0.1 0.1 1.0 1.1 1.0Egypt 2.1 2.1 2.1 0.2 0.2 0.2 2.5 2.8 2.8Nigeria 1.4 1.5 1.5 0.1 0.1 0.1 3.2 3.3 3.4South Africa 0.9 1.0 0.9 0.1 - - 1.5 1.6 1.6
CENTRAL AMERICA 2.6 2.5 2.5 1.5 1.8 1.8 5.3 5.8 5.7Mexico 1.5 1.5 1.5 0.1 - - 3.6 3.9 3.8
SOUTH AMERICA 3.2 3.2 3.2 10.3 10.6 10.9 18.2 19.5 20.0Argentina 0.1 - 0.1 6.1 6.8 7.2 4.1 4.2 4.1Brazil 0.6 0.6 0.6 1.7 1.3 1.2 9.2 10.3 10.8Paraguay - - - 0.7 0.7 0.7 0.1 0.1 0.1Uruguay 0.1 0.1 0.1 - - - 0.1 0.1 0.1
NORTH AMERICA 5.6 5.5 5.6 7.2 7.3 7.0 21.7 23.0 23.4Canada 0.5 0.4 0.4 3.8 4.0 3.9 1.6 1.6 1.7United States of America 5.1 5.1 5.2 3.5 3.3 3.2 20.1 21.4 21.7
EUROPE 15.1 15.9 15.8 12.1 14.1 14.3 39.8 41.4 41.0European Union 12.3 12.7 12.6 3.2 3.2 3.0 33.0 34.2 33.9Russian Federation 1.4 1.7 1.7 2.9 3.9 4.4 4.5 4.9 4.8Ukraine 0.3 0.3 0.3 5.5 6.4 6.4 0.9 0.9 0.9
OCEANIA 0.7 0.8 0.8 1.9 2.0 2.0 1.3 1.4 1.4Australia 0.5 0.6 0.6 0.7 0.7 0.7 0.9 1.0 1.1
WORLD 86.0 94.0 95.3 85.7 94.0 95.3 221.4 240.9 245.7LIFDC 25.2 26.5 27.2 1.6 1.6 1.6 40.4 42.9 43.7LDC 25.1 27.2 27.6 3.3 3.4 3.5 36.1 38.8 39.3
1 Includes oils and fats of vegetable, marine and animal origin.
APPENDIX TABLE 11: TOTAL OILS AND FATS STATISTICS 1 (million tonnes)
Imports Exports Utilization

70 71FOOD OUTLOOKNOVEMBER 2019
FOOD OUTLOOKNOVEMBER 2019
APPENDIX TABLE 12: TOTAL MEALS AND CAKES STATISTICS1 (million tonnes)
15/16-17/18
average2018/19 2019/20
15/16-17/18 average
2018/19 2019/2015/16-17/18
average2018/19 2019/20
estim. f'cast estim. f'cast estim. f'cast
ASIA 37.7 43.0 44.2 13.5 15.2 14.4 170.2 177.2 180.5China 3.6 5.4 6.2 1.8 1.4 1.1 94.7 95.8 97.1 of which Taiwan Prov. 0.5 0.4 0.5 - - - 2.5 2.6 2.6India 0.5 0.5 0.5 2.2 3.4 2.7 15.3 16.3 17.2Indonesia 4.5 4.8 5.0 4.7 5.5 5.7 5.1 5.3 5.4Iran, Islamic Republic of 1.6 3.0 2.5 - 0.1 - 3.7 4.9 5.0Japan 2.2 2.3 2.2 - - - 6.5 6.6 6.6Korea, Republic of 3.4 3.6 3.7 0.1 0.1 0.1 4.7 4.8 4.9Malaysia 1.5 1.5 1.6 2.5 2.6 2.6 2.3 2.5 2.6Pakistan 0.6 0.6 0.5 0.1 0.1 0.1 4.4 4.9 4.9Philippines 2.8 3.1 3.1 0.3 0.4 0.4 3.4 3.7 3.8Saudi Arabia 1.4 1.7 1.7 0.1 0.1 0.1 1.9 2.4 2.3Thailand 3.4 3.6 3.6 0.2 0.2 0.2 6.4 6.8 6.8Turkey 2.2 2.2 2.3 0.1 0.1 0.1 5.8 6.2 6.1Viet Nam 5.8 6.1 6.6 0.3 0.3 0.3 7.5 7.8 8.2
AFRICA 5.9 4.8 4.8 1.1 1.2 1.2 14.0 14.4 14.9Egypt 1.6 0.4 0.5 - - - 3.4 3.4 3.7South Africa 0.7 0.7 0.7 0.1 0.1 0.1 2.0 2.1 2.1
CENTRAL AMERICA 4.3 4.1 4.2 0.2 0.2 0.2 10.3 10.9 11.2Mexico 2.4 2.2 2.2 0.1 0.1 0.1 7.7 8.2 8.5
SOUTH AMERICA 5.3 5.6 5.7 51.0 52.3 54.3 32.8 35.7 36.3Argentina - - - 30.5 30.3 32.2 7.1 8.1 7.9Bolivia - - - 1.7 1.8 1.5 0.3 0.3 0.3Brazil - - - 14.9 16.2 16.6 17.6 19.2 19.9Chile 1.1 1.0 1.1 0.2 0.2 0.2 1.5 1.4 1.5Paraguay - - - 2.5 2.4 2.6 0.4 0.5 0.5Peru 1.2 1.4 1.4 0.9 1.1 1.0 1.7 1.9 1.9Uruguay 0.2 0.2 0.2 - - 0.1 0.2 0.2 0.2Venezuela 0.8 0.7 0.7 - - - 1.0 0.9 0.9
NORTH AMERICA 5.1 5.3 5.0 17.3 18.5 18.7 39.7 41.7 42.2Canada 1.0 1.1 1.1 5.4 5.5 5.4 2.5 2.8 3.0United States of America 4.1 4.2 4.0 11.9 13.0 13.3 37.2 38.9 39.2
EUROPE 30.2 30.9 31.4 8.5 9.9 10.0 69.7 73.7 74.9European Union 27.7 28.6 29.1 1.4 1.3 1.1 58.6 61.8 62.4Russian Federation 0.4 0.1 0.1 1.9 2.6 2.9 6.7 7.1 7.4Ukraine - - - 4.6 5.4 5.4 1.7 2.1 2.3
OCEANIA 3.4 3.7 3.7 0.3 0.2 0.2 4.3 4.4 4.6Australia 1.1 1.5 1.5 0.1 0.1 0.1 1.9 2.2 2.3
WORLD 91.9 97.4 99.1 91.9 97.4 99.1 341.1 358.0 364.5LIFDC 8.3 8.8 9.4 3.3 4.5 3.9 30.5 31.9 33.6LDC 8.3 7.1 7.1 2.6 2.7 2.7 24.9 26.2 26.8
1 Expressed in product weight; includes meals and cakes derived from oilcrops as well as fish meal and other meals from animal origin.
APPENDIX TABLE 12: TOTAL MEALS AND CAKES STATISTICS 1
Imports Exports Utilization

Sta
tist
ica
l a
pp
en
dix
72 73FOOD OUTLOOKNOVEMBER 2019
FOOD OUTLOOKNOVEMBER 2019
APPENDIX TABLE 13: SUGAR STATISTICS
(million tonnes - raw value)
2018/19 2019/20 2018/19 2019/20 2018/19 2019/20 2018/19 2019/20estim. f'cast estim. f'cast estim. f'cast estim. f'cast
ASIA 75.4 69.3 33.3 33.8 18.0 18.1 84.9 85.9
Bangladesh 0.1 0.1 2.4 2.5 0.1 0.1 2.5 2.6China 10.8 10.9 6.3 6.7 0.2 0.4 17.0 17.2India 32.4 28.0 1.8 1.5 3.7 3.8 26.0 26.2Indonesia 2.3 2.4 4.8 4.9 - - 7.1 7.2Japan 0.8 0.8 1.4 1.3 0.0 0.0 2.1 2.1Korea, Republic of - - 1.9 1.9 0.3 0.3 1.6 1.6Malaysia - - 2.1 2.1 0.1 0.1 2.0 2.0Pakistan 5.9 5.2 0.4 0.3 0.5 0.2 5.8 5.9Philippines 2.1 2.2 0.1 0.2 0.1 0.2 2.0 2.0Thailand 14.4 12.9 - - 10.6 10.2 2.9 2.9Turkey 2.7 2.7 0.0 0.0 0.3 0.4 2.4 2.4Viet Nam 1.4 1.2 0.3 0.5 0.0 0.1 1.6 1.6
AFRICA 11.8 12.0 12.4 12.4 4.1 4.1 19.5 20.2Algeria - - 2.5 2.6 0.5 0.5 1.5 1.5Egypt 2.5 2.7 1.1 0.8 0.2 0.2 3.4 3.5Eswatini 0.8 0.8 - - 0.7 0.7 0.1 0.1Ethiopia 0.6 0.6 0.1 0.1 0.1 0.1 0.6 0.7Kenya 0.6 0.6 0.5 0.5 - - 1.1 1.1Mauritius 0.3 0.3 0.0 0.0 0.3 0.3 0.0 0.0Morocco 0.6 0.6 1.0 0.7 0.4 0.2 1.2 1.2Mozambique 0.5 0.5 - - 0.2 0.2 0.2 0.3South Africa 2.2 2.2 0.2 0.2 0.7 0.7 1.7 1.7Sudan 0.6 0.6 1.3 1.6 0.2 0.4 1.8 1.9Tanzania, United Rep. of 0.3 0.3 0.2 0.3 0.0 0.0 0.6 0.6Zambia 0.4 0.4 - - 0.2 0.2 0.2 0.2
CENTRAL AMERICA AND THE CARRIBEAN 14.8 15.0 0.4 0.4 6.2 6.7 8.2 8.3Cuba 1.3 1.6 - - 0.8 1.0 0.5 0.5Dominican Republic 0.6 0.6 0.0 - 0.2 0.2 0.4 0.4Guatemala 3.0 3.0 - - 2.0 2.1 0.8 0.9Mexico 7.0 6.9 0.0 0.0 1.5 1.6 4.7 4.8
SOUTH AMERICA 38.5 38.9 1.4 1.4 19.7 20.3 20.1 20.3Argentina 1.8 1.9 - - 0.3 0.4 1.5 1.5Brazil 30.8 31.1 - - 17.9 18.5 12.7 12.9Colombia 0.2 0.2 0.1 0.1 0.1 0.1 0.1 0.1Peru 1.3 1.3 0.3 0.3 0.1 0.1 1.5 1.5Venezuela 0.3 0.3 0.4 0.4 - - 0.6 0.6
NORTH AMERICA 8.9 8.9 3.9 4.1 0.1 0.1 13.3 13.5Canada 0.1 0.1 1.2 1.1 0.0 0.0 1.2 1.3United States 8.8 8.8 2.7 3.1 0.0 0.0 12.0 12.2
EUROPE 25.8 26.1 3.5 3.6 3.5 2.8 27.7 28.0European Union 16.7 16.8 2.7 2.8 2.2 1.3 18.9 19.0Russian Federation 6.0 6.3 0.2 0.2 0.4 0.8 5.8 6.0Ukraine 1.8 1.6 - - 0.4 0.3 1.5 1.5
OCEANIA 5.0 5.0 0.4 0.4 4.1 4.2 1.3 1.3Australia 4.7 4.7 0.1 0.1 3.9 4.0 0.9 1.0Fiji 0.2 0.2 0.0 0.0 0.2 0.2 0.0 0.0
WORLD 180.1 175.1 55.3 56.2 55.6 56.3 175.0 177.5LIFDC 39.9 35.3 12.0 12.9 5.4 5.8 42.2 43.0LDC 4.7 4.7 8.4 9.2 1.4 1.5 11.8 12.4
Utilization
APPENDIX TABLE 13: SUGAR STATISTICS(million tonnes, raw value)
Production Imports Exports

72 73FOOD OUTLOOKNOVEMBER 2019
FOOD OUTLOOKNOVEMBER 2019
APPENDIX TABLE 14: TOTAL MEAT STATISTICS
(thousand tonnes - carcass weight equivalent)
2018 2019 2018 2019 2018 2019 2018 2019estim. f'cast estim. f'cast estim. f'cast estim. f'cast
ASIA 141 518 134 770 18 208 20 198 4 695 4 828 154 998 150 143China 87 014 79 972 5 482 7 385 637 597 91 879 86 760India 7 463 7 508 1 2 1 472 1 534 5 993 5 975Indonesia 3 334 3 430 214 267 6 6 3 541 3 690Iran, Islamic Republic of 3 073 3 129 197 198 56 53 3 214 3 273Japan 4 022 4 081 3 687 3 746 19 19 7 701 7 801Korea, Republic of 2 513 2 585 1 493 1 514 43 50 3 871 4 020Malaysia 2 008 2 032 342 339 67 67 2 283 2 305Pakistan 3 784 3 925 26 29 57 62 3 753 3 892Philippines 3 576 3 720 628 622 6 9 4 199 4 332Saudi Arabia 996 1 018 866 864 78 86 1 783 1 796Singapore 117 116 367 381 56 40 428 457Thailand 2 836 2 912 32 29 1 304 1 440 1 572 1 539Turkey 3 721 3 838 67 19 531 548 3 276 3 310Viet Nam 5 273 4 710 1 599 1 523 28 18 6 845 6 215
AFRICA 19 165 19 188 2 992 3 003 255 246 21 902 21 946Algeria 734 740 63 62 2 2 796 801Angola 301 313 541 500 - - 842 812Egypt 2 228 2 286 334 364 8 6 2 553 2 644Nigeria 1 423 1 421 3 3 1 1 1 425 1 423South Africa 3 210 3 160 641 637 137 128 3 713 3 669
CENTRAL AMERICA 10 170 10 433 3 609 3 682 725 809 13 054 13 305Cuba 387 398 419 423 - - 806 821Mexico 7 002 7 217 2 231 2 288 473 548 8 760 8 957
SOUTH AMERICA 44 213 45 354 1 287 1 398 8 897 9 844 36 603 36 908Argentina 5 878 6 141 85 79 748 1 035 5 215 5 184Brazil 27 692 28 610 58 46 6 942 7 567 20 809 21 089Chile 1 515 1 559 683 764 376 449 1 822 1 875Colombia 2 799 2 722 230 270 28 24 3 000 2 967Uruguay 663 637 79 92 438 434 304 295
NORTH AMERICA 51 885 53 185 2 930 2 855 9 823 10 219 44 982 45 792Canada 4 930 5 083 739 707 1 926 2 007 3 733 3 794United States of America 46 954 48 101 2 178 2 134 7 896 8 212 41 235 41 984
EUROPE 64 890 65 548 2 991 3 067 6 258 6 928 61 636 61 680Belarus 1 234 1 211 58 64 426 414 866 861European Union 48 881 49 296 1 439 1 496 5 017 5 614 45 303 45 178Russian Federation 10 677 10 865 806 801 321 345 11 174 11 314Ukraine 2 374 2 439 172 175 384 455 2 163 2 159
OCEANIA 6 739 6 736 489 534 3 138 3 167 4 090 4 103Australia 4 766 4 759 247 286 2 101 2 122 2 913 2 923New Zealand 1 403 1 406 82 84 1 033 1 041 451 450
WORLD 338 579 335 214 32 507 34 738 33 790 36 042 337 263 333 877LIFDC 25 828 25 308 3 006 2 945 1 700 1 751 27 134 26 501LDC 13 148 13 124 1 482 1 491 39 39 14 591 14 577
Notes:
Meat aggregates have been standardized to comply with FAO statistical methods for calculating meat categories.
Total meat includes "other meat".
APPENDIX TABLE 14: TOTAL MEAT STATISTICS
Production Imports Exports Utilization

Sta
tist
ica
l a
pp
en
dix
74 75FOOD OUTLOOKNOVEMBER 2019
FOOD OUTLOOKNOVEMBER 2019
APPENDIX TABLE 15: BOVINE MEAT STATISTICS (thousand tonnes - carcass weight equivalent)
2018 2019 2018 2019 2018 2019 2018 2019estim. f'cast estim. f'cast estim. f'cast estim. f'cast
ASIA 18 330 18 875 5 976 6 584 1 798 1 866 22 528 23 591China 6 456 6 866 2 017 2 608 63 59 8 430 9 415India 2 534 2 549 - - 1 445 1 510 1 089 1 039Indonesia 568 570 208 262 - 1 775 831Iran, Islamic Republic of 506 527 159 152 3 3 662 676Japan 475 475 842 856 5 6 1 300 1 321Korea, Republic of 279 289 524 578 4 4 792 865Malaysia 51 52 201 204 9 9 243 247Pakistan 1 898 1 919 1 1 48 52 1 851 1 868Philippines 309 307 175 184 3 5 481 487
AFRICA 6 897 6 870 606 621 91 75 7 412 7 416Algeria 150 150 61 60 - - 211 210Angola 102 103 114 110 - - 216 213Egypt 827 846 269 286 1 1 1 096 1 130South Africa 996 950 21 20 53 46 964 924
CENTRAL AMERICA 2 776 2 832 415 417 475 526 2 717 2 722Mexico 1 983 2 024 225 222 274 318 1 934 1 928
SOUTH AMERICA 16 040 16 355 422 460 3 310 3 716 13 151 13 099Argentina 3 050 3 160 18 20 524 749 2 544 2 431Brazil 9 900 10 307 45 34 1 989 2 194 7 955 8 147Chile 201 208 296 342 12 23 485 527Colombia 768 622 6 8 24 22 751 608Uruguay 596 571 22 32 415 411 202 192
NORTH AMERICA 13 519 13 621 1 569 1 556 1 957 2 012 13 119 13 167Canada 1 265 1 330 259 232 467 531 1 049 1 038United States of America 12 254 12 291 1 306 1 321 1 490 1 481 12 068 12 126
EUROPE 10 734 10 647 955 901 728 746 10 961 10 801European Union 8 006 7 934 336 323 384 416 7 958 7 841Russian Federation 1 664 1 686 462 410 46 48 2 080 2 048Ukraine 363 334 3 3 50 48 316 289
OCEANIA 2 978 3 001 52 53 2 092 2 133 938 921Australia 2 306 2 315 14 14 1 514 1 541 805 788New Zealand 658 672 12 13 575 589 96 96
WORLD 71 273 72 199 9 994 10 591 10 450 11 074 70 827 71 717LIFDC 8 616 8 639 904 798 1 604 1 668 7 916 7 769LDC 4 635 4 636 170 165 16 14 4 789 4 787
Note: Meat aggregates have been standardized to comply with FAO statistical methods for calculating meat categories.
APPENDIX TABLE 15: BOVINE MEAT STATISTICS
Production Imports Exports Utilization

74 75FOOD OUTLOOKNOVEMBER 2019
FOOD OUTLOOKNOVEMBER 2019
APPENDIX TABLE 16: OVINE MEAT STATISTICS (thousand tonnes - carcass weight equivalent)
2018 2019 2018 2019 2018 2019 2018 2019estim. f'cast estim. f'cast estim. f'cast estim. f'cast
ASIA 9 159 9 279 685 698 43 36 9 801 9 941Bangladesh 230 232 - - - - 230 232China 4 714 4 826 348 366 1 1 5 061 5 191India 732 730 - - 19 17 713 713Iran, Islamic Republic of 355 352 38 45 - - 393 397Pakistan 473 475 - - 3 4 470 471Saudi Arabia 121 123 35 26 3 1 154 148Turkey 400 401 1 1 - - 401 402
AFRICA 3 059 3 068 25 23 29 29 3 055 3 062Algeria 292 295 - - - - 292 295Nigeria 395 395 - - - - 395 395South Africa 165 165 7 6 1 - 172 171Sudan 361 359 - - 2 2 359 357
CENTRAL AMERICA 128 129 18 19 - 1 145 147Mexico 102 103 8 9 - 1 109 111
SOUTH AMERICA 298 301 8 6 20 20 286 288Brazil 117 119 8 6 - - 125 125
NORTH AMERICA 92 91 146 148 4 4 235 235United States of America 76 75 125 123 4 4 197 194
EUROPE 1 302 1 317 152 127 46 50 1 408 1 394European Union 950 960 142 117 26 28 1 066 1 048Russian Federation 227 232 3 3 12 14 218 221
OCEANIA 1 212 1 183 26 27 901 892 336 318Australia 760 738 1 2 493 488 268 252New Zealand 451 444 3 2 409 404 45 42
WORLD 15 250 15 368 1 059 1 047 1 043 1 031 15 266 15 384LIFDC 3 604 3 608 8 8 44 43 3 568 3 572LDC 2 236 2 243 6 6 18 16 2 224 2 233
APPENDIX TABLE 16: OVINE MEAT STATISTICS
Production Imports Exports Utilization

Sta
tist
ica
l a
pp
en
dix
76 77FOOD OUTLOOKNOVEMBER 2019
FOOD OUTLOOKNOVEMBER 2019
APPENDIX TABLE 17: PIG MEAT STATISTICS (thousand tonnes - carcass weight equivalent)
2018 2019 2018 2019 2018 2019 2018 2019estim. f'cast estim. f'cast estim. f'cast estim. f'cast
ASIA 66 579 55 154 4 745 5 615 197 161 71 061 60 578China 54 978 44 127 1 924 2 819 105 75 56 797 46 871India 300 295 1 1 1 - 300 296Indonesia 345 347 4 2 - - 349 349Japan 1 294 1 306 1 487 1 516 4 3 2 790 2 809Korea, Republic of 1 329 1 364 761 709 2 2 2 008 2 051Malaysia 195 197 33 29 5 4 223 221Philippines 1 883 1 963 163 149 2 2 2 044 2 110Thailand 902 904 1 1 25 28 878 876Viet Nam 3 830 3 160 79 97 25 15 3 884 3 242
AFRICA 1 522 1 536 285 274 28 30 1 779 1 779Madagascar 66 65 - - - - 66 65Nigeria 280 279 1 1 - - 281 280South Africa 251 263 45 38 24 27 272 274Uganda 126 125 1 - - - 127 126
CENTRAL AMERICA 2 092 2 172 1 289 1 332 207 239 3 174 3 265Cuba 249 257 22 23 - - 271 280Mexico 1 504 1 571 1 006 1 048 186 218 2 324 2 401
SOUTH AMERICA 6 115 6 408 492 553 1 010 1 235 5 597 5 727Argentina 622 660 52 49 8 13 666 697Brazil 3 722 3 927 2 2 804 989 2 921 2 940Chile 526 536 235 269 190 227 571 578Colombia 386 421 128 153 2 - 512 574
NORTH AMERICA 14 086 14 709 849 798 3 828 4 140 11 111 11 357Canada 2 138 2 187 263 260 1 284 1 304 1 123 1 147United States of America 11 948 12 522 582 534 2 544 2 836 9 983 10 206
EUROPE 29 772 29 943 365 431 3 065 3 560 27 072 26 814Belarus 400 372 24 33 46 39 378 366European Union 24 112 24 209 16 17 2 916 3 401 21 212 20 825Russian Federation 3 763 3 870 112 166 65 82 3 811 3 954Serbia 302 311 52 49 21 21 333 339Ukraine 701 690 36 38 3 2 734 726
OCEANIA 562 537 307 347 44 39 825 845Australia 413 390 217 257 42 37 588 609Papua New Guinea 81 81 8 8 - - 89 89
WORLD 120 727 110 457 8 333 9 350 8 379 9 403 120 619 110 364LIFDC 5 177 4 499 227 250 29 18 5 376 4 732LDC 2 089 2 061 173 170 - - 2 262 2 230
APPENDIX TABLE 17: PIGMEAT STATISTICS
Production Imports Exports Utilization

76 77FOOD OUTLOOKNOVEMBER 2019
FOOD OUTLOOKNOVEMBER 2019
APPENDIX TABLE 18: POULTRY MEAT STATISTICS (thousand tonnes - carcass weight equivalent)
2018 2019 2018 2019 2018 2019 2018 2019estim. f'cast estim. f'cast estim. f'cast estim. f'cast
ASIA 44 741 48 754 6 696 7 173 2 464 2 584 48 985 53 378China 19 020 22 306 1 130 1 513 454 448 19 696 23 371India 3 707 3 744 - - 7 7 3 700 3 737Indonesia 2 290 2 380 - - 2 2 2 288 2 378Iran, Islamic Republic of 2 196 2 233 - - 52 48 2 144 2 186Japan 2 246 2 293 1 325 1 337 10 10 3 571 3 627Korea, Republic of 900 927 186 204 37 44 1 044 1 077Kuwait 58 59 150 158 8 9 200 208Malaysia 1 757 1 778 72 73 52 53 1 777 1 798Saudi Arabia 729 749 652 650 37 44 1 343 1 355Singapore 96 95 172 184 15 17 254 262Thailand 1 777 1 850 2 2 1 135 1 274 652 616Turkey 2 229 2 305 6 3 502 511 1 734 1 797Yemen 147 126 91 99 - - 238 225
AFRICA 5 927 5 955 2 066 2 074 92 99 7 902 7 930Angola 40 41 329 301 - - 369 342South Africa 1 755 1 739 567 572 55 53 2 267 2 258
CENTRAL AMERICA 5 075 5 202 1 784 1 812 40 41 6 820 6 973Cuba 34 36 286 293 - - 320 329Mexico 3 330 3 437 990 1 006 10 9 4 311 4 433
SOUTH AMERICA 21 575 22 107 366 378 4 423 4 705 17 518 17 780Argentina 2 079 2 193 14 10 194 252 1 899 1 951Brazil 13 931 14 235 3 4 4 050 4 248 9 885 9 991Chile 766 793 152 153 167 193 752 753
NORTH AMERICA 23 883 24 459 353 340 4 017 4 044 20 215 20 734Canada 1 486 1 525 194 190 164 159 1 509 1 556United States of America 22 396 22 934 154 145 3 853 3 885 18 701 19 173
EUROPE 21 902 22 461 1 286 1 331 2 375 2 525 20 825 21 259European Union 15 248 15 629 736 779 1 652 1 727 14 331 14 682Russian Federation 4 448 4 502 215 212 197 199 4 479 4 508Ukraine 1 276 1 381 134 133 331 404 1 079 1 110
OCEANIA 1 515 1 543 102 104 81 84 1 536 1 564Australia 1 260 1 289 15 14 44 49 1 231 1 254New Zealand 220 219 1 1 37 34 184 186
WORLD 124 618 130 480 12 652 13 212 13 491 14 081 123 800 129 618LIFDC 6 770 6 900 1 858 1 880 10 10 8 618 8 770LDC 3 256 3 252 1 129 1 146 2 6 4 383 4 392
Note: Meat aggregates have been standardized to comply with FAO statistical methods for calculating meat categories.
APPENDIX TABLE 18: POULTRY MEAT STATISTICS
Production Imports Exports Utilization
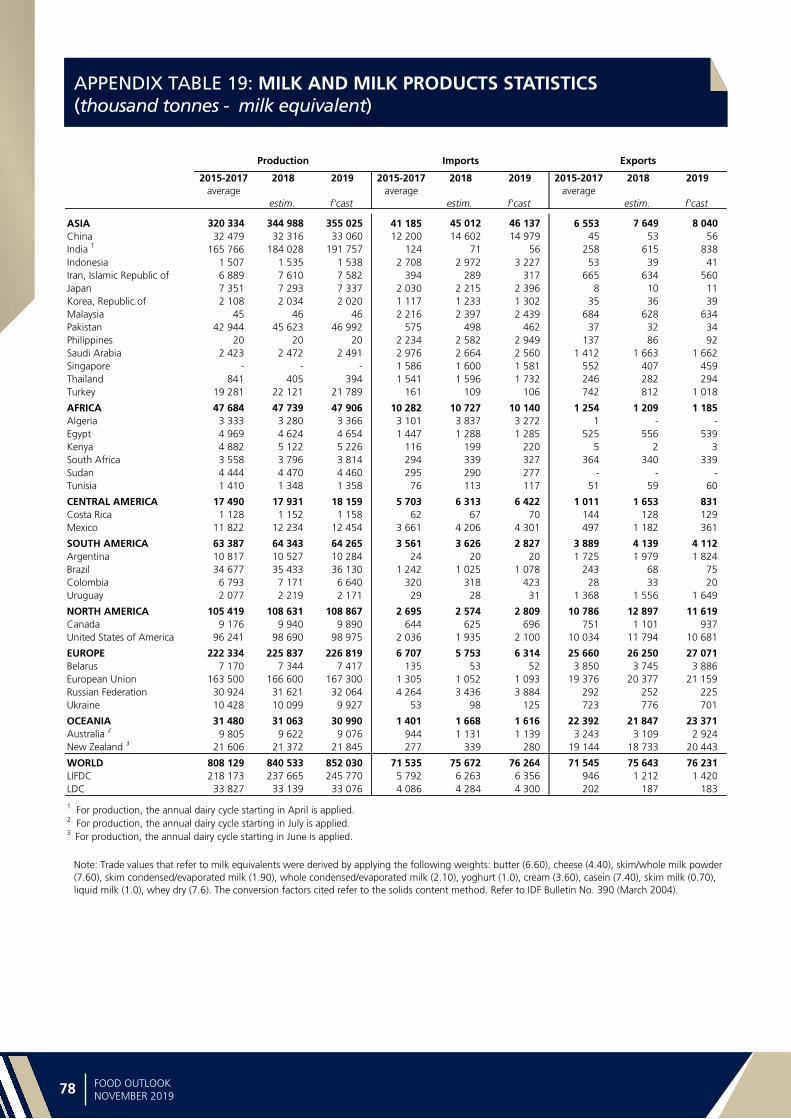
Sta
tist
ica
l a
pp
en
dix
78 79FOOD OUTLOOKNOVEMBER 2019
FOOD OUTLOOKNOVEMBER 2019
APPENDIX TABLE 19: MILK AND MILK PRODUCTS STATISTICS (thousand tonnes - milk equivalent)
2015-2017
average2018 2019 2015-2017
average2018 2019 2015-2017
average2018 2019
estim. f'cast estim. f'cast estim. f'cast
ASIA 320 334 344 988 355 025 41 185 45 012 46 137 6 553 7 649 8 040China 32 479 32 316 33 060 12 200 14 602 14 979 45 53 56India 1 165 766 184 028 191 757 124 71 56 258 615 838Indonesia 1 507 1 535 1 538 2 708 2 972 3 227 53 39 41Iran, Islamic Republic of 6 889 7 610 7 582 394 289 317 665 634 560Japan 7 351 7 293 7 337 2 030 2 215 2 396 8 10 11Korea, Republic.of 2 108 2 034 2 020 1 117 1 233 1 302 35 36 39Malaysia 45 46 46 2 216 2 397 2 439 684 628 634Pakistan 42 944 45 623 46 992 575 498 462 37 32 34Philippines 20 20 20 2 234 2 582 2 949 137 86 92Saudi Arabia 2 423 2 472 2 491 2 976 2 664 2 560 1 412 1 663 1 662Singapore - - - 1 586 1 600 1 581 552 407 459Thailand 841 405 394 1 541 1 596 1 732 246 282 294Turkey 19 281 22 121 21 789 161 109 106 742 812 1 018
AFRICA 47 684 47 739 47 906 10 282 10 727 10 140 1 254 1 209 1 185Algeria 3 333 3 280 3 366 3 101 3 837 3 272 1 - -Egypt 4 969 4 624 4 654 1 447 1 288 1 285 525 556 539Kenya 4 882 5 122 5 226 116 199 220 5 2 3South Africa 3 558 3 796 3 814 294 339 327 364 340 339Sudan 4 444 4 470 4 460 295 290 277 - - -Tunisia 1 410 1 348 1 358 76 113 117 51 59 60
CENTRAL AMERICA 17 490 17 931 18 159 5 703 6 313 6 422 1 011 1 653 831Costa Rica 1 128 1 152 1 158 62 67 70 144 128 129Mexico 11 822 12 234 12 454 3 661 4 206 4 301 497 1 182 361
SOUTH AMERICA 63 387 64 343 64 265 3 561 3 626 2 827 3 889 4 139 4 112Argentina 10 817 10 527 10 284 24 20 20 1 725 1 979 1 824Brazil 34 677 35 433 36 130 1 242 1 025 1 078 243 68 75Colombia 6 793 7 171 6 640 320 318 423 28 33 20Uruguay 2 077 2 219 2 171 29 28 31 1 368 1 556 1 649
NORTH AMERICA 105 419 108 631 108 867 2 695 2 574 2 809 10 786 12 897 11 619Canada 9 176 9 940 9 890 644 625 696 751 1 101 937United States of America 96 241 98 690 98 975 2 036 1 935 2 100 10 034 11 794 10 681
EUROPE 222 334 225 837 226 819 6 707 5 753 6 314 25 660 26 250 27 071Belarus 7 170 7 344 7 417 135 53 52 3 850 3 745 3 886European Union 163 500 166 600 167 300 1 305 1 052 1 093 19 376 20 377 21 159Russian Federation 30 924 31 621 32 064 4 264 3 436 3 884 292 252 225Ukraine 10 428 10 099 9 927 53 98 125 723 776 701
OCEANIA 31 480 31 063 30 990 1 401 1 668 1 616 22 392 21 847 23 371Australia 2 9 805 9 622 9 076 944 1 131 1 139 3 243 3 109 2 924New Zealand 3 21 606 21 372 21 845 277 339 280 19 144 18 733 20 443
WORLD 808 129 840 533 852 030 71 535 75 672 76 264 71 545 75 643 76 231LIFDC 218 173 237 665 245 770 5 792 6 263 6 356 946 1 212 1 420LDC 33 827 33 139 33 076 4 086 4 284 4 300 202 187 183
1 For production, the annual dairy cycle starting in April is applied.2 For production, the annual dairy cycle starting in July is applied.3 For production, the annual dairy cycle starting in June is applied.
Note: Trade values that refer to milk equivalents were derived by applying the following weights: butter (6.60), cheese (4.40), skim/whole milk powder (7.60), skim condensed/evaporated milk (1.90), whole condensed/evaporated milk (2.10), yoghurt (1.0), cream (3.60), casein (7.40), skim milk (0.70), liquid milk (1.0), whey dry (7.6). The conversion factors cited refer to the solids content method. Refer to IDF Bulletin No. 390 (March 2004).
APPENDIX TABLE 19: MILK AND MILK PRODUCTS STATISTICS
Production Imports Exports

78 79FOOD OUTLOOKNOVEMBER 2019
FOOD OUTLOOKNOVEMBER 2019
APPENDIX TABLE 20: FISH AND FISHERY PRODUCTS STATISTICS1
2016 2017 2016 2017 2017 2018 2019 2017 2018 2019
estim. f'cast estim. f'cast
ASIA2 48.8 49.2 67.9 71.3 59.2 61.1 59.4 48.6 54.6 57.0China 16.7 16.3 46.1 47.1 23.1 24.2 22.7 15.9 19.9 22.2 of which: Hong Kong SAR 0.1 0.1 - - 0.8 0.7 0.6 3.6 3.8 3.5 Taiwan Prov. 0.8 0.7 0.3 0.3 1.9 2.0 1.8 1.4 1.6 1.6India 5.1 5.4 5.7 6.2 7.2 6.9 6.6 0.1 0.1 0.1Indonesia 6.5 6.7 4.9 6.2 4.2 4.5 4.4 0.4 0.4 0.4Japan 3.2 3.2 0.7 0.6 2.0 2.0 1.8 15.0 15.3 15.5Korea, Republic of 1.4 1.4 0.5 0.5 1.7 1.7 1.8 5.1 5.9 5.7Philippines 2.0 1.9 0.8 0.8 0.9 0.9 0.8 0.6 0.6 0.5Thailand 1.5 1.5 0.9 0.9 6.0 6.0 5.7 3.5 3.9 3.7Viet Nam 3.1 3.3 3.6 3.8 8.5 9.0 9.5 1.7 1.9 2.0
AFRICA 9.3 9.7 2.0 2.1 7.2 7.3 7.2 5.0 5.4 5.5Egypt 0.3 0.4 1.4 1.5 - - 0.1 0.6 0.8 0.9Morocco 1.4 1.4 - - 2.2 2.3 2.3 0.2 0.2 0.2Namibia 0.5 0.5 - - 0.7 0.7 0.6 - 0.1 -Nigeria 0.7 0.9 0.3 0.3 - 0.1 0.1 0.8 0.8 0.8Senegal 0.5 0.5 - - 0.4 0.5 0.6 - 0.1 0.1South Africa 0.6 0.5 - - 0.6 0.7 0.6 0.4 0.5 0.5
CENTRAL AMERICA 2.1 2.3 0.4 0.4 2.8 3.0 2.7 2.0 1.9 1.8Mexico 1.5 1.6 0.2 0.2 1.3 1.5 1.4 0.9 0.9 0.9Panama 0.1 0.1 - - 0.1 0.2 0.1 0.1 0.1 0.1
SOUTH AMERICA 8.1 8.9 2.3 2.5 16.5 18.1 18.4 2.9 3.0 2.9Argentina 0.8 0.8 - - 2.0 2.1 1.9 0.2 0.2 0.1Brazil 0.7 0.7 0.6 0.6 0.3 0.3 0.3 1.4 1.4 1.3Chile 1.5 1.9 1.0 1.2 6.0 6.8 6.7 0.4 0.4 0.4Ecuador 0.7 0.6 0.5 0.5 4.6 4.9 5.4 0.1 0.1 0.2Peru 3.8 4.2 0.1 0.1 2.8 3.3 3.2 0.3 0.3 0.3
NORTH AMERICA 6.0 6.2 0.6 0.6 12.5 12.1 11.8 24.6 25.6 25.5Canada 0.9 0.8 0.2 0.2 5.4 5.4 5.5 2.9 3.0 3.1United States of America 4.9 5.0 0.4 0.4 6.1 6.0 5.5 21.6 22.6 22.4
EUROPE 13.7 14.8 2.9 3.0 55.0 57.9 57.6 61.2 65.3 62.3European Union2 5.2 5.6 1.3 1.4 35.5 37.2 36.2 55.8 59.3 56.5 of which extra-EU - - - - 6.2 6.6 6.9 29.0 31.0 30.7Iceland 1.1 1.2 - - 2.0 2.4 2.3 0.1 0.1 0.1Norway 2.0 2.4 1.3 1.3 11.3 12.0 11.9 1.2 1.3 1.3Russian Federation 4.8 4.9 0.2 0.2 4.5 4.5 5.4 2.0 2.2 2.0
OCEANIA 1.4 1.4 0.2 0.2 3.3 3.3 3.4 2.0 2.0 1.9Australia 0.2 0.2 0.1 0.1 1.1 1.1 1.0 1.6 1.6 1.5New Zealand 0.4 0.4 0.1 0.1 1.2 1.2 1.4 0.2 0.2 0.2
WORLD3 89.4 92.5 76.4 80.1 156.5 162.9 160.5 146.3 157.9 157.0 Excl. intra-EU - - - - 127.2 132.3 131.2 119.6 129.6 131.3LIFDC 15.0 16.0 11.9 12.8 19.1 19.4 19.7 3.8 4.2 4.3LDC 9.2 9.7 3.7 4.0 3.6 3.9 4.1 1.2 1.2 1.2
1 Production and trade data exclude whales, seals, other aquatic mammals and aquatic plants. Trade data include fishmeal and fish oil.2 EU 28. Including intra-trade. Cyprus is included in Asia as well as in the European Union.3 For capture fisheries production, the aggregate includes 5 229 tonnes in 2016 from non-identified countries; these data are not included in any other aggregates. Totals may not match due to rounding.
Million tonnes (live weight equivalent) USD billion USD billion
APPENDIX TABLE 20: FISH AND FISHERY PRODUCTS STATISTICS 1
Exports ImportsCapture fisheries
productionAquaculture fisheries
production

Sta
tist
ica
l a
pp
en
dix
80 81FOOD OUTLOOKNOVEMBER 2019
FOOD OUTLOOKNOVEMBER 2019
APPENDIX TABLE 21: SELECTED INTERNATIONAL PRICES FOR WHEAT AND COARSE GRAINS
APPENDIX TABLE 22: TOTAL WHEAT AND MAIZE FUTURES PRICES
Wheat Maize Barley Sorghum
Period US No. 2 Hard
Red Winter
Ord. Prot. 1
US Soft Red
Winter No. 2 2
Argentina
Trigo Pan 3
US No. 2
Yellow 2
Argentina 3 France feed
Rouen
Australia feed
Southern
States
US No. 2
Yellow 2
................................................................................. (USD/tonne) .................................................................................
Annual (July/June)
2008/09 270 201 234 188 180 178 179 170
2009/10 209 185 224 160 168 146 154 165
2010/11 316 289 311 254 260 266 248 248
2011/12 300 259 264 281 269 270 249 264
2012/13 348 310 336 311 277 297 298 281
2013/14 318 265 335 216 219 243 241 218
2014/15 266 221 246 173 177 205 243 210
2015/16 211 194 208 166 170 174 185 174
2016/17 197 170 190 156 172 159 162 151
2017/18 230 188 203 159 165 193 222 174
2018/19 232 210 233 166 166 219 265 163
2018 - October 240 210 233 160 162 239 305 159
2018 - November 232 210 220 160 161 235 269 157
2018 - December 241 218 228 167 171 238 270 164
2019 - January 238 219 234 166 173 234 266 162
2019 - February 235 217 244 170 170 208 251 170
2019 - March 224 201 231 167 163 199 245 170
2019 - April 213 195 220 161 155 197 250 164
2019 - May 212 203 218 172 166 188 237 164
2019 - June 227 222 243 196 183 189 249 164
2019 - July 216 202 244 188 177 180 244 158
2019 - August 203 197 238 162 151 175 223 147
2019 - September 200 200 228 157 145 172 223 149
2019 - October 212 213 229 168 157 187 221 164
December March May July
Dec. 2019 Dec. 2018 Mar. 2020 Mar. 2019 May 2020 May 2019 July 2020 July 2019
................................................................................. (USD/tonne) .................................................................................
Wheat
Sept 26 178 190 180 197 182 201 183 201
Oct 3 180 189 182 196 191 201 186 203
Oct 10 181 188 184 195 186 200 187 202
Oct 17 193 190 195 198 196 202 197 204
Oct 24 190 184 192 191 193 196 195 198
Oct 31 187 184 189 190 191 194 192 196
Maize
Sept 26 147 143 151 148 154 151 156 153
Oct 3 153 144 158 148 160 151 161 153
Oct 10 150 143 154 148 156 150 158 153
Oct 17 155 147 160 152 162 155 164 157
Oct 24 152 145 157 150 159 153 162 155
Oct 31 154 143 157 148 159 151 161 153
Source: Chicago Board of Trade (CBOT)
1 Delivered United States f.o.b Gulf; 2 Delivered United States Gulf; 3 Up River f.o.b. Sources: International Grain Council and USDA.

80 81FOOD OUTLOOKNOVEMBER 2019
FOOD OUTLOOKNOVEMBER 2019
APPENDIX TABLE 23: SELECTED INTERNATIONAL PRICES FOR RICE AND PRICE INDICES
International prices FAO indices
Indica
Period Thai 100% B1
Thai broken 2
US long grain 3
Pakisan Basmati4
Total Higher quality
Lower quality
Japonica Aromatic
Annual (Jan/Dec) ..........................(USD per tonne) .......................... ............................. (2002-2004=100) .............................
2012 588 540 567 1137 231 225 241 235 222
2013 534 483 628 1372 233 219 226 230 268
2014 435 322 571 1324 235 207 201 266 255
2015 395 327 490 849 211 184 184 263 176
2016 407 348 438 795 194 180 187 228 153
2017 415 334 456 1131 206 183 195 232 204
2018 445 365 531 1023 224 201 208 256 216
Monthly
2018 – October 432 358 510 961 216 197 200 247 204
2018 – November 423 356 509 938 215 194 199 244 207
2018 – December 425 365 511 921 216 192 197 249 209
2019 – January 432 377 519 919 223 192 196 269 211
2019 – February 427 379 497 901 221 189 192 266 211
2019 – March 421 374 495 915 222 189 194 267 211
2019 – April 429 374 486 983 222 191 195 265 217
2019 – May 425 374 481 1004 222 190 195 264 219
2019 – June 436 382 479 1038 224 190 192 267 223
2019 – July 431 387 499 1031 224 190 194 267 224
2019 – August 444 389 508 1039 228 193 195 270 232
2019 – September 444 399 508 1045 228 192 195 271 232
2019 – October 440 398 509 989 225 192 197 270 219
1 White rice - 100% second grade - f.o.b. Bangkok - indicative traded prices.2 A1 super - f.o.b. Bangkok - indicative traded prices.3 US No.2 - 4% brokens f.o.b.4 Up to May 2011: Basmati ordinary - f.o.b. Karachi; from June 2011 onwards: Super Kernel White Basmati Rice 2%.
Note: The FAO Rice Price Index is based on 16 rice export quotations. ‘Quality’ is defined by the percentage of broken kernels - with higher (lower) quality referring to rice with less (equal to or more) than 20 percent brokens. The sub-index for Aromatic Rice follows movements in prices of Basmati and Fragrant rice.Sources: FAO for indices. Rice prices: Livericeindex.com - Thai Department of Foreign Trade (DFT) and other public sources.

Sta
tist
ica
l a
pp
en
dix
82 83FOOD OUTLOOKNOVEMBER 2019
FOOD OUTLOOKNOVEMBER 2019
APPENDIX TABLE 24: SELECTED INTERNATIONAL PRICES FOR OILCROP PRODUCTS AND PRICE INDICES
International prices 1 FAO indices 8
Period Soybeans 2 Soybean oil 3 Palm oil 4 Soybean cake 5 Rapeseed
meal 6
Oilseeds Vegetable oils Oilcakes/meals
.............................................. (USD per tonne) .............................................. ................... (2002-2004=100) ................
Annual (Oct/Sept)
2004/05 275 545 419 212 130 104 103 101
2005/06 259 572 451 202 130 100 107 96
2006/07 335 772 684 264 184 129 150 128
2008/09 437 849 682 409 206 157 146 179
2009/10 429 924 806 388 220 162 177 183
2010/11 549 1308 1147 418 279 214 259 200
2011/12 562 1235 1051 461 295 214 232 219
2012/13 563 1099 835 539 345 213 193 255
2013/14 521 949 867 534 324 194 189 253
2014/15 407 777 658 406 270 155 153 194
2015/16 396 773 655 351 232 151 155 168
2016/17 404 806 729 336 225 154 160 171
2017/18 402 820 648 381 258 152 154 182
2018/19 370 744 523 328 247 142 159 130
Monthly
2018 - January 404 865 679 361 239 153 163 171
2018 - February 416 848 660 400 265 157 158 190
2018 - March 432 830 684 427 294 162 157 203
2018 - April 441 824 663 447 304 164 155 213
2018 - May 432 787 659 443 282 161 151 211
2018 - June 389 783 631 391 264 148 146 187
2018 - July 378 774 591 382 267 145 142 184
2018 - August 379 763 561 365 282 146 138 178
2018 - September 357 755 545 347 277 139 135 169
2018 - October 369 759 529 347 272 142 133 169
2018 - November 372 735 482 340 276 143 125 166
2018 - December 382 720 494 344 273 145 126 166
2019 - January 381 746 534 343 273 146 131 165
2019 - February 380 766 558 330 263 145 134 156
2019 - March 371 730 527 320 248 142 128 155
2019 - April 365 733 534 318 244 140 129 153
2019 - May 347 738 510 320 234 135 127 154
2019 - June 369 725 505 337 236 141 125 163
2019 - July 374 738 498 322 225 143 126 156
2019 - August 363 775 540 315 215 139 134 152
2019 - September 366 765 563 315 201 140 136 151
2019 - October 7 386 761 553 319 215 147 136 153
1 Spot prices for nearest forward shipment 2 Soybeans: US - No.2 yellow - c.i.f. Rotterdam3 Soybean oil: Dutch - fob ex-mill4 Palm oil: Crude - c.i.f. Northwest Europe5 Soybean cake: Pellets - 44/45 percent - Argentina - c.i.f. Rotterdam6 Rapeseed meal: 34 percent - Hamburg - f.o.b. ex-mill7 The international prices shown represent averages for the first three weeks of the month.8 The FAO indices are based on the international prices of five selected seeds - ten selected oils and five selected cakes and meals. The indices are calculated using the
Laspeyres formula; the weights used are the export values of each commodity for the 2002-2004 period.
Sources: FAO and Oil World.

82 83FOOD OUTLOOKNOVEMBER 2019
FOOD OUTLOOKNOVEMBER 2019
APPENDIX TABLE 25: SELECTED INTERNATIONAL PRICES FOR SUGAR AND SUGAR PRICE INDEX
I.S.A. daily price average1 FAO Sugar Price Index (2002/04 = 100)
Raw sugar
Annual (Jan/Dec) (US Cents/lb) (2002/04=100)
2009 18.1 257.3
2010 21.3 302.0
2011 26.0 368.9
2012 21.5 305.7
2013 17.7 251.0
2014 17.0 241.2
2015 13.4 190.7
2016 18.0 256.0
2017 16.0 227.3
2018 12.5 177.5
Monthly
2017 - October 14.3 203.5
2017 - November 15.0 212.7
2017 - December 14.4 204.1
2018 - January 14.1 199.9
2018 - February 13.6 192.4
2018 - March 13.1 185.5
2018 - April 12.0 176.1
2018 - May 12.4 175.3
2018 - June 12.5 177.4
2018 - July 11.7 166.3
2018 - August 11.1 157.3
2018 - September 11.4 161.4
2018 - October 12.5 175.4
2018 - November 12.9 183.1
2018 - December 12.7 179.6
2019 - January 12.8 181.9
2019 - February 13.0 184.2
2019 - March 12.7 180.4
2019 - April 12.8 181.7
2019 - May 12.4 176.0
2019 - June 12.9 183.3
2019 - July 12.8 182.1
2019 - August 12.3 174.8
2019 - September 11.9 168.0
2019 - October 12.6
1 International Sugar Agreement (ISA) prices: simple average of the closing quotes for the first three future positions of the New York Intercontinental Exchange (ICE) Sugar Contract No. 11.
Source: International Sugar Organization (ISO). FAO for the sugar index.

Sta
tist
ica
l a
pp
en
dix
84 85FOOD OUTLOOKNOVEMBER 2019
FOOD OUTLOOKNOVEMBER 2019
APPENDIX TABLE 26: SELECTED INTERNATIONAL PRICES FOR MILK PRODUCTS AND DAIRY PRICE INDEX
International prices FAO dairy price index
Period Butter 1 Skim milk powder 2 Whole milk powder 3 Cheddar cheese 4
Annual (Jan/Dec) .................................................. (USD per tonne) .................................................. ... (2002-2004=100) ...
2008 3 701 3 251 3 891 4 633 223
2009 2 736 2 332 2 556 2 957 150
2010 4 270 3 081 3 514 4 010 207
2011 4 876 3 556 4 018 4 310 230
2012 3 547 3 119 3 358 3 821 194
2013 4 484 4 293 4 745 4 402 243
2014 4 010 3 647 3 868 4 456 224
2015 3 212 2 113 2 509 3 340 160
2016 3 350 1 983 2 457 3 094 154
2017 5 573 2 025 3 179 3 848 202
2018 5 325 1 911 3 087 3 648 193
Monthly
2018 – October 4 702 1 935 2 910 3 513 182
2018 – November 4 507 1 960 2 834 3 375 176
2018 – December 4 265 1 967 2 814 3 238 170
2019 – January 4 527 2 291 2 922 3 475 182
2019 – February 4 660 2 477 3 134 3 675 192
2019 – March 4 871 2 431 3 271 4 019 204
2019 – April 5 246 2 404 3 326 4 288 215
2019 – May 5 261 2 450 3 282 4 731 226
2019 – June 4 683 2 367 3 188 3 944 199
2019 – July 4 300 2 457 3 132 3 856 194
2019 – August 4 104 2 497 3 166 3 938 195
2019 – September 4 074 2 557 3 189 3 875 193
2019 – October 4 074 2 681 3 226 3 763 192
1 Butter - 82% butterfat - f.o.b. Oceania and EU; average indicative traded prices.2 Skim Milk Powder - 1.25% butterfat - f.o.b. Oceania and EU - averaged indicative traded prices.3 Whole Milk Powder - 26% butterfat - f.o.b. Oceania and EU - average indicative traded prices.4 Cheddar Cheese - 39% max. moisture - f.o.b. Oceania - indicative traded prices.
Note: The FAO Dairy Price Index is derived from a trade-weighted average of a selection of representative internationally-traded dairy products.Sources: FAO for indices. Product prices: Mid-point of price ranges reported by Dairy Market News (USDA).
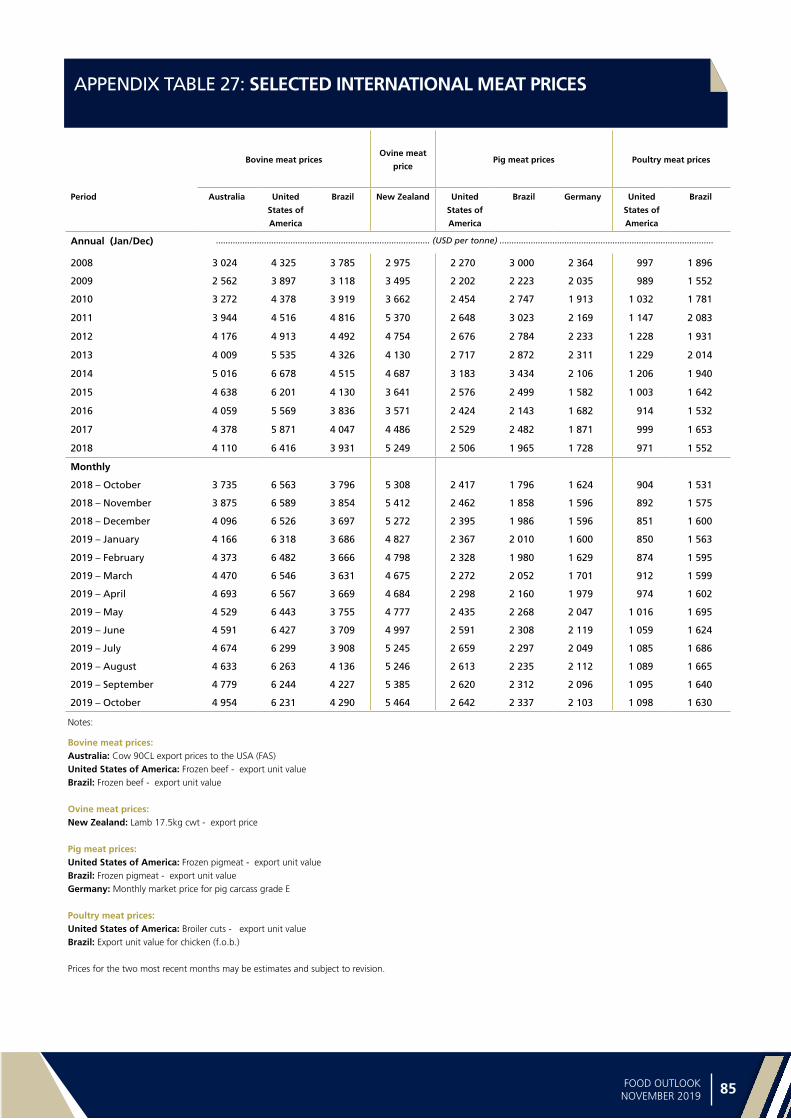
84 85FOOD OUTLOOKNOVEMBER 2019
FOOD OUTLOOKNOVEMBER 2019
APPENDIX TABLE 27: SELECTED INTERNATIONAL MEAT PRICES
Bovine meat prices:Australia: Cow 90CL export prices to the USA (FAS)United States of America: Frozen beef - export unit valueBrazil: Frozen beef - export unit value
Ovine meat prices:New Zealand: Lamb 17.5kg cwt - export price
Pig meat prices:United States of America: Frozen pigmeat - export unit valueBrazil: Frozen pigmeat - export unit valueGermany: Monthly market price for pig carcass grade E
Poultry meat prices:United States of America: Broiler cuts - export unit valueBrazil: Export unit value for chicken (f.o.b.)
Prices for the two most recent months may be estimates and subject to revision.
Bovine meat pricesOvine meat
pricePig meat prices Poultry meat prices
Period Australia United
States of
America
Brazil New Zealand United
States of
America
Brazil Germany United
States of
America
Brazil
Annual (Jan/Dec) ......................................................................................... (USD per tonne) .........................................................................................
2008 3 024 4 325 3 785 2 975 2 270 3 000 2 364 997 1 896
2009 2 562 3 897 3 118 3 495 2 202 2 223 2 035 989 1 552
2010 3 272 4 378 3 919 3 662 2 454 2 747 1 913 1 032 1 781
2011 3 944 4 516 4 816 5 370 2 648 3 023 2 169 1 147 2 083
2012 4 176 4 913 4 492 4 754 2 676 2 784 2 233 1 228 1 931
2013 4 009 5 535 4 326 4 130 2 717 2 872 2 311 1 229 2 014
2014 5 016 6 678 4 515 4 687 3 183 3 434 2 106 1 206 1 940
2015 4 638 6 201 4 130 3 641 2 576 2 499 1 582 1 003 1 642
2016 4 059 5 569 3 836 3 571 2 424 2 143 1 682 914 1 532
2017 4 378 5 871 4 047 4 486 2 529 2 482 1 871 999 1 653
2018 4 110 6 416 3 931 5 249 2 506 1 965 1 728 971 1 552
Monthly
2018 – October 3 735 6 563 3 796 5 308 2 417 1 796 1 624 904 1 531
2018 – November 3 875 6 589 3 854 5 412 2 462 1 858 1 596 892 1 575
2018 – December 4 096 6 526 3 697 5 272 2 395 1 986 1 596 851 1 600
2019 – January 4 166 6 318 3 686 4 827 2 367 2 010 1 600 850 1 563
2019 – February 4 373 6 482 3 666 4 798 2 328 1 980 1 629 874 1 595
2019 – March 4 470 6 546 3 631 4 675 2 272 2 052 1 701 912 1 599
2019 – April 4 693 6 567 3 669 4 684 2 298 2 160 1 979 974 1 602
2019 – May 4 529 6 443 3 755 4 777 2 435 2 268 2 047 1 016 1 695
2019 – June 4 591 6 427 3 709 4 997 2 591 2 308 2 119 1 059 1 624
2019 – July 4 674 6 299 3 908 5 245 2 659 2 297 2 049 1 085 1 686
2019 – August 4 633 6 263 4 136 5 246 2 613 2 235 2 112 1 089 1 665
2019 – September 4 779 6 244 4 227 5 385 2 620 2 312 2 096 1 095 1 640
2019 – October 4 954 6 231 4 290 5 464 2 642 2 337 2 103 1 098 1 630
Notes:

Sta
tist
ica
l a
pp
en
dix
86 87FOOD OUTLOOKNOVEMBER 2019
FOOD OUTLOOKNOVEMBER 2019
APPENDIX TABLE 28: SELECTED INTERNATIONAL MEAT PRICES AND FAO MEAT PRICE INDICES
FAO indices
Period Total meat Bovine meat Ovine meat Pig meat Poultry meat
Annual (Jan/Dec) .............................................................................. (2002-2004=100) .........................................................................
2008 161 158 128 152 184
2009 141 135 151 131 162
2010 158 165 158 138 179
2011 183 191 232 153 206
2012 182 195 205 153 201
2013 184 197 178 157 206
2014 198 231 202 164 200
2015 168 213 157 126 168
2016 156 191 154 123 156
2017 170 204 194 135 169
2018 166 204 227 124 160
Monthly
2018 – October 160 197 229 117 155
2018 – November 163 201 234 117 157
2018 – December 162 202 228 117 156
2019 – January 160 200 208 117 154
2019 – February 163 205 207 117 157
2019 – March 164 207 202 120 160
2019 – April 171 212 202 131 164
2019 – May 174 209 206 136 173
2019 – June 176 209 216 142 171
2019 – July 179 212 226 141 176
2019 – August 180 214 226 141 175
2019 – September 181 217 232 142 174
2019 – October 183 221 236 143 173
Notes: The FAO Meat Price Indices consist of 2 poultry meat product quotations (the average weighted by assumed fixed trade weights) - 3 bovine meat product quotations (average weighted by assumed fixed trade weights) - 3 pig meat product quotations (average weighted by assumed fixed trade weights) - 1 ovine meat product quotation (average weighted by assumed fixed trade weights): the four meat group average prices are weighted by world average export trade shares for 2002/2004.
Prices for the two most recent months may be estimates and subject to revision.

86 87FOOD OUTLOOKNOVEMBER 2019
FOOD OUTLOOKNOVEMBER 2019
APPENDIX TABLE 29: FISH PRICE INDICES
Period Total White fish Salmon Shrimp Pelagic
excl. tuna
Tuna
Annual (Jan/Dec) .................................................................. (2002-2004=100) ..................................................................
2008 136 151 151 109 148 162
2009 126 132 159 98 140 147
2010 137 138 187 109 144 146
2011 154 151 195 124 173 175
2012 144 145 146 107 207 195
2013 148 134 157 126 215 190
2014 157 142 159 148 210 175
2015 141 142 131 121 253 149
2016 151 140 178 123 257 164
2017 158 152 183 126 234 183
2018 158 169 185 116 244 172
Monthly
2017 - January 155 143 205 125 241 156
2017 - February 155 151 188 123 235 168
2017 - March 155 148 180 126 255 171
2017 - April 154 147 179 127 239 165
2017 - May 160 150 210 128 230 175
2017 - June 163 149 202 127 269 190
2017 - July 159 153 197 124 223 185
2017 - August 157 153 178 125 211 195
2017 - September 160 157 175 126 218 204
2017 - October 161 158 171 126 207 216
2017 - November 155 158 148 126 233 192
2017 - December 156 158 163 124 243 182
2018 - January 161 169 178 122 246 179
2018 - February 162 167 196 120 267 171
2018 - March 165 170 216 120 253 167
2018 - April 165 169 211 119 266 176
2018 - May 165 168 225 116 249 173
2018 - June 159 165 188 113 276 174
2018 - July 153 165 168 113 256 168
2018 - August 150 167 157 112 219 169
2018 - September 153 168 181 115 218 160
2018 - October 154 165 177 114 216 174
2018 - November 154 175 157 112 227 178
2018 - December 156 178 167 112 236 171
2019 - January 158 182 176 111 222 177
2019 - February 161 193 173 110 225 179
2019 - March 165 197 187 111 243 173
2019 - April 163 186 201 111 239 172
2019 - May 156 180 174 111 223 170
2019 - June 158 176 172 112 289 162
2019 - July 151 170 161 114 226 162
2019 - August 147 160 152 115 216 163
2019 - September 143 156 137 114 231 157
Source of the raw data for the FAO Fish Price Index: EUMOFA, INFOFISH, INFOPESCA, Statistics Norway.Note: The table presents a new version of the FAO Fish Price Index, with slight differences compared to the data included in previous issues. These changes were implemented in order to be more consistent with the methodology and timing requirements of the price indices reported in the Food Outlook.

Sta
tist
ica
l a
pp
en
dix
88 89FOOD OUTLOOKNOVEMBER 2019
FOOD OUTLOOKNOVEMBER 2019
APPENDIX TABLE 30: SELECTED INTERNATIONAL COMMODITY PRICES
Currency and unit Effective date Latest quotation One month ago One year ago Average
2013-2017
Sugar (ISA daily price) US cents per lb 31-10-19 12.59 12.75 12.50 15.40
Coffee (ICO daily price) US cents per lb 31-10-19 101.56 99.56 111.21 128.59
Cocoa (ICCO daily price) US cents per lb 31-10-19 108.98 108.55 96.81 121.55
Tea (FAO Tea Composite Price) USD per kg 30-09-19 2.38 2.35 2.54 2.75
Cotton (COTLOOK A index) US cents per lb 30-09-19 71.31 70.78 90.36 80.47
Jute “BTD” (Fob Bangladesh Port)
USD per tonne 31-10-19 760.00 740.00 840.00 723.92

88 89FOOD OUTLOOKNOVEMBER 2019
FOOD OUTLOOKNOVEMBER 2019

90 91
MAR
KET
INID
CATO
RS
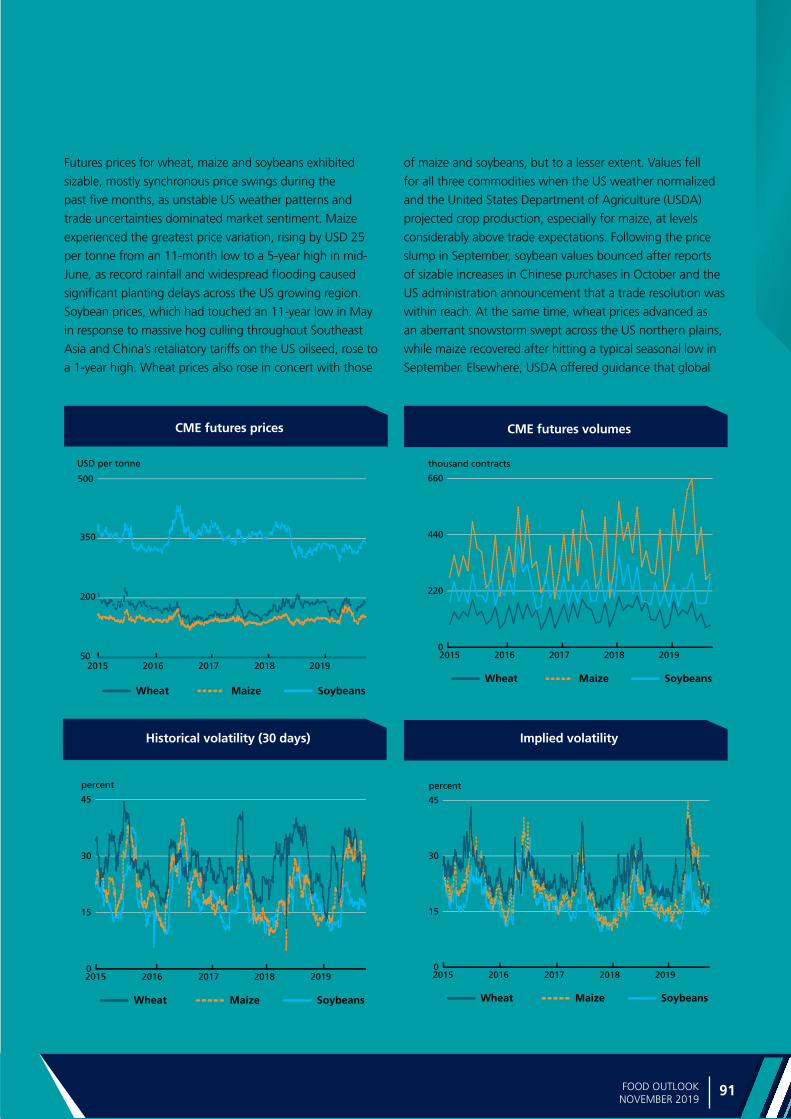
Ma
rke
t ind
icato
rs
90 91FOOD OUTLOOKNOVEMBER 2019
Futures prices for wheat, maize and soybeans exhibited
sizable, mostly synchronous price swings during the
past five months, as unstable US weather patterns and
trade uncertainties dominated market sentiment. Maize
experienced the greatest price variation, rising by USD 25
per tonne from an 11-month low to a 5-year high in mid-
June, as record rainfall and widespread flooding caused
significant planting delays across the US growing region.
Soybean prices, which had touched an 11-year low in May
in response to massive hog culling throughout Southeast
Asia and China’s retaliatory tariffs on the US oilseed, rose to
a 1-year high. Wheat prices also rose in concert with those
CME futures prices CME futures volumes
Historical volatility (30 days) Implied volatility
50
200
350
500
20192018201720162015
Wheat Maize Soybeans
USD per tonne
0
15
30
45
20192018201720162015
Wheat Maize Soybeans
percent
of maize and soybeans, but to a lesser extent. Values fell
for all three commodities when the US weather normalized
and the United States Department of Agriculture (USDA)
projected crop production, especially for maize, at levels
considerably above trade expectations. Following the price
slump in September, soybean values bounced after reports
of sizable increases in Chinese purchases in October and the
US administration announcement that a trade resolution was
within reach. At the same time, wheat prices advanced as
an aberrant snowstorm swept across the US northern plains,
while maize recovered after hitting a typical seasonal low in
September. Elsewhere, USDA offered guidance that global
Futures markets
0
220
440
660
20192018201720162015
Wheat Maize Soybeans
thousand contracts
0
15
30
45
20192018201720162015
Wheat Maize Soybeans
percent

Ma
rke
t in
dic
ato
rs
92 FOOD OUTLOOKNOVEMBER 2019
supplies were adequate, citing fractional changes to various
regions. The effects of developments in exogenous markets,
such as energy prices and foreign exchange movements,
appeared muted. Excluding a brief price spike, West Texas
Intermediate crude oil traded in a narrow USD 50–60/barrel
range during the last five months and the US dollar remained
steady, but firm. In common with last year’s price action,
weather and trade issues superseded other factors.
FORWARD CURVES
Forward curves for wheat, maize and soybeans exhibited
dramatic moves as buyers amassed both old and new
crop contracts for maize and soybeans during the rain-
drenched spring planting period. The y/y curve (calculating
the difference between December 2019 and December
2020 contracts) for maize attained a substantial inverse
(downward sloping) of USD 18 in June at the height of the
price rise, falling USD 31 by month end and reconfiguring
into a steep contango (upward sloping) of USD 13, before
rebounding somewhat. The y/y soybean spread (November
2019 – November 2020) saw similar tightening and
subsequent relaxation from USD 5 contango to USD 23
contango, but by a much lesser degree than the y/y maize
spread. It too rebounded on increased demand prospects
and a sharp downward revision by USDA of 2020 ending
soybean stocks. Conversely, wheat curves experienced
tightening of front spreads as cash wheat prices were quoted
at substantial premiums over nearby futures prices. Notably,
the July 2019/September 2019 spread inverted by USD 5
during July expiration, as commercial end-users of wheat
(flour millers) maintained long futures hedges into expiration
in order to force futures and cash convergence. This cash
wheat shortage has caused the December 2019/December
2020 wheat spread to trade at a narrow upward slope of
USD 10, compared with USD 24 and USD 29 during the two
previous years.
VOLUMES
Trade volumes slowed for wheat and soybeans y/y, but
set new monthly records for maize during the height of
planting uncertainties in May and June. Volumes for all three
commodities followed seasonal trends, declining from July
onwards, with only maize posting higher levels compared
with the same period in 2018. All three commodities
recorded declines in open interest y/y. Commercial
participants (reported by the Commodity Futures Trading
Commission (CFTC) as number of traders) in soybeans
declined among the three commodities y/y, underscoring the
relative complexity of hedging price risks amid ongoing trade
Forward curves snapshots as of Oct 2017, 2018 and 2019
Soybeans
300
316
332
348
364
380
MayMarJanNovSepAugJulMayMarJanNov
2017
2018
2019
USD per tonne
Maize
130
138
146
154
162
170
MayMarDecSepJulMayMarDec
2018
2019
2017
USD per tonne
Wheat
140
156
172
188
204
220
JulMayMarDecSepJulMayMarDec
2017
2018
2019
USD per tonne
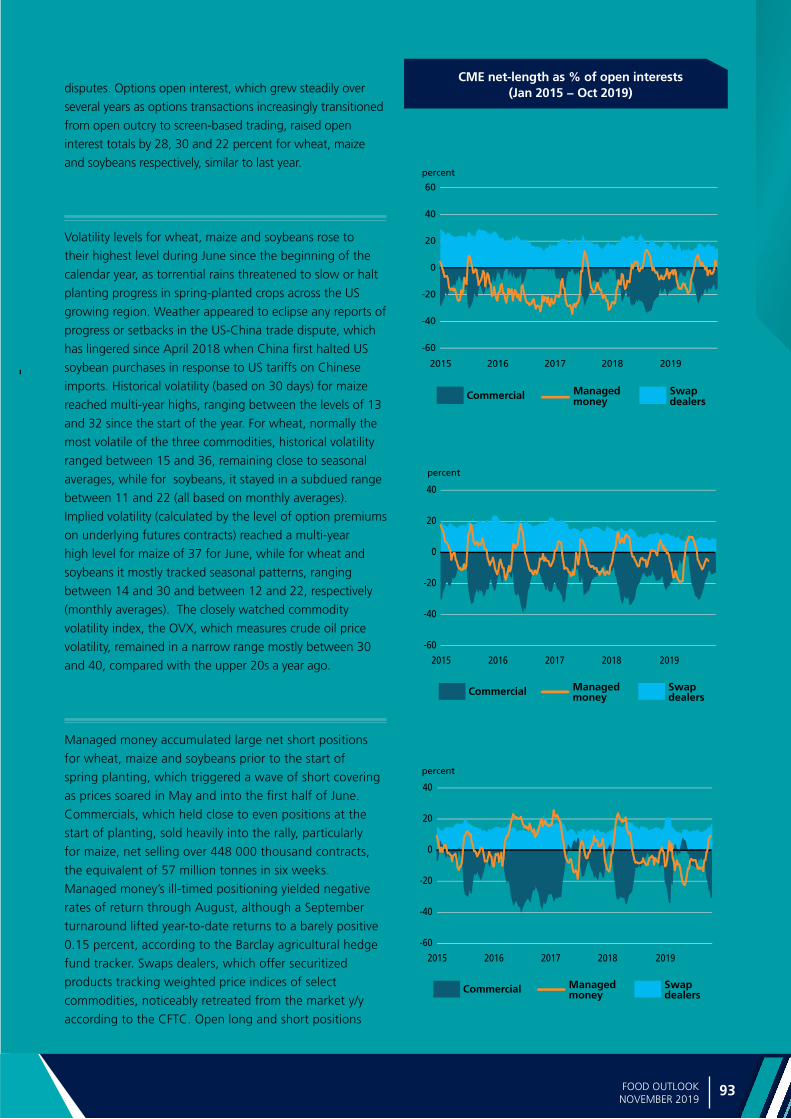
Ma
rke
t ind
icato
rs
93FOOD OUTLOOKNOVEMBER 2019
disputes. Options open interest, which grew steadily over
several years as options transactions increasingly transitioned
from open outcry to screen-based trading, raised open
interest totals by 28, 30 and 22 percent for wheat, maize
and soybeans respectively, similar to last year.
VOLATILITY
Volatility levels for wheat, maize and soybeans rose to
their highest level during June since the beginning of the
calendar year, as torrential rains threatened to slow or halt
planting progress in spring-planted crops across the US
growing region. Weather appeared to eclipse any reports of
progress or setbacks in the US-China trade dispute, which
has lingered since April 2018 when China first halted US
soybean purchases in response to US tariffs on Chinese
imports. Historical volatility (based on 30 days) for maize
reached multi-year highs, ranging between the levels of 13
and 32 since the start of the year. For wheat, normally the
most volatile of the three commodities, historical volatility
ranged between 15 and 36, remaining close to seasonal
averages, while for soybeans, it stayed in a subdued range
between 11 and 22 (all based on monthly averages).
Implied volatility (calculated by the level of option premiums
on underlying futures contracts) reached a multi-year
high level for maize of 37 for June, while for wheat and
soybeans it mostly tracked seasonal patterns, ranging
between 14 and 30 and between 12 and 22, respectively
(monthly averages). The closely watched commodity
volatility index, the OVX, which measures crude oil price
volatility, remained in a narrow range mostly between 30
and 40, compared with the upper 20s a year ago.
INVESTMENT FLOWS
Managed money accumulated large net short positions
for wheat, maize and soybeans prior to the start of
spring planting, which triggered a wave of short covering
as prices soared in May and into the first half of June.
Commercials, which held close to even positions at the
start of planting, sold heavily into the rally, particularly
for maize, net selling over 448 000 thousand contracts,
the equivalent of 57 million tonnes in six weeks.
Managed money’s ill-timed positioning yielded negative
rates of return through August, although a September
turnaround lifted year-to-date returns to a barely positive
0.15 percent, according to the Barclay agricultural hedge
fund tracker. Swaps dealers, which offer securitized
products tracking weighted price indices of select
commodities, noticeably retreated from the market y/y
according to the CFTC. Open long and short positions
CME net-length as % of open interests (Jan 2015 − Oct 2019)
Maize
Soybeans
Wheat
-60
-40
-20
0
20
40
60
20192018201720162015
percent
Commercial Managedmoney
Swapdealers
-60
-40
-20
0
20
40
20192018201720162015
percent
Commercial Managedmoney
Swapdealers
-60
-40
-20
0
20
40
20192018201720162015
percent
Commercial Managedmoney
Swapdealers
140
156
172
188
204
220
JulMayMarDecSepJulMayMarDec
2017
2018
2019
USD per tonne

Ma
rke
t in
dic
ato
rs
94 95FOOD OUTLOOKNOVEMBER 2019
for wheat, maize and soybeans, as detailed in the CFTC’s
Commitment of Traders Report, declined between 25 and
30 percent compared with last year, probably signifying
client withdrawal of funds under management owing to
lacklustre or negative price performance. The Deutsche
Bank Agricultural Index Fund, which tracks ten agricultural
futures markets including wheat, maize and soybeans,
sunk to a new low of USD 14.92 during September,
before rebounding somewhat in October, marking eight
consecutive years of declining agricultural prices.
Ann Berg (International Consultant)

Ma
rke
t ind
icato
rs
94 95FOOD OUTLOOKNOVEMBER 2019
Ocean freight rates
OCEAN FREIGHT MARKET (MAY 2019 – OCTOBER 2019)
The dry bulk freight market posted steep gains over the
past six months, mainly linked to a strong showing during
the summer months. Despite background worries about
ongoing trade disputes, vessel earnings climbed to multi-
year highs recently on strong spot demand, with the
Baltic Dry Index (BDI) – a benchmark for costs across dry
bulk segments – approaching a nine-year peak in early-
September. Despite a subsequent retreat amid mounting
worries about a slowing global economy, the Index more
than doubled since late-April and is up by 15% y/y.
Freight costs in the grains and oilseeds market segment
also firmed markedly, although gains were smaller
compared to the broader market. While the IGC Grains and
Oilseeds Freight Index (GOFI), which provides a measure
of nominal voyage rates on main routes, strengthened
by 11%, overall increases were capped by declines in
bunker prices. However, the fuel market witnessed two-
sided swings, with prices spiking following mid-September
attacks on oil facilities in Saudi Arabia.
The market for the largest Capesize vessels, typically
engaged in the transportation of heavy raw materials,
posted the sharpest gains over the period, with the
corresponding Baltic sub-Index increasing nearly five-fold.
Values staged a speedy recovery from early-April lows,
rising to a nine-year peak in early-September on resurgent
iron ore dispatches from Brazil following disruption due
to a mining dam collapse. This was coupled with fresh
International Grains Council (IGC) www.igc.int
Summary of dry bulk freight markets
24 Oct
2019
Changes
6 months y/y
%
Baltic Dry Index (BDI)* 1 785 +110 +15
Sub-indices:
Capesize 2 926 +352 +23
Panamax 1 748 +49 +5
Supramax 1 200 +55 +5
Baltic Handysize Index
(BHSI)** 637 +63 -6
Index Grains and Oilseeds
Freight Index (GOFI)*** 130 +11 -11
BDI and IGC GOFI (24 October 2018 – 24 October 2019)
Baltic Capesize Index (24 October 2018 – 24 October 2019)
0
25
50
75
100
125
150
175
200
225
OSAJJMAMFJDNO20192018
Rebased, 24 Oct 2018 = 100
Note: IGC Grains and Oilseeds Freight Index, constructed based on nominal
freight rates on major grains/oilseeds routes using trade-weighted approach.
Source: Baltic Exchange, IGC
Source: Baltic Exchange
business out of the Black Sea region and Canada, while
robust ore and coal flows from Australia added to upside.
Reflecting generally strong demand, China’s total imports of
coal, iron ore and soyabeans hit a quarterly record in July-
September. However, a weakening trend in freight rates
prevailed in recent weeks as the market focused on slowing
20
52
84
116
148
180
OSAJJMAMFJDNO
Rebased, 24 Oct 2018 = 100
2018 2019
BDI IGC GOFI
Source: Baltic Exchange, IGC. * 4 January 1985 = 1000. ** 23 May 2006 = 1000. *** 1 January 2013 = 100.

Ma
rke
t in
dic
ato
rs
FOOD OUTLOOKNOVEMBER 2019
global economic growth, with such international bodies as
the WTO and the OECD downgrading outlooks for world
trade and GDP. Nevertheless, ongoing scrubber-fitting
activity ahead of the introduction of IMO 2020 regulations
has been a notable supportive factor lately.
The Panamax segment also witnessed two-sided trends.
After a period of somewhat hesitant trade, average rates
surged in July, driven by firm demand for soyabeans and
maize shipments out of South America. Gains were led by
transatlantic routes, where daily earnings rose to around
USD 29,000 – the highest since October 2010. Against
this backdrop, a nominal voyage rate from Brazil to China
touched USD 51/t in late July, the highest in at least four
years, while the spread between transatlantic and transpacific
timecharter levels also reached a multi-year peak. Although
markets in Argentina and Brazil remained active in the period
since, the Baltic sub-Index partly reversed gains thereafter,
in part linked to losses in the Capesize sector, but remains
up by about one-half compared to late-April. Some recent
support was afforded by news of fresh fixings from the Pacific
Northwest and, more recently, the US Gulf, as China secured
a number of soyabean cargoes ahead of a new round
of trade talks.
Values for smaller Supramax and Handysize carriers
in part tracked movements for Panamax bulkers, as an initial
downturn was followed by sustained advances through
early September. Supramax gains were mainly attributed to
strong demand in the Pacific, with fresh business in the Indian
Ocean, limited vessel availability in the Mediterranean and
strength in the northern Atlantic adding to upside at times.
Handysize gains over the period were partly tied to steady
increases at the US Gulf, where inland logistical difficulties
were coupled with exporters’ interest to load smaller
Dry bulk freight markets (up to 90,000 dwt): Deliveries vs. scrappage
Source:Thomson Reuters Research & Forecasts and IGC estimates
Source: Baltic Exchange
Grains and oilseeds carrying sectors: Panamax and Supramax sub-Indices and Handysize Index
24 October 2018 – 24 October 2019
20
40
60
80
100
120
140
160
OSAJJMAMFJDNO20192018
Supramax Handysize Panamax
Rebased, 24 Oct 2018 = 100
cargoes in effort to secure fresh business. Firmer demand
for Handysize grains/oilseeds shipments was also noted
in Argentina, where participants reportedly experienced
difficulties completing Panamax cargoes owing to low
water levels on the Parana River and dwindling supplies at
Atlantic ports.
Supply side developmentsWith Panamax vessels likely accounting for the bulk
of newbuilding deliveries, the global fleet of grains and
oilseeds carriers (including vessels below 10,000 dwt)
is expected to expand by 2.5% in 2019, a modest drop
in growth from the prior 12 months. Likewise, mostly
because of a large order-book for Panamax bulkers, the
rate of increase in 2020 is forecast at around 3%, as
larger deliveries are expected to be only partly countered
by increased vessel scrapping. This forecast compares to
projected annual rise in seaborne trade in coal and grains/
oilseeds of about 2%, which points to a potential for
continued overcapacity in the near-term.
It should be pointed out that projections for global trade
and demand for carriers have a significant downside risk,
not least because of persistent economic headwinds and
global trade tensions, while projections for vessel supply
are complicated by uncertainties about the upcoming
implementation of IMO 2020 requirements.
-20
-10
0
10
20
30
40
20202019201820172016201520142013proj.f’cast
0
1
2
3
4
5
6
m dwt
< Deliveries Fleet growth > < Scrappage
percentage
96 FOOD OUTLOOKNOVEMBER 2019

Ma
rke
t ind
icato
rs
FAO price indices1
FAO Global Food Consumption Price Index
The FAO Global Food Consumption Price Index (GFCPI) tracks
changes in the cost of a global food basket. It uses calorie
weights of major food items, derived from the FAO food
balance sheets (http://www.fao.org/faostat/en/#data/FBS) for
the base period of 2002–2004. Calorie weights for wheat,
rice, coarse grains, sugar, oilseed/crops, vegetable oils, beef,
pig meat, ovine meat, poultry, milk, and butter are multiplied
by their respective commodity price indexes and summed up.
These commodities cover 80 percent of global daily average
calorie consumption. The index is dominated by crop products,
which comprise an 83 percent share of the calories covered.
The corresponding price indexes for world trade are found in
Appendix Tables 21–28.
The GFCPI reached its all-time peak in February 2011 at a
level of 265 (basis 2002–2004=100). By 2015, it had fallen
by 40 percent and since then fluctuated between 160 and
180, a range that is about one-third lower than its historical
peak, suggesting a considerable relief for consumers in terms
of calorie costs in recent years. In October 2019 the index
averaged 175 points, just 3 points above its value a year
earlier. Over the last twelve months, the index has fluctuated
within the range of 171-177 points, as lower prices for
wheat and butter have been offset by increasing prices for
other commodities. Meat prices (particularly pig meat) which
increased the most over the last year have not markedly
affected the index given their low weight in the calorie
basket. The GFCPI peaked in June 2019 before falling to more
subdued levels.
A calorie vs protein basisAs a measure of the changing costs of the calorie basket of
primary food commodities, the current GFCPI is an indicator of
the purchasing power for calories and therefore also a rough
gauge for changes in the access to food, of calorie deficits and
of undernourishment. When based on protein weights, the
index captures the aggregate purchasing power for different
sources of protein. For animal protein sources, these are meats,
milk products and fish, and for crops, cereals are the dominant
source of proteins.
1 All changes referred to in this section, in absolute or percentage terms, are calculated based on unrounded figures.
Two alternative formulations of the GFCPI have been
constructed, one on a calorie, the other on a protein basis. The
exact weights of calorie and protein shares are summarized in
Table 1 and the corresponding price indices in Tables 21–29.
While these weights can differ markedly across commodities,
the dominant role of cereals as a source of both calories and
protein kept two indexes evolving in tandem (figure 2). This
was particularly the case in 2018 and 2019 where the two
series practically overlapped.
Some differences in the two indexes remain both with regard
to their levels and their variability. In general, the calorie-
based index displays a higher monthly variation and more
pronounced overall swings. In terms of levels, the protein-
based measure consistently remained below the calories-based
index. Only in 2019, the protein-based index exceeded the
calorie-based measure for the first time in many years.
Fish has been included as a weight in both indexes, given its
importance as a protein source for human diets. At about 25
kg per capita, current global fish consumption is higher than
that of individual meats, excluding poultry meat. However,
given its low calorie content, it assumes a low share in the
calorie-based index and its inclusion therefore translates into
only a small difference (0.3 points) compared with the existing
Figure 1. The FAO Global Food Consumption and Food Price Indices (Jun 2015 – Oct 2019)
140
149
158
167
176
185
20192018201720162015
2002-2004=100
FAO Global FoodConsumption Price Index
FAO Food Price Index
97FOOD OUTLOOKNOVEMBER 2019

Ma
rke
t in
dic
ato
rs
FOOD OUTLOOKNOVEMBER 2019
FOOD OUTLOOKNOVEMBER 2019
October registered the first monthly increase in the value of the FAO Food Price Index since May 20193
The FAO Food Price Index2 (FFPI) averaged 172.7 points in
October 2019, up by 4.2 percent (3 points) from September
and 6.0 percent higher than in the corresponding period
last year. The increase in October marked the first
significant month-on-month rise in the value of the Index
since May 2019, as surges in the prices of sugar, cereals
and, to a lesser extent, meat and vegetable oils, more than
offset a small decline in the value of the dairy sub-index.
The FAO Cereal Price Index averaged 164.0 points
in October, up by 4.2 percent (nearly 7 points) from
September but still 1.0 percent below its October 2018
level. International wheat prices moved up sharply in
October largely on robust trade activities and lower crop
prospects in Argentina and Australia. Among major coarse
grains, maize export prices also surged in October from
very low levels in September, reflecting not only reduced
crops in the United States and worries over planting
conditions in Argentina, but also a pick-up in export sales.
By contrast, FAO’s rice price index subsided in October,
driven by declines in fragrant rice quotations prompted by
low demand and prospects of an abundant basmati harvest.
The FAO Vegetable Oil Price Index averaged 136.4
points in October, up 0.5 percent (or 0.7 points) from
the previous month and marking the highest level since
September 2018. The small month-on-month increase
mainly reflects higher palm oil price quotations, which more
than offset lower values for sunflower and rapeseed oils.
International palm oil prices rose for the third consecutive
month, fuelled by firm global import demand and
expectations of an output slowdown in leading producing
countries, as well as news of higher biodiesel mandates
in Indonesia next year. By contrast, sunflower oil price
calorie-weighted GFCPI. By contrast, the high share of fish in
total protein consumption (7.2 percent, Table 1) makes it an
important element in the protein-weighted GFCPI.
98 FOOD OUTLOOKNOVEMBER 2019
FIgure 2. FAO Global Food Consumption Price Index – calorie vs protein-based
140
168
196
224
252
280
Oct
-19
Jun
-19
Jan
-19
Jun
-18
Jan
-18
Jun
-17
Jan
-17
Jun
-16
Jan
-16
Jun
-15
Jan
-15
Jun
-14
Jan
-14
Jun
-13
Jan
-13
Jun
-12
Jan
-12
Jun
-11
Jan
-11
Jun
-10
Jan
-10
2002–2004=100
GFCPI - Calorie GFCPI - Protein
Table 1: Shares of global average calorie and protein consumption by commodity
Calorie share
%
Protein share
w%
Wheat 24.5 28.3
Rice 24.1 17.2
Coarse grains 9.8 9.3
Sugar 10.6 0
Oilseeds 2.3 3.6
Vegetable oils 11.4 0
Bovine meat 1.8 6.1
Ovine meat 0.1 1.1
Pigmeat 5.0 7.1
Poultry 2.1 7.0
Milk excluding butter 5.6 12.7
Butter 1.2 0
Fish 1.3 7.2
Total 100 100
Note: Shares computed from FAO Food Balance data for 2002-04, and
normalized to sum to 100
2 The FAO Food Price Index and its sub-indices are updated on a montly basis and are available on http://www.fao.org/worldfoodsituation3 The FAO Global Food Consumption Price Index is published twice a year in Food Outlook.
Merritt Cluff (International Consultant)
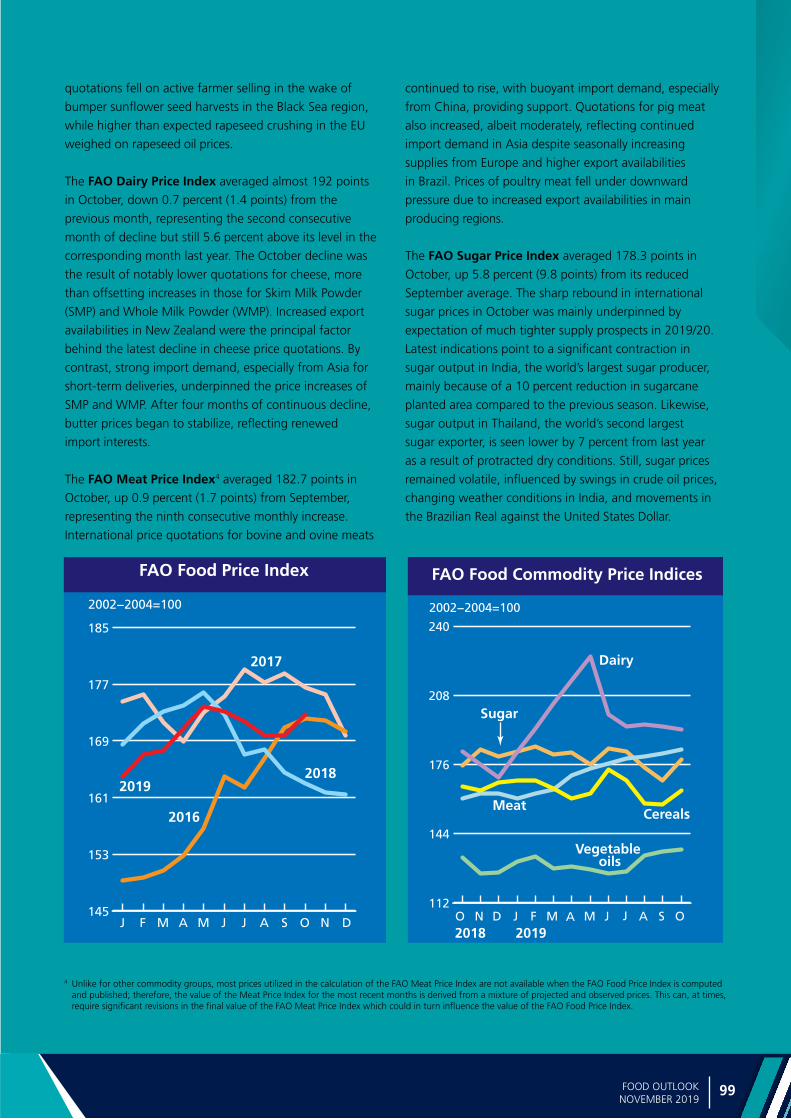
Ma
rke
t ind
icato
rs
FOOD OUTLOOKNOVEMBER 2019
FOOD OUTLOOKNOVEMBER 2019
145
153
161
169
177
185
2002−2004=100
2016
20192018
2017
FAO Food Price Index
DNOSAJJMAMFJ
112
144
176
208
240
2018 2019
2002−2004=100
Dairy
Vegetable oils
Cereals
Sugar
Meat
FAO Food Commodity Price Indices
OSAJAMJDNO F M J
quotations fell on active farmer selling in the wake of
bumper sunflower seed harvests in the Black Sea region,
while higher than expected rapeseed crushing in the EU
weighed on rapeseed oil prices.
The FAO Dairy Price Index averaged almost 192 points
in October, down 0.7 percent (1.4 points) from the
previous month, representing the second consecutive
month of decline but still 5.6 percent above its level in the
corresponding month last year. The October decline was
the result of notably lower quotations for cheese, more
than offsetting increases in those for Skim Milk Powder
(SMP) and Whole Milk Powder (WMP). Increased export
availabilities in New Zealand were the principal factor
behind the latest decline in cheese price quotations. By
contrast, strong import demand, especially from Asia for
short-term deliveries, underpinned the price increases of
SMP and WMP. After four months of continuous decline,
butter prices began to stabilize, reflecting renewed
import interests.
The FAO Meat Price Index4 averaged 182.7 points in
October, up 0.9 percent (1.7 points) from September,
representing the ninth consecutive monthly increase.
International price quotations for bovine and ovine meats
continued to rise, with buoyant import demand, especially
from China, providing support. Quotations for pig meat
also increased, albeit moderately, reflecting continued
import demand in Asia despite seasonally increasing
supplies from Europe and higher export availabilities
in Brazil. Prices of poultry meat fell under downward
pressure due to increased export availabilities in main
producing regions.
The FAO Sugar Price Index averaged 178.3 points in
October, up 5.8 percent (9.8 points) from its reduced
September average. The sharp rebound in international
sugar prices in October was mainly underpinned by
expectation of much tighter supply prospects in 2019/20.
Latest indications point to a significant contraction in
sugar output in India, the world’s largest sugar producer,
mainly because of a 10 percent reduction in sugarcane
planted area compared to the previous season. Likewise,
sugar output in Thailand, the world’s second largest
sugar exporter, is seen lower by 7 percent from last year
as a result of protracted dry conditions. Still, sugar prices
remained volatile, influenced by swings in crude oil prices,
changing weather conditions in India, and movements in
the Brazilian Real against the United States Dollar.
4 Unlike for other commodity groups, most prices utilized in the calculation of the FAO Meat Price Index are not available when the FAO Food Price Index is computed and published; therefore, the value of the Meat Price Index for the most recent months is derived from a mixture of projected and observed prices. This can, at times, require significant revisions in the final value of the FAO Meat Price Index which could in turn influence the value of the FAO Food Price Index.
99FOOD OUTLOOKNOVEMBER 2019

Ma
rke
t in
dic
ato
rs
100 FOOD OUTLOOKNOVEMBER 2019
Food Price Index1 Meat2 Dairy3 Cereals4 Vegetable Oils5 Sugar6
2001 94.6 100.1 105.5 86.8 67.2 122.6
2002 89.6 89.9 80.9 93.7 87.4 97.8
2003 97.7 95.9 95.6 99.2 100.6 100.6
2004 112.7 114.2 123.5 107.1 111.9 101.7
2005 118.0 123.7 135.2 101.3 102.7 140.3
2006 127.2 120.9 129.7 118.9 112.7 209.6
2007 161.4 130.8 219.1 163.4 172.0 143.0
2008 201.4 160.7 223.1 232.1 227.1 181.6
2009 160.3 141.3 148.6 170.2 152.8 257.3
2010 188.0 158.3 206.6 179.2 197.4 302.0
2011 229.9 183.3 229.5 240.9 254.5 368.9
2012 213.3 182.0 193.6 236.1 223.9 305.7
2013 209.8 184.1 242.7 219.3 193.0 251.0
2014 201.8 198.3 224.1 191.9 181.1 241.2
2015 164.0 168.1 160.3 162.4 147.0 190.7
2016 161.5 156.2 153.8 146.9 163.8 256.0
2017 174.6 170.1 202.2 151.6 168.8 227.3
2018 168.4 166.3 192.9 165.3 144.0 177.5
2018 October 162.9 160.4 181.8 165.7 132.9 175.4
November 161.8 162.6 175.8 164.1 125.3 183.1
December 161.5 162.4 170.0 167.8 125.8 179.6
2019 January 163.9 160.1 182.1 168.7 131.2 181.9
February 167.0 162.7 192.4 168.5 133.5 184.1
March 167.6 164.5 204.3 164.7 127.6 180.4
April 170.7 170.9 215.0 160.1 128.7 181.7
May 173.8 174.3 226.1 162.3 127.4 176.0
June 173.2 176.4 199.2 173.5 125.5 183.3
July 171.7 178.9 193.5 168.4 126.5 182.1
August 169.7 179.6 194.5 157.8 133.9 174.8
September 169.7 181.0 193.4 157.4 135.7 168.6
October 172.7 182.7 192.0 164.0 136.4 178.3
FAO Food Price Indices
1 Food Price Index: Consists of the average of five commodity group price indices mentioned above, weighted with the average export share of each of the groups for
2002−2004. In total 73 price quotations considered by FAO commodity specialists as representing the international prices of the food commodities are included in the
overall index. Each sub-index is a weighted average of the prices of the commodities included in the group, with the base period price consisting of the averages for
the years 2002-2004.
2 Meat Price Index: Computed from average prices of four types of meat, weighted by world average export trade shares for 2002-2004. Commodities include two
poultry products, three bovine meat products, three pig meat products, and one ovine meat product. There are 27 price quotations in total used in the calculation of
the index. Where more than one quotation exists for a given meat type, a simple average is used. Prices for the two most recent months may be estimates and subject
to revision.
3 Dairy Price Index: Consists of butter, SMP, WMP, and cheese price quotations; the average is weighted by world average export trade shares for 2002-2004.
4 Cereals Price Index: This index is compiled using the International Grains Council (IGC) wheat price index, itself an average of ten different wheat price quotations,
1 maize export quotation and 16 rice quotations. The rice quotations are combined into three groups consisting of Indica, Japonica and Aromatic rice varieties. Within
each variety, a simple average of the relative prices of appropriate quotations is calculated; then the average relative prices of each of the three varieties are combined
by weighting them with their assumed (fixed) trade shares. Subsequently, the IGC wheat price index, after converting it to base 2002-2004, the relative prices of maize
and the average relative prices calculated for the rice group as a whole are combined by weighting each commodity with its average export trade share for 2002-2004.
5 Vegetable Oils Price Index: Consists of an average of ten different oils weighted with average export trade shares of each oil product for 2002-2004.
6 Sugar Price Index: Index form of the International Sugar Agreement prices with 2002−2004 as base.

Global exports of bananas, excluding plantain, reached a
record high of 19.2 million tonnes in 2018, on the back of ample growth in supplies. Reported figures for the full year indicate an increase in global shipments of 5.7 percent compared to 2017. Strong supply growth in the two leading exporters, Ecuador and the Philippines, was mainly accountable for this rise. Meanwhile, adverse weather conditions continued to affect shipments from several other key suppliers, most notably Costa Rica and the Dominican Republic.
Available at: http://www.fao.org/economic/est/est-commodities/bananas/en/
BANANA MARKET REVIEW

Food Outlook is published by the Trade and Markets Division of FAO under the Global Information and Early Warning System (GIEWS).
It is a biannual publication focusing on developments affecting global food and feed markets. Each report provides market assessments and short term forecasts on a commodity by commodity basis and includes feature articles on topical issues. Food Outlook maintains a close synergy with another major GIEWS publication, Crop Prospects and Food Situation, especially with regard to the coverage of cereals. Food Outlook is available in English. The summary section is also available in Arabic, Chinese, French, Russian and Spanish.
Food Outlook and other GIEWS reports are available on the internet as part of the FAO world wide web (http://www.fao.org/) at the following URL address: http://www.fao.org/giews/. Other relevant studies on markets and the global food situation can be found at http://www.fao.org/worldfoodsituation.
This report is based on information available up to late October 2019.
For enquiries or further information contact:
Trade and Markets Division
Food and Agriculture Organization of the United Nations
Viale delle Terme di Caracalla
00153 Rome - Italy
Telephone: 0039-06-5705-3264
Facsimile: 0039-06-5705-4495
E-mail: [email protected] or [email protected]
CA6911EN/1/11.19
ISBN 978-92-5-131932-1 ISSN 0251-1959
9 7 8 9 2 5 1 3 1 9 3 2 1