food marketing policy center - university of connecticut marketing policy center at the university...
TRANSCRIPT

Food Marketing Policy Center
Market Definition and Market Power in the British Supermarket Industry
by Ronald W. Cotterill
Food Marketing Policy Center Research Report No. 98
October 2007
Research Report Series http://www.fmpc.uconn.edu
University of Connecticut Department of Agricultural and Resource Economics
Market Definition and Market Power in the British Supermarket Industry
Expert Report
of
Ronald W. Cotterill
October 10, 2007
ii
Table of Contents I. Introduction..........................................................................................................................1
II. Materials Used for this Analysis..........................................................................................6
III. Defining Antitrust Markets ..................................................................................................6
A. A “Small but Significant” Price Increase.................................................................8 B. Price Flexing to Achieve a “Small but Significant” Increase in Price.....................9 C. The Impact of Imperfect Consumer Information on a “Nontransitory Increase
in Price” .................................................................................................................10
IV. Product Market Definition for the UK Grocery Industry: The Competition Commission Entry Analysis ..............................................................................................14
V. Tesco’s Simulation Model of the SSNIP Test to Define Geographic Markets .................15
A. The Decision Technology Logit ............................................................................19 B. Conclusion on the Tesco – Frontier SSNIP Modeling Exercise............................23 C. More Rigorous Quantitative Modeling of SSNIP Tests ........................................24 D. Population Recentering is Redundant....................................................................26 E. Tesco’s Claim for a National Market.....................................................................27 VI. Retrospective on Geographic Market Definition: Catchment Areas versus Market
Areas ..................................................................................................................................29 VII. Analysis of Competitive Effects in an Antitrust Market ...................................................31
A. Coordinated Effects ...............................................................................................31 B. Unilateral Effects ...................................................................................................33
VIII. The Competition Commission Analysis of Store Margins ................................................35
A. Introduction and Historical Overview ...................................................................35 B. Short Run (Static) and Long Run (Dynamic) Models of Oligopoly Pricing .........37 C. Specification of the Competition Commission Store Margin Model ....................43 D. Estimation Results .................................................................................................46 E. Suggestions for Further Research ..........................................................................47
References......................................................................................................................................50
Table 1. How Customers' Estimates Compare with Actual Prices ...............................................55
Annex A. Competition Commission Documents Used for this Report Annex B. Curriculum Vita

I. Introduction
In Alfred Marshall’s time Manchester was a market. Liverpool was a market.
Shrewsbury was a market. No one would have even suggested, much less argue, that these
cities, and other cities in the United Kingdom, are in the same market for the sale at retail of
groceries. Now comes Tesco with sundry observations of market conduct and a quantitative
model. Tesco submits that there is a national retail market for the supply and demand of
groceries.
In this report I will explain how to measure relevant antitrust markets for the analysis of
the market power of the leading supermarket chains in Great Britain. Given the recent
enforcement practices of the Competition Commission and the analyses submitted by, or on
behalf of, Tesco, Sainsbury, and other retailers, my explanation necessarily must also continue to
the measurement of market power. Non-coordinated competitive effects are also called
unilateral effects and I will use that term henceforth in this report. These strategic moves do not
require the cooperation of other firms. Coordinated effects (tacit collusion) do depend upon the
cooperation of other firms. The exercise of these types of market power is not mutually
exclusive (Levy and Reitzes 1993). Both types can elevate prices or otherwise distort the price,
quality, reach and service marketing mix in a market.
One must define a market, i.e. a Marshallian industry with several firms selling in that
market, before one can analyze the possible existence of coordinated effects among those firms.
Unilateral effects, however, do not rest upon the analysis of Marshallian markets as developed by
Chamberlin (1933), Robinson (1933) and Bain (1951, 1956, 1959). Unilateral effects rests upon
a general equilibrium or spatial model of competition wherein each firm competes with nearby
firms that offer next best substitutes to buyers. Such competition or lack of competition may

2
take place at the store level in a “corner” of a large spatially differentiated retail food market.
Triffin (1940) was the first industrial organization economist to abandon Marshallian markets
and concerns about coordinated actions that decrease competition. His work languished until the
1980’s when empirical measurement advances and electronic collection of massive disaggregate
databases on consumer purchases made unilateral effects analysis feasible.
My qualifications for addressing these market definition and market power issues in
general and specifically in food retailing are as follows. I am professor of Agricultural and
Resource Economics, and Economics. For the past 20 years I have served as Director of the
Food Marketing Policy Center at the University of Connecticut. Since 1998 I have served as
Editor of Agribusiness: An International Journal, a leading journal in the Agricultural and Food
Marketing field. I have a joint Ph.D. (1977) in Agricultural Economics and Economics with
specialization in industrial organization, agricultural marketing and quantitative methods from
the University of Wisconsin. For 30 years I have studied the marketing of food products
including specifically the organization and performance of the food retailing industry. My
published research includes analysis of the concentration profits relationship, the concentration
price relationship, entry, and barriers to entry across local urban food retailing markets in the
U.S. I have served as expert economist in many antitrust matters in the food and petroleum
sectors of the U.S. economy.
In food retailing I have testified for the FTC in a horizontal supermarket merger case, and
provided expert economic analysis to the FTC and state attorneys general on several horizontal
supermarket mergers. For example, in 1996, I assisted the FTC and the attorneys general from
New York, Connecticut, Massachusetts and Rhode Island in the analysis of the Royal Ahold
(parent of Edwards the number two supermarket chain in New England) acquisition of Stop and
3
Shop Supermarkets (the leading chain in New England). Based on a unilateral effects analysis
we devised a 31 store divestiture (over $600 million sales) in an attempt to preserve competition.
Some divested stores were literally across the street from each other so absent divestiture one
would have been shut down. Others had substantial overlap in the catchment areas and
inadequate competitive pressure from other supermarkets. In 1999 Royal Ahold attempted a
second major merger – the purchase of Pathmark Supermarkets, a leading New York City / Long
Island / New Jersey chain. My research (Cotterill, 1999) on behalf of Wakfern Food
Corporation, a smaller competitor who sought to expand in this area, was presented to the FTC
and the attorney generals in New Jersey and New York. It defined markets and documented both
coordinated and unilateral effects that would elevate prices to consumers. Moreover, a post
merger analysis of price performance of the stores divested in the 1996 Royal Ahold Stop and
Shop merger found that the divested stores and the chains that received them did not effectively
constrain the merged firm in pricing or market share growth (Cotterill, et al. 1999).
Consequently, my recommendation to the antitrust agencies was that divestiture would not be
adequate relief for Royal Ahold’s second major merger attempt in three years and that the
merger be vigorously challenged. After this report and negotiations with the agencies, Royal
Ahold withdrew its offer to purchase Pathmark.
I have estimated unilateral pricing models for branded food products and was the first
expert economist to present such an analysis in a federal court (State of New York v. R.J. Nabisco
and Philip Morris, 1993-1994). The court disavowed that analysis of unilateral power (Cotterill
and Haller 1997) and permitted Post Cereals, a unit of Philip Morris/Kraft to acquire the Nabisco
cereals operations in the U.S. Moreover, the defendant corporation Philip Morris threatened me
with a libel suit if I published or distributed in any fashion a related paper (Cotterill, Franklin,

4
and Haller 1994) on noncompetitive coordinated pricing in the RTE cereal industry.
Consequently, I provided my research to Congressmen Samuel Gejdenson and Charles D.
Schumer and assisted them in a year long jaw boning campaign on high cereal pricing in the
national, TV, radio, and newspaper media.1 During that year branded cereal consumption
declined for the first time since World War II. In response, the Post Cereal company announced
an across the board 20% cereal price reduction that was soon followed by the other major cereal
manufacturers. Subsequently I estimated that this saved consumers $2.633 billion over 35
months (Cotterill and Franklin, 1999).
Nearly all unilateral effects models of differentiated food product pricing have ignored
the impact of supermarket retailers on consumer prices and assumed that pricing power resides
solely with the branded product manufacturers (for example, Kellogg’s not Tesco). This in fact
is the case for my early work (Cotterill 1999, Cotterill and Haller 1997) and the studies that
Tesco experts Professor CONFIDENTIAL and Professor Jerry Hausman (2007, p. 1) have done
on branded food products. The first published study to measure the impact of retailers as well as
manufacturers on retail prices is Cotterill et al. (2000). In that study we find, after controlling for
manufacturer pricing, that retail prices for products aggregated into branded and private label
products are significantly higher in more concentrated local marketing areas.2 Supermarket
pricing power in local food retailing markets as well as manufacturer pricing power matters for
consumers.
1 One can’t sue a Congressman for libel. Philip Morris has a history of suing professors when they wish to report their research. In addition to cases in the cigarette industry where such research found a link to cancer, they also attempted to squash research by University of Wisconsin Professors Willard Mueller and Bruce Mason on Philip Morris/Kraft manipulation of cheese prices on the National Cheese Exchange (Mueller, Marion, and Sial 1997). Ultimately they backed down because the Attorney General of Wisconsin offered full legal support for the professors in any libel suit. 2 Information Resources Inc. defines 59 local marketing areas in the U.S. Cotterill, et al. (2000) analyzed these local market areas.
5
Recently with colleagues at the Food Marketing Policy Center I have employed discrete
choice random coefficient models to analyze the importance of store and consumer
characteristics on the demand for food products, manufacturer and retailer margins (Chidmi,
Lopez, and Cotterill, 2005 and Chidmi and Lopez, 2007). We find that consumer heterogeneity
and retailer pricing conduct matter when analyzing demand and retailer margins for specific
products such as milk or breakfast cereal.
Finally, I have testified before the U.S. Congress, regulatory agencies, and state
legislatures on food pricing and antitrust issues in food industries. Last fall I was invited to
participate in the United Kingdom Competition Commission Roundtable on Measuring Market
Power in Grocery Retailing.
Currently I am serving as expert economist in 1) a class action lawsuit on behalf of al
U.S. supermarkets and fruit wholesalers who allege that Del Monte monopolized the U.S. fresh
pineapple market in 1996 and out years, 2) the New Zealand Competition Commission challenge
to the acquisition of the country’s largest mass merchandiser who is expanding into supercenters,
by either of the two supermarket chains that operate virtually all of the supermarkets in New
Zealand (Woolworths and Foodstuffs), and 3) a small single store merger wherein a large chain
has acquired a supermarket one half mile from one of its store, shut it down, and assumed the site
lease so that no other supermarket can occupy the premises (Delco LLC and Edward Decker v.
Giant of Maryland LLC, Wakefern Food Corp., and Stop & Shop Supermarket Company, LLC.,
2007). My full C.V. is attached as Annex B.
6
II. Materials Used for this Analysis
In addition to the references cited and my research and experience in the analysis of
antitrust issues, including product and geographic market definition in food retailing, I have read
and carefully studied many documents that are directly related to the issue before the
Competition Commission. Included are the U.S. Horizontal Merger Guidelines (1992 as
revised), the UK Merger References Competition Commission Guidelines (2003b), the UK
Competition Commission Report on the supply of groceries from multiple stores in the United
Kingdom (2000), the Competition Commission Groceries Market Investigation “Emerging
Thinking” white paper (Jan 23, 2007), a related paper “Working Paper on Market Definition”
(Jan 23, 2007), and two papers by the Competition Commission staff, and that are not pubically
available: “Annex: The Impact of Local Competition on Store Profit Margins” and “Entry
Analysis Annex”. I also have studied several confidential submissions to the Commission by
Tesco and its consultants including expert reports by Professors CONFIDENTIAL, Ronald
Smith, Birkbeck College, University of London, and Jerry Hausman, MIT and by Sainsbury and
its consultants, RBB Economics. A list of materials read that overlaps with cited references is
attached as Annex A.
III. Defining Antitrust Markets
The merger guidelines on both sides of the Atlantic (US, UK, and EU) have over time
come to a common understanding, in principle, on how to define a market wherein one can
analyze firm conduct to determine whether it is anticompetitive and in violation of one or more
antitrust laws in the relevant jurisdiction. That principle is based upon the concept of cross price
elasticity of demand. Cross price elasticities of demand measure how much volume is lost to

7
each “substitute” firm when a firm elevates its price.3 There can be a chain of substitutes but
there may exist breaks in the chain such that one can define a market, i.e. a set of firms that
determine market conduct and performance.
Identification of such an antitrust market is operationalized as a SSNIP test. SSNIP is a
small but significant nontransitory increase in price. In supermarket cases, one starts with a
single store or a store from each of two merging firms that are close to each other and one asks if
a hypothetical monopolist (HM) controlled both and did a SSNIP would it be profitable, or
would enough consumers who shop at the SSNIP store(s) switch to competing stores, making the
SSNIP unprofitable. If it is profitable, then there is a break in the chain of substitutes and
insufficient competition from elsewhere. The store(s) are an antitrust market and one proceeds
to analyze competitive effects. If the SSNIP is not profitable, the market is broader. One
includes the next best substitute store and does the HM SSNIP exercise over the n+1 stores. One
continues this process of adding stores until one finds a set of stores where the HM can do the
SSNIP profitably.
The results of the test, depend on how one sets the SSNIP parameters. This first
parameter is the “small but significant” increase in price. Another parameter in the SSNIP is a
“nontransitory” increase in price. Finally, one need qualify the focus on price. The SSNIP
implicitly assumes that price (P) is the only term that varies, yet product quality (Q), product
selection reach (R), and service (S) levels also effect consumer switching. The complete
marketing mix offered to consumers is often summarized in this report as PQRS.
3 A firms own price elasticity measures the total effect on its own volume of its price increase. Using cross price elasticities allows one to identify the relative competitive importance of substitute firms and evaluate the competitive effect of a firm acquiring one or more of its competitors (substitute firms). For an example see Cotterill and Haller 1997.

8
A. A “Small but Significant” Price Increase
In the US and UK merger guidelines and all the papers that I have reviewed for this
report, except the second RBB Economics paper (2007b), the “small but significant” is routinely
set at 5% or even 10% increase in price. Merger guidelines on both sides of the Atlantic and the
UK Competition Commission, however, stress that for particular industries a different level may
be more appropriate.
One must ask to whom is the price increase small but significant? There is very little
research or even discussion about to whom and how high. The common understanding is that
the target group is consumers and that a 5 to 10% price increase for a product is “small but
significant”. RBB Economics argues, a 5% increase in food prices on just 1 in 20 British
citizens amounts to 300 million pounds (RBB Economics, 2007b, p. 5). Food expenditures are a
major budget item for consumers and one can’t not eat. Yet in a national market this increase
amounts only to a ¼ percent increase in UK food prices. Seen from this perspective, it is trivial.
Therein lies the importance of market definition. A ¼% increase across the UK has different
welfare consequences than a 5% increase in a particular area.
Returning to the 1 in 20 who are actually experiencing this increase, since food is such an
important and unavoidable budget item, perhaps it merits a lower “small but significant” price
increase, for example 2.5%. Recently the FTC argued for a 1% SSNIP but the court rejected it
(FTC v. Whole Foods, 2007). Note that as one reduces the SSNIP price increase, ceteris paribus,
the market area decreases and one converges towards a unilateral effects analysis. Two nearby
merged stores may be able to raise price 1%. If this is a market, one may miss coordinated
effects that possibly elevate prices 4% in a larger market area defined with a 5% SSNIP. As the
genie said to his new master, “Be careful what you wish for.”
9
B. Price Flexing to Achieve a “Small but Significant” Increase in Price
This is another feature of the “small but significant price” increase that merits analysis.
Both US and UK guidelines permit a flexed price by the HM. Prices may go up more at an
interior store than at those towards the perimeter of the proposed market. The average price
increase over all stores, however, must satisfy the SSNIP price target, for example 5%. RBB
Economics argues that if the HM can raise price 5% profitably in one or more stores then the set
of stores that allows this is a market (RBB Economics, 2007b, p. 4). The price increase in the
other store can be below 5% and thus the average for the market is below 5%. The literature
cited by RBB does not clearly support or refute its position. This is just another version of the
height of the “small but significant” price increase that I have already discussed.
Tesco has objected to the use of this pricing practice for defining the market. It argues
that each of the top four firms in the industry (Tesco, Sainsbury, Asda, and Morrisons) sets a
uniform price for a particular product in all its stores in the U.K. Therefore, price flexing should
not be used to define the product and geographic market.
Here, but not elsewhere in this paper, I will grant their premise: no price flexing in the
UK by the leading chains. Tesco’s argument still lacks merit because the merger guidelines and
the industrial organization economics that underpin the guidelines rule out observed firm conduct
such as pricing and “supply side” substitution when defining retail grocery markets.4 The scope
of the market rest solely on consumer substitution patterns which are based upon consumer
utility. One uses a hypothetical monopolist to probe consumer switching patterns for breaks in
4 The U.S. Guidelines categorically rule out this approach. In the UK Guidelines, for some reason, supply side substitution by “uncommitted entrants” i.e. those who can enter (and exit) the market in less than one year, is considered when defining a market. For grocery retailing, however, the Competition Commission has found that there is no “uncommitted entry” and no supply side substation (Competition Commission 2007b, Para 6).

10
the chain of substitutes of sufficient strength to make a SSNIP profitable. Then once one has a
market one analyzes observed firm conduct in it.
A HM can only price flex in a homogeneous product market if he can segregate buyers
and prevent arbitrage, i.e. classic price discrimination. A HM has much more latitude to price
flex in a differentiated product or geographic market because that market can support different
prices at different locations in equilibrium. Food retailing is not homogeneous in the product or
geographic dimension. In product space, for example, different formats are different “locations”.
I would note that Tesco and other leading chains do not dispute that they charge different prices
for the same product in their different format stores. This is price flexing in product space.
C. The Impact of Imperfect Consumer Information on a “Nontransitory Increase in Price”
Tesco maintains that food shoppers have perfect information about all prices in all stores
in a wide area and will be able to measure precisely the amount of any price increase by a
hypothetical monopolist of any set of stores, and would quickly switch to defeat that price
increase. Tesco states:
If in theory customers were ill-informed as to the choices available to them, a SSNIP would be more profitable to the HM as the level of switching would be reduced and the speed with which switching occurred would decline. However, we do not think that there is a material lack of information in the grocery retail sector. Indeed, it is hard to think of a sector which has greater information and transparency (Tesco, Undated a, p. 18).
In support, Tesco explains:
• customers shop on a regular basis
• customers switch regularly from retailer to retailer: on average three retailers in a 4-week
period.
11
• customers learn about prices from family, friends, retailer websites, advertising, and
media reporting on price rises, especially if prices are flexed across a city disadvantaging
some areas relative to others.
Yet shopping on a regular basis does little to aid a consumer who faces prices on over
30,000 items in a store and needs to compare prices on several hundred branded and store own
label products each week in several different chains to consider switching. Chain websites with
price check services such as the one at Tesco.com are for one product at a time. This effectively
precludes any meaningful price comparison for a basket of items because it is so laborious and
time consuming. Not everyone enjoys using a computer to compare prices, create a shopping
list, and choose a store. Online prices also do not include vouchers or “local” trade promotions,
out of stocks, freshness levels, amount of foot traffic in the stores, etc.
The fact that consumers can learn about prices from several sources is necessary but not
sufficient to document perfect knowledge of grocery price changes by a HM. Also, a consumer
may shop at three stores for many reasons other than price. It is not strong evidence that
consumers are switching due to price increases.
Writing on information imperfections in local consumer markets, Professor Scott
Maynes, an early noted expert on consumer information systems, stated:
...many, perhaps most, local consumer markets will be characterized by substantial information imperfections. The 'culprits' behind this expectation are three. First, there is the technical complexity and multi-component nature of products. These factors make it difficult for consumers to assess both quality and price accurately. Second, there is affluence which has increased both the consumption possibilities and the consumer's information problem. Specifically, affluence has: (1) enlarged the number of average purchases that each family can make; (2) enlarged the set of products, brands, models, retailers from which choices are to be made; and (3) increased the value of individual's time and hence reduced the extent of his shopping/search actions. Finally, agricultural productivity and the automobile together have made urbanization possible and thus increased the set of products, brands, models, and retailers to which a consumer has access. (Maynes, 1978, p. 77).

12
There is a very large literature that documents, as Maynes explains, very imperfect information
on food prices in a store and between stores.
Progressive Grocer (1974) reports that on average only 29 percent of shoppers who
repeatedly buy a product could identify selling price within 5 percent of the actual selling price.
Among non buyers, on average, only 20 percent could place the price within 5 percent of current
selling price. Only 19 percent of shoppers, for example, knew the price of Coca Cola within 5
percent of the actual price. Table 1 reproduces the Progressive Grocer results.
Dickson and Sawyer provide the following abstract for their article titled, “The Price
Knowledge and Search of Supermarket Shoppers.”
A model of grocery shopper response to price and other point-of-purchase information was developed and hypotheses were tested by using observations and interviews. The findings suggest that shoppers tended to spend only a short time making their selection and many did not check the price of the item they selected. Perhaps as a consequence, more than half could not correctly name the price of the item just placed in the shopping cart and more than half of the shoppers who purchased an item that was on special were unaware that the price was reduced. … (Dickson and Sawyer, 1990).
Other studies have examined the effect of increasing consumer information on food
prices (Devine and Marion 1979, Devine 1978, Uhl et al. 1981). These reports generally confirm
that price levels and price dispersion among chains for individual products dropped when price
information for several dozen products at all supermarket chains in a city was regularly
published in the local newspaper. Devine and Marion report that price levels dropped on average
7.1 percent, with higher priced stores dropping prices more than lower priced stores (1979, p.
230) and that the mean dispersion in price decreased from 9.71 percent to 7.83 percent after price
reporting (p. 232). These changes were statistically significant. The 7.1 percent price decline
and the 1.88 percent reduction in price dispersion reported by Devine and Marion are two
13
measures of the degree of imperfect information. This suggests that prices can increase from
1.88 to 9.7 percent before consumers switch to other stores offering the same set of products.
An extensive literature documents considerable consumer inertia when switching among
stores. See Bucklin and Lattin (1992), Bell and Lattin (1996), and Bell, Teck, and Tang (1998).
Research has also documented that retailers overestimate consumer search and switching
behavior. Urbany, Dickson, and Sawyer provide the following abstract for their article titled,
“Insights Into Cross- and Within-Store Price Search: Retailer Estimates Vs. Consumer Self-
Reports.”
Past research of the accuracy of retail grocers’ beliefs about consumer search and patronage behavior has found that executives tend to overestimate the size of the consumer segment that regularly switches stores for price specials. With surveys of consumers and executives in a large midwestern market, we extend and replicate the earlier research. In this study, we find that executives demonstrate, on average, an accurate sense of the proportion of consumers who are primarily loyal to one store or are shoppers of multiple stores. However, they still tend to overestimate aggregate price comparison behavior and cross-store shopping. At the same time, we also find that managers simultaneously underestimate consumer newspaper readership, in-store search for specials, and stockpiling. This new result suggests that the more loyal primary customers may account for a greater proportion of incremental promotional sales than has been recognized in the past. These results suggest a significant increase in the information value to be derived from the desegregation of sales data by shopper loyalty status (Urbany, Dickson, and Sawyer 2000).
Based upon the forgoing research studies, my analysis of internet shopping in the UK,
which is presented in a later section as a rebuttal to Tesco’s assertion of a national market, and
my 30 years of study of the retail food industry, I conclude that consumers do not have perfect
information about prices and price changes. Consumers can not recall prices of most of the
products that they purchase, do not maintain price lists for comparison shopping, and exhibit
inertia in switching stores. This is the case even if prices suggest a switch is appropriate, due to
habits, time constraints, and skepticism about real and persistent price differences.

14
IV. Product Market Definition for the UK Grocery Industry: The Competition Commission Entry Analysis
The United Kingdom Competition Commission explains its previous position on product
market definition in the “Working Paper on Market Definition” (Competition Commission
2007b). Supermarkets above 1400 sq. meters (15,000 sq. ft) compete with each other.
Supermarkets between 280 sq meters (3,400 sq. ft) and below 1400 sq meters are constrained by
each and the larger stores. Therefore, the larger supermarkets are not constrained by the small
stores. In addition to store size, store format (or fascia) is also important.
Fascia are differentiated by price, quality, range, service, and convenience to appeal to different types of consumers. For example limited assortment discounters (LADs) Aldi, Lidl, and Netto are traditionally perceived as lower-price, lower-quality operators and at the other end of the scale M+S (Marks and Spencer) and Waitrose are perceived as charging higher prices that reflect higher quality products provided” (Competition Commission 2007b, para 12).
In the 2003 Safeway merger the Competition Commission excluded both the LADs and the true
upscale supermarkets as well as stores below 1,400 square meters (15,000 sq. ft.). In the 2005
Somerfield merger the product market was essentially the same.
In the current Grocery Inquiry the Competition Commission staff has examined this
product market definition by analyzing the impact of entry on incumbent store revenues (Entry
Analysis Annex). The basic purpose of its study is to determine an entrants impact based on its
distance from the incumbent and the impact of different fascia on different incumbent fascia.
The fascia impact analysis sheds light on product market definition. Using data from mid 2001
to mid 2006 the Competition Commission staff have constructed a sample with 1735 entry
events. An entry event occurs when a new-build store (not purchases of existing stores) enter
within 5, 10, or 15 minutes drive time from an incumbent store. The study also measures in
some specifications relative store size to each other and to the size of the incumbents catchment

15
area. This study finds that entry by the three LADs, Aldi, Lidl, and Netto has virtually no impact
on the revenues of stores greater than 280 sq. meters operated by the top four supermarket
chains. Out of 12 impact tests (3 LADs x 4 chains) only one is statistically significant
(Competition Commission 2007b, Table 5). Thus, we have very convincing evidence for the
continued exclusion of the limited assortment stores from the supermarket product market.
The study also confirms that 1,400 sq. meter and larger stores compete effectively with
each other and are not constrained by smaller stores (Competition Commission 2007b, Table 3).
The evidence for excluding the upscale supermarkets, however, is not compelling. They report
that entry by Waitrose or Marks and Spencer has a significant negative impact on the sales of
stores operated by the top four chains in 5 of 8 tests (Competition Commission 2007b, Table 5).
The fascia tests for both LADs and the upscale stores were conducted for entry into each
incumbent store’s 10 minute catchment area. The geographic results supported this definition of
catchment area. A store draws most of its customers from its catchment or trade area.5
Therefore, the relevant product market for the analysis of supermarket pricing is stores above
1400 square meters excluding LADs and possibly the two upscale chains. To be conservative,
unless future merger specific analysis shows otherwise, I would include Marks and Spencer and
Waitrose in the product market.
V. Tesco’s Simulation Model of the SSNIP Test to Define Geographic Markets
Tesco uses quantitative models from Decision Technology (2006) and Frontier
Economics (2007b) to demonstrate that the borders of the geographic market, for 98% of its
stores in urban areas in the UK, should be based on drive times above the 10 minute isochrone
5 Of course one needs to define “most.” I have yet to see the actual percent of custom or the range that the U.K. Competition Commission permits when it defines catchment areas with 10 and 15 minute isochrones.

16
used by the Competition Commission in its unilateral effects analysis of the Safeway (2003) and
Sommerfield/Morrison (2005) mergers. Tesco’s quantitative analysis also documents that the
geographic market for 91% of their stores in rural areas is greater than the Competition
Commission 15 minutes isochrone “market”.
Although Tesco is correctly focused on analyzing chain of substitution effects when
defining an antitrust market, its quantitative modeling exercise is most irregular and lacks
credibility for some very basic reasons. First I will explain their model. See also Frontier
Economics (2007b) for their explanation of the model.
The Tesco – Frontier Economics model is a simulation model. It takes an estimated cost
of travel time from another study (Decisions Technology) and uses the DT study data (obtained
from TNS World Panel) to estimate the distribution of the size of a consumer’s main weekly
shopping trip basket. Tesco maintains that the product market is wider than supermarkets,
however, it defers to the Competition Commission product market definition and focuses on OSS
supermarkets (greater than 1400 sq meter ≈ 15,000 sq ft). Tesco – Frontier uses GIS technology
to plot the geographic location of all “one stop shop” (OSS) supermarkets in Great Britain. It
also uses Census Output Areas (COA), each of which is smaller than a city block in urban areas
and has about 100 households, to plot the UK population on the “map”. Then for each of its
stores it analyzes the SSNIP impact of a 5% price elevation by starting with the set of all stores
within the Competition Commission 10 or 15 minute isochrone to see if that area is a geographic
market. If it is not then Tesco – Frontier adds 5 minutes to the isochrone and tests this new set of
stores.
The Tesco – Frontier model assumes that all consumers have perfect information about
prices, shop at the nearest OSS supermarket and switch to a more distant supermarket if the cost

17
of traveling to it (the DT estimate of cost per hour times the extra hours needed to get there and
back) is less than the 5% increase in their OSS basket cost at their current store.
Actually, a “consumer” in their model is a COA. In their model every COA in the UK
has the same distribution of OSS shopping baskets as was estimated from the TNS World Panel
data. If the “breakeven” basket size, i.e. the smallest basket that covers the COA’s transportation
cost to the nearest outside store is 20 pounds and 60% of the basket size distribution is above that
breakeven, then 60% of the population in the COA switch and the dollar amount that they switch
to the outside store is cumulative sum of their baskets. COAs with more people divert more food
dollars, other things being equal.
There are several very basic problems that destroy the credibility of this quantitative
approach.
• This model is not an econometric or statistical model that examines actual switching
behavior to determine the scope of a geographic market for a particular store or set of
stores in a particular local area. In fact it is not, even an econometric or statistical model
that examines actual switching behavior in the TNS World Panel data set which is drawn
from a much larger geographic area.
• The Tesco – Frontier model is a simulation model. Such models can be and this one is an
unreliable abstraction from actual conduct. Tesco (Undated a), its consultants (Frontier
Economics 2007b, CONFIDENTIAL, Smith 2007), and its opponents (RBB Economics
2007a) have focused on whether or not this particular model is biased because of one or
more of its many assumptions. There is another very important property that must be
considered. Even if the simulation model is not biased, what is the degree of accuracy of
its prediction?

18
Consider the following example to illustrate the problem of focus on unbiased as opposed to
accurate models. A farmer asks the ferryman how deep the river is. The ferryman answers on
average three feet. The farmer steps in and promptly drowns because of a 10 foot hole.
Thereafter, the river is 1 foot deep. The average is an unbiased but not very accurate estimate
because of great variation in river depth.
The Tesco model, even if unbiased and there is considerable disagreement on this point
(RBB Economics 2007a and Competition Commission Undated a), is not accurate. There
undoubtedly are many local market areas that are considerably smaller and larger than what the
Tesco model predicts with its average “national” parameters and the models inability to
incorporate consumer and store heterogeneity in a particular local area.6 This variation matters
when assessing competitive effects in local geographic markets. Local conditions vary about the
“national” averages that this study uses. On average, markets may be X but there is considerable
variability about X. Some local markets may be much smaller than the “average” market and
possibly face significant competitive issues. There is no evidence that this “national” model,
even if unbiased, is anywhere near accurate for a Tesco store in Oxford, or a Tesco store
anywhere else in the UK.
I would note that Professors CONFIDENTIAL and Smith focus on bias and ignore
accuracy when evaluating the Tesco – Frontier simulation model. Also, it should not go
unnoticed that Professor Hausman ignores the Tesco – Frontier model, and thus provides no
support for it. The empirical basis for his opinion is work that he does with Tesco Club Card
data.
6 Out of fairness to Tesco, I make the same criticism of the Competition Commission’s reliance upon 10 or 15 minute isochrones to define catchment areas which they equate to geographic markets. Nonetheless, the 10 and 15 minute isochrone areas are reasonable approximations to local market areas and suitable for quantitative analysis of entry (Competition Commission Undated c) and store margins (Competition Commission Undated b).

19
A. The Decision Technology Logit
Tesco claims that the travel cost time it uses for SSNIP is unbiased because it was
estimated by Decisions Technology for another purpose (Tesco, Undated a). This is most
unconvincing logic. Moreover, based on the documents that I have read (Decision Technology
2006, Frontier Economics 2007b, Neville-Rolfe 2007c, Tesco Undated b, CONFIDENTIAL, and
Smith 2007) there is no explanation as to how Decision Technology used the estimated
parameters of its logit model to compute the ‘Travel Time Cost” estimates. Their first estimate
was 6.73 pounds per hour and then after dropping observations that apparently had “missing
data” it is 6.10 pounds per hour.
I find it surprising and questionable that this “cost of travel” time is not estimated using
the consumer wage rate and the cost of car or other transportation to the more distant store.
Decisions Technology in fact notes that their estimate is lower than what one would obtain using
such actual cost data.
“the figure (6.73 per hour) is lower than most customer’s wages (a good measure of the value of their time) and the cost of travel (petrol, running costs, etc.) (Decision Technology, 2006 p15)
The DT logit model has more serious deficiencies. I will now examine the Decision
Technology logit model in detail. It predicts the store where a particular consumer in the TNS
World Panel data set that it employs will shop on each of 84 days in a 12 week data set. Now on
each day each consumer must have a choice set, i.e. a set of stores to choose from. According to
Frontier Economics, Decision Technology looks “at characteristics of stores that are within an
individual customer’s choice set (assumed for ease to be 25 minutes travel time since most
customers don’t travel more than 25 minutes) (Frontier Economics, 2007b, p. 35).7
7 One might think that this choice set contradicts the Tesco – Frontier greater than 30 minute result. A stores catchment area can be smaller than 25 minutes and the market larger if CA of stores overlap. Within this market a

20
The DT logit seeks to explain consumer choice to shop at a particular store. Such a
model, if done properly can provide considerable insight into actual switching behavior, and aid
in the definition of product and geographic markets. The study identifies the location of each
store for the following fascia (format) groups.
• Tesco Extra • Tesco Superstore • Tesco Metro • Tesco Express • JS Superstore • JS Central • JS Local • Asda • Morrisons • Safeway • Discounter • Waitrose • M&S • Somerfield (Decision Technology, 2006, p. 9)
Note that the study includes virtually all grocery stores from the leading chains, including
supermarkets less than 1400 square meters, such as Tesco Metros and convenience stores such as
Tesco Express, less than 280 square meters. It also includes limited assortment discounters such
as Aldi and Lidl and up-scale stores Marks and Spencer and Waitrose.
Normally, consumers will shop at one of these stores within 25 minutes of their home;
but, the DT choice set allows consumers to travel more than 25 minutes if the model is correctly
specified and estimated with an “outside option”. The outside option occurs when a consumer
chooses to buy groceries at a store of the 14 fascia analyzed beyond 25 minutes. All such distant
stores are lumped into this “no buy at stores within 25 minutes” option. The identified stores
inside the 25 minute isochrone are each a distinct possibility but all have value zero because this
chain of substitutes effect may allow a unilateral price bump but defeat a higher “small but significant” price increase necessary to this local area of the market to be a market onto itself.
21
consumer chooses the outside option. On a day when the consumer shops within 25 minutes
from home he picks one store from within and that store has value 1, the rest have zero.
The DT logit model explains which store he picks (actually the probability of him picking
each store) and this choice is a function of its distance, the fascia identity (one of 14 possible
store fascia), the size of the store, and the size of the purchased grocery basket.
I have not seen the actual estimation program or more than the explanation of the DT
logit model in Decision Technology (2007), Frontier Economics (2007b), and Smith (2007). I
am not completely sure that DT used the outside option as explained by Frontier Economics
(2007b). Professor Ronald Smith, an econometrician from Birkbeck College, University of
London (2007) also works for Frontier, and advised Frontier on its study including the use of the
Decision Technology logit analysis. He opines in his affidavit:
I have been told the Competition Commission questioned the omission of an “outside option” from Decision Technology’s work … It is not clear that even if customers did use an outside option this would lead to any bias in the coefficient on the cost of travel time (Smith 2007).
I find Professor Smith’s answer confusing. As explained above, one can’t estimate the model
without an outside option. It is integral to the choice process.
Professor Smith continues to explain that:
Decision Technology undertook a number of statistical robustness tests. They compared Akaike Information Criterion scores from a number of models and also compared the predicted market shares against actual market shares. In addition to these tests one could also check that the estimated coefficient for drive time is statistically significant and has a similar magnitude across different model specifications (for example, by including or excluding particular variables) (Smith 2007).
Reporting significance levels for estimated coefficients is standard scientific procedure.
Models are often significant but one or more estimated parameters, even all estimated parameters
can be insignificant if there is high multicollinarity. That the significance levels for individual

22
estimated parameters are not reported gives cause for concern about the reliability and accuracy
of their model.
One estimates a logit model with maximum likelihood methods. Decision Technologies
econometricians fail to report a widely used specification test for conditional maximum
likelihood models often called the Newey, Tauchen, West Test.8 Decision Technology simply
ranks their models by using the Akaike Information Criterion (AIC). This means that Decision
Technology is selecting from a set of models but none of them may be correctly specified.
Logit models, including this one, produce very constrained switching estimates that
violates the Tesco – Frontier assumption that consumers switch to the nearest store outside of the
HM group. This nearest store assumption is even more constrained than the logit constraint
which in itself is undesirable. In a logit model, when one raises the price at one or more stores
they lose volume to stores outside a HM group in proportion to the volume of those outside
stores. This means that an outside store that is not the closest store that has, for example, a
market share that is twice the share of the closest outside store will capture twice as much of the
switching volume.
The DT logit model does not specify price levels at different fascia as a determinant of a
consumers store choice. The model specifies distance measured in minutes of travel time, store
size, the size of basket purchased, and 13 binaries identify the 14 different fascia. DT only uses
price information to remove the impact of price to examine the importance of other variables in
the (PQRS) marketing mix as captured by the fascia binaries. Frankly this is going the wrong
8 See Newey & McFadden Handbook of Econometrics vol. IV Chapter 36 on “Large Sample Estimation and Hypothesis Testing.”

23
way for a SSNIP estimation of product and geographic market due to a change in price. Price
should be explicitly specified in the consumer choice model.9
Finally note that Professor Smith talks of “market share” in the DT model and I use it in
the last paragraph to illustrate constraints in the logit model. Professor Smith’s “market share”
is, I believe, a particular store’s share of a consumer’s food purchases, i.e. the predicted
probability that a consumer shops at a particular store. The market share that I used is store
based. For each store one computes the summation (integration) of all individual shares times
the value of their purchases (the store’s sales volume for that day). One does this for each store
within the 25 minute DT choice set. Once one has store market shares one does the HM SSNIP
test for a particular subset of the stores in the DT 25 minute choice set. For example, one can
test the proposition that OSS are the relevant product market and the relevant geographic market
is a 10 minute isochrone. One can do this test for any and all stores in the TNS World Panel data
set. Since summation (integration) is a linear operator, the logit constraints at the consumer level
carry through to the store level. Therefore, one needs to relax the assumption that consumers
shop at the nearest store and compute travel time to all stores outside of the putative local
market. The store that is “closest” now varies by consumer. Alternatively, one needs to specify
a more flexible demand model that allows switching to any store in any amount. Then one can
test for the logit switching restriction and/or the nearest store switching restriction. I doubt that
either restriction would be valid.
B. Conclusion on the Tesco – Frontier SSNIP Modeling Exercise
In conclusion the Tesco – Frontier Economics approach to defining relevant geographic
markets is irregular, inadequate, inaccurate, and unreliable for the market definition exercise that
9 If prices are constant across the different fascia of some chains then the fascia binary variables will measure the combined impact of price as well as other QRS factors that vary by fascia. One can use minimum distance methods to decompose the binary variable impacts into the impacts due to PQRS (Nevo 2001).
24
the Competition Commission must undertake. Tesco – Frontier borrows a cost of time estimate
from an econometric model that imperfectly measures consumer choice. That model was not
built to analyze geographic market definition, and did not analyze geographic defintion. Rather
than redo this econometric analysis of consumer choice using standard approaches from the
differentiated products demand literature in economics Tesco – Frontier constructs a simulation
model that relies on many assumptions that can and should be relaxed and estimated. A much
more flexible model should use “best scientific practices” in the area of choice and demand
analysis. The Tesco – Frontier analysis of geographic markets relies too much on simulation of
consumer behavior and not enough on econometric estimation of actual consumer switching
behavior.
C. More Rigorous Quantitative Modeling of SSNIP Tests
The TNS World Panel data appears to be fully capable of performing a SSNIP test in a
more desirable quantitative fashion. Unless the TNS World Panel data is very dense, one can’t
estimate actual switching conduct for particular stores or neighborhoods; however, one can
estimate a much more detailed model that can simultaneously address product and geographic
market definition as a function of heterogeneous store characteristics (fascia), (PQRS), and
heterogeneous consumer characteristics including basket size and travel time to different stores.
Then one can use information on many of these variables, that vary across local areas in the UK,
to do a SSNIP test for specific local areas of interest. In other words, we are on the cusp of
estimating own and cross price elasticities of demand for stores in a local area of interest and
using them to determine which set of stores is a local market. Since one has convenience, and
smaller supermarkets as well as one stop shop (> 1,400 Sq. M. ≈ 15,000 Sq Ft) stores in the TNS
World Panel data set one can test product as well as geographic market simultaneously.
25
By generalizing the logit to a random coefficients model one can estimate how diverse
heterogeneous consumer demographics and store characteristics influence store choice. Own
and cross price elasticities of demand for the 14 different fascia will now be functions of
consumer demographics that include distance and basket size. Moreover, the cross price
elasticities are no longer constrained to be proportional to the volumes of the stores to which
consumers switch. With this approach to the TNS World Panel data one obtains statistically
valid measurement of actual consumer switching conduct. Using this econometric model one
can then use COA consumer demographics and the actual location of the 14 fascia in a local area
to simulate consumer switching in that area. One obtains not only estimates of the product and
geographic market, one also obtains statistical significance measures of their accuracy.
This is where quantitative market definition and unilateral power modeling should go. If
the data are not available in the US, UK, or elsewhere, one needs to collect them. Household
panel data sets are readily available from AC Nielsen (TNS) and Information Resources Inc in
the US, UK, and Europe. They also have information on food prices at virtually all
supermarkets, mass merchandisers, and drug stores, if not convenience stores. Therefore, the
needed data exist in electronic form.
Can a quantitative model estimated in this fashion obviate completely the use of other
information in a qualitative fashion when defining a market? I doubt that this will be the case,
however, an opinion on that rests upon access to such future, as yet undone studies. The
Competition Commission’s current position that it will consider qualitative as well as
quantitative evidence is, in my opinion, correct (Competition Commission 2007b).

26
D. Population Recentering is Redundant
The Competition Commission’s current explanation of population recentering and its use
in the future is summarized in its January 23, 2007 “Working Paper on Market Definition” as
follows:
42. In principle, however, the geographic market is defined according to whether consumers would switch to a store in another location in response to some degradation in the retail offer of their current store. The consumer choice set is thus dictated by the number of stores within a certain drive-time (or distance) of the consumer (the demander) rather than of the store (the supplier). Stores that are outside each other’s catchment areas may still fall within the same choice set of consumers located between the two stores. If sufficient consumers would be willing to substitute between two such stores in response to some degradation of PQRS, the stores will be in the same geographic market.
43. To address this, the Safeway report (2003) and the Somerfield report (2005) used ‘population recentring’ in their assessment of local markets. This methodology delineates isochrones around areas of population served by a particular store.5 It then considers which alternative fascia serve each of those areas of population, and whether a sufficient proportion of consumers could switch to those fascia to render a degradation of PQRS unprofitable.
44. The issue of population recentred isochrones will be pursued in the quantitative analysis that we will be conducting in the period up to provisional findings (Competition Commission 2007b, p. 15).
5. In the Somerfield report, the recentring was carried out around census output areas which covered up to 150 households. The data was used to assess the proportion of households within the acquired store’s catchment area that had access to four or more competing fascia post-merger, and whether this proportion was sufficient to prevent the merging parties from exercising market power.
Tesco’s concerns about population recentering have merit. The market definition process
focuses first on a population (more correctly “consumer”) centered analysis of consumer
switching conduct. From that qualitative or quantitative exercise one identifies the boundaries of
the product and geographic catchment areas for individual stores and the local market, which
may very well be a set of overlapping catchment areas. Then one proceeds to analysis of
coordinated and/or unilateral effects in that market. At the competitive effects stage one does not
return to consumer space and do another SSNIP test or a unilateral effects measurement for a
particular group of consumers. Now it is possible that consumers in one local area of the market
27
suffer from an exercise of unilateral power, however, that analysis is store based not population
based. The store based analysis can identify particular areas of catchment areas and markets that
suffer from a unilateral exercise of market power. Recall stores that are near the merged stores
have a profit incentive to raise their prices in sympathy with the merged entity’s price elevation.
E. Tesco’s Claim for a National Market
Tesco (Undated a, Undated d) maintains there is only one geographic market for the sale
of grocery products to consumers in the United Kingdom and that market is the United Kingdom.
They cite their Tesco – Frontier SSNIP analysis as evidence for a chain of substitution effect
beyond 30 minutes travel time for most consumers. Then they produce their “porcupine map”
that documents Tesco supermarkets blanket the populated areas of the UK so overlapping
catchment areas are unending (Tesco Undated a). The Competition Commission (Undated a),
however, demonstrates that a few reasonable changes in the assumptions in the Tesco – Frontier
model produce market areas much smaller than those given by a 30 minute isochrone
(Competition Commission Undated a). Moreover, as explained in this report, the Tesco –
Frontier model is completely unreliable and can’t be salvaged by changing a few assumptions.
Tesco’s other claims for a national market are:
• All the major operators compete nationally on pricing, range, quality and service. • Our products are the same price and quality in all our one stop shop stores. • We have national advertising campaigns. • The targets we set internally in our business, for example to monitor our “one in
front” pledge on queue lengths, are identical across the country. • Other retailers have national competitive strategies. The CC’s evidence shows that
all the major retailers have national pricing policies. • Since 2000, grocery retailers have set up new stores in every part of the country. • The growth of internet shopping means that customers anywhere have access to the
same offer (Tesco, Undated a, p. 3). Professors Smith and Hausman do not opine on the existence of a national market.
Professor CONFIDENTIAL concludes as follows:

28
… the SSNIP test in itself does not demonstrate that the relevant market is national, as recognized by Tesco. Indeed, it is doubtful to me that an extension of the SSNIP would in itself support such a broad market. Whether a national market is appropriate would depend on the extent to which there are constraints that substantially limit the ability of firms to operate local or subnational policies, as discussed by Tesco in its Overview Response to the Emerging Thinking. Empirically assessing the magnitude of these factors is beyond the scope of this report (CONFIDENTIAL).
Let us now examine Tesco’s claims and as Professor CONFIDENTIAL suggests analyze
whether constraints exist that preclude operation of local policies. Recall that we are talking
about market definition not competition (competitive effects). Market definition precedes the
analysis of competitive effects and therefore only recognizes constraints on firm behavior that
arise from consumer switching behavior.
The first six Tesco claims pertain to firm conduct and thus are not pertinent to market
definition. Only the last of Tesco’s seven claims for a national market concerns consumer
switching. Tesco’s claim for a national market therefore rests upon the “constraint” that internet
shopping places on the ability of a HM monopolist to impose a profitable SSNIP. Effectively,
for a national market Tesco must claim that in every neighborhood in the UK, consumers can
and will defeat a price increase by switching to the internet.
The UK Office of National Statistics (2006) states: “An estimated 13.9 million
households (57 per cent) in Great Britain could access the internet from home between January
and April 2006.” Yet Tesco claims that 98% of the UK population can receive deliveries from
Tesco.com (Competition Commission, 2007b, p. 28). Obviously their coverage outruns the
extent of home internet use. In fact, retailers estimate that only 1-2% of grocery sales are via the
internet (Competition Commission, 2007b, p. 28). In addition to lack of internet use, the
delivery charges for groceries must be above consumers travel costs to a supermarket, otherwise
shoppers would be using the internet now. This leads me to conclude that the internet purchase
29
option is so limited that it cannot ensure an unbroken chain of substitution for a city, much less
the entire UK. There is no national supermarket sales market in Great Britain.
VI. Retrospective on Geographic Market Definition: Catchment Areas versus Market Areas
A catchment area (CA) is the area from which a store draws most of its patrons. It exists
in the product and the geographic dimension. To define a CA one must devise some sort of cut
off, for example 80% of a stores customers come from within 5 km or 5 minutes drive time from
a store. A market area in an urban area is always a set of stores with overlapping catchment
areas. On this point, Tesco is correct because a chain of substitution effect does exist. One must
look for a break or weakening in the chain of substitutes that is sufficient to define a local market
area.
Market boundaries due to breaks in the chain of substitutes in food retailing do exist and
they often exist within a large metro area such as New York or Birmingham. They are
determined by physical, demographic, and anthropological barriers to consumer switching as
well as store locations. On this point, I would note that the Competition Commission has found
that each of 175 stores out of 1700 one stop shop (OSS) supermarkets has at most one competitor
in its catchment area. Here the Competition Commission defined the catchment area by using a
10 minute drive time isochrone in urban areas, 15 in rural areas, and included smaller
supermarkets in the product market. If one defines the product market to be sales of OSS
supermarkets then 627 of these 1700 stores have at most one competitor in their catchment area
(Competition Commission, 2000, Appendix 6.3). I point to these statistics not to argue that
catchment areas are antitrust markets. Rather these statistics establish that there are many local

30
areas in the UK where the chain of substitute is ruptured or very weak. These stores may lie at
the edge of larger local markets or be local markets unto themselves.
It seems that the Competition Commission and Tesco are talking at cross purposes in this
debate over market definition. Tesco is focused on antitrust market definition as explained here,
and it maintains that if properly done the geographic market is national or at least an isochrone
(drive time) of 30 minutes or more from nearly all its stores in the UK. Yet the geographic
market is a set of overlapping catchment areas. It is not at all clear if one starts from different
stores that the SSNIP test will identify a unique set of stores as the market. This is one reason, a
very good reason, for also using qualitative information from the business record and elsewhere
to define the market.
The Competition Commission in its 2000 report, as well as the Safeway (2003) and
Sommerfield/Morrison (2005) merger inquiries, focused on, among other impacts, a unilateral
effects analysis at the individual store level. This is a catchment area analysis, not a market wide
analysis of pricing. The FTC in the recent Whole Foods case, a challenge of Whole Foods
acquisition of the other leading U.S. premier natural and organic supermarket – Wild Oats, also
focused upon a very narrow market. First it argued, unsuccessfully, that premium natural and
organic supermarkets were the relevant product market. The court, however, agreed with the
FTC that the relevant geographic market was the catchment area of a supermarket defined by a
six mile driving distance. In 17 locations in the U.S. one had a Whole Foods and Wild Oats
supermarket within six miles of each other (Whole Foods, p. 65-66). The court, however, ruled
against the FTC because within these geographic markets the premium natural and organic
supermarkets faced competition from other supermarkets (wider product market), and the FTC
provided no credible analysis of unilateral pricing effects by natural and organic supermarkets

31
before or after the merger. Prior FTC enforcement concerning supermarket mergers did not
define such narrow product and geographic markets (Cotterill 1999).
In Safeway the Competition Commission ordered divestiture of 50 stores. In
Sommerfield/Morrison it ordered divestiture of 12 stores (Competition Commission, 2007a, p.
27). The Competition Commission said that two stores more than 10 minutes apart are not in the
“same market” for purposes of U.E. analysis, i.e. there is no unilateral effects impact. This is an
unfortunate use of the term “market”. The relevant geographic market may be larger. The
Competition Commission in fact notes this contingency in its Emerging Thinking paper, Jan. 23,
2007:
The CC noted (in its 2000 investigation) that though the geographic extent of the market broadly corresponded to local catchment areas, it may be wider in some areas, depending on the degree of overlap of such catchments. (Competition Commission 2007a, para 64).
VII. Analysis of Competitive Effects in an Antitrust Market
Once one has a product and geographic market defined one then moves to the analysis of
competitive effects in the market. If one is analyzing coordinated effects (collusion), or a
possible dominant firm in the market, the computation of market shares and the HHI is the next
step. Then one moves to analysis of competitive effects which are coordinated and unilateral
effects.
A. Coordinated Effects
The UK Competition Guidelines describes the conditions facilitating coordinated effects
as follows:
(a) the market must be sufficiently concentrated for firms to be aware of the behaviour of their competitors and for deviation from the prevailing behaviour to be readily apparent (for example, through price or other market transparency);
(b) it must be costly for firms to deviate from the prevailing behaviour, such that it is against their interests so to deviate; and
32
(c) competitive constraints in the affected market(s) must be relatively weak, so that the actions of non-coordinating firms, potential competitors and customers do not jeopardise the expected outcome of coordination (for example, low barriers to entry, a strong competitive fringe and countervailing buyer power might all serve to disrupt coordination) (Competition Commission 2007c).
Documenting conditions that facilitate tacit collusion in a market can be challenging.
Here I will discuss one facilitating condition that needs to be given more weight. It is the
financial leverage (gearing) of firms in the relevant market.
Food retailers were among the first to fall to leveraged buyouts and leveraged
recapitalizations when capital markets were deregulated in the mid 1980’s. In a relatively short
time 17 of the top 20 firms in the US supermarket industry went LBO or were forced into a
defensive leveraged recapitalization (Cotterill 1993, p. 163). These firms accounted for 31% of
total U.S. grocery sales and dominated several local grocery markets. Chevalier (1995) in her
analysis of Leveraged Buyouts (LBO) in supermarket retailing presents an economic model that
predicts “ceteris paribus, liquidity constrained firms charge higher prices than nonliquidity
constrained firms” (Chevalier 1995, p. 1098). Since virtually all LBO’s are “liquidity
constrained” this model predicts they will raise prices.
Chevalier reports that on average in a city the prices of LBO supermarkets are 2.5%
higher than the prices of non-LBO supermarkets (Chevalier 1995, p. 1110). She also reports this
difference is statistically significant at the 5% level. For most of the markets that she studied
there were several LBO supermarket chains. Therefore we have a group of chains that have
elevated price 2.5% because it was profitable for them to do so. Thus converting firms to a
highly geared financial structure creates a group of firms that have incentives to cooperate to
elevate prices. Leverage facilitates more effective tacit collusion, and the cooperating group
need not include all the firms in the market.
33
In today’s global capital markets with substantial private equity in hedge funds, one has a
very robust market for corporate control (Manne 1965). Given their large relative cash flow to
investment, and stable cash flows, supermarket retailers continue to be closely monitored in this
market. Ideally the market for corporate control generates takeovers of poorly managed firms
and creates value for owners by cost cutting and restructuring. However, as demonstrated by
Chevalier, LBO’s create “soft competitors” and facilitate tacit collusion. The antitrust agencies
need to recognize this.
LBO’s also put substantial pressure upon antitrust agencies who must often evaluate the
spin off to competitors of competing supermarkets. The Ahold-Pathmark merger was motivated
by a LBO by Kohlberg Kravis and Roberts of Pathmark. The LBO strategy included selling all
or part of Pathmark to a horizontal competitor (Ahold). After this merger fell through due to
antitrust agency resistance, Pathmark declared bankruptcy (Wall Street Journal 2000). KKR lost
all its equity investment and bond holders who financed the LBO (including some very large life
insurance companies) received pennies on the dollar. A similar strategy and result followed for
the Thomas Lee and Co. LBO of Big V Supermarkets (Cotterill 2002). Public policy, including
antitrust and central bank monetary policy (a current event in September 2007) need not validate
prior speculative financial moves that violate stated policy rules.
B. Unilateral Effects
A dominant firm in a homogenous product market is the original unilateral effects model.
Over the past 20 years, economists have developed the corresponding unilateral effects model for
differentiated product markets. If there is product or geographic differentiation in the industry,
as there is in supermarket retailing, following Baker and Bresnahan (1985), Levy and Reitzes
(1992), Hausman et al. (1994), and Cotterill (1999) one needs to determine whether the
34
ownership of two or more heretofore competing supermarkets, that are close to each other in one
part of a market, allow the owner of the merged entity to elevate price in that “corner” of the
market. Levy and Reitzes (1992) and other economic analysts recognize that surrounding
supermarkets owned by others, rather than constraining that price increase, will find it profitable
to raise price in a sympathetic and reinforcing fashion. Thus, each firm acting in its own best
interest without considering what others do, or would do, finds it unilaterally profitable to raise
price.
This unilateral “local” effect occurs within a market, and is a feature of the markets’
differentiated structure, but, it does not depend on the scope of the market that was found with
the SSNIP test. For example, if one applies a 5% SSNIP without price flexing one may find that
the geographic market for merging supermarket chains is larger than a city neighborhood.
Possibly, for purposes of argument, it is even the entire UK as Tesco asserts. Nonetheless, there
still may be a very significant unilateral “bump” in price for some stores if stores from the
merging firms are close to each other in one or more neighborhoods of the market. For example,
if two competing stores are across the street from each other, and the merged firm closes one,
consumers have less choice (competition) and may pay higher prices at that site rather than
switch to a more distant store, especially since those stores find it profitable to elevate price, but
somewhat less than the merged firm. This is an empirical issue that must be investigated.10
Note that the “bump” may be less than a 5% SSNIP used to define the market. A bump
of 1%, or even less, could damage consumers who shop at the two stores. The competition
authority can, and in most cases on both sides of the Atlantic (eg Safeway and
10 One might rebut this by noting that each of the top four chains claim to charge the same price nationally. Even if the merging firms have uniform but different national prices, and pricing in this local area is unchanged by the merger, one is concerned about PQRS which includes quality, reach, and service as well as price. The merger may generate a lessening of consumer choice in these dimensions.

35
Sommerfield/Morrisons in the UK, Royal Ahold – Stop & Shop in the US) has, required that one
of the two “impacted” stores be divested. Alternatively, if the number of impacted stores is a
very large proportion of the merger then one can prohibit the merger (Royal Ahold – Pathmark in
the US).
VIII. The Competition Commission Analysis of Store Margins
A. Introduction and Historical Overview
Today, evaluation of the status of competition in an industry should include actual
empirical analysis of price and/or profit performance. Competition among a set of firms in a
market is usually analyzed within the framework of static oligopoly models that assume there is
no entry by outside firms. A more general model allows potential competition, barriers to entry,
the shape of the queue of potential entrants, and actual entry to influence the competitive game in
a market. The Competition Commission in its store margin paper analyzes the relationship
between local market structure as measured by competitor pressure variables, and allocative
efficiency as measured by the Lerner Index.
Perhaps the best way to gain perspective on this study is to retreat from the current state
of the art empirical methods that it uses and give a historical review of empirical analysis of
competitive effects and entry analysis with special attention to such studies in food retailing.
This will show what the current empirical approach, as offered by the Competition Commission,
“gains” and what it “loses” in terms of insight. This review also points to additional research
questions that the Commission could explore.
Bain (1951) introduced the first cross section regression analysis of the relationship
between seller concentration, i.e. the number and size distribution of sellers in a market, and
36
allocative efficiency, i.e. the level of profits in a market. Leonard Weiss (1974) carefully
reviewed the first 20 years of empirical research on the concentration profit relationship. At the
time Demsetz (1974) provided a two part critique of those studies that was devastating. First he
noted that highly concentrated markets may have higher profits because the few large firms that
dominate have economices of scale rather than higher prices. Also, contrary to Bains’ assertion
that market structure was exogenous, Demsetz established that a firms output and price are
jointly determined in any oligopoly model and therefore are endogenous variables. This meant
that two decades work by industrial organization economists that produced dozens of single
equation ordinary least squares regression studies of the concentration-profits relationship were
biased and inconsistent measures of the competitive effect of increased concentration upon the
pricing power of established incumbent firms. A paradigm shift was necessary.
Initially some industrial organization economists responded by estimating simultaneous
equation systems for manufacturing sector industries. One equation predicted industry or firm
profit rates as a function of endogenous concentration and exogenous demand shift variables.
Another equation predicted concentration as function of supply side exogenous cost variables.
Some models added a third equation with advertising as an endogenous variable (Martin 1979
and Pagoulatos and Sorensen 1981). More recently, Salinger (1990) has resurrected single
equation analysis of a cross section sample of manufacturing industries with care given to
estimation issues.
In food retailing Marion et al. (1979) took a different approach to answering Demsetz.
That study offers an analysis of the concentration profits relationship across local retail food
markets and different sized firms in those markets. A second study analyzed price levels for
leading supermarket chains across several local market areas. Marion et al found that four firm
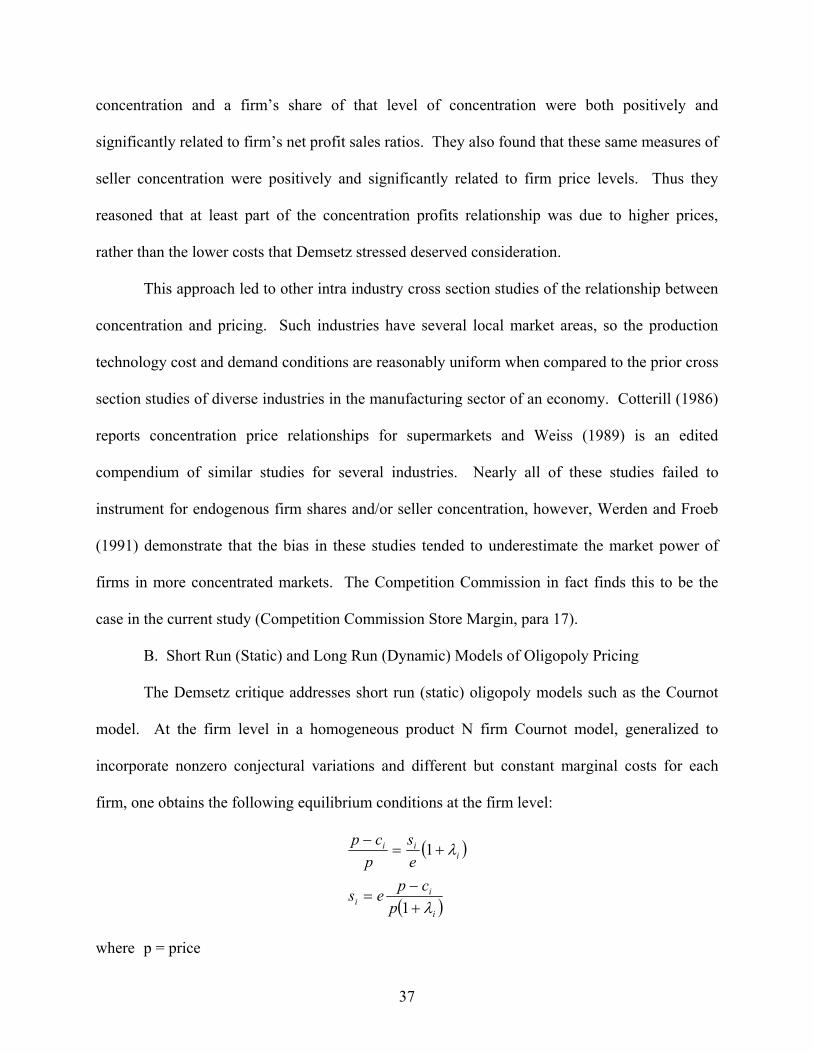
37
concentration and a firm’s share of that level of concentration were both positively and
significantly related to firm’s net profit sales ratios. They also found that these same measures of
seller concentration were positively and significantly related to firm price levels. Thus they
reasoned that at least part of the concentration profits relationship was due to higher prices,
rather than the lower costs that Demsetz stressed deserved consideration.
This approach led to other intra industry cross section studies of the relationship between
concentration and pricing. Such industries have several local market areas, so the production
technology cost and demand conditions are reasonably uniform when compared to the prior cross
section studies of diverse industries in the manufacturing sector of an economy. Cotterill (1986)
reports concentration price relationships for supermarkets and Weiss (1989) is an edited
compendium of similar studies for several industries. Nearly all of these studies failed to
instrument for endogenous firm shares and/or seller concentration, however, Werden and Froeb
(1991) demonstrate that the bias in these studies tended to underestimate the market power of
firms in more concentrated markets. The Competition Commission in fact finds this to be the
case in the current study (Competition Commission Store Margin, para 17).
B. Short Run (Static) and Long Run (Dynamic) Models of Oligopoly Pricing
The Demsetz critique addresses short run (static) oligopoly models such as the Cournot
model. At the firm level in a homogeneous product N firm Cournot model, generalized to
incorporate nonzero conjectural variations and different but constant marginal costs for each
firm, one obtains the following equilibrium conditions at the firm level:
( )
( )i
ii
iii
pcpes
es
pcp
λ
λ
+−
=
+=−
1
1
where p = price

38
ci = firm i marginal cost
si = firm i market share
e = market price elasticity of demand
λi = firm i conjecture of how all other firms output will change when it changes its own
output.
Aggregating these to the market (industry) level for the N firms in the market gives the
following:
( )λ+=− 1
eH
pcp
where c = market share weighted average marginal cost
∑=
=N
iisH
1
2 = Hirschman-Herfindahl Index of seller concentration
λ = market share weighted average conjectural variation
Cowling and Waterson (1976) and Clark, Davies, and Waterson (1984) specify λi as a function of
the Herfindahl index. This tests the hypothesis that firms in more concentrated markets
recognize that their pricing is interdependent and coordinate pricing via tacit collusion to
exercise market power (coordinated effects of the merger guidelines) therefore, one has at the
firm and industry levels:
Firm: ( ))(1 Hes
pcp
iii λ+=
−
Industry: ( ))(1 HeH
pcp λ+=
−

39
Unilateral effect market power is the ability of a firm to raise price without coordination with
other firms. In these equilibrium conditions it enters via the impact of si and H when
0)()( == HHi λλ . Each firms perceived elasticity of demand, esi , increases as its market share
increases and thus its equilibrium price cost margin increases.
Yet as Demsetz noted, si and H are endogenous and in part determined by variation in
marginal cost across firms. The following decomposition of the H index by Clark, Davies, and
Waterson (1984) illustrates this condition.
( )N
veNN
H MC2211 −
+=
where N = number of firms in the industry
MC
v MCMC
σ= = the coefficient of variation of industry marginal costs.
Note however that if all firms have the same constant marginal costs, i.e. no Demsetz cost
differences, then MCv vanished and the number of firms determine H. At the firm level if there
are no Demsetz cost differences then the firm’s market share is N1 . Since in these static
oligopoly models N is fixed (exogenous) this suggests that it is an appropriate instrument for
market share at the firm (store) level and the H index at the market level in intra industry cross
section studies of several local market areas. It is possible in such studies to obtain unbiased and
consistent estimates of the impact of market share and the H index upon firm (store) and
aggregate market wide price and profit levels.11
11 One can solve the equilibrium PCM equations for price which is a function of marginal cost, elasticity of demand, and market share or H. One can also generalize this result to differentiated product markets where firms (stores) have different price as well as different cost levels in equilibrium. Proof available from the author upon request.

40
More general empirical models, including the Competition Commission study of store
price cost margins, relax the assumption that the number of firms is fixed at N. Such models
endogenize entry and thus are long run (dynamic) models of competitive effects.
An interesting question not addressed by the Competition Commission’s study of
margins and entry is how rapid is entry in response to incumbent price and profit elevation. If
entry is not likely, and sufficient to defeat price and profit increases in a timely fashion (less than
2 years) then one has evidence of barriers to entry and the static oligopoly models (exogenous N
models) have relevance for the analysis of unilateral and coordinated competitive effects.
Following Bresnahan and Reiss (1990, 1991) and Berry and Reiss (2006), the
Commission passes over this contingency and analyzes the relationship between the number of
firms and store margins assuming N is endogenous.12 The Bresnahan and Reiss model of entry is
consistent with a two stage model of oligopoly. For the long run (stage one) firms determine
whether to enter a market based upon the predicted post entry profitability given cost and
demand conditions and the competitive response of established incumbent firms. Then once the
number of firms in the market is known and fixed, one has short run (stage two) competition in
the PQRS dimensions.
The Bresnahan and Reiss model of entry is more general than previous “entry limit
pricing” models and incorporates the criticism that those models do not provide a credible
(subgame perfect) hypothesis about barriers to entry. Berry and Reiss, however, note that first
mover models are credible and do confer cost advantages to incumbents that deter entry by a
second and subsequent firms. Also Bresnahan and Reiss (1990; p. 535) document how
incumbents can credibly invest in entry deterrence. Along this line of reasoning Salop and
12 They do not report a Hausman W test for the endogeneity of N. A test is advisable. Although the theory is long run and dynamic, the store margin analysis is not a dynamic study. It focuses only on the market structure – PCM equation in the multiple equation model.

41
Scheffman (1983) document that non price strategies by dominant incumbents can raise rivals
costs and deter entry. Therefore, prior empirical analyses of entry, albeit based on questionable
limit pricing theory, most likely do measure entry barrier effects (eg Masson and Shaanan 1982).
The limit price theory may be in doubt, however, other theories provide support for empirical
measurement of entry barriers.
To my knowledge the only study of entry into food retailing that is specified within the
two stage game context is Cotterill and Haller (1992). They test for the impact of potential
competition (contestability) in a logit analysis of actual entry over a ten year period into local
U.S. food retailing markets. Their two stage model predicts incumbent firm profitability as a
function of incumbent market structure and entry. Entry is then predicted as a function of
incumbent profitability and market structure and the shape of the queue of potential entrants.
Rather than estimate this two equation structural model they focus on a reduced form model of
entry as a function of exogenous variables. Although the model is underidentified one can
deduce from the estimated coefficients whether markets are contestable (they are not) and
whether higher seller concentration and the presence of large multi-market chains in a market
create barriers to entry (they do). This study provides support for prior reduced form models of
the concentration-price and concentration-profit relationship that report positive and significant
relationships. It does so because it suggests entry is not likely when prices and profits are high
and therefore analysis based on static oligopoly models is appropriate.
Other empirical applications of entry in the two stage model to date are rather limited.
Bresnahan and Reiss study rural and very small town markets for automobiles (1990) and for
services (1991). Their automobile study examines 149 local markets and 116 have two or fewer
dealeships. Their services study focuses on doctors, dentists, druggists, plumbers, and tire
42
dealers. Bresnahan and Reiss pick such untypical and small rural markets because they are most
suitable for testing their specific theory of entry in local market industries. The size of the local
market is key driving factor in their model and is an instrument for endogenous N. The number
of firms is endogenous because it also is influenced by the availability of profits (incumbent firm
conduct) which is an endogenous factor, thus the need for the market size instruments.
Larger rural and small town markets can support more auto dealers, doctors, dentists, etc.
but still only very few firms. I question whether the Bresnahan and Reiss model is sufficiently
developed to handle the analysis of entry into supermarket retailing in larger non-rural local
markets. The number of firms in large markets is not as good an indicator of market
concentration. Also, supermarkets operate more than one store in larger market areas.
Therefore, as the size of a market increases the added stores can be from incumbent chain not
new entrants. Model in consumer heterogeneity and one has different store formats as well:
hypermarkets, superstores, food drug combination stores, and very upscale supermarkets to name
a few. Such generality for supermarket retailing creates more endogenous variables, requires
more instruments, and thus requires far more complicated models than Bresnahan and Reiss.
The Competition Commission store margin study recognizes this “lack of instrument” problem
when it attempts to analyze format impacts on PCM.
Finally, the Bresnahan Reiss model implies that as a market grows it will deconcentrate
as entry occurs. In food retailing, in the U.S. at least, such deconcentration has not occurred as
markets have grown over the past 30 years. Moreover, Wal-Mart’s entry in many markets has
not deconcentrated them (Franklin 2001). Wal-Mart has simply replaced prior leaders that have
disappeared from the retail landscape in many local markets (Winn Dixie, A&P, Safeway).
43
C. Specification of the Competition Commission Store Margin Model
Turning now to the specification of the Competition Commission store margin model, it
illustrates the rigorous application of the Bresnahan and Reiss methodology to supermarket
retailing. The Competition Commission describes it as a reduced form model of the impact of
market structure upon individual incumbent store Lerner Indices (average variable profit as a
percent of sales). The relation between measures of “competitor pressure” and this profit
measure captures the net impact on allocative efficiency of strategic conduct in the PQRS
dimensions. Their primary measures of competitor pressure are the number of competing fascia,
the number of competitor stores, the total square meters of competitor selling space, and the
competitor share of the total selling space in the market. Note that these provide appropriate
measures of competitive impact because they are instruments for market shares and the
Herfindahl Index in the short-run oligopoly model. Yet the Competition Commission positions
its analysis within the more general long run model by regarding these “N” variables as
endogenous and instrumenting for them. Their tests for over and underidentification indicate
moreover that their instruments are valid. Therefore, the Competition Commission analysis not
only controls for Demsetz short run endogeniety of market structure, it also controls for long run
endogeneity via variation in the number of firms.
An important feature of the Competition Commission margin study is how it defines
local markets. The Bresnahan Reiss methodology lends itself very well to narrowly defined
local markets. If one defines a market, as the Competition Commission does, for each incumbent
store by identifying stores within 10 minutes driving time (10 minute isochrone) then one has
relatively few competitors.13 As I have explained elsewhere in this report, this “catchment area”
13 See Figures 3 and 4 in the Competition Commission “Emerging Thinking” January 23, 2007. Figure 3 gives the cumulative distribution of UK urban population that has a choice of three grocery outlets (different fascia) larger
44
approach to market definition is not a hindrance if one focuses on unilateral effects. Even if the
relevant geographic market actually is larger than single store catchment areas one still analyzes
unilateral power at the catchment area (store) level in a spatially differentiated market. Although
a single store may not be able to elevate price 5%, i.e. it is not a market, weaker constraints from
nearby stores may allow it to elevate price by a lesser amount. This lesser amount may still be,
under the law, a substantial lessening of competition.
It also is entirely possible, as in Staples Office Depot, that in a larger market area one has
coordinated effects (Baker 1999 and Ashenfelter, Ashmore, Baker, Geleason, and Hosken 2006).
The FTC econometric study in Staples found no significant impact at the store level, but found
that the number of competitive stores in the urban metropolitan “market” did influence prices in
Staples stores throughout the market area. Such uniform pricing in a metro area by Staples was
higher when there were fewer competing stores. The absence of constraints at the individual
store level strongly suggests that this market wide price effect is a coordinated effect, i.e. when
Staples has fewer competitors they tend to follow Staples price lead. The FTC study, however,
only analyzed Staples prices.
The Competition Commission store margin study data set includes all stores from the top
four chains (Tesco, Sainsbury, ASDA, and Morrisons) that are greater than 280 square meters
and less than 6,000 square meters. Larger stores (hypermarkets) are not included because store
level price cost margins (PCM) for them reflect substantial nonfood sales. The dependent
variable in the model is the natural logarithm of monthly sales weighted average PCM for May
2005 through April 2006. Explanatory variables include store size (square meters) and binary
variables that indicate the presence or absence of the following for each store:
than 1400 square meters as a function of drive time. Approximately 50% have three fascia within 10 minutes drive time and 95% within 20 minutes. Figure 4 gives similar information for rural areas.

45
• petrol sold • toilets (sit down restaurants) • ATM • ASDA • Sainsbury • Sainsbury local • Tesco Extra • Tesco Metro • Tesco Superstore • Tesco Express seems to be the excluded format/fascia binary.
Input costs including retail wage rates, electricity, and cost of goods sold are not available by
store, urban area, or region in a comparable fashion. Thus the Competition Commission uses the
following set of regional binaries to control for cost differences and variation in regional
demand:
• Cities and suburbs • London suburb • London center • London cosmopolitan • Prosperous UK • Coastal • Countryside • Mining and Manufacturing • N. Ireland Countryside
These fixed effects binaries may very well control for more than regional cost and demand
differences. Although the Commission does not raise this issue, the level of competition as well
as costs could vary by region. The study also includes mean income in the 10 minute isochrone
area as a demand shift variable.
The market for each store is measured by a 10 minute isochrone area, or alternatively a
larger isochrone areas to test for the geographic extent of the competitive constraint. Four
alternative variables measure the degree of concentration.
• The number of competing fascia within the isochrone • The number of rival stores > 280 square meters within the isochrone
46
• The total square meters of these stores • The share of selling space in the market that these stores have
For competing fascia the study counts:
• Tesco, Sainsbury, ASDA, Morrisons • Aldi, Lidl, Netto • Coop, Ireland, Somerfield • Marks and Spencer, Waitrose • Spar and “all other stores over 280 square meters and below 6,000 square meters”
Different regression runs test the sensitivity of competitive impact to the size of competing stores
and the presence of different fascia.
D. Estimation Results
Table 1 of the Competition Commission study reports results for the basic model. Each
of the four competitor strength variables has a negative and significant impact on the incumbent
stores PCM. For example, increasing the number of competing fascia lowers the PCM 0.96%.
The Competition Commission explores the sensitivity of these results in several ways.
They find, for example, that the size of the three nearest competitive stores relative to the size of
the store under analysis and the drive time to the third nearest competitor have significant
impacts (negative and positive respectively) on store PCM (Table 2 of the Competition
Commission study). They find that the number of top four chain competing (AMST) fascia
within 10 minutes has a significant negative impact on the PCM of AMST stores, and that the
“number of other firm competing fascia” has no significant impact. Finally they find that
competing fascia over 1400 or over 2000 square meters have a significant impact and smaller
stores (such as ALDI, LIDL, NETTO) have no significant impact on PCMs for stores from the
top four that are above 1400 or 2000 square meters. One stop supermarkets (OSS) effectively
compete with other OSS, now smaller stores (Table 3 of the Competition Commission study).

47
E. Suggestions for Further Research
The discussion of results focuses on percent changes in store PCM. It would be helpful if
the paper also extended the impact to lowered “effective price”. Since the top four chains
change the same shelf price for a particular product throughout the U.K., “effective price”
captures the impact of vouchers and other local price reductions, and changes in QRS. Such
changes may be the offering of more service and more costly product variety in more
competitive areas which lowers PCM.
Local market cost and demand conditions vary across the U.K. The fact that the top four
firms charge the same shelf price for a product throughout the country strongly suggests the
following alternatives. Either firms vary the product mix and use local vouchers to correspond to
cost and demand changes or one has coordinated pricing among the top four firms. Charging the
same price across the entire country is not competitive pricing because it does not reflect cost
and demand conditions. Moreover, if none of the top four firms deviate from such pricing they
are not reverting to competitive pricing (cheating on the coordinated equilibrium). Stated
another way, in a competitive environment a chain’s prices in London would be much higher
than in a smaller regional city such as Telford or Leeds where local costs are lower than London.
This suggests reinterpretation of the regional binaries because they may capture HIGHER PCM
because lower costs are not being passed on to consumers as lower prices in low cost areas. At a
minimum one might interact the regional binaries with the competitor pressure variable to see if
competitive effect varies by region. Also, the Commission should, if it has not done so, explore
the product lines carried and product line volume movement in different local market areas,
especially high income and low income areas.14
14 I would note that in Emerging Thinking Jan. 23, 2007, the Commission states:
48
One question that arises after studying the empirical analysis concerns whether it indeed
presents equilibrium results? If it does then one has very different equilibrium structures in
catchment areas across the U.K.15 Why is this so? How many are effectively competitive?
Population density and demographic characteristics may explain some variation in equilibrium
structures. Otherwise this analysis captures various markets at different stages of adjustment to
equilibrium. For example, in an urban area with “normal” density and travel conditions a store
in equilibrium may have three competing stores over 1400 square meters from three different
fascia, however, in some markets there are one, two, four, or more.
Additional analysis of the status of current competition, i.e. whether it is near or at
equilibrium would be interesting and useful. This of course points towards the analysis of
changes in the number of stores and/or fascia in local market areas however defined.
The Competition Commission could analyze what determines the entry of a new store or
fascia. A study along the avenue of Cotterill and Haller (1992) that predicts local market entry
by one of the top four chains (ASMT) would be a useful complement to the store margin
analysis. In fact, the two equation model of store profitability and the likelihood of entry could
be estimated jointly. The likelihood of entry could be a function of the growth of market
demand, the number of top four chains already in the market (a deterrent effect) the market share
of space captured by the top firms in the market, and possibly some measure of store sites
Grocery retailers may compete locally on factors other than price. Retailers may price products nationally but adjust their product range according to local competitive conditions. A number of retailers told us that product ranges varied locally according to competitive conditions. Grocery retailers may also vary the level of service at a store, for example the number of checkouts that are open or the number of staff stocking shelves. Non-price competition in the form of store refurbishment or extensions also may take place, particularly in the context of responding to new entry. Going forward, we will be assessing the extent to which grocery retailers vary their offer according to local factors, including the number and identity of competitors in the area. This will include an assessment of whether there is evidence that grocery retailers vary the quality, range and service at a store according to local conditions. (Competition Commission 2007a, para 144-145).
15 Again, see Figures 3 and 4 from Emerging Thinking as discussed in Footnote 13 of this report.

49
available. This modeling effort, in addition to analyzing the impact of market structure on
PCMs, could shed light on the height of barriers to entry in local market areas and the ability of
different chains to surmount them.
Finally, Tesco and possibly others may have questioned whether the negative impact on
PCM of added competitors is due to reduced quantity sold at the stores under analysis. An
insight on this issue comes from the earlier discussion of Demsetz cost differences. First note
that instrumenting for market share or the Herfindahl index by using the number of firms
removes variation in there measures due to cost differences. Also, the Competition Commission
instruments for N because it maintains that entry is endogenous. It uses population and
population density as instruments for N. Therefore, one has a “double purge” of the volume
related cost effects. The Competition Commission study does isolate the competitive impact of a
larger share and higher concentration, as measured by the four alternative competitor pressure
variables, on price cost margins. These estimates reflect market power not cost efficiency.
50
References:
Ashenfelter, O., D. Ashmore, J.B. Baker, S. Gleason, and D.S. Hosken. 2006. Empirical Methods in Merger Analysis: Econometric Analysis of Pricing in FTC v. Staples. International Journal of the Economics of Business, 13(2): 265-279.
Bain, J. 1959. Industrial Organization. New York: Wiley. Bain, J.S. 1956. Barriers to New Competition. Cambridge: Harvard University Press. Bain, J.S. 1951. Relation of Profit Rate to Industry Concentration: American Manufacturing
1936-1940. Quarterly Journal of Economics, 65: 293-324. Baker, J.B. 1999. Econometric Analysis in FTC v. Staples. Journal of Public Policy &
Marketing, 18:1, p11-21. Baker, J.S. and T.F. Bresnahan. 1985. The gains from merger or collusion in product-
differentiated industries. Journal of Industrial Economics 33, 427-44. Bell, D. and J. Lattin. 1996. Shopping behaviour and consumer preference for store price
format: Why large basket shoppers prefer EDLP. Marketing Science 17, 66-88. Bell, D., H. Teck, and C. Tang. 1998. Determining where to shop: Fixed and variable costs of
shopping. Journal of Marketing Research 35, 352-369. Berry, S. and P. Reiss. 2006. Empirical Models of Entry and Market Structure. Handbook of
Industrial Organization, eds. Mark Armstrong and Robert Porter. North Holland. Bresnahan, T.F. and P.C. Reiss. 1991. Entry and Competition in Concentrated Markets.
Journal of Political Economy, 99(5): 977-1009. Bresnahan, T.F. and P.C. Reiss. 1990. Entry in Monopoly Markets. Review of Economic
Studies, 57: 531-553. Bucklin, R.E. and J. Lattin. 1992. A model of product category competition among grocery
retailers. Journal of Retailing 68, 271-293. Chamberlain, E. 1933. The Theory of Monopolistic Competition. Cambridge: Harvard
University Press. Chevalier, J.A. 1995. Do LBO Supermarket Charge More? An Empirical Analysis of the
Effects of LBOs on Supermarket Pricing. The Journal of Finance 50: 4, 1095-1112. Chidmi, B. and R.A. Lopez. 2007. Supermarket-Brand Level Demand for Breakfast Cereals and
Retail Competition. American Journal of Agricultural Economics 89, in press. Chidmi, B., R. Lopez and R.W. Cotterill. 2005. Vertical Relationships in the Ready-to-Eat
Cereal Market in Boston. Presented by R.W. Cotterill at the 32nd Conference European Association for Research in Industrial Economics, Porto, Portugal, September 1-4.
Clark, R., S.W. Davies, and M. Waterson. 1984. The Profitability-Concentration Relation: Market Power or Efficiency? Journal of Industrial Economics, 21(4): 435-450.
Competition Commission. 2007a. Groceries Market Investigation, Emerging Thinking. January 23. Available at: http://www.competition-commission.org.uk/inquiries/ref2006/grocery/ pdf/emerging_thinking.pdf
Competition Commission. 2007b. Working Paper on Market Definition. January 23. Available at: http://www.competition-commission.org.uk/inquiries/ref2006/grocery/pdf/emerging_ thinking_market_definition.pdf
Competition Commission. 2007c. Groceries Market, Working paper on coordination. Available at: http://www.competition-commission.org.uk/inquiries/ref2006/grocery/pdf/further_ working_papers_coordination.pdf

51
Competition Commission. 2005. Somerfield plc and Wm Morrison Supermarkets plc, A report on the acquisition by Somerfield plc of 115 stores from Wm Morrison Supermarkets plc. Available at: http://www.competition-commission.org.uk/rep_pub/reports/2005/fulltext/ 501.pdf
Competition Commission. 2003a. Safeway plc and Asda Group Limited (owned by Wal-Mart Stores Inc); Wm Morrison Supermarkets PLC; J Sainsbury plc; and Tesco plc, a report on othe mergers in contemplation. Presented to Parliament by the Secretary of State for Trade and Industry by Command of Her Majesty. Available at: http://www.competition-commission.org.uk/rep_pub/reports/2003/481safeway.htm#full
Competition Commission. 2003b. Merger References: Competition Commission Guidelines, June. Available at: http://www.competition-commission.org.uk/rep_pub/rules_and_ guide/pdf/15073compcommguidance2final.pdf
Competition Commission. 2000. Supermarkets: A report on the supply of groceries from multiple stores in the United Kingdom, Cm 4842, TSO: London.
Competition Commission. Undated a. Quantitative Analysis Working Paper. Competition Commission. Undated b. Annex: The Impact of Local Competition on Store Profit
Margin. Competition Commission. Undated c. Entry analysis annex. Cotterill, R.W. 2002. The Predatory Impacts of the Ahold/Pathmark Offer to Buy the Big V
Shop Rite Supermarket Chain. A report delivered to the FTC for Wakefern Food Corp., May 13.
Cotterill, R.W. 1999. An Antitrust Economic Analysis of the Proposed Acquisition of Supermarkets General Holdings Corporation by Ahold Acquisitions Inc. Food Marketing Policy Center Research Report No. 46, University of Connecticut, Storrs. Available at: http://www.fmpc.uconn.edu/publications/rr/rr46.pdf.
Cotterill, R.W. 1994. Scanner Data: New Opportunities for Demand and Competitive Strategy Analysis. Agricultural and Resource Economics Review 23(2):125-139.
Cotterill, R.W. 1993. Food Retailing: Mergers, Leveraged Buyouts and Performance in L. Duetsch ed. Industry Studies, Prentice Hall, Englewood Cliffs.
Cotterill, R.W. 1986. Market Power in the Retail Food Industry: Evidence from Vermont. Review of Economics and Statistics, 68(3): 379-386.
Cotterill, R.W. and A. Franklin. 1999. An Estimation of Consumer Benefits from the Public Campaign to Lower Cereal Prices. Agribusiness: An International Journal, 15:2, 273-287.
Cotterill, R.W., A.W. Franklin and L.E. Haller. 1994. Harvesting and Tacit Collusion in the Breakfast Cereal Industry: A Case Study of Nabisco Shredded Wheat and Post Grape Nuts. Food Marketing Policy Center Issue Paper No. 6, University of Connecticut, Storrs. Available at: http://www.fmpc.uconn.edu/publications/ip/ip6.pdf.
Cotterill, R.W. and L.E. Haller. 1997. An econometric analysis of the demand for RTE cereal: Product market definition and unilateral market power effects. Food Marketing Policy Center Research Report No. 35, University of Connecticut, Storrs. Available at: http://www.fmpc.uconn.edu/publications/rr/rr35.pdf.
Cotterill, R.W. and L.E. Haller. 1992. Barrier and Queue Effects: A Study of Leading U.S. Supermarket Chain Entry Patterns. Journal of Industrial Economics, 40(4): 427-440.
Cotterill, R.W., R. Dhar, and W. Putsis. 2000. Assessing the Competitive Interaction Between Private Labels and National Brands. Journal of Business, 73:1, 109-137,

52
Cotterill, R.W., T.P. Dhar, and A.W. Franklin. 1999. Post Merger Price Conduct: A Case Study of Pricing in Connecticut Markets After the 1996 Royal Ahold Stop & Shop Merger. Food Marketing Policy Center Research Report No. 47, University of Connecticut, Storrs. Available at: http://www.fmpc.uconn.edu/publications/rr/rr47.pdf.
Cowling, K. and M. Waterson, 1976. Price-cost Margins and Market Structure. Economica, 43: 267-74.
Decision Technology. 2006. Total Customer Cost: Superpanel Models. Presentation in association with the University of Warwick. April 18.
Delco LLC and Edward Decker v. Giant of Maryland LLC, Wakefern Food Corp., and Stop & Shop Supermarket Company, LLC. 2007. United States District Court for the District of New Jersey Camden Vicinage.
Demsetz, H. 1974. Two systems of belief about monopoly. In Industrial Concentration: The New Learning, eds. Harvey J. Goldschmid, H. Michael Mann, and J. Fred Weston. Boston: Little, Brown.
Devine, D. G. 1978. A Review of the Environmental Effects of Increased Price Information on the Performance of Canadian Retail Food Stores in the 1970's. Canadian Journal of Agricultural Economics 26, 24-30.
Devine, D. G. and B. W. Marion. 1979. The Influence of Consumer Price Information on Retail Pricing and Consumer Behavior. American Journal of Agricultural Economics 61, 228-237.
Dickson, P.R. and A.G. Sawyer. 1990. The Price Knowledge and Search of Supermarket Shoppers. Journal of Marketing 54(3), 42-53.
European Union. 2004. Guidelines on the assessment of horizontal mergers under the Council Regulation on the control of concentrations between undertakings. Official Journal of the European Union. Available at: http://europa.eu.int/eur-lex/pri/en/oj/dat/2004/c_031/ c_03120040205en00050018.pdf
Franklin, A.W. 2001. The impact of Wal-Mart supercenters on supermarket concentration in US metropolitan areas. Agribusiness, 17(1): 105
Froeb, L.M. and G.J. Werden. 1991. Endogeneity in the concentration-price relationship: cause and consequences. Economic Analysis Working Paper, Antitrust Division of the US Department of Justice, Washington D.C.
Frontier Economics. 2007b. Geographic Market Definition and the SSNIP Test. Presentation to the Competition Commission.
Federal Trade Commission v. Whole Foods Market, Inc. and Wild Oats Markets, Inc. 2007. United States District Court for the District of Columbia, Civil Action No. 07-1021.
Food Marketing Institute (FMI). 2006. 2005-2006 Annual Financial Review. Washington, DC: Food Marketing Institute.
Hausman, Jerry A. 2007. An assessment of geographic market definition in the UK groceries market. July 16.
Hausman, J., G. Leonard, and J.D.Zona. 1994. Competitive Analysis with Differentiated Products. Annales D’Economie et de Statistique 34, 159-80.
Levy, D. and J. Reitzes. 1993. Product Differentiation and the Ability to Collude: Where Being Different Can be an Advantage. Antitrust Bulletin, 349-368.
Levy, D., and J. Reitzes. 1992. Anticompetitive effects of mergers in markets with localized competition. Journal of Law, Economics, and Organization 8, 427-40.
53
Manne, H. 1965: Mergers and the Market for Corporate Control. Journal of Political Economy 73, 110–120.
Marion, B.W., W.F. Mueller, R.W. Cotterill, F.E. Geithman, and J.R. Schmelzer. 1979. The Food Retailing Industry: Market Structure, Profits, and Prices. New York: Praeger.
Martin, S. 1979. Advertising, concentration, and profitability: the simultaneity problem. Bell Journal of Economics, 10(2): 639-47.
Masson, R.T. and J. Shaanan. 1982. Stochastic-dynamic limit pricing: an empirical test. Review of Economics and Statistics, 64: 413-422.
Maynes, E. S. 1978. Informational Imperfections in Local Consumer Markets. In The Effect of Information on Consumer and Market Behavior, ed. A. A. Mitchell, 77- 100. Chicago: American Marketing Assoc.
Mueller, W.F., B.W. Marion, and M.H. Sial. 1997. Price Leadership on the National Cheese Exchange. Review of Industrial Organization 12(4), 626-654.
Neville-Rolfe, Lucy. 2007c. Letter from Tesco PLC to Tim Oyler, Competition Commission, Re: Market Investigation: The Supply of Groceries by Retailers in the United Kingdom: Follow up on SSNIP test meeting. February 7.
Nevo, A. 2001. Measuring Market Power in the Ready-to-Eat Cereal Industry. Econometrica 69:2, 307-342.
Pagoulatos, E. and R. Sorensen. 1981. A Simultaneous Equation Analysis of Advertising, Concentration and Profitability. Southern Economic Journal, 47(3): 728-741.
Progressive Grocer. 1974. (November). RBB Economics. 2007a. Geographic Market Definition in Grocery Retail. July 13. RBB Economics. 2007b. Geographic market Definition: A Response to Tesco and Professor
Hausman. August. Robinson, J. 1933. The Economics of Imperfect Competition. London: Macmillan & Co., Ltd. CONFIDENTIAL. Salinger, M. 1990. The Concentration-Margins Relation Reconsidered. Brookings Papers on
Economic Activity, 287-335. Salop, S.C. and D.T. Scheffman. 1983. Raising Rivals’ Costs. American Economic Review,
73:267-71. Smith, Ron. 2007. CC Market Investigation – Opinion on SSNIP test methodology. State of New York v. R.J. Nabisco and Philip Morris. 1993-1994. A horizontal acquisition of
Nabisco Shredded Wheat by Philip Morris/Kraft General Foods, Post Cereals. Southern District of New York Federal Court.
Tesco. Undated a. Geographic Market Definition in the Groceries Inquiry Tesco. Undated b. Response to Emerging Thinking, Market Definition Working Paper. Tesco. Undated d. Tesco – Groceries Inquiry, Further Evidence Supporting our View that there
is a National Geographic Market. Triffin, R. 1940. Monopolistic Competition and General Equilibrium Theory. Cambridge:
Harvard University Press. Uhl, J. M., R. D. Boyton and B. F. Blake. 1981. The Effects of Comparative Foodstore Price
Information on Price Structures and Consumer Behavior in Local Food Markets. West Lafayette, IN.:Dept. of Agricultural Economics, Purdue Univ.
UK Office of National Statistics. 2006. Internet Access, 57% of households had access. Available at: http://www.statistics.gov.uk/cci/nugget.asp?id=8

54
Urbany, J.E., P.R. Dickson, and A.G. Sawyer. 2000. Insights Into Cross- and Within-Store Price Search: Retailer Estimates Vs. Consumer Self-Reports. Journal of Retailing 76(2), 243-258.
U.S. Department of Justice. 1992. Federal Horizontal Merger Guidelines. Available at: http://www.usdoj.gov/atr/public/guidelines/hmg.htm
Wall Street Journal. 2000. Pathmark Submits Filing for Bankruptcy Under Chapter 11 Law. New York, N.Y.: Jul 13, pg. A.8
Weiss, L.W. 1989. Concentration and Price, ed. Leonard W. Weiss. Cambridge: MIT. Weiss, L.W. 1974. The concentration-profits relationship and antitrust. In Industrial
Concentration: The New Learning, eds. Harvey J. Goldschmid, H. Michael Mann, and J. Fred Weston. Boston: Little, Brown.
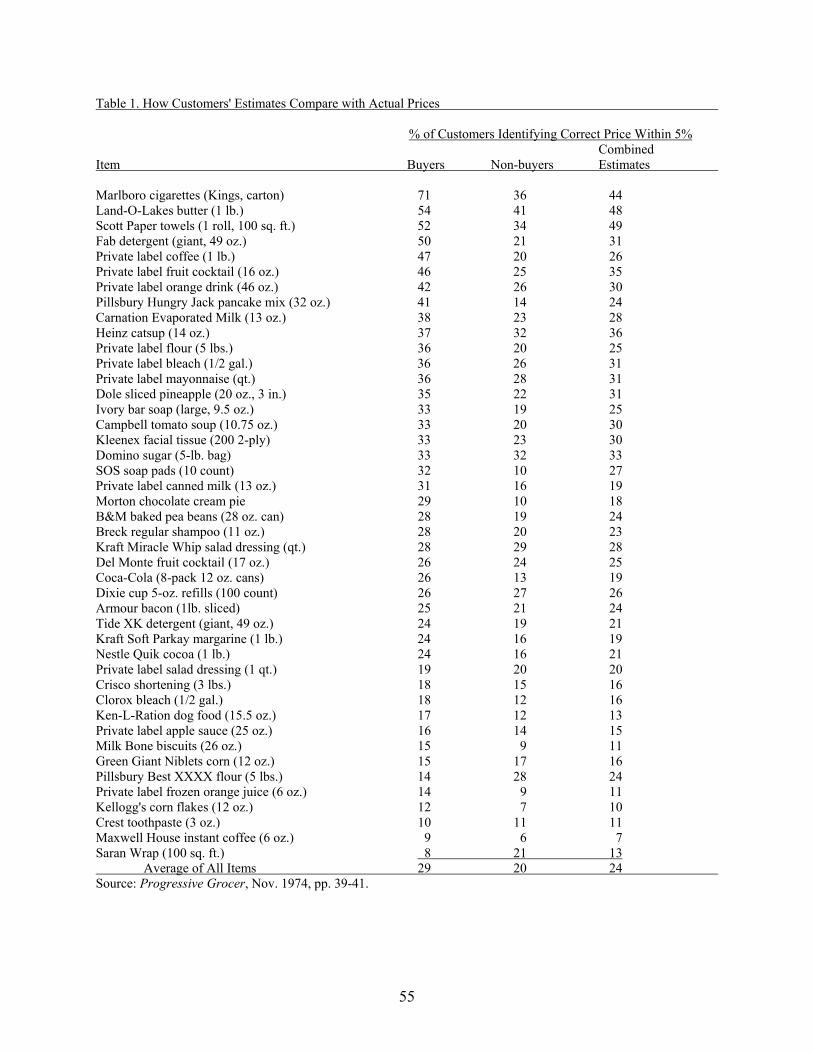
55
Table 1. How Customers' Estimates Compare with Actual Prices
% of Customers Identifying Correct Price Within 5% Combined Item Buyers Non-buyers Estimates Marlboro cigarettes (Kings, carton) 71 36 44 Land-O-Lakes butter (1 lb.) 54 41 48 Scott Paper towels (1 roll, 100 sq. ft.) 52 34 49 Fab detergent (giant, 49 oz.) 50 21 31 Private label coffee (1 lb.) 47 20 26 Private label fruit cocktail (16 oz.) 46 25 35 Private label orange drink (46 oz.) 42 26 30 Pillsbury Hungry Jack pancake mix (32 oz.) 41 14 24 Carnation Evaporated Milk (13 oz.) 38 23 28 Heinz catsup (14 oz.) 37 32 36 Private label flour (5 lbs.) 36 20 25 Private label bleach (1/2 gal.) 36 26 31 Private label mayonnaise (qt.) 36 28 31 Dole sliced pineapple (20 oz., 3 in.) 35 22 31 Ivory bar soap (large, 9.5 oz.) 33 19 25 Campbell tomato soup (10.75 oz.) 33 20 30 Kleenex facial tissue (200 2-ply) 33 23 30 Domino sugar (5-lb. bag) 33 32 33 SOS soap pads (10 count) 32 10 27 Private label canned milk (13 oz.) 31 16 19 Morton chocolate cream pie 29 10 18 B&M baked pea beans (28 oz. can) 28 19 24 Breck regular shampoo (11 oz.) 28 20 23 Kraft Miracle Whip salad dressing (qt.) 28 29 28 Del Monte fruit cocktail (17 oz.) 26 24 25 Coca-Cola (8-pack 12 oz. cans) 26 13 19 Dixie cup 5-oz. refills (100 count) 26 27 26 Armour bacon (1lb. sliced) 25 21 24 Tide XK detergent (giant, 49 oz.) 24 19 21 Kraft Soft Parkay margarine (1 lb.) 24 16 19 Nestle Quik cocoa (1 lb.) 24 16 21 Private label salad dressing (1 qt.) 19 20 20 Crisco shortening (3 lbs.) 18 15 16 Clorox bleach (1/2 gal.) 18 12 16 Ken-L-Ration dog food (15.5 oz.) 17 12 13 Private label apple sauce (25 oz.) 16 14 15 Milk Bone biscuits (26 oz.) 15 9 11 Green Giant Niblets corn (12 oz.) 15 17 16 Pillsbury Best XXXX flour (5 lbs.) 14 28 24 Private label frozen orange juice (6 oz.) 14 9 11 Kellogg's corn flakes (12 oz.) 12 7 10 Crest toothpaste (3 oz.) 10 11 11 Maxwell House instant coffee (6 oz.) 9 6 7 Saran Wrap (100 sq. ft.) 8 21 13 Average of All Items 29 20 24 Source: Progressive Grocer, Nov. 1974, pp. 39-41.

Annex A:
Competition Commission Documents Used for this Report. Competition Commission. 2007a. Groceries Market Investigation, Emerging Thinking.
January 23. Available at: http://www.competition-commission.org.uk/inquiries /ref2006/grocery/pdf/emerging_thinking.pdf
Competition Commission. 2007b. Working Paper on Market Definition. January 23. Available at: http://www.competition-commission.org.uk/inquiries/ref2006 /grocery/pdf/emerging_thinking_market_definition.pdf
Competition Commission. 2007c. Groceries Market, Working paper on coordination. Available at: http://www.competition-commission.org.uk/inquiries/ref2006/ grocery/pdf/further_working_papers_coordination.pdf
Competition Commission. 2007d. Groceries 268, Grocery Market Inquiry, Definition Discussion with Tesco. February 15.
Competition Commission. 2005. Somerfield plc and Wm Morrison Supermarkets plc, A report on the acquisition by Somerfield plc of 115 stores from Wm Morrison Supermarkets plc. Available at: http://www.competition-commission.org.uk/ rep_pub/reports/2005/fulltext/501.pdf
Competition Commission. 2003a. Safeway plc and Asda Group Limited (owned by Wal-Mart Stores Inc); Wm Morrison Supermarkets PLC; J Sainsbury plc; and Tesco plc, a report on othe mergers in contemplation. Presented to Parliament by the Secretary of State for Trade and Industry by Command of Her Majesty. Available at: http://www.competition-commission.org.uk/rep_pub/reports/2003/ 481safeway.htm#full
Competition Commission. 2003b. Merger References: Competition Commission Guidelines, June. Available at: http://www.competition-commission.org.uk /rep_pub/rules_and_guide/pdf/15073compcommguidance2final.pdf
Competition Commission. 2000. Supermarkets: A report on the supply of groceries from multiple stores in the United Kingdom, Cm 4842, TSO: London.
Competition Commission. Undated a. Quantitative Analysis Working Paper. Competition Commission. Undated b. Annex: The Impact of Local Competition on
Store Profit Margin. Competition Commission. Undated c. Entry analysis annex. Decision Technology. 2006. Total Customer Cost: Superpanel Models. Presentation in
association with the University of Warwick. April 18. Easterbrook, Jill. 2007. Letter from Tesco PLC to Tim Oyler, Competition Commission,
Re: Market Investigation: The Supply of Groceries by Retailers in the United Kingdom. April 5.
Frontier Economics. 2007a. Market Definition Working Paper – Assessment of Geographic Market Definition. Staff meeting with the CC. June 4. Frontier Economics. 2007b. Geographic Market Definition and the SSNIP Test.
Presentation to the Competition Commission. Hausman, Jerry A. 2007. An assessment of geographic market definition in the UK
groceries market. July 16.

Neville-Rolfe, Lucy. 2007a. Letter from Tesco PLC to Andrew Taylor, Competition Commission, Re: Market Investigation: The Supply of Groceries by Retailers in the United Kingdom: Paper by Professor Hausman. July 16.
Neville-Rolfe, Lucy. 2007b. Letter from Tesco PLC to Andrew Taylor, Competition Commission, Re: Market Investigation: The Supply of Groceries by Retailers in the United Kingdom. March 30.
Neville-Rolfe, Lucy. 2007c. Letter from Tesco PLC to Tim Oyler, Competition Commission, Re: Market Investigation: The Supply of Groceries by Retailers in the United Kingdom: Follow up on SSNIP test meeting. February 7.
RBB Economics. 2007a. Geographic Market Definition in Grocery Retail. July 13. RBB Economics. 2007b. Geographic Market Definition: A Response to Tesco and
Professor Hausman. August. CONFIDENTIAL. Smith, Ron. 2007. CC Market Investigation – Opinion on SSNIP test methodology. Tesco. Undated a. Geographic Market Definition in the Groceries Inquiry Tesco. Undated b. Response to Emerging Thinking, Market Definition Working Paper. Tesco. Undated c. Tesco – CC, Response to RBB Economics. Tesco. Undated d. Tesco – Groceries Inquiry, Further Evidence Supporting our View
that there is a National Geographic Market.

Annex B.
Curriculum Vita of Ronald W. Cotterill, Ph.D.
FOOD MARKETING POLICY CENTER RESEARCH REPORT SERIES
This series includes final reports for contract research conducted by Policy Center Staff. The series also contains research direction and policy analysis papers. Some of these reports have been commissioned by the Center and are authored by especially qualified individuals from other institutions. (A list of previous reports in the series is available on our web site.) Other publications distributed by the Policy Center are the Working Paper Series, Journal Reprint Series for Regional Research Project NE-165: Private Strategies, Public Policies, and Food System Performance, and the Food Marketing Issue Paper Series. Food Marketing Policy Center staff contribute to these series. Individuals may receive a list of publications in these series and paper copies of older Research Reports are available for $20.00 each, $5.00 for students. Call or mail your request at the number or address below. Please make all checks payable to the University of Connecticut. Research Reports can be downloaded free of charge from our web site given below.
Food Marketing Policy Center 1376 Storrs Road, Unit 4021
University of Connecticut Storrs, CT 06269-4021
Tel: (860) 486-1927
FAX: (860) 486-2461 email: [email protected]
http://www.fmpc.uconn.edu