food insecurity and health of international students
TRANSCRIPT

University of Mississippi University of Mississippi
eGrove eGrove
Electronic Theses and Dissertations Graduate School
2019
Food Insecurity and Health of International Students Food Insecurity and Health of International Students
Jamie Nichole Benefield University of Mississippi
Follow this and additional works at: https://egrove.olemiss.edu/etd
Part of the Nutrition Commons
Recommended Citation Recommended Citation Benefield, Jamie Nichole, "Food Insecurity and Health of International Students" (2019). Electronic Theses and Dissertations. 1594. https://egrove.olemiss.edu/etd/1594
This Thesis is brought to you for free and open access by the Graduate School at eGrove. It has been accepted for inclusion in Electronic Theses and Dissertations by an authorized administrator of eGrove. For more information, please contact [email protected].

FOOD INSECURITY AND HEALTH OF INTERNATIONAL STUDENTS
A Thesis
presented in partial fulfillment of requirements
for the degree of Master of Science
in the Department of Nutrition and Hospitality Management
The University of Mississippi
by
Jamie N. Benefield
May 2019

Copyright © 2019 by Jamie Benefield
All rights reserved

ii
ABSTRACT
International college students may be at risk for suffering from food insecurity and poor
health. The purposes of this study were to: 1) determine if the household adult food security
status (HAFSS) differs between undergraduate and graduate international students (INSTUD)
attending the University of Mississippi (UM); 2) establish if a statistically significant relationship
exists between health (physical functioning (PF) , role limitations due to physical health (RLPH),
role limitations due to emotional problems (RLEP), energy/fatigue (EF), emotional well-being
(EWB), social functioning (SF), pain (P), and general health (GH) and HAFSS; 3) assess if
health differs between INSTUD living in food secure and food insecure households at UM; and
4) determine if health predicts HAFSS in INSTUD attending UM. A cross-sectional survey
design was used. Methods included sending a fifty-eight-question survey questionnaire assessing
current food insecurity status and health to 750 randomly-selected INSTUD via university email.
This survey included questions to assess basic demographic information, the USDA’s HFSSM
Six-Item Short Form and the RAND 36-Item Short Form. To determine the differences in
HAFSS in undergraduate and graduate INSTUD, a Pearson Chi-square test was performed. A
Pearson’s correlation coefficient was used to identify if a statistically significant relationship
exists between health and HAFSS. When assessing the difference in health status between food
secure and food insecure INSTUD, a two-tail independent samples t-test was used. When
identifying if health predicts HAFSS, an ordinal logistic regression with proportional odds

iii
test was performed. Participants (n=94, 12.5% response rate) were from thirty-five different
countries were primarily male (n=48, 51.1%), graduate students (n=50, 53.2%), that received
funding (n=82, 87%). INSTUD were categorized by high food security (n=27, 28.7%), marginal
food security (n=12, 12.8%), low food security (n=24, 25.5%), and very low food security (n=31,
33%). The majority of participants were characterized as being non-OECD member countries
(n=75,80%), with noted differences in food security by students from non-OECD and OECD
countries. No differences in HAFSS were observed between undergraduate and graduate students
(p=.344). Significant relationships between RLPH (p<.05), EF (p<.001), EWB (p<.05), SF
(p<.001), P (p<.05), and GH (p<.001) and food security status were noted. RLPH (p=.043), SF
(p<.001), and GH (p<.001) differed between food secure and food insecure INSTUD. Health
scores in these areas were higher in food secure INSTUD. Essentially, as health scores
decreased, food security worsened. Analysis also found decreased odds of living in a food
insecure household for individuals with good SF (OR=.95) and GH (OR=.96). To conclude,
INSTUD at UM may suffer from poor health and experience food insecurity. Better SF and
better GH promote food security among INSTUD.

iv
DEDICATION
I would like to dedicate this work to Jesus Christ, for whose love for all people from every nation
inspired this project.

v
ACKNOWLEDGEMENTS
I would like to thank Dr. David H. Holben for serving as my thesis advisor as well as for
his guidance and support during the research process. I would also like to thank Dr. Georgianna
Mann and Dr. Anne Cafer for serving on my thesis committee. Additionally, I would like to
extend gratitude towards Prabhdeep Sandha for her involvement on my research team. Thanks
should also be extended to the Office of Institutional, Research, Effectiveness, and Planning for
survey distribution.

vi
TABLE OF CONTENTS
ABSTRACT ........................................................................................................................ ii
DEDICATION .................................................................................................................. iv
ACKNOWLEDGEMENTS .................................................................................................v
TABLE OF CONTENTS .................................................................................................. vi
LIST OF TABLES ........................................................................................................... vii
LIST OF FIGURES ........................................................................................................... ix
INTRODUCTION ...............................................................................................................1
REVIEW OF LITERATURE .............................................................................................6
METHODOLOGY ............................................................................................................20
RESULTS ..........................................................................................................................25
DISSCUSSION ..................................................................................................................33
REFERENCES .................................................................................................................41
LIST OF APPENDICES ....................................................................................................59
VITA ..................................................................................................................................90

vii
LIST OF TABLES
TABLE PAGE
1 Primary Research Questions and Null Hypotheses…………………………………….….……5
2 Food Security Scales…………………….……………............................……………..………10
3 Variables and Measures………………………………………………………...………...……22
4 Primary Research Questions and Statistical Procedures…………………………………...…. 24
5 Household Adult Food Security Status of International Students at the University of
Mississippi……………………………...……………………………………………………......25
6 Participant Demographic Characteristics……...…………………...………………...…....…. 27
7 Participant Health Status……...…...……………………………………………….……...…. 27
8 Differences in Household Adult Food Security between OECD members and Non-OECD
members………………………………………………………..……………………..…….……28
9 Differences in Household Adult Food Security Status between Undergraduate and Graduate
Participants …………………………………………………………………………..…….……28
10 Relationship of Health Concept Scores to Household Adult Food Security Scale
Score………………………………………………………………………….……….……...….29

viii
11 Differences in the eight health concepts scores between food secure and food insecure
international students……………………………………………………………...…...….……. 30
12 Eight Health Concepts and Prediction of Food Security Status……………………...………32

ix
LIST OF FIGURES
FIGURE PAGE
1 Trends of Food Insecurity Prevalence Rates for 1998-2016……………….………….….……7

1
CHAPTER I
INTRODUCTION
Food insecurity is defined as inadequate or unreliable access to sufficient food (United
States Department of Agriculture, 2017). While many people are at risk for suffering from food
insecurity, college students are particularly at-risk for becoming food insecure (Bruening,
Brennhofer, van Woerden, Todd, & Laska, 2016; Gaines, Robb, Knol, & Sickler, 2014;
Gallegos, Ramsey, & Ong 2014; Morris, Smith, Davis, & Null, 2016; Patton-López, López-
Cevallos, Cancel-Tirado, & Vazquez, 2014; Silva et al., 2015). Factors contributing to food
insecurity among college students include having fair or poor health, being employed, low
income, receiving support from student loans, living alone, having inadequate time for shopping
or preparation, being a single parent, and being African American or Latino (Bruening, Argo,
Payne-Sturges, & Laska, 2017).
Prevalence of food insecurity ranges from 14-59% on U.S. college campuses (Gaines,
Robb, Knol, & Sickler, 2014; Patton-López, López-Cevallos, Cancel-Tirado, & Vazquez, 2014;
Maroto, Snelling, & Linck, 2015) and varies based upon region and sampling pool. At an
Alabama university, fourteen percent of students were food insecure; however, other studies
report food insecurity prevalence rates to be much higher (Gaines, Robb, Knol, & Sickler, 2014).
At an Oregon university, 59% of students were identified as food insecure, and at a Maryland
community college, 56% of students identified as being food insecure (Gaines, Robb, Knol, &
Sickler, 2014; Patton López, López-Cevallos, Cancel-Tirado, & Vazquez, 2014; Maroto,
Snelling, & Linck, 2015).

2
Within the literature on food insecurity on college campuses, populations studied vary.
Some studies only include undergraduate students (Lin et al., 2013; Bruening, Brennhofer, van
Woerden, Todd, & Laska, 2016; Gaines, Robb, Knol, & Sickler, 2014; Knol, Robb, McKinley &
Wood, 2017), while other studies include both undergraduate and graduate students (Silva et al.,
2015; Watson, Malan, Glik, & Martinez, 2017). Some studies stratify samples by undergraduate
and graduate status, while others do not. (Henry, 2017; Maroto, Snelling, & Linck, 2015;
Soldavini, Berner, & Silva, 2019).
International students have a potential to suffer from food insecurity; however, only three
papers have focused on this population (Watson, Malan, Glik, & Martinez, 2017; Henry, 2017;
Soldavini, Berner, & Silva, 2019). International students seeking to study in the United States
have to undergo a thorough process surrounding their financial ability to attain an F-1 or M-1
Student Visa, and the U.S. Citizenship and Immigration Services require that international
students have adequate finances to support them for the duration of their program of study (U.S.,
Citizenship and Immigration Services, 2016). For instance, a student who is sponsored fully by
their government, academic institution, or other foundation/sponsoring agency must provide a
letter written by the sponsor disclosing the amount and duration of their sponsorship to confirm
their ability to finance tuition and other estimated costs (The University of Mississippi, 2018). If
a student is using their personal or family funds, they must provide an official bank statement
from the past six months; this statement must contain an official bank seal and signature from a
bank officer (The University of Mississippi, 2018).
Cost of tuition and other expenses associated with international student university
attendance vary. For example, the University of Mississippi has an estimated cost of attendance
for both undergraduate and graduate level international students of $42,633 per academic year

3
(The University of Mississippi, 2018). With this large financial burden, international students
may be at risk for suffering from food insecurity.
The health status of these university students may also be associated with food insecurity,
since the association of food insecurity and poor physical and mental health is supported by the
literature (Afulani, Coleman-Jensen, & Herman, 2018; Alvarez, Lantz, Sharac, & Shin, 2015;
Berkowitz et al., 2013; Bishop & Wang, 2018; Brucker, 2016; Bruening, Dinour, Rosales
Chavez, 2017; Bruening, van Woerden, Todd, & Laska, 2018; Crews et al., 2014; Darling,
Fahrenkamp, Wilson, D’Auria, & Sato, 2017; Dominick, Olnyk, Widmar, Ruple, Grennell Weir,
& Acharya, 2018; Gregory & Coleman-Jensen, 2017; Gowda, Hadley, & Aiello, 2012;
Gucciardi,Vahabi, Norris, Del Monte, and Farnum, 2014; Hernandez, Reesor, & Murillo, 2017;
Holben and Berger, 2017; Holben & Pheley, 2006; Knol, Robb, McKinley & Wood, 2017; King,
2018; Laraia, 2013; Lee, Scharf, and DeBoer, 2018; Leung, Epel, Willett, Rimm, & Laraia 2015;
Leung, Tester, & Laraia, 2017; Liu et al., 2014; Martinez, Frongillo, Leung, & Ritchie, 2018;
Patton-López., López-Cevallos, Cancel-Tirado, & Vazquez, 2014; Pheley, Holben, Graham, &
Simpson, 2002; Tarasuk, Mitchell, McLaren, and McIntyre, 2013; Saiz et al., 2016; Seligman et
al., 2010). Yet, research is lacking in food insecurity and health among international students’ in
the United States. Notably, most research published on food insecurity and health has utilized
food insecurity as a predictor of health outcomes (Holben & Berger-Marshall, 2017). However,
Tarasuk, Mitchell, McLaren, and McIntyre (2013), using a Canadian sample, utilized physical
and mental health conditions as a predictor of food insecurity. They reported that most chronic
physical and mental health conditions, including diabetes, cardiovascular disease, fibromyalgia,
and depression, increased the odds of food insecurity, independent of household demographics
(Tarasuk, Mitchell, McLaren, and McIntyre, 2013). The possibility of food insecurity and both

4
mental and physical health outcomes being bidirectional is well supported in the literature
(Bruening, Argo, Payne-Sturges, and Laska, 2017; Afulani et al., 2018; Crews et al., 2014;
Bruening, Dinour, and Chavez, 2017; Maynard, Andrade, Packull-McCormick, Perlman, Leos-
Toro, Kirkpatrick, 2018). Specifically, one study found that depression could lead to change in
work status and income which may affect their food security status (Leung et al., 2015).
Therefore, this study investigated food insecurity and health among international students
attending the University of Mississippi. The purposes of this study were to: 1) determine if the
household adult food security status differs between undergraduate and graduate international
students attending the University of Mississippi; 2) establish if a statistically significant
relationship exists between health (physical functioning, role limitations due to physical health,
role limitations due to emotional problems, energy/fatigue, emotional well-being, social
functioning, pain, and general health) and Household Adult Food Security Status; 3) assess if
health differs between international students living in food secure and food insecure households
at the University of Mississippi; and 4) determine if health predicts Household Adult Food
Security Status in international students attending the University of Mississippi. Table 1
summarizes the research questions and null hypotheses.

5
Table 1. Research Questions and Null Hypotheses
Research Question Null Hypothesis
Does household adult food security status
differ between undergraduate and graduate
international students attending the University
of Mississippi?
Household adult food security status does not
differ between undergraduate and graduate
international students attending the University
of Mississippi.
Is there a statistically significant relationship
between health (physical functioning, role
limitations due to physical health, role
limitations due to emotional problems,
energy/fatigue, emotional well-being, social
functioning, pain, and general health) and
household adult food security status?
There is not a statistically significant
relationship between health (physical
functioning, role limitations due to physical
health, role limitations due to emotional
problems, energy/fatigue, emotional well-
being, social functioning, pain, and general
health) and household adult food security
status.
Does health (physical functioning, role
limitations due to physical health, role
limitations due to emotional problems,
energy/fatigue, emotional well-being, social
functioning, pain, and general health) differ
between the University of Mississippi
international students living in food secure
and food insecure households?
Health (physical functioning, role limitations
due to physical health, role limitations due to
emotional problems, energy/fatigue,
emotional well-being, social functioning,
pain, and general health) does not differ
between the University of Mississippi
international students living in food secure
and food insecure households.
Does health (physical functioning, role
limitations due to physical health, role
limitations due to emotional problems,
energy/fatigue, emotional well-being, social
functioning, pain, and general health) predict
household adult food security status in
international students attending the University
of Mississippi?
Health (physical functioning, role limitations
due to physical health, role limitations due to
emotional problems, energy/fatigue,
emotional well-being, social functioning,
pain, and general health) does not predict
Household adult food security status in
international students attending the University
of Mississippi.

6
CHAPTER 2
REVIEW OF LITERATURE
Food Insecurity Prevalence Trends and History
According to the 2017 estimates, 11.8% of U.S. households were found to be food
insecure with 4.5% identified as having very low food security (Coleman-Jensen, Rabbitt,
Gregory, & Singh, 2018). As shown in Figure 5, these percentages have decreased since
2011. However, prior trends in food insecurity prevalence show that in 2001 food insecurity
prevalence rates were at a prevalence of 10.7% and increased until 2004 when the prevalence
was found to be around 12% (Coleman-Jensen, Rabbitt, Gregory, & Singh, 2018). In 2005, food
prevalence rates declined slightly to 11% and remained at this rate until 2008 when the
percentage of food insecurity rose to 14.6%. The food insecurity prevalence rate did not change
until 2011 when it was recorded at 14.9%, the highest in the last two decades. From 2011
forward, rates trended downward to the current food insecurity prevalence percentages
(Coleman-Jensen, Rabbitt, Gregory, & Singh, 2018). On a state level, New Mexico had the
highest average of food insecurity at 17.9%, while Hawaii had the lowest average at 7.4% from
the years of 2015-2017. Mississippi had an average food insecurity rate of 17.2% (Coleman-
Jensen, Rabbitt, Gregory, & Singh, 2018). The 2017 data also found that 8% of households with
adults only were determined to be food insecure (Coleman-Jensen, Rabbitt, Gregory, & Singh,
2018). Balistreri (2016), suggests that households without children have an increasing severity

7
and depth of food security. Additionally, Gregory and Coleman-Jensen (2013) determined that
Supplemental Nutrition Assistance Program (SNAP) participants suffering from food insecurity
that have household incomes of 200% or less of the federal poverty line were affected by food
prices.
Figure 1. Trends in the Prevalence of Food insecurity and Very Low Food Security in U.S.
Households, 2001-2017.Coleman-Jensen, A., Rabbitt, M.P., Gregory, C.A, and Singh, A.
(2018). Household food security in the United States in 2017. Retrieved from
https://www.ers.usda.gov/webdocs/publications/90023/err-256.pdf?v=0
Food Security Measures
Various scales are used as indicators for food security (Pereira & Hodge, 2015). Scales
may have different concentration areas or one specifically, these include “food availability,
access, utilization” and “the stability of food security over time” (Jones, Ngure, Pelto, & Young,
2013, p. 484). Food insecurity scales are classified into two groups. One group of scales are
based on the concept of food consumption adequacy (Cafiero, Melgar- Qui˜nonez, Ballard, &
Kepple, 2014). Food insecurity indicators or scales included in this group are the prevalence of
undernourishment, Food Consumption Score (FCS), and the Household Dietary Diversity Score
(HDDS). The prevalence of undernourishment, a fundamental Food and Agriculture
0
2
4
6
8
10
12
14
16
2001 2002 2003 2004 2005 2006 2007 2008 2009 2010 2011 2012 2013 2014 2015 2016 2017
Foo
d I
nse
curi
ty P
reva
len
ce
Year
Food Insecurity (Including Low and Very Low) Very Low Food Insecurity

8
Organization (FAO) food security measure is presently used an indicator to keep up with
advancement against the Millennium Development Goals (Cafiero, Melgar-Qui˜nonez, Ballard,
& Kepple, 2014; Jones, Ngure, Pelto, G, & Young, 2013; Maxwell, Coates, & Vaitla, 2013). The
Millennium Development Goals include: 1) to eradicate extreme poverty and hunger; 2) to
achieve universal primary education; 3) to promote gender equality and empower women; 4) to
reduce child morality; 5) to improve maternal health; 6) to combat HIV/AIDS, malaria, and other
diseases; 7) to ensure environmental sustainability; and 8) to develop a global partnership for
development (World Health Organization, 2018).
Food Consumption Score is a food frequency scale developed by the World Food
Programme (hunger relief humanitarian organization) that is used to assess food security and
vulnerability (Cafiero, Melgar- Qui˜nonez, Ballard, & Kepple, 2014 & Maxwell, Coates, &
Vaitla, 2013). The Household Dietary Diversity Score is similar to the Food Consumption Score
except for its addition of a 24-hour recall period that lacks in frequency information (Maxwell,
Coates, & Vaitla, 2013). The second group is comprised of experienced-based food security
scales. Scales in this group include the Household Food Security Survey Module (HFSSM),
Household Food Insecurity Access Scale (HFIAS), the Household Hunger Score (HHS), the
Latin America and Caribbean Food Security Scale (ELACSA), and the Food Insecurity
Experience Scale (FIES). The HFSSM is a food security assessment developed by the
United States Department of Agriculture (Appendix B). With this measure, food security
status is categorized into four categories on a continuum. Categories include high food security,
marginal food security, low food security, and very low food security. With high food security, a
household has not had issues obtaining satisfactory qualities and quantities of food. For marginal
food security, households have had some issues obtaining satisfactory qualities and quantities of

9
food, but have ultimately not been considerably affected. Households identifying with low food
security have reduced the quality or quantity of their diets, but eating patterns were not
considerably affected. Very low food security households are defined as having disrupted eating
patterns of multiple members due to deficient resources. Households with high or marginal food
security are classified as food secure, while households with low or very low food security are
classified as food insecure (USDA, 2017).
Another experience-based food security scale, the HFIAS, is a food security assessment
created to understand household behaviors that suggest inadequate food access and related
anxiety; it may be used across cultural contexts (Maxwell, Coates, & Vaitla, 2013, (Coates,
Swindale, & Bilinsky, 2007) (Appendix C). From this assessment, the HHS was created. The
HHS includes three specific questions that are socially set (Maxwell, Coates, & Vaitla, 2013)
(Appendix D). The ELCSA is used in international environments and combine both behavioral
and psychological indicators (Maxwell, Coates, & Vaitla, 2013) (Appendix E). Finally, the FIES
was developed by the Food and Agriculture Organization (Appendix F). The FIES is used as a
part of the Gallup World Poll. This scale is an 8-item questionnaire available in two distinctive
versions, one version for individuals, and the other for households. Responses for this assessment
are yes/no. Data are measured based upon items answered and the probability of food insecurity
for a household or individual above a particular severity level (Food and Agriculture
Organization of the United Nations, 2017). Additionally, food security is being determined via
self-assessment measures. Table 2 summarizes the food security scales.

10
The six-item U.S. Adult Food Security Survey Module was used for this study, since it distinctly
classifies between food security severity and has exceptional predictive validity (Pérez-Escamilla
& Segall-Corrêa, 2008).
Food Insecurity on United States College Campuses
According to Bruening, Argo, Payne-Sturges, & Laska 2017, food insecurity is an issue
particularly at postsecondary institutions. Specific to college students in the United States, an
average food insecurity rate of 32.9% was determined among 9 peer-reviewed studies that
included data from City University of New York in 2011, San Jose University in 2014,
University of Alaska Anchorage in 2013, 10 US community colleges in 2015, Humbodlt State
University in California in 2015 and 2016, Pacific University in 2014, Maryland Community
Colleges in 2013, University of Arkansas in 2016, University of Central Florida 2013, Bowling
Green State University in 2014, Kent State in 2014, California State University in 2013,
University of California San Francisco in 2015, Michigan Technical University in 2015,
Table 2. Food Security Scales
Food Security Scales
based on the Concept of
Food Consumption
Adequacy
▪ Prevalence of Undernourishment
▪ Food Consumption Score (FCS)
▪ Household Dietary Diversity Score (HDDS)
(Cafiero, Melgar- Qui˜nonez, Ballard, & Kepple, 2014;
Jones, Ngure, Pelto, G, & Young, 2013; & Maxwell,
Coates, & Vaitla, 2013) Experienced-based
Food Security Scales
▪ Household Food Security Survey Module (HFSSM)
▪ Household Food Insecurity Access Scale (HFIAS)
▪ Household Hunger Score (HHS)
▪ Latin America and Caribbean Food Security Scale
(ELACSA)
▪ Food Insecurity Experience Scale (FIES)
(Food and Agriculture Organization of the United
Nations, 2017; Maxwell, Coates, & Vaitla, 2013;
USDA, 2017)

11
University of New Hampshire in 2015, California State Polytechnic University in 2012, Fresno
State in California on an unspecified date, Gavilan College in 2013, and Wisconsin Public
Colleges in 2014 (Bruening, Argo, Payne-Sturges, & Laska, 2017). Outcomes for these
nine studies varied greatly. One study found that individuals living alone or being single parents
had higher rates of food insecurity prevalence. This is one of the single largest predictors of food
insecurity, it is not specific to college students. Results also showed that food insecure students
were more likely to report lower grade point average, have an affected ability to attend class and
complete work, or withdraw from university (Bruening, Argo, Payne-Sturges, & Laska, 2017).
Another study by Gaines, Robb, Knol, & Sickler, 2014 revealed that food insecurity was
associated with students receiving financial aid, receiving food assistance, being financially
autonomous, operating without a budget, external distress, and credit card possession.
Individuals were also more likely to report being food insecure if they received a Pell grant
(Bruening, van Woerden, Todd, & Laska, 2018). A study conducted in California reported that
students enrolled in more than thirteen hours were likely to be food insecure; researchers did not
elaborate on the conditions surrounding this finding (Bruening,Argo, Payne-Sturges, & Laska,
2017). Substance use and partner conflict were also found to be associated with food insecurity
(Bruening, Argo, Payne-Sturges, & Laska, 2017). There is also a larger probability to become
food insecure for adults with disabilities (Brucker, 2016). Additionally, a study found that
college freshman had greater occurrences of food insecurity at the end of each semester
(Bruening, Woerden, Todd, & Laska, 2018).
One study assessed rates of food insecurity and its associated characteristics in both
undergraduate and graduate students and found significant differences between these two student
groups (Soldavini, Berner, & Silva, 2019). Soldavini, Berner, & Silva (2019) determined that a

12
greater number of undergraduate students were food insecure rather than food secure and
graduate students were less likely to experience marginal food security or food insecurity. This is
a reasonable finding considering that graduate students have increased chances to benefit from
assistantships and tuition waivers, unlike undergraduate students (Sherry, Thomas, & Chui,
2009). There are a variety of differences noted between to these two student populations.
Specifically, Soldavina, Berner, & Da Silva (2019) identified that food insecurity in
undergraduates was associated with year in school, residency, body mass index (BMI), having a
meal plan, and cooking occurrence. Marital status and perceived cooking skills were associated
with food insecurity in graduate students (Sherry, Thomas, & Chui, 2009). International students
are also at risk for becoming food insecure on college campus’ in the United States (Bruening,
Argo, Payne-Sturges, & Laska, 2017; Soldavini, Berner, & Silva, 2019). Undergraduate
international students had greater odds of experiencing food insecurity (Soldavini, Berner, &
Silva, 2019). While there is limited literature on international students studying in America and
their associations with food insecurity, there are many studies that have investigated the
challenges and acculturation of international students.
The International Student Struggle and Acculturation
International students come from both economically developed and non-developed countries.
These countries are further detailed by the Organization for Economic Co-operation and
Development (OECD), an organization dedicated to global economic development and aims to
create a greater and more ethical world. Countries with current membership to the OECD include
Australia, Austria, Belgium, Canada, Chile, Czech Republic, Denmark, Estonia, Finland, France,
Germany, Greece, Hungary, Iceland, Ireland, Israel, Italy, Japan, Korea, Latvia, Lithuania,
Luxembourg, Mexico, Netherlands, New Zealand, Norway, Poland, Portugal, Slovak Republic,

13
Slovenia, Spain, Sweden, Switzerland, Turkey, United Kingdom, and the United States
(Organization for Economic Co-operation and Development, 2019). When coming to America to
study, both international students from economically developed and non-developed countries
have to overcome a variety of issues.
Barriers for international student acculturation typically fall under academic, social and
cultural themes (Wu, Garza, Guzman, 2014). Specifically, international students have reported
issues with being overwhelmed by academic work, language, skills for class reading, paying
bills, doing laundry, and independent living (Tsevi, 2018). Similarly, Sherry, Thomas, & Chui
(2009) found that language issues, adapting to cultural norms, cultural misunderstanding,
financial problems, and absence of friendships and social isolation were difficulties for
international students. Researchers implied that financial weakness is very apparent in the
international student population (Sherry, Thomas, & Chui, 2009). Acculturative stress, low
resilience, anxiety and depression, and binge drinking have also been noted as issues for
international students (Kim, Maleku, Lemleu, Du, & Chen, 2019, Bai, 2016). Challenges with
family relationships for doctoral students were documented too (Campbell, 2015). With these
issues prominent in this student population, many studies sought to determine how international
students acclimated to their new cultural setting with respect to nutrition.
Regarding issues with acculturation, Lee, Gao, & Kim (2015) claim that inconsistency in
meal time and size as well as lack of eating some meals contribute to unhealthy eating patterns in
an American setting (Lee, Gao, &Kim, 2015). Hartwell, Edward, & Brown (2011) revealed
seven themes regarding social and food acculturation which included purchase influence,
traditional food, social facilitation, eating out, ideal meals, emotions, and personality.
Researchers suggest that internationals could become better acclimated to American food if they

14
participated in culinary groups and food sampling at the beginning of the school term (Hartwell,
Edwards, & Brown, 2011). Amos & Lordly (2014) found that acculturation could be bettered if
new student orientations provided a food and nutrition element that educates international
students on food choices as well as familiar foods and ingredients (Amos & Lordly, 2014). Being
that food education is not always standard education for international students at most
universities, it is important to examine how acculturation occurs. Additionally, Martinez-Ruiz,
Tirelli, Izquierdo-Yusta, & Gómez-Ladrón-De-Guevara (2015) when examining how food
purchasing decisions affected acculturation, found that sustainable production, appearance, and
accessibility were the main factors that affected their purchasing decisions. Indicating that if food
items do not match the standard that the international student is used to having, they may not
purchase sufficient amounts of food. Leong (2013) proposes that a significant cultural
adjustment is made by international students concerning food, especially junk food (Leong,
2013). Wu, Garza, & Guzman (2015) discuss other issues regarding food acculturation and state
that some negative associations with acculturation include: interactions with professors, isolation
from classmates, communication barriers, and pressure of parent’s expectations. One study urged
that American universities provide an experience for international students that is comparable to
that of American students as to effectively attract students (Zhou & Cole, 2017). Hearty (2014)
emphasizes that American Universities have special motivation in caring for internationals.
Specifically, Hearty’s (2014) study implies that international student enrollment at American
universities greatly benefit the U.S. economy. This expression accentuates the importance of
international students in America and the role that both the universities and international students
play on the college campus. Being so, it is vital to assist international students in maintaining
healthy lifestyles and preventing food insecurity.

15
Food Insecurity and Health
The literature reflects the potential impact of food insecurity on individual’s
health, including both physical and mental health (Knol, Robb, McKinley & Wood, 2017;
Pheley, Holben, Graham, & Simpson, 2002). In fact, in one study, individuals were more likely
to report chronic health issues as the severity of their food insecurity increased (Tarasuk,
Mitchell, McLaren, and McIntyre, 2013). Regarding food insecurity and physical health, a
variety of acute and chronic illness have been discovered to have clear associations (Dominick,
Olnyk, Widmar, Ruple, Grennell Weir, & Acharya, 2018). Specifically, these health issues
include cardiovascular disease, hypertension, coronary heart disease, hepatitis, stroke, cancer,
asthma, insulin resistance, diabetes, chronic kidney disease, arthritis, chronic obstructive
pulmonary disease, eating disorders, depression, and anxiety (Dominick, Olynk Widmar, Ruple,
Grennell Weir, & Acharya, 2018; Saiz et al., 2016; Crews et al., 2014; Leung, Tester, & Laraia,
2017; Liu et al., 2014; Gregory & Coleman-Jensen, 2017). In pregnant females, food insecure
individuals had higher prevalence of iron deficiency than those that were food secure (Park &
Eicher-Miller, 2014). Food insecurity was also found to be associated with increased
inflammation via high levels of c-reactive protein. Authors of this study suggested that food
insecurity may use inflammation as a device in which chronic disease occurs (Gowda, Hadley, &
Aiello, 2012). Regarding cardiovascular disease, Saiz et al. (2016) found that the likelihood
of having positive cardiovascular health was less likely for food insecure individuals.
Comparably, another study determined that there were associations between preferred blood
pressure, fasting glucose levels, and total cholesterol levels and household food insecurity
(Leung, Tester, & Laraia, 2017). Seligman et al. (2010), also found that food insecurity was
related to self-reported hypertension and hyperlipidemia and clinically evidenced hypertension

16
and diabetes. The literature also noted that poor metabolic control and cholesterol control for
adults with diabetes is linked to food insecurity (Berkowitz et al., 2013). Per Liu et al. (2014), the
odds of being insulin resistant in adults without diabetes were greater when persons identified as
having marginal, low, and very low food insecurity. Laraia (2013) too found associations
between food insecurity and diabetes as well as poor diabetes management. Gucciardi, Vahabi,
Norris, Del Monte, and Farnum (2014) also found that food insecurity was related to poor
diabetes management. Another study found that there were increased odds of having prediabetes
or diabetes for food insecure young adults ages twenty to thirty-nine (Lee, Scharf, and DeBoer,
2018). Similarly, Montgomery, Lu, Ratliff, and Mezuk (2017) and Holben & Pheley (2006)
determined that food insecurity was associated with individuals suffering from prediabetes or
diabetes; these individuals have increased odds for depression.
Mental health has been shown to be affected by food insecure status. However,
researchers have suggested that the association between food insecurity and mental health is
bidirectional (Bruening, Dinour, Rosales Chavez, 2017). Specifically, Afulani, Coleman-Jensen,
& Herman (2018) determined that greater odds of suffering from a severe mental illness were
correlated with food insecurity. Particularly, depression was associated with food insecurity in
low-income adults and the likelihood of being depressed was the greatest in SNAP participants
with very-low food insecurity and SNAP-eligible nonparticipants (Leung, Epel, Willett, Rimm,
& Laraia 2015). Some mental health issues related to food insecurity included disordered eating,
depression, stress, and anxiety (Darling, Fahrenkamp, Wilson, D’Auria, & Sato, 2017). Leung,
Epel, Willett, Rimm, & Laraia (2015) proposed that depressive feelings, thoughts, and behaviors
are impacted by food insecurity. One study stated that participants with a past food insecure
status had larger quantities of disordered eating, depressive symptoms and stress compared to

17
participants who did not have a past food insecure status (Darling, Fahrenkamp, Wilson,
D’Auria, & Sato, 2017). Similarly, Bruening, van Woerden, Todd, & Laska, 2018, found that
food insecurity was associated with a greater likelihood of stress and depressed mood. Another
study found that food insecure students had a considerably high amount of poor mental health
indicators in comparison to those who identified as food secure (Martinez, Frongillo, Leung, &
Ritchie, 2018). Bruening, Woerden, Todd, and Laska (2018) discovered that the odds of
suffering from high levels of stress and depressive mood were almost two times more likely in
food insecure individuals than food secure persons. It was also found that the odds of not having
enough money to pay for mental health services were associated with food insecurity (Afulani,
Coleman-Jensen, &Herman, 2018). Individuals had greater odds of reporting fair or poorer
mental health when they identified as being food insecure in the past year when compared to
those who identified as food secure in the past year (Brucker 2016).
One study found that individuals were more likely to demonstrate poor health if they
identified as food insecure (Brucker, 2016). Alvarez, Lantz, Sharac, & Shin (2015) reported that
participants identifying as food insecure were seventy percent more likely to categorize their
health status as fair or poor than patients presenting as food secure. Women identified as food
insecure were more likely to report fair or poor health (Alvarez, Lantz, Sharac, & Shin, 2015).
Likewise, another study found that college students who were food insecure were more likely to
report their health status as fair or poor than students with food security (Knol, Robb, McKinley
& Wood, 2017 & Patton-López., López-Cevallos, Cancel-Tirado, & Vazquez, 2014). Similarly,
students were more likely to report fair/poor health when they identified as severely food
insecure (Farahbakhsh, Hanbazaza, Ball, Farmer, Maximova, & Willows, 2017). Additionally, a
self-reported health status of fair or poor was observed in students living off-campus; this was

18
assessed by using a single, valid question (Knol, Robb, McKinley & Wood, 2017). In a study
that evaluated food insecurity and its associations health effects over time, results showed that no
longitudinal associations exist between food insecurity and health behavior or effects (Bruening,
van Woerden, Todd, and Laska, 2018).
Brucker (2016) found individuals that were food insecure or that had been food insecure
for the last year had greater frequencies of emergency room and hospital visits. Food insecurity
has been shown to have associations with increased healthcare costs; particularly in individuals
with illnesses like diabetes, heart disease, and hypertension (Berkowitz, Basu, Meigs, &
Seligman, 2018). Specifically, Berkowitz, Basu, Meigs, & Seligman (2018) found that
approximately $1,800 in greater healthcare costs per year were associated with food insecurity.
Since this cost impacts income, individuals may have to rely upon low-cost, calorically dense
foods and thus perpetuate their food insecurity and poor health state (Decker and Flynn, 2018).
For example, in one quantitative study, participants reported frequently having to choose whether
they would purchase food or their prescriptions (Higashi, Lee, Pezzia, Quirk, Leonard, & Pruitt,
2017). Tarasuk et al. (2015) also found that as the severity of food security status increased, that
health care cost rose. Specifically, researchers found that individuals had significant increased
odds of using health care when they identified as being severely food insecure.
Food insecurity not only affects the health of adults, but according to Holben and Berger
(2017), food insecurity impacts health across the lifespan. For instance, food insecurity has clear
associations with obesity and externalizing and internalizing behavior in children (King, 2018;
Lee, Scharf, & DeBoer, 2017). Health in older adults too has been impacted by food security.
The literature supports that in older adults, food insecurity is associated with mobility limitations

19
and obesity in older women (Bishop & Wang, 2018; Hernandez, Reesor, & Murillo, 2017).
Research in the older adult population is limited (Holben and Berger, 2017).
Health as a Predictor of Food Insecurity
In particular to food insecurity, health has been shown to be a predictor (Garg, Toy,
Tripodis, Cook, & Cordella , 2015; Hagedorn & Olfert, 2018; Hanson & Olson, 2012; Hunt,
Benjamins, Khan, & Hirschtick, 2018; Maynard, Andrade, Packull-McCormick, Perlman, Leos-
Toro, Kirkpatrick, 2018; Pellowski, Barnett, Kuo, Koen, Zar, & Stein, 2017). In a study that
examined females from high-income countries, investigators suggest that an individual may be at
increased vulnerability to food security when lack of steady employment results from a mental
health condition; supporting the claim that health is a predictor for food insecurity (Maynard,
Andrade, Packull-McCormick, Perlman, Leos-Toro, Kirkpatrick, 2018). Another study found
that the lonelier a participant was, the more likely they were to be food insecure (Hunt,
Benjamins, Khan, & Hirschtick, 2018). Hunt, Benjamins, Khan, & Hirschtick (2018) results
suggest that loneliness is a predictor of food insecurity. Specific to pregnant women, depression
and childhood trauma were identified as predictors of perceived household food insecurity
(Pellowski, Barnett, Kuo, Koen, Zar, & Stein, 2017). One study that investigated food insecurity
and behavioral characteristics identified health as a significant predictor for food security in both
undergraduate and graduate students at a rural university in Appalachia (Hagedorn & Olfert,
2018). Particular to low-income rural families, lasting risk for depression and lasting chronic
health conditions were found to be predictors of persistent food insecurity (Hanson & Olson,
2012). Comparably, Garg et al. (2015) determined that among low-income families with young
children, household adult food insecurity is predicted by maternal depression.

20
CHAPTER 3
METHODOLOGY
Study Design
International students at the University of Mississippi were surveyed using a cross-
sectional survey research design. Data were gathered via survey questionnaire administered
using Qualtrics online survey software. This study was conducted in the spring, 2018, and was
approved by the University of Mississippi’s Institutional Review Board (IRB) prior to data
collection. No incentive was provided for completing this survey.
Setting
The setting for this study was at the University of Mississippi. The University of
Mississippi is a rural, public university located in the Southeastern region of the United States.
Campuses for this university include the Oxford, Desoto, Grenada, Boonville, and Tupelo
campuses. The University of Mississippi has an overall student population of 23,780 with
students represented from eighty-six countries (The University of Mississippi, 2017).
Participants
The population for this study was the 950 international students attending the University
of Mississippi. International students for this study were defined as students that are non-native
to America and have come to America to complete work towards a college degree of any type,
participate in the Intensive English Program, or are involved with the exchange, visiting, and
pre-college programs, including both undergraduate and graduate. Requirements for

21
participation was an age of eighteen years and older and classification as an international student
by the University of Mississippi. International students on all campuses were included (Oxford,
Desoto, Grenada, Boonville, and Tupelo). Surveys were sent to 750 randomly-selected
international students via university email. Participants were selected by the Office of
Institutional Research, Effectiveness, and Planning (OIREP). OIREP limits samples to 750 at the
University of Mississippi, which was the rationale for sampling only 750 of the 950 students.
Instrument and Measures
A fifty-eight question survey to assess basic current food insecurity status and health was
administered to international students at the University of Mississippi (Appendix A). The survey
included seven questions to establish basic demographic information, the USDA’s Household
Food Security Survey Module (HFSSM): Six-Item Short Form (Appendix B), and the RAND 36-
Item Health Survey 1.0 Questionnaire Items (Appendix G). Surveys were scored using
standardized scales as shown in Table 3 (United States Department of Agriculture, 2017; Hays,
1994; Duckworth & Quinn, 2009). Appendix B and Appendix G provided scoring for these
measures. Based upon the number of responses, a scale score (Rasch measurement model) was
assigned and food security status was scored. In addition, a food security category was assigned.
The Rand 36-Item Health Survey 1.0 Questionnaire Items was selected for our study since it
captures self-reports of eight health concepts in a generic and coherent manner (Hays, 1994). For
the eight health concepts (physical functioning, role limitations due to physical health, role
limitations due to emotional problems, energy/fatigue, emotional well-being, social functioning,
pain, and general health), a health score was assigned based upon the responses to the
instrument’s question. The median was determined for each health concept (physical functioning
– 95, role limitations due to physical health – 75, role limitations due to emotional problems –

22
33, energy/fatigue – 45, emotional wellbeing- 60, social functioning – 62.5, pain – 80, and
general health – 60). Poor health was considered to be at or below the median, while good health
was above the median. Table 3 and Appendix G summarize the instrument’s scores and
associated procedures. The USDA’s HFSSM: Six item short form was designed with the
intention to assess food security in the United States; however, developers expect this measure to
be appropriate for assessment in other setting with appropriate cultural translations (Bickel,
Nord, Price, Hamilton, & Cook, 2000). The Rand-36 Item Health Survey is available for
translation (Hays, 1994). Studies have also validated RAND-36-Item Health Survey 1.0 for
cross-cultural use when appropriately translated (Zhang, Qu, Lun, & Guo, Liu, 2012; Orwelius et
al., 2018).
Table 3. Variables, Measures/Instruments, and Score/Scale Score Ranges
Variable
Demographic
Measure/Instruments
Questions to assess
age, country of
origin, ethnicity,
gender, relationship
status, number of
children, length of
attendance, and
funding
Score/Scale Score Ranges
Score ranges differ due to varying answers
Food
Security
Status
USDA’s Household
Adult Food Security
Survey Module: Six
Item Short Form
Rasch measurement model: 0 (lowest) -8.48
(highest)a
Health RAND 36-Item
Health Survey 1.0
Questionnaire Items
0 (lowest; less desirable health state) - 100
(highest; more desirable health state)
a Food security status was also determined by raw score.

23
Statistical Analysis
IBM SPSS was used to tabulate data and conduct analyses. Descriptive statistics were
used to summarize demographic qualities of participants. A Pearson Chi-square test was
performed to evaluate the differences in household adult food security status between
undergraduate and graduate international students. To identify significant relationships between
health and household adult food security status, a Pearson correlation coefficient was used. A
two-tail independent samples t-test was used to assess the difference in health status of
international students living in food secure and food insecure households. To determine if health
predicts household adult food security status in international students, ordinal logistic regression
with proportional odds test was conducted. A p-value less than 0.05 was used to identify
statistical significance.
Table 4 summarizes the statistical procedures that were used to analyze each research
question. Initially, the food security status of undergraduate and graduate international students
was assessed. All data were merged since there was no difference by status. When determining
participant health status good health was determined to be above the median while poor health
was at or below the median with scores ranging from zero to one-hundred. All assumptions were
met for statistical procedures performed.

24
Table 4. Primary Research Questions and Statistical Procedures
Research Question Statistical Procedure
Does household adult food security status
differ between undergraduate and graduate
international students attending the University
of Mississippi?
Is there a statistically significant relationship
between health (physical functioning, role
limitations due to physical health, role
limitations due to emotional problems,
energy/fatigue, emotional well-being, social
functioning, pain, and general health) and
household adult food security status?
Does health (physical functioning, role
limitations due to physical health, role
limitations due to emotional problems,
energy/fatigue, emotional well-being, social
functioning, pain, and general health) differ
between the University of Mississippi
international students living in food secure
and food insecure households?
Pearson Chi Square
Pearson’s Correlation Coefficient
Two-Tail Independent Samples T-Test
Does health (physical functioning, role
limitations due to physical health, role
limitations due to emotional problems,
energy/fatigue, emotional well-being, social
functioning, pain, and general health) predict
household adult food security status in
international students attending the University
of Mississippi?
Ordinal Logistic Regression with Proportional
Odds Test

25
CHAPTER 4
RESULTS
Participant Characteristics
Of the 750 randomly-selected participants, responses were received from ninety-four
international students (response rate, 12.5%). Table 5 summarizes participant demographic
characteristics.
Table 5. Participant Demographic Characteristics (n=94)
Gender
Male
Female
n
48
46
%
51.1
48.9
Student Classification
Undergraduate Student
Graduate Student
Funding
Funded
Not Funded
Hourly Classification
Full-Time
Part Time
Length of Attendance
Less than one semester
One Semester
Two Semesters
More than two semesters
44
50
82
12
86
8
9
5
28
52
46.8
53.2
87
12
92
9
10
5
30
55

26
Overall, the majority of participants, as represented by our sample, were male (n=48,
51.1%) and enrolled in graduate education (n=50, 53.2%). The majority received funding (n=82,
87%). Those who received funding included both undergraduate (n=38, 46%) and graduate
(n=44, 54%) international students. Additionally, the majority of participants were full-time
students (n=86, 90%) and reported to have attended the University of Mississippi for more than
two semesters (n=52, 55%). Participants reported the following ethnicities: Asian (n=57), black
(n=5), Hispanic (n=7), white (n=24), or two or more races (n=1). Thirty-five countries were
represented in the sample. Specifically, participants represented the following countries:
Australia (n=1); Bangladesh (n=3); Barbados (n=1); Brazil (n=2); Canada (n=2); China (n=6);
Dominica (n=1); Egypt (n=1); England (n=1); Georgia (n=1); Germany (n=3); Greece (n=1);
India (n=14); Iran (n=3); Japan (n=2); Jordan (n=2); Malaysia (n=1); Mexico (n=2); Nepal
(n=11); New Zealand (n=1); Nigeria (n=2); Norway (n=1); Oman (n=4); Pakistan (n=2); Russia
(n=3); Saudi Arabia (n=1); Singapore (n=1); South Africa (n=1); South Korea (n=4); Sri Lanka
(n=3); Taiwan (n=2); Thailand (n=1); United Kingdom (n=2); Venezuela (n=2); and Vietnam
(n=2). More specifically, most participants were characterized as being from non-OECD member
countries (n=75, 80%). Participants’ household food security status and health status are
described in Tables 6 and 7 respectively.

27
Table 7. Participant Health Status
Eight Health
Concepts Health Score (X SD) Poor Health n (%) Good Health n (%)
Physical Functioning 83 22 58 (62%) 25 (27%)
Role Limitations Due
to Physical
Health
65 39 43 (46%) 37 (39%)
Role Limitations Due
to Emotional
Problems
50 44 40 (43%) 38 (40%)
Energy/Fatigue 47 18 39 (42%) 35 (37%)
Emotional Wellbeing 58 21 38 (40%) 36 (38%)
Social Functioning 65 26 42 (45%) 34 (36%)
Pain 77 23 41 (44%) 35 (37%)
General Health 60 21 43 (46%) 42 (45%)
Table 6. Household Adult Food Security Status of International Students at the University
of Mississippi
Food Security Status Category
High Food Security
Marginal Food Security
Low Food Security
Very Low Food Security
n
27
12
24
31
%
28.7
12.8
25.5
33.0

28
Household Adult Food Security Status by Country of Origin and Student Status
Table 8 summarizes the differences in Household Adult Food Security Status between
undergraduate and graduate students.
Table 8. Differences in Household Adult Food Security Status between Undergraduate and
Graduate Participants a
Food Security Status Undergraduate Student n (%) Graduate Student n (%) P-Value a
Food Secure 16 (17%) 23 (24%) .344
Food Insecure 28 (30%) 27 (29%)
a Chi Square
Household Adult Food Security Status did not differ by student status, so data were merged for
subsequent analyses. However, the small number of food secure, undergraduate students is a
limitation of this analysis. A statistically significant difference in food security status was noted
between students from OECD and non-OECD nations. Table 9 summarizes the differences in
household adult food security status from OECD and non-OECD members.
Correlations with Health and Food Security Status
The relationship of each of the eight health concepts (physical functioning, role
limitations due to physical health, role limitations due to emotional problems, energy/fatigue,
Table 9. Differences in Household Adult Food Security Status between OECD Members and
Non-OECD Members a
Food Security Status OECD Member n (%) Non-OECD Member n (%) P-Value a
Food Secure 12 (13%) 26 (29%) .001
Food Insecure 3 (3%) 49 (54%)
a Chi Square
29
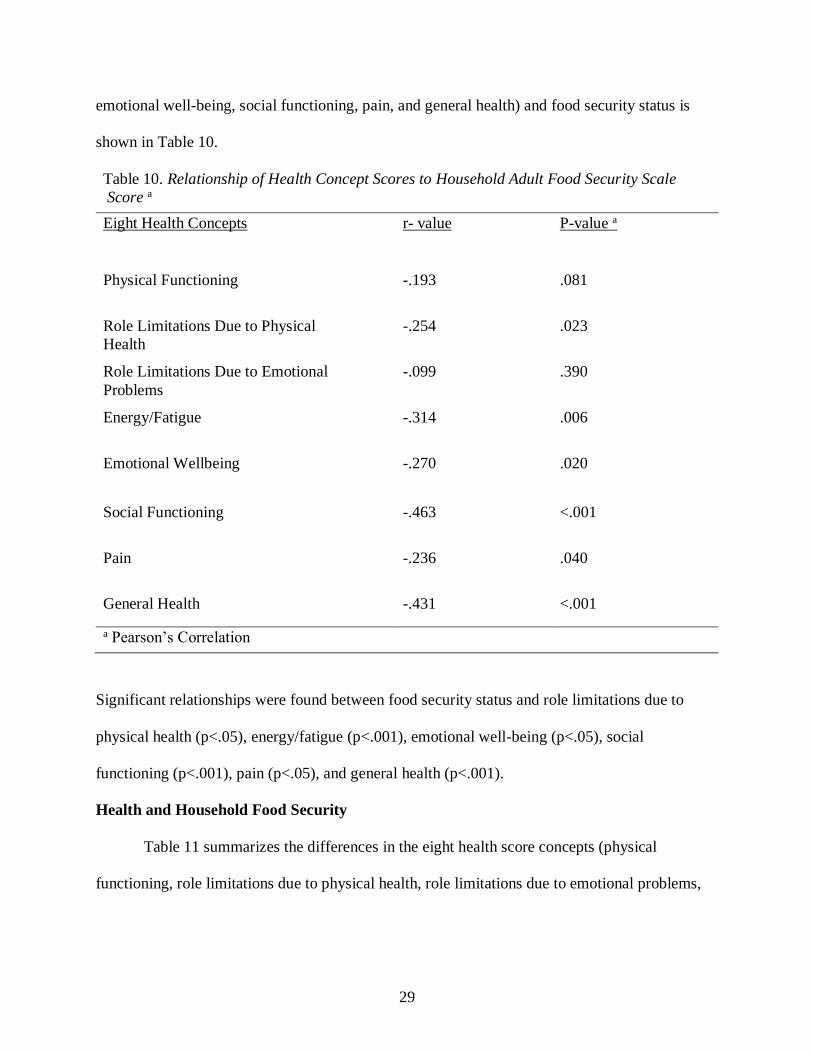
emotional well-being, social functioning, pain, and general health) and food security status is
shown in Table 10.
Table 10. Relationship of Health Concept Scores to Household Adult Food Security Scale
Score a
Eight Health Concepts r- value P-value a
Physical Functioning -.193 .081
Role Limitations Due to Physical
Health
-.254 .023
Role Limitations Due to Emotional
Problems
-.099 .390
Energy/Fatigue -.314 .006
Emotional Wellbeing -.270 .020
Social Functioning -.463 <.001
Pain -.236 .040
General Health -.431 <.001
a Pearson’s Correlation
Significant relationships were found between food security status and role limitations due to
physical health (p<.05), energy/fatigue (p<.001), emotional well-being (p<.05), social
functioning (p<.001), pain (p<.05), and general health (p<.001).
Health and Household Food Security
Table 11 summarizes the differences in the eight health score concepts (physical
functioning, role limitations due to physical health, role limitations due to emotional problems,

30
energy/fatigue, emotional well-being, social functioning, pain, and general health) between food
secure and food insecure international students.
Table 11. Differences in the eight health concept scores between food secure and food
insecure international students a
Eight Health Concepts Food Secure Score
(X SD)
Food Insecure Score
(X SD)
P-value a
Physical Functioning 87 22 80 22 .135
Role Limitations Due to
Physical Health
75 36 57 39 .043
Role Limitations Due to Emotional
Problems
51 46 50 42 .852
Energy/Fatigue 51 17 43 17 .066
Emotional Wellbeing 63 21 54 20 .087
Social Functioning 77 25 57 24 .001
Pain 81 15 73 27 .092
General Health 70 17 54 21 .001
a t test
The two-tail independent samples t-test indicated that there were differences in role limitations
due to physical health (p=.043), social functioning (p<.001), and general health (p<.001)
between international students living in food secure and food insecure households. Health scores
in these areas were higher in with food secure international students. Basically, as health scores
decreased, food security worsened. No other health scores differed significantly between groups.
Health Concepts and Food Security Status
The cumulative odds ordinal logistic regression with proportional odds test was utilized
to determine if health (physical functioning, role limitations due to physical health, role

31
limitations due to emotional problems, energy/fatigue, emotional well-being, social functioning,
pain, and general health) predicted household adult food security status among the sample
participants. Prior to analysis, the assumption of multicollinearity and proportional odds were
evaluated. There were proportional odds, as assessed by a full likelihood ratio test, comparing
the fitted model to a model with varying location parameters, [χ2(16) = 6.87, p = .976]. The
assumption of multicollinearity was met [VIF<10]. The deviance goodness-of-fit test indicated
that the model was a good fit to the observed data [χ2(211) = 161.12, p = .996], but most cells
were sparse with zero frequencies in 75.0% of the cells, due to continuous nature of predictor
variable. However, the final model statistically significantly predicted the dependent variable
over and above the intercept-only model [χ2(8) = 31.10, p < .001]. This model explains 37.1% of
total variance as depicted by Nagelkerke pseudo R-square. Overall, this model is a good fit (i.e.,
the collected data is powerful enough to run cumulative odds ordinal logistic regression with
proportional odds. Since all assumptions were not violated, analysis was conducted. Table 12.
summarizes the odds of a participant living in a food secure household.

32
Social functioning had an odds ratio of .95 and general health had an odds ratio of .96.
As such, there were decreased odds of living in a food insecure household for individuals with
good social functioning and general health. Essentially, the better the participant’s social
functioning and general health, the less likely they are to live in food insecure households.
Table 12. Eight Health Concepts and Prediction of Food Security Status a
95% Wald Confidence
Interval
Eight Health Concepts Odds Ratio P-value
Chi Square (χ2) Lower Upper
Physical Functioning 1.01 .647 .21 .979 1.035
Role Limitations Due
to Physical
Health
.99 .065 3.40 .973 1.001
Role Limitations Due
to Emotional Problems
1.01 .134 2.25 .996 1.027
Energy/Fatigue .98 .311 1.027 .945 1.018
Emotional Wellbeing 1.03 .135 2.24 .990 1.081
Social Functioning .95 .002 9.85 .924 .982
Pain 1.01 .448 .58 .985 1.034
General Health .96 .017 5.70 .936 .993
a Ordinal Logistic Regression with Proportional Odds Test

33
CHAPTER 5
DISCUSSION
Food Insecurity and International Student Status
Results showed that food security status did not differ between undergraduate and
graduate students, supporting the null hypothesis. However, the previously noted inadequate cell
sizes of the groups limits this finding. Other studies examined food insecurity in international
college students, differences in student type were not examined (Watson, Malan, Glik, &
Martinez, 2017; Henry, 2017). Only one study found a significant difference between
undergraduate and graduate students, with undergraduates suffer greater food insecurity than the
graduate students (Soldavini, Berner, & Silva, 2019). With limited research in these student
populations, this is certainly an avenue for future research.
Food Insecurity and Health of International Students
Significant associations present between role limitations due to physical health,
energy/fatigue, emotional well-being, social functioning, pain, and general health food security
status were found in this study. Our findings contribute to the current literature by supporting this
significant association as detailed below. Other studies show that statistically significant
relationships were also found with food security and hypertension, coronary heart disease,
hepatitis, stroke, cancer, asthma, arthritis, chronic obstructive pulmonary disease, depressive
symptoms in individuals with diabetes or prediabetes, severe mental illness, and fair and poor
self-rated health, greater odds of developing CKD, weight status, insulin resistance, diabetes, and

34
poor diabetes control and management (Leung, Tester, & Laraia, 2017; Montgomery, Lu, Ratliff
Knol, Robb, McKinley, & Wood, 2017; Bruening, Dinour, Rosales, Chavez, 2017; Crew et al.
2014, Laraia, 2013; Gregory and Coleman-Jensen, 2017; Seligman et al. 2010; Berkowitz et al.,
2013). Holben and Pheley (2006) also found significant connections between food insecure
households and greater Body Mass Index (BMI), rates of obesity, and self-reported diabetes.
Another study found associations between food insecurity and lower occurrence of preferred
cardiovascular health (Saiz et al., 2016). One study found statistically significant associations
between c-reactive protein and food insecurity (Gowda, Hadley, & Aiello, 2012). Indicating a
relationship between food insecurity and inflammation since c-reactive protein is an
inflammatory marker (Gowda, Hadley, & Aiello, 2012).
The assessment of whether health differed between international students living in food
secure and food insecure households at the University of Mississippi revealed that there
were only statistically significant differences in role limitations due to physical health, social
functioning and general health. Similarly, one study sought to determine the differences in health
condition quantities among participants (Dominick, Wilder, Ruple, Weir, & Acharya, 2018).
Specifically, Dominick, Wilder, Ruple, Weir, & Acharya (2018) found that participants from the
midwest United States that specified having diabetes or that live in a household with someone
with a diabetes, Crohn’s disease, an eating disorder or lived in a household with someone with an
eating disorder, depression or anxiety, high blood pressure, or high cholesterol had greater
differences in amounts of food insecurity. Investigators suggest that chronic illness may impact
food insecurity and that the nature of the illness may be significant in deteriming chronic health’s
impact on food security (Dominick, Wilder, Ruple, Weir, & Acharya, 2018). Afulani,
Coleman-Jensen, & Herman (2018) established that there were noted differences in severe

35
mental illness compared between participants identifying from each level of food security. In
one study, depression differed significantly between food insecure and food secure individuals
receiving SNAP benefits (Leung, Epel, Willett, Rimm & Laraia, 2015). One study reported
significant differences in self-assessed health between participants with marginal and low,
marginal and very low, and low and very low food security (Gregory & Coleman-Jensen, 2017).
Contrary, Holben and Pheley (2006) found no differences in diastolic blood pressure, blood
glucose, HbA1C, hemoglobin and total cholesterol between food secure and food insecure
individuals. Only differences in BMI and obesity were noted between the food insecure and food
secure groups in this study (Holben and Pheley, 2006). A lack of significant differences were
also found between food secure and food insecure individuals receiving food assistance
(Alvarez, Lantz, Sharac, and Shin, 2015). With the present study’s findings in mind, it is
pertinent that the universities create policies for both physical and mental health evaluation for
those students identifying as food insecure.
When determining if health predicted household adult food security status in
international students attending the University of Mississippi, results showed that individuals
with positive social functioning and general health had decreased odds of living in a food
insecure household. The data showed a participant’s social functioning and general health
significantly predicted food insecurity in participants. Per Bosc (2000), social functioning is
termed as a person’s connections with and role inside their external environment specific to
social activities including work as well as relationships with family and friends. In a study that
investigated low-income individuals with type 2 diabetes, it was found that increased social
support protected against mental health issues in food insecure individuals (Kollannoor-Samuel
et al., 2011). This finding considered, it is sensible to assume that activities to support

36
acculturation may be a vehicle for reducing food insecurity in international students.
Various studies discuss access to familiar or healthy foods for the international student
population. Specifically, Brown, Edwards, & Hartwell (2009) state that food from a student’s
country of origin could be comforting to the student and may ease feelings of anxiety and
isolation (Brown, Edwards, & Hartwell, 2009). Being so, access to home country food may be a
vital factor in assisting international students in proper nourishment. Garden-Robinson, Eighmy,
& Lyonga (2010) examined new and unfamiliar foods in the U.S and identified that fast-foods,
ready-to-eat foods, processed food, and frozen foods as well as food safety practices were
unfamiliar to international students. Researchers suggested that educational programs regarding
food safety may increase food security. International student’s acculturation to both American
culture and food is vital to success as a student in America. Ruetzler, Taylor, & Hertzman
(2012), suggest that interaction and socialization provided by the on-campus dining experience
may be an important step of the adaption process for international students. It can be inferred
from Ruetzler, Taylor, & Hertzman (2012), that food insecurity risk could be decreased if
international students were presented with a more positive dining experience on the college
campus. Additionally, researchers concluded that acculturation could be enhanced if universities
would develop programs that enabled international students to feel engaged socially, culturally,
and academically (Wu, Garza, & Guzman, 2015).
One study found that students who participated in the international student center’s events
and excursions had greater sense of belonging towards their university (Guvendir, 2018).
International students can also master their new environment by increasing their social support
through relationships with family, friends, a significant other, or ethnic/cultural groups
(Aldawsari, Adams, Grimes, & Kohn, 2018). Tsevi (2018) supports this in finding that

37
international students were able to persist in their studies despite challenges when they worked
hard academically, had socialization with family and friends, were involved in extracurricular
activities, and student out-of-classroom activities. It is also suggested that the development of
programs to aid social and academic development aid in this persistence. (Tservi, 2018). In fact,
one study found that international students had increased social support and belonging when they
completed a semester-long academic and cultural transition course which focused on
intercultural competence; suggesting that enrollment in this course enhances intercultural skills
(Brunsting, Smith, & Zachry, 2018). For those suffering with issues of mental health, culturally
sensitive mental health services should be provided by universities (Kim, Maleku, Lemleu, Du,
& Chen, 2019; Bai, 2016). In a study that examined the top twenty universities, it was found that
events such as International Education Week (IEW), global festivals, world fairs, heritage and
cultural celebrations, meet-and-greet receptions, sightseeing trips, coffee hours, global sibling
and student mentor programs promote diverse, social engagement for international students
(Martirosyan, Bustamante, & Saxon, 2019). The literature suggests that family relationships
upon doctoral students may be improved if universities offered family programs and housing
(Campbell, 2015). Bai (2016) suggest that international students can have lower stress levels and
more positive acculturative experience when adequately supported by their school. Financial
issues for undergraduate international students might be improved if universities provided more
tuition assistance and scholarships. An orientation that covers U.S. culture, as well as American
academic culture, could be beneficial to international students (Wu, Garza, & Guzman, 2014).
Our findings are further supported by many studies that found mental and physical health
to be predictors of food insecurity Garg, Toy, Tripodis, Cook, & Cordella , 2015; Hagedorn &
Olfert, 2018; Hanson & Olson, 2012; Hunt, Benjamins, Khan, & Hirschtick, 2018; Maynard,

38
Andrade, Packull- McCormick, Perlman, Leos-Toro, Kirkpatrick, 2018; Pellowski, Barnett, Kuo,
Koen, Zar, & Stein, 2017; Tarasuk, Mitchell, McLaren, and McIntyre, 2013). Other studies
found that maternal depression, loneliness, mental health conditions, behavioral characteristics,
health, and chronic health conditions were found to predict food insecurity (Garg, Toy, Tripodis,
Cook, & Cordella , 2015; Hagedorn & Olfert, 2018; Hanson & Olson, 2012; Hunt, Benjamins,
Khan, & Hirschtick, 2018; Maynard, Andrade, Packull-McCormick, Perlman, Leos-Toro,
Kirkpatrick, 2018; Pellowski, Barnett, Kuo, Koen, Zar, & Stein, 2017). Food insecurity
has also been found to predict nutritional outcomes (Bhattacharya, Currie, & Haider, 2004).
Another study found that health scores could be predicted by diseases like diabetes, eating
disorders, and depression, and anxiety (Dominick, Wilder, Ruple, Weir, Acharya, 2018).
Gregory & Coleman-Jensen (2017) determined that food security status is strongly predictive of
chronic illness. Food insecurity status was also shown to predict health care utilization and costs
(Tarasuk et al., 2015). Bruening, Woerden, Todd, & Laska (2018) discovered that food
insecurity did not predict health behaviors or outcomes. Our findings will further support the
claim that health predicts food insecurity presented by the aforementioned studies.
Limitations
This study had limitations. One limitation was that the survey questionnaire was only
offered to participants in English. English comprehension may have ranged in participants. Even
so, students must demonstrate proficiency in English with a required internet based TOEFL score
of 79 which minimizes this limitation (The University of Mississippi, 2018). Additionally, using
the six-item USDA food security measure may not have completely measured the most severe
range of adult food insecurity. The 18-item USDA food security measure may more
appropriately capture the most severe range in adult food insecurity. Even so, the six-item is

39
deemed appropriate by developers and reduces response burden (United States Department of
Agriculture, 2017). Another consideration is that the HFIAS would have been a more appropriate
tool to use for the assessment of food security since it is approved for use across cultural contexts
(Coates, Swindale, & Bilinsky, 2007). The lack of incentives was also a limitation for this study.
Considering that the survey was fifty-eight questions long, it is reasonable to assume that
response burden may have played a role in our low response rate (12.5%) and if incentives were
used, perhaps response rates might have been higher. Also, the small number of food secure
students in the analysis of differences of in Household Adult Food Security Status between
undergraduate and graduate students pose as a significant limitation. Being so, it is important to
consider that the overall sample size (n=94) was low. It is possible that a significant difference
might emerge from a larger sample.
Conclusion
International students at the University of Mississippi experience food insecurity. Being
so, international students have the potential to suffer from poor health. Better social functioning
and better general health promotes food security among international students. Future research
should investigate measures taken to prevent and resolve food insecurity as well as to determine
specific factors that contribute to the food insecure status of international students. Additionally,
since no other studies have exclusively studied food insecurity in international students, more
research should be conducted in this area. International college students’ food security status
might be improved if school policies regarding international students were created to ensure that
students are evaluated periodically to determine their food security status. These policies might
also safeguard international student food security by making sure that student food banks are
well-advertised and available for international student access. At present, the university has no

40
such policies in existence for the international student population. It might also benefit
universities to explore other interventions such as monthly or weekly events for international
students that provide a free meal or classes on budgeting that promote more efficient grocery
shopping practices. This is supported by Farahbakhsh et al.’s (2017) determination that
government-based and university-based programs and policies are needed to improve food
insecurity in college students. Since international students promote economic growth in the
United States, it is essential that universities take an interest in their nutritional well-being and
overall health. Hopefully, our findings will encourage future research to be conducted and
further illuminate this issue and direct how to best amend food insecurity among international
students studying in the United States on university campuses.

41
REFERENCES

42
REFERENCES
Afulani, P.A., Coleman-Jensen, A., Herman, D. (2018). Food insecurity, mental health, and the
use of mental health services among nonelderly adults in the united states. Journal of
Hunger & Environmental Nutrition. 1-22. doi.org/10.1080/19320248.2018.1537868
Accessed on March 2, 2019.
Aldawsari, N.F., Adams, K.S., Grimes, L.E., and Kohn, S. (2018). The effects of cross-cultural
competence and social support on international students’ psychological adjustment:
autonomy and environmental mastery. Journal of International Students. 8(2), 901-924.
doi: 10.5281/zenodo.1250391 Accessed on April 1, 2019.
Alvarez, C, Lantz, P. Sharac, J., & Shin, P. (2015). Food insecurity, food assistance, and health
status in the U.S. community health center population. Journal of Health Care for the
Poor and Undeserved. 26(1), 82-91.doi https://doi.org/10.1353/ hpu.2015.0006 Accessed
on December 1, 2017.
Amos, S., & Lordly, D. (2014). Picture this: A photovoice study of international students' food
experience in Canada. Canadian Journal of Dietetic Practice and Research : A
Publication of Dietitians of Canada = Revue Canadienne De La Pratique Et De La
Recherche En dietetique : Une Publication Des Dietetistes Du Canada, 75(2), 59-63.
doi:10.3148/75.2.2014.59 Accessed on January 31, 2018.
Balistreri, K. S. (2016). A decade of change: measuring the extent, depth and severity of food
insecurity. Journal of Family and Economic Issues, 37(3), 373-382. doi:10.1007/s10834-
016-9500-9 Accessed on January 9, 2018.

43
Berkowitz, S.A., Baggett, T.P., Wexler, D.J., Huskey, K.W., and Wee, C.C. (2013). Food
insecurity and metabolic control among U.S. adults with diabetes. Diabetes Care. 36,
3093-3099. doi: 10.2337/dc13-0570. Accessed on March 2, 2019.
Berkowitz, S.A., Basu, S., Meigs, J.B., & Seligman, H.K. (2018). Food insecurity and health
care expenditures in the United States 2011-2013. Health Services Research, 53(3) 1600
– 1620. doi: 10.1111/1475-6773.12730 Accessed on November 25, 2018.
Bickel, G., Nord, M, Price, C., Hamilton, W., & Cook, J. (2000). Guide to measuring household
food security. U.S. Department of Agriculture, Food and Nutrition Services. Accessed on
April 4, 2019.
Bishop, N.J. & Wang, K. (2018). Food insecurity, comorbidity, and mobility limitations among
older U.S. adults: findings from the health and retirement study and health care and
nutrition study. Preventive Medicine. 114(2018), 180-187.
doi.org/10.1016/j.ypmed.2018.07.001 Accessed on December 2, 2018.
Bhattacharya, J., Currie, J., and Haider, S. (2004). Poverty, food insecurity, and nutritional
outcomes in children and adults. Journal of Health Economics. 23, 839-862.
doi:10.1016/j.jhealeco.2003.12.008. Accessed on March 2, 2019.
Bosc, M. (2000). Assessment of social functioning in depression. Comprehensive
Psychiatry, 41(1), 63. Accessed on April 2, 2019.
Brown, L., Edwards, J., & Hartwell, H. (2009). A taste of the unfamiliar. Understanding the
meanings attached to food by international postgraduate students in England. Appetite, 54
(1) 202–207. doi:10.1016/j.appet.2009.11.001 Accessed on January 31, 2018.

44
Brucker, D. L. (2016). The association of food insecurity with health outcomes for adults with
disabilities. Disability and Health Journal. 10(2017) 296 – 293.
doi.org/10.1016/j.dhjo.2016.12.006. Accessed on November 29, 2018.
Bruening, M., Brennhofer, S., van Woerden, I., Todd, M., & Laska, M. (2016). Factors related to
the high rates of food insecurity among diverse, urban college freshmen. Journal of the
Academy of Nutrition and Dietetics, 116(9), 1450-1457. doi:10.1016/j.jand.2016.04.004
Accessed on November 8, 2017.
Bruening M, Argo K, Payne-Sturges D, Laska M.N. (2017). The struggle is real: a systematic
review of food insecurity on postsecondary education campuses. Journal of the Academy
of Nutrition and Dietetics. 117:11, 1767-1791. doi.org/10.1016/j.jand.2017.05.022.
Accessed on March 2, 2019.
Bruening, M., Dinour, L.M., Rosales Chavez, J.B. (2017). Food insecurity and emotional health
in the USA: a systematic narrative review of longitudinal research. Public Health
Nutrition. 20(17), 3200-3208. doi:10.1017/S1368980017002221 Accessed on December
2, 2018.
Bruening, M., van Woerden, I., Todd, M., Laska, M.N. (2018). Hungry to learn: the prevalence
and effects of food insecurity on health behaviors and outcomes over time among a
diverse sample of university freshman. International Journal of Behavioral Nutrition and
Physical Activity. 15(9), 1-10. doi: 10.1186/s12966-018-0647-7. Accessed on October 31,
2018.

45
Brunsting, N.C, Smith, A.C. &, Zachry, C. (2018). An academic and cultural transition course
for international students: efficacy and socioemotional outcomes. Journal of
International Students. 8(4), 1497-1521. doi: 10.5281/zenodo.1467805 Accessed on
April 1, 2018.
Cafiero, C., Melgar- Qui˜nonez, H.R., Ballard, T.J., & Kepple, A.W. (2014). Validity and
reliability of food security measures. Annals of the New York Academy of Sciences.
1331(2014), 230-248. doi: 10.1111/nyas.12594 Accessed on November 8, 2017.
Campbell, T. A. (2015). A phenomenological study on international doctoral students'
acculturation experiences at a U.S. university. Journal of International Students, 5(3),
285-299. Accessed on March 31, 2019.
Coates, J., Swindale, A., & Bilinsky, P. (2007). Household food insecurity access scale (HFIAS)
for measurement of food access: indicator guide, version 3. Food and Nutrition Technical
Assistance. Retrieved from
https://www.fantaproject.org/sites/default/files/resources/HFIAS_ENG_v3_Aug07.pdf
Accessed on April 5, 2019.
Coleman-Jensen, A., Rabbitt, M.P., Gregory, C.A, and Singh, A. (2018). Household food
security in the United States in 2017. Retrieved from
https://www.ers.usda.gov/webdocs/publications/90023/err-256.pdf?v=0 Accessed on
September 23, 2018.
Columbia University. (2018). Columbia Undergraduate Admissions. Retrieved from
https://undergrad.admissions.columbia.edu/apply/intl_fa. Accessed on October 29, 2018.

46
Crews, D. C., Kuczmarski, M. F., Grubbs, V., Hedgeman, E., Shahinian, V. B., Evans, M. K., . .
. Centers for Disease Control and Prevention Chronic Kidney Disease Surveillance Team.
(2014). Effect of food insecurity on chronic kidney disease in lower-income americans.
American Journal of Nephrology, 39(1), 27. Accessed on March 2, 2019.
Darling. K.E., Fahrenkamp, A.J., Wilson, S.M., D’Auria, A.L., & Sato, A.F. (2017). Physical
and mental health outcomes associated with prior food insecurity among young adults.
Journal of Health Psychology. 22(5), 572-581. doi: 10.1177/1359105315609087.
Accessed on November 8, 2017.
Decker, D. and Flynn, M. (2018). Food insecurity and chronic disease: addressing food access as
a healthcare issue. Rhode Island Medical Journal. (2013), 101(4), 28. Accessed on
November 29, 2018.
Dominick, S.R., Olynk Widmar, N.J., Ruple, A., Grennell Weir, J.Z., Acharya, L. (2018). The
intersection of food insecure populations in the Midwest U.S. and rates of chronic health
conditions. Agriculture & Food Security. 7(43), 1-18. doi.org/10.1186/s40066-018-0195-
z. Accessed on November 29, 2018.
Duckworth, A.L, & Quinn, P.D. (2009). Development and validation of the Short Grit Scale
(Grit-S). Journal of Personality Assessment, 91, 166-174. Accessed on January 9, 2018.
Farahbakhsh, J., Hanbazaza, M., Ball, G.D.C., Farmer, A.P., Maximova, K., & Willows, N.D.
(2017). Food insecure student clients of a university-based food bank have compromised
health, dietary intake and academic quality. Nutrition and Dietetics. 74; 67-73.
doi:10.1111/1747-0080.12307 Accessed on April 5, 2019.

47
Food and Agriculture Organization of the United Nations. The food insecurity experience scale:
measuring food insecurity through people’s experiences. (2014). Retrieved from
http://www.fao.org/3/a-i7835e.pdf Accessed on January 9, 2018.
Gaines, A., Robb, C. A., Knol, L. L., & Sickler, S. (2014). Examining the role of financial
factors, resources and skills in predicting food security status among college students.
International Journal of Consumer Studies, 38(4), 374-384. doi:10.1111/ijcs.1211
Accessed on November 7, 2018.
Gallegos, D., Ramsey, R., & Ong, K. W. (2014). Food insecurity: Is it an issue among tertiary
students? Higher Education, 67(5), 497-510. doi:10.1007/s10734-013-9656-2 Accessed
on November 7, 2017.
Garden-Robinson, J. Eighmy, M.A., & Lyonga, A. N. (2010). Use of electric group method in
assessing food safety training needs and delivery methods among international college
students in the U.S. Appetite, 55(3), 746- 749. doi: 10.1016/j.appet.2010.10.007 Accessed
on January 31, 2018.
Garg, A., Toy, S., Tripodis, Y., Cook, J., Cordella, N. (2015). Influence of maternal depression
on household food insecurity for low-income families. Academic Pediatrics. 15(3); 305-
310. Accessed on April 1, 2019.
Gowda, C., Hadley, C., Aiello, A.E. (2012). The association between food insecurity and
inflammation in the US adult population. American Journal of Public Health. 102:8,
1579-1586. doi:10.2105/AJPH.2011.300551. Accessed on March 2, 2019.
Gregory, C.A. and Coleman-Jensen, A. (2013). Do high food prices increase food insecurity in
the United States. Applied Economics Perspectives and Policies, 35(4), 679–707.
doi:10.1093/aepp/ppt024 Accessed on January 9, 2018.

48
Gregory, C.A. and Coleman-Jensen, A. (2017). Food insecurity, chronic disease, and health
among working-age adults. USDA, Economic Research Service. Accessed March 2,
2019.
Gucciardi, E., Vahabi, M., Norris, N., Del Monte, J.P., and Farnum, C. (2014). The intersection
between food insecurity and diabetes: a review. Current Nutrition Report. 3, 324-332. doi
10.1007/s13668-014-0104-4. Accessed on March 2, 2019.
Guvendir, M.A. The relation of an international student center’s orientation training sessions
with international students’ achievement and integration to university. Journal of
International Students. 8(2). 843-860. doi: 10.5281/zenodo.1250385 Accessed on April 1,
2019.
Hagedorn, R. L., Olfert, M. D., Rebecca Hagedorn, & Melissa Olfert. (2018). Food insecurity
and behavioral characteristics for academic success in young adults attending an
appalachian university. Nutrients, 10(3), 361. doi:10.3390/nu10030361 Accessed on
April 2, 2019.
Hanson, K. L., & Olson, C. M. (2012). Chronic health conditions and depressive symptoms
strongly predict persistent food insecurity among rural low-income families. Journal of
Health Care for the Poor and Underserved, 23(3), 1174-1188.
doi:10.1353/hpu.2012.0116
Hartwell, H.J., Edwards, J.S.A., & Brown, L. (2011). Acculturation and food habits: Lessons to
be learned. British Food Journal, 113(11), 1393-1405. doi:10.1108/00070701111180003
Accessed on January 31, 2017.

49
Hays, R.D. (1994). The Medical Outcomes Study (MOS) Measures of Quality of Life. Retrieved
from the RAND Corporation web site:
https://www.rand.org/health/surveys_tools/mos/36-item-short-form/survey-
instrument.html Accessed on February 25, 2018.
Hearty, N. (2014). Where we are now -the presence and importance of international students to
universities in the United States. Journal of International Students, 4(3), 223 Accessed on
January 31, 2018.
Henry, L. (2017). Understanding food insecurity among college students: experience,
motivation, and local solutions. Annals of Anthropological Practice, 41(1), 6-19.
doi:10.1111/napa.12108 Accessed on August 16, 2017.
Hernandez, D.C., Reesor, L. & Murillo, R. (2017). Gender disparities in the food insecurity-
overweight and food insecurity-obesity paradox among low-income older adults. Journal
of the Academy of Nutrition and Dietetics. 7(117), 1087-1096.
doi.org/10.1016/j.jand.2017.01.014 Accessed on December 2, 2018.
Higashi, R.T., Lee, S.C., Pezzia, C., Quirk, L., Leonard, T., & Pruitt, S.L. (2017). Family and
social context contributes to the interplay of economic insecurity, food insecurity, and
health. Annals of Anthropological Practice. 41(2), 67-77. doi: 10.1111/napa.12114
Accessed on November 29, 2018.
Holben, D., and Berger, M. (2017). Position of the academy of nutrition and dietetics: food
insecurity in the United States. Journal of the Academy of Nutrition and
Dietetics, 117:1991-2002. doi.org/10.1016/j.jand.2017.09.027 Accessed on January 10,
2018.

50
Holben, D.H. and Pheley, A.M. (2006) Diabetes risk and obesity in food-insecure households in
rural Appalachian Ohio. Preventing Chronic Disease. 3(3), 1-9. Accessed on December
31, 2018.
Hunt, B. R., Benjamins, M. R., Khan, S., & Hirschtick, J. L. (2019). Predictors of food insecurity
in selected chicago community areas. Journal of Nutrition Education and Behavior,
51(3), 287-299. doi:10.1016/j.jneb.2018.08.005
Jones, A.D., Ngure, F.M., Pelto, G., & Young, S.L. (2013). What are we assessing when we
measure food security? A compendium and review of current metrics. American Society
for Nutrition. 4, 481-505. doi: 10.3945/an.113.004119 Accessed on November 8, 2017.
Kim, Y.K., Maleku, A., Lemieu, C., Du, X., & Chen, Z. (2019). Behavoiral risk and resilience
among international students in the united states: a study of sociodemographic
differences. Journal of International Students. 9(1), 282-305.
doi:10.32674/jis.v9i1.264ojed.org/jis Accessed on April 1, 2019.
King, C. (2018). Food insecurity and child behavior problems in fragile families. Economics and
Human Biology. 28(2018), 14-22. doi.org/10.1016/j.ehb.2017.11.002 Accessed on
December 2, 2018.
Kollannoor-Samuel, G., Wagner, J., Damio, G., Segura-Pérez, S., Chhabra, J., Vega-López, S.,
& Pérez-Escamilla, R. (2011). Social support modifies the association between household
food insecurity and depression among latinos with uncontrolled type 2 diabetes. Journal
of Immigrant and Minority Health, 13(6), 982-989. doi:10.1007/s10903-011-9499-9

51
Knol, L. L., Robb, C. A., McKinley, E. M., & Wood, M. (2017). Food insecurity, self-rated
health, and obesity among college students. American Journal of Health
Education, 48(4), 248. doi:10.1080/19325037.2017.1316689 Accessed on December 1,
2017.
Laraia, B.A. (2013). Food insecurity and chronic disease. American Society for Nutrition. 4: 203
– 212. doi:10.3945/an.112.003277. Accessed on March 2, 2019.
Lee, J., Gao, R., & Kim, J. (2015). Acculturation and changes in dietary behavior and
Anthropometric measures among Chinese international students in South Korea.
Nutrition Research and Practice, 9(3), 304-312. doi:10.4162/nrp.2015.9.3.304 Accessed
on January 31, 2017.
Lee, A. M., Scharf, R. J., & DeBoer, M. D. (2018). Association between kindergarten and first-
grade food insecurity and weight status in U.S. children. Nutrition, 51-52, 1-5.
doi:10.1016/j.nut.2017.12.008 Accessed on December 2, 2018.
Lee, A.M., Scharf, R.J., and DeBoer, M.D. (2018). Food insecurity is associated with prediabetes
and dietary differences in U.S. adults aged 20-39. Preventive Medicine. 116(2018), 180-
185. doi.org/10.1016/j.ypmed.2018.09.012 Accessed on November 29, 2018.
Leong, P. (2013). Coming to America: Assessing the Patterns of Acculturation, Friendship
Formation, and the Academic Experiences of International Students at a U.S. College.
Journal of International Students, 5(4) 459-474. Retrieved from http://jistudents.org/
Accessed on January 31, 2018.

52
Leung, C.W., Epel, E.S., Willett, W.C., Rimm, E.B., & Laraia, B.A. (2015). Household food
insecurity is positively associated with depression among low-income supplemental
nutrition assistance program participants and income-eligible nonparticipants. The
Journal of Nutrition. 145, 622-627. doi:10.3945/jn.114.199414 Accessed on December 2,
2018.
Leung, C., Tester, J., & Laraia, B. (2017). Household food insecurity and ideal cardiovascular
health factors in U.S. adults. JAMA Internal Medicine. 117(5), 730.
doi:10.1001/jamainternmed.2017.0239 Accessed on November 21, 2018.
Lin, M., Johnson, R. J., Meshack, A., Peters, R. J., Jr, Hill, M., & Ford, K. (2013). The
relationship between perceived psychological distress, behavioral indicators and african-
american female college student food insecurity. American Journal of Health
Studies, 28(3), 127. Accessed on November 8, 2017.
Liu, J., Park, Y.M.M., Berkowitz, S.A., Hu, Q., Han, K., Ortaglia, A., McKeown, R.E., & Liese,
A.D. (2015). Gender differences in the association between food insecurity and insulin
resistance among U.S. adults: national health and nutrition examination survey, 2005-
2010. Annals of Epidemiology. 25(2015), 643-648. Accessed on November 29, 2018.
Maroto, M. E., Snelling, A., & Linck, H. (2015). Food insecurity among community college
students: Prevalence and association with grade point average. Community College
Journal of Research and Practice, 39(6), 515-526. doi:10.1080/10668926.2013.850758
Accessed on November 7, 2017.

53
Martinez, S.M, Frongillo, E.A, Leung, C., & Ritchie, L. (2018). No food for thought: food
insecurity is related to poor mental health and lower academic performance among
students in California’s public university system. Journal of Health Psychology.00(0), 1-
10. doi.org/10.1177/135910531878302. Accessed on October 31, 2018.
Martínez-Ruiz, M. P., Tirelli, C., Izquierdo-Yusta, A., & Gómez-Ladrón-De-Guevara, R. (2015).
Exploring the adjustment of international university students in relation to dietary
practices. British Food Journal, 117(12), 2947-2974. doi:10.1108/BFJ-02-2015-0082
Accessed on January 31, 2018.
Martirosyan, N.M., Bustamante, R.M., & Saxon, D.P. (2019). Academic and social support
services for international students: current practices. Journal of International Students.
9(1), 172-191. doi: 10.32674/jis.v9i1.275ojed.org/jis Accessed on April 1, 2019.
Maxwell, D., Coates, J., & Vaitla, B. (2013). How do different indicators of household food
security compare? Empirical evidence from Tigray. Feinstein International Center, Tufts
University: Medford, USA. Accessed on November 8, 2017.
Maynard, M., Andrade, L., Packull-McCormick, S., Perlman, C. M., Leos-Toro, C., &
Kirkpatrick, S. I. (2018). Food insecurity and mental health among females in high-
income countries. International Journal of Environmental Research and Public
Health, 15(7), 1424. doi:10.3390/ijerph15071424 Accessed on March 2, 2019.
Montgomery, J., Lu, J., Ratliff, S., Mazuk, B. (2017). Food insecurity and depression among
adults with diabetes. The Diabetes EDUCATOR. 43(3), 260-271. doi:
10.1177/0145721717699890 Accessed on November 29, 2018.

54
Morris, L. M., Smith, S., Davis, J., & Null, D. B. (2016). The prevalence of food security and
insecurity among Illinois university students. Journal of Nutrition Education and
Behavior, 48(6), 376-382.e1. doi:10.1016/j.jneb.2016.03.013 Accessed on November 7,
2017.
Organization for Economic Co-operation and Development. (2019). Members and partners.
Retrieved from http://www.oecd.org/about/membersandpartners/. Accessed on March 30,
2019.
Orwelius, L., Nilsson, M., Nilsson, E., Wenemark, M., Walfridsson, U., Lundstrom, M., Taft, C.,
Palaszewski, B., & Kristenson, M. (2018). The swedish RAND-36 health survey –
reliability and responsiveness assessed in patient populations using svensson’s method
for paired ordinal data. Journal of Patient-Reported Outcomes. 2(4); 1-10.
doi:10.1186/s41687-018-0030-0 Accessed on April 4, 2019.
Park, C.Y. & Eicher-Miller, H.A. (2014). Iron deficiency is associated with food insecurity in
pregnant females in the united states: national health and nutrition examination survey
1999-2010. Accessed on March 2, 2019.
Patton-López, M. M., López-Cevallos, D. F., Cancel-Tirado, D. I., & Vazquez, L. (2014).
Prevalence and correlates of food insecurity among students attending a midsize rural
university in Oregon. Journal of Nutrition Education and Behavior, 46(3), 209-214.
Accessed on December 3, 2017.
Pellowski, J. A., Barnett, W., Kuo, C. C., Koen, N., Zar, H. J., & Stein, D. J. (2017).
Investigating tangible and mental resources as predictors of perceived household food
insecurity during pregnancy among women in a south african birth cohort study. Social
Science & Medicine, 187, 76-84. doi:10.1016/j.socscimed.2017.06.022

55
Pereira, R.A. & Hodge, A. (2015). Editorial: food insecurity a critical public health nutrition
concern. Public Health Nutrition. 18(6), 2893-2894. doi:10.1017/S136898001500292X
Accessed on November 8, 2017.
Pérez-Escamilla, R., & Segall-Corrêa, A. M. (2008). Food insecurity measurement and
indicators. Revista De Nutricao, 21, 15-26.Accessed on October 29, 2018.
Pheley, A.M., Holben, D.H., Graham, A.S., & Simpson, C. (2002). Food security and health
status: a preliminary study in rural Appalachia. The Journal of Rural Health. 18 (3), 447-
454. Accessed on December 31,2018.
Ruetzler, T., Taylor, J., & Hertzman, J. (2012). Adaptation and international students'
perceptions of on-campus foodservice. British Food Journal, 114(11), 1599-1612.
doi:10.1108/00070701211273081doi:10.1016/j.jneb.2013.10.007. Accessed on January
31, 2018.
Saiz, A.M., Aul, A.M, Malecki, K.M., Bersch, A.J., Bergmans, R.S., LeCaire, T.J., & Nieto, F.J.
(2016). Food insecurity and cardiovascular health: findings from a statewide population
health survey in Wisconsin. Preventative Medicine. 93(2016), 1-6.
doi.org/10.1016/j.ypmed.2016.09.002 Accessed on November 30, 2018.
Seligman, H.K., Laraia, B.A., & Kushel, M.B. (2010). Food insecurity is associated with chronic
disease among low-income NHANES participants. The Journal of Nutrition and Disease.
140, 304-310. doi:10.3945/jn.109.112573. Accessed from March 2, 2019.
Sherry, M. Thomas, P. & Chui, W.H. (2009). International students: a vulnerable student
population. Higher Education. 60, 33-46. doi 10.1007/s10734-009-9284-z Accessed on
April 1, 2019.

56
Silva, M. R., Kleinert, W. L., Sheppard, A. V., Cantrell, K. A., Freeman-Coppadge, D. J., Tsoy,
E., . . . Pearrow, M. (2017). The relationship between food security, housing stability, and
school performance among college students in an urban university. Journal of College
Student Retention: Research, Theory & Practice, 19(3), 284-299.
doi:10.1177/1521025115621918 Accessed on November 8, 2017
Soldavini, J., Berner, M., & Da Silva, J. (2019). Rates of and characteristics associated with food
insecurity differ among undergraduate and graduate students at a large public university
in the southeast united states. Preventive Medicine Reports, 14, 100836.
doi:10.1016/j.pmedr.2019.100836
Tarasuk, V., Mitchell, A., McLaren, L. and McIntyre, L. (2013). Chronic physical and mental
health conditions among adults may increase vulnerability to household food insecurity.
The Journal of Nutrition. 143, 1785-1793. doi:10.3945/jn.113.178483. Accessed on
March 2, 2019.
Tarasuk, V., Cheng, J., de Oliveira, C., Dachner, N., Gunderson, C., and Kurdyak, P. (2015).
Association between household food insecurity and annual health care costs. Canadian
Medical Association Journal. 187:14, E429-E436. doi/10.1503/cmaj.150644. Accessed
on March 2, 2019.
The University of Mississippi. (2018). Admission to the University. Retrieved from
https://catalog.olemiss.edu/admission/international-students. Accessed on October 31,
2018.
The University of Mississippi. (2018). Affidavit of Financial Support. Retrieved from
https://international.olemiss.edu/wp-content/uploads/sites/23/2018/06/Affidavit-of-
Financial-Support-2018-2019-format.pdf Accessed on April 5, 2019.

57
The University of Mississippi. (2017). Quick facts. Retrieved from
https://www.olemiss.edu/aboutum/quickfacts/ Accessed on January 10, 2018.
United States Department of Agriculture. (2017). Definitions of food security. Retrieved from
https://www.ers.usda.gov/topics/food-nutrition-assistance/food-security-in-the-
us/definitions-of-food-security/ Accessed on January 9, 2018.
United States Department of Agriculture. (2017). U.S. adult food security survey module.
Retrieved from: https://www.ers.usda.gov/topics/food-nutrition-assistance/food-security-
in-the-us/survey-tools/#adult Accessed on January 9, 2018.
U.S Citizenship and Immigration Services. (2016). Students and employment. Retrieved from
https://www.uscis.gov/working-united-states/students-and-exchange-visitors/students-
and-employment Accessed on January 9, 2018.
Watson, T. D., Malan, H., Glik, D., & Martinez, S. M. (2017). College students identify
university support for basic needs and life skills as key ingredient in addressing food
insecurity on campus. California Agriculture, 71(3), 130-138. doi:10.3733/ca.2017a0023
Accessed on September 8, 2017.
World Health Organization. (2018). Millennium Development Goals. Retrieved from
http://www.who.int/topics/millennium_development_goals/about/en/ Accessed on
January 27, 2018.
Wu, H., Garza, E., & Guzman, N. (2015). International student's challenge and adjustment to
college. Education Research International, doi:10.1155/2015/202753 Accessed on
January 31, 2018.

58
Zhang, Y., Qu, B., Lun, S. Guo, Y., & Liu, J. (2012). The 36-item short form health survey:
reliability and validity in chinese medical students. International Journal of Medical
Sciences. 9(7); 521– 526. doi: 10.7150/ijms.4503. Accessed on April 4, 2019.
Zhou, J., & Cole, D. (2017). Comparing international and american students: Involvement in
college life and overall satisfaction. Higher Education, 73(5), 672;655;-672.
doi:10.1007/s10734-016-9982-2

59
List of Appendices

60
LIST OF APPEDICES
A. Food Insecurity and Health Among International Students Survey……...……….…..…61
B. USDA’s Household Food Security Survey Module: Six-Item Short Form.………......…71
C. Household Food Insecurity Access Scale Indicator………….……………...……...……74
D. Household Hunger Scale…….……………………………….…………...………...……77
E. Latin America and Caribbean Food Security Scale…….………………...………...……78
F. Food Insecurity Experience Scale……….…………………………………..……...……80
G. RAND 36-Item Health Survey 1.0 Questionnaire Items…………………………...……82

61
APPENDIX A: FOOD INSECURITY AND HEALTH AMONG INTERNATIONAL
STUDENTS SURVEY
For the following questions, select the answer that most accurately describes your situation.
1. Are you 18 years or older?
•Yes
•No
2. From which country are you a citizen?
3. What is your race/ethnicity?
4. Are you male or female?
•Male
•Female
•Other, Please Explain. ________________
5. What is your relationship status?
•Single
•Married
•Divorced
•Other, Please Explain. ________________
6. Do you have any children?
•Yes
•No
7. How long have you been a student at The University of Mississippi?
•Less than 1 Semester
•1 Semester
•2 Semesters
•More than 2 Semesters

62
8. Do you receive any type of funding (i.e., scholarship, grant, assistantship, etc.)?
•Yes, I receive funding.
•No, I do not receive funding.
9. “The food that I bought just didn’t last, and I didn’t have money to get more.” Was that
often, sometimes, or never true for you in the last 12 months?
•Often true
•Sometimes true
•Never true
10. “I couldn’t afford to eat balanced meals.” Was that often, sometimes, or never true for you in
the last 12 months?
•Often true
•Sometimes true
•Never true
11. In the last 12 months, since last January did you ever cut the size of your meals or skip meals
because there wasn't enough money for food?
•Yes
•No
12. How often did this happen—almost every month, some months but not every month, or in
only 1 or 2 months?
•Almost every month
•Some months but not every month
•Only 1 or 2 months
13. In the last 12 months, did you ever eat less than you felt you should because there wasn't
enough money for food?
•Yes
•No
14. In the last 12 months, were you every hungry but didn't eat because there wasn't enough
money for food?
•Yes
•No

63
15. New ideas and projects sometimes distract me from previous ones.
•Very much like me
•Mostly like me
•Somewhat like me
•Not much like me
•Not like me at all
16. Setbacks don’t discourage me.
•Very much like me
•Mostly like me
•Somewhat like me
•Not much like me
•Not like me at all
17. I have been obsessed with a certain idea or project for a short time but later lost interest.
•Very much like me
•Mostly like me
•Somewhat like me
•Not much like me
•Not like me at all
18. I am a hard worker.
•Very much like me
•Mostly like me
•Somewhat like me
•Not much like me
•Not like me at all
19. I often set a goal but later choose to pursue a different one.
•Very much like me
•Mostly like me
•Somewhat like me
•Not much like me
•Not like me at all

64
20. I have difficulty maintaining my focus on projects that take more than a few months to
complete.
•Very much like me
•Mostly like me
•Somewhat like me
•Not much like me
•Not like me at all
21. I finish whatever I begin.
•Very much like me
•Mostly like me
•Somewhat like me
•Not much like me
•Not like me at all
22. I am diligent.
•Very much like me
•Mostly like me
•Somewhat like me
•Not much like me
•Not like me at all
23. In general, would you say your health is:
•1 - Excellent
•2 - Very good
•3 - Good
•4 - Fair
•5 - Poor
24. Compared to one year ago, how would you rate your health in general now?
•1 - Much better now than one year ago
•2 - Somewhat better now than one year ago
•3 - About the same
•4 - Somewhat worse now than one year ago
•5 - Much worse now than one year ago
The following items are about activities you might do during a typical day. Does your
health now limit you in these activities? If so, how much?

65
25. Vigorous activities, such as running, lifting heavy objects, participating in strenuous sports
•Yes, limited a lot
•Yes, limited a little
•No, not limited at all
26. Moderate activities, such as moving a table, pushing a vacuum cleaner, bowling, or playing
golf
•Yes, limited a lot
•Yes, limited a little
•No, not limited at all
27. Lifting or carrying groceries
•Yes, limited a lot
•Yes, limited a little
•No, not limited at all
28. Climbing several flights of stairs
•Yes, limited a lot
•Yes, limited a little
•No, not limited at all
29. Climbing one flight of stairs
•Yes, limited a lot
•Yes, limited a little
•No, not limited at all
30. Bending, kneeling, or stooping
•Yes, limited a lot
•Yes, limited a little
•No, not limited at all
31. Walking more than a mile
•Yes, limited a lot
•Yes, limited a little
•No, not limited at all

66
32. Walking several blocks
•Yes, limited a lot
•Yes, limited a little
•No, not limited at all
33. Walking one block
•Yes, limited a lot
•Yes, limited a little
•No, not limited at all
34. Bathing or dressing yourself
•Yes, limited a lot
•Yes, limited a little
•No, not limited at all
During the past 4 weeks, you have had any of the following problems with your work or other
regular daily activities as a result of your physical health?
35. Cut down the amount of time you spent on work or other activities
•Yes
•No
36. Accomplished less than you would like
•Yes
•No
37. Were limited in the kind of work or other activities
•Yes
•No
38. Had difficulty performing the work or other activities (for example, it took extra effort)
•Yes
•No
During the past 4 weeks, have you had any of the following problems with your work or
other regular daily activities as a result of any emotional problems (such as feeling
depressed or anxious)?

67
39. Cut down the amount of time you spent on work or other activities
•Yes
•No
40. Accomplished less than you would like
•Yes
•No
41.Didn't do work or other activities as carefully as usual
•Yes
•No
42. During the past 4 weeks, to what extent has your physical health or emotional
problems interfered with your normal social activities with family, friends, neighbors, or
groups?
•1 - Not at all
•2 - Slightly
•3 - Moderately
•4 - Quite a bit
•5 - Extremely
43. How much bodily pain have you had during the past 4 weeks?
•1 - None
•2 - Very mild
•3 - Mild
•4 - Moderate
•5 - Severe
•6 - Very severe
44. During the past 4 weeks, how much did pain interfere with your normal work
(including both work outside the home and housework)?
•1 - Not at all
•2 - A little bit
•3 - Moderately
•4 - Quite a bit
•5 – Extremely

68
These questions are about how you feel and how things have been with you during the
past 4 weeks. For each question, please give the one answer that comes closest to the way
you have been feeling.
How much of the time during the past 4 weeks...
45. Did you feel full of pep?
•All of the time
•Most of the time
•A good bit of the time
•Some of the time
•A little of the time
•None of the time
46. Have you been a very nervous person?
•All of the time
•Most of the time
•A good bit of the time
•Some of the time
•A little of the time
•None of the time
47. Have you felt so down in the dumps that nothing could cheer you up?
•All of the time
•Most of the time
•A good bit of the time
•Some of the time
•A little of the time
•None of the time
48. Have you felt calm and peaceful?
•All of the time
•Most of the time
•A good bit of the time
•Some of the time
•A little of the time
•None of the time

69
49. Did you have a lot of energy?
•All of the time
•Most of the time
•A good bit of the time
•Some of the time
•A little of the time
•None of the time
50. Have you felt downhearted and blue?
•All of the time
•Most of the time
•A good bit of the time
•Some of the time
•A little of the time
•None of the time
51. Did you feel worn out?
•All of the time
•Most of the time
•A good bit of the time
•Some of the time
•A little of the time
•None of the time
52. Have you been a happy person?
•All of the time
•Most of the time
•A good bit of the time
•Some of the time
•A little of the time
•None of the time
53. Did you feel tired?
•All of the time
•Most of the time
•A good bit of the time
•Some of the time
•A little of the time
•None of the time

70
54. During the past 4 weeks, how much of the time has your physical health or emotional
problems interfered with your social activities (like visiting with friends, relatives, etc.)?
•1 - All of the time
•2 - Most of the time
•3 - Some of the time
•4 - A little of the time
•5 - None of the time
How TRUE and False is each of the following statements for you.
55. I seem to get sick a little easier than other people
•Definitely true
•Mostly true
•Don’t know
•Mostly false
•Definitely false
56. I am as healthy as anybody I know
•Definitely true
•Mostly true
•Don’t know
•Mostly false
•Definitely false
57. I expect my health to get worse
•Definitely true
•Mostly true
•Don’t know
•Mostly false
•Definitely false
58. My health is excellent
•Definitely true
•Mostly true
•Don’t know
•Mostly false
•Definitely false

71
APPENDIX B: USDA’S HOUSEHOLD FOOD SECURITY SURVEY MODULE: SIX-ITEM
SHORT FORM
1. “The food that I bought just didn’t last, and I didn’t have money to get more.” Was that
often, sometimes, or never true for you in the last 12 months?
•Often true
•Sometimes true
•Never true
•DK or Refused
2. “I couldn’t afford to eat balanced meals.” Was that often, sometimes, or never true for you in
the last 12 months?
•Often true
•Sometimes true
•Never true
•DK or Refused
3. In the last 12 months, since last January did you ever cut the size of your meals or skip meals
because there wasn't enough money for food?
•Yes
•No
•DK
4. How often did this happen—almost every month, some months but not every month, or in
only 1 or 2 months?
•Almost every month
•Some months but not every month
•Only 1 or 2 months
•DK
5. In the last 12 months, did you ever eat less than you felt you should because there wasn't
enough money for food?
•Yes
•No
•DK

72
6. In the last 12 months, were you every hungry but didn't eat because there wasn't enough
money for food?
•Yes
•No
•DK
Coding and Categorization
For the Six-Item Short Form, an affirmative yes should be coded for responses of “often” or
“sometimes: on questions HH3 and HH4, “yes” on AD1, AD2, and AD3, and “almost every
month” and “some months but not every month” on AD1a. The sum of the six questions
provides the household’s raw score on the scale. The table below shows how food security status
is assigned based on raw score. Households with a raw score 0-1 is described a food secure and
raw score of 2-6 are described as food insecure.
Food Security Status Assignment
Raw Score 0-1 High or marginal food security (raw score of
1 may be considered marginal food security,
but a large proportion of household or adult
scale will have a raw score zero on the six-
item scale).
Raw Score 2-4 Low Food Security
Raw Score 5-6 Very Low Food Security
If statistical procedures require an interval-level measure, scale scores based on the Rasch
measurement model may be used. These scale scores are detailed in the table below. No interval-
level score is defined for households that affirm no items.

73
Number of Affirmatives Scale Score
0 N/A
1 2.86
2 4.19
3 5.27
4 6.30
5 7.54
6 (Evaluated at 5.5) 8.48
References
United States Department of Agriculture. (2017). U.S. adult food security survey module.
Retrieved from: https://www.ers.usda.gov/topics/food-nutrition-assistance/food-security-
in-the-us/survey-tools/#adult Accessed on January 9, 2018.

74
APPENDIX C: HOUSEHOLD FOOD INSECURITY ACCESS SCALE INDICATOR (HFIAS)
1. In the past four weeks, did you worry that your household would not have enough food?
0 = •Yes
1 = •No (skip to Q2)
1a. How often did this happen?
1 = •Rarely (once or twice in the past four weeks)
2 = •Sometimes (three to ten times in the past four weeks)
3 = •Often (more than ten times in the past four weeks
2. In the past four weeks, were you or any household member not able to eat the kinds of foods
you preferred because of a lack of resources?
0 = •Yes
1 = •No (skip to Q3)
2a. How often did this happen?
1 = •Rarely (once or twice in the past four weeks)
2 = •Sometimes (three to ten times in the past four weeks)
3 = •Often (more than ten times in the past four weeks
3. In the past four weeks, did you or any household member have to eat a limited variety of
foods due to a lack of resources?
0 = •Yes
1 = •No (skip to Q4)
3a. How often did this happen?
1 = •Rarely (once or twice in the past four weeks)
2 = •Sometimes (three to ten times in the past four weeks)
3 = •Often (more than ten times in the past four weeks
4. In the past four weeks, did you or any household member have to eat some foods that you
really did not want to eat because of a lack of resources to obtain other types of food?
0 = •Yes
1 = •No (skip to Q5)

75
4a. How often did this happen?
1 = [ ] Rarely (once or twice in the past four weeks)
2 = [ ] Sometimes (three to ten times in the past four weeks)
3 = [ ] Often (more than ten times in the past four weeks
5. In the past four weeks, did you or any household member have to eat a smaller meal than you
felt you needed because there was not enough food?
0 = •Yes
1 = •No (skip to Q6)
5a. How often did this happen?
1 = •Rarely (once or twice in the past four weeks)
2 = •Sometimes (three to ten times in the past four weeks)
3 = •Often (more than ten times in the past four weeks
6. In the past four weeks, did you or any other household member have to eat fewer meals in a
day because there was not enough food?
0 = •Yes
1 = •No (skip to Q7)
6a. How often did this happen?
1 = •Rarely (once or twice in the past four weeks)
2 = •Sometimes (three to ten times in the past four weeks)
3 = •Often (more than ten times in the past four weeks
7. In the past four weeks, was there ever no food to eat of any kind in your household because
of lack of resources to get food?
1 = •Yes
2 = •No (skip to Q8)
7a. How often did this happen?
1 = •Rarely (once or twice in the past four weeks)
2 = •Sometimes (three to ten times in the past four weeks)
3 = •Often (more than ten times in the past four weeks

76
8. In the past four weeks, did you or any household member go to sleep at night hungry because
there was not enough food?
0 = •Yes
1 = •No (skip to Q9)
8a. How often did this happen?
1 = •Rarely (once or twice in the past four weeks)
2 = •Sometimes (three to ten times in the past four weeks)
3 = •Often (more than ten times in the past four weeks
9. In the past four weeks, did you or any household member go a whole day and night without
eating anything because there was not enough food?
0 = •Yes
1 = •No (questionnaire is finished)
9a. How often did this happen?
1 = •Rarely (once or twice in the past four weeks)
2 = •Sometimes (three to ten times in the past four weeks)
3 = •Often (more than ten times in the past four weeks

77
APPENDIX D: HOUSEHOLD HUNGER SCALE (HHS)
1.In the past [4 weeks/30 days], was there ever no food to eat of any kind in your house because
of lack of resources to get food?
0 = •Yes
1 = •No (skip to Q2)
1a. How often did this happen in the past [4 weeks/30 days]?
1 = •Rarely (1-2 times)
2 = •Sometimes (3-10 times)
3 = •Often (more than 10 times)
2. In the past [4 weeks/30 days], did you or any household member go to sleep at night hungry
because there was not enough food?
0 = •Yes
1 = •No (skip to Q3)
2. How often did this happen in the past [4 weeks/30 days]?
1 = •Rarely (1-2 times)
2 = •Sometimes (3-10 times)
3 = •Often (more than 10 times)
3a. In the past [4 weeks/30 days], did you or any household member go a whole day and night
without eating anything at all because there was not enough food?
0 = •Yes
1 = •No (Go to next section)
3a. How often did this happen in the past [4 weeks/30 days]?
1 = •Rarely (1-2 times)
2 = •Sometimes (3-10 times)
3 = •Often (more than 10 times)

78
APPENDIX E: LATIN AMERICA AND CARIBBEAN FOOD SECURITY SCALE (ELCSA)
1. Did you ever worry about your household running out of food?
1 = •Yes
0 = •No
2. Did your household ever run out of food?
1 = •Yes
0 = •No
3. Was your household deprived of eating a healthy diet?
1 = •Yes
0 = •No
4. Did you or any other adults in your household ever have an unbalanced diet?
1 = •Yes
0 = •No
5. Did you or any other adults in your household miss breakfast, lunch or dinner?
1 = •Yes
0 = •No
6. Did you or any other adults in your household eat less than you should?
1 = •Yes
0 = •No
7. Were you or any other adults in your household ever hungry and had nothing to eat?
1 = •Yes
0 = •No
8. Did you or any other adults in your household not eat for a whole day or eat only once a day?
1 = •Yes
0 = • No
9. Were any household members deprived of a healthy diet?
1 = •Yes
0 = •No

79
10. Did any household members under 18 have an unbalanced diet?
1 = •Yes
0 = •No
11. Did any household members under 18 ever miss breakfast, lunch or dinner?
1 = •Yes
0 = •No
12. Did any household members under 18 not have enough to eat?
1 = •Yes
0 = •No
13. Did you ever have to cut the size of the meals prepared for any household members under
18?
1 = •Yes
0 = •No
14. Were any household members under 18 ever hungry and had nothing to eat?
1 = •Yes
0 = •No
15. Did any household members under 18 ever not eat for a whole day or eat only once a day?
1 = •Yes
0 = •No

80
APPENDIX F: FOOD INSECURITY EXPERIENCE SCALE (FIES)
1. During the last 12 months, was there a time when You were worried you would not have
enough food to eat because of a lack of money or other resources?
•Yes
•No
•DK
•Refuse to Answer
2. Still thinking about the last 12 months, was there a time when you were unable to eat healthy
and nutritious food because of a lack of money or other resources?
•Yes
•No
•DK
•Refuse to Answer
3. Was there a time when you ate only a few kinds of foods because of a lack of money or other
resources?
•Yes
•No
•DK
•Refuse to Answer
4. Was there a time when you had to skip a meal because there was not enough money or other
resources to get food?
•Yes
•No
•DK
•Refuse to Answer
5. Still thinking about the last 12 months, was there a time when you ate less than you thought
you should because of a lack of money or other resources?
•Yes
•No
•DK
•Refuse to Answer

81
6. Was there a time when your household ran out of food because of a lack of money or other
resources?
•Yes
•No
•DK
•Refuse to Answer
7. Was there a time when you were hungry but did not eat because there was not enough money
or other resources for food?
•Yes
•No
•DK
•Refuse to Answer
8. During the last 12 months, was there a time when you went without eating for a whole day
because of a lack of money or other resources?
•Yes
•No
•DK
•Refuse to Answer

82
APPENDIX G: RAND 36-ITEM HEALTH SURVEY 1.0 QUESTIONNAIRE ITEMS
1. In general, would you say your health is:
•1 - Excellent
•2 - Very good
•3 - Good
•4 - Fair
•5 - Poor
2. Compared to one year ago, how would you rate your health in general now?
•1 - Much better now than one year ago
•2 - Somewhat better now than one year ago
•3 - About the same
•4 - Somewhat worse now than one year ago
•5 - Much worse now than one year ago
The following items are about activities you might do during a typical day. Does your
health now limit you in these activities? If so, how much?
3. Vigorous activities, such as running, lifting heavy objects, participating in strenuous sports
•Yes, limited a lot
•Yes, limited a little
•No, not limited at all
4. Moderate activities, such as moving a table, pushing a vacuum cleaner, bowling, or playing
golf
•Yes, limited a lot
•Yes, limited a little
•No, not limited at all
5. Lifting or carrying groceries
•Yes, limited a lot
•Yes, limited a little
•No, not limited at all
6. Climbing several flights of stairs
•Yes, limited a lot
•Yes, limited a little
•No, not limited at all

83
7. Climbing one flight of stairs
•Yes, limited a lot
•Yes, limited a little
•No, not limited at all
8. Bending, kneeling, or stooping
•Yes, limited a lot
•Yes, limited a little
•No, not limited at all
9. Walking more than a mile
•Yes, limited a lot
•Yes, limited a little
•No, not limited at all
10. Walking several blocks
•Yes, limited a lot
•Yes, limited a little
•No, not limited at all
11. Walking one block
•Yes, limited a lot
•Yes, limited a little
•No, not limited at all
12. Bathing or dressing yourself
•Yes, limited a lot
•Yes, limited a little
•No, not limited at all
During the past 4 weeks, you have had any of the following problems with your work or other
regular daily activities as a result of your physical health?
13. Cut down the amount of time you spent on work or other activities
•Yes
•No

84
14. Accomplished less than you would like
•Yes
•No
15. Were limited in the kind of work or other activities
•Yes
•No
16. Had difficulty performing the work or other activities (for example, it took extra effort)
•Yes
•No
During the past 4 weeks, have you had any of the following problems with your work or other
daily activities as a result of any emotional problems (such as feeling depressed or anxious)?
17. Cut down the amount of time you spent on work or other activities
•Yes
•No
18. Accomplished less than you would like
•Yes
•No
19. Didn't do work or other activities as carefully as usual
•Yes
•No
20. During the past 4 weeks, to what extent has your physical health or emotional
problems interfered with your normal social activities with family, friends, neighbors, or
groups?
•1 - Not at all
•2 - Slightly
•3 - Moderately
•4 - Quite a bit
•5 - Extremely
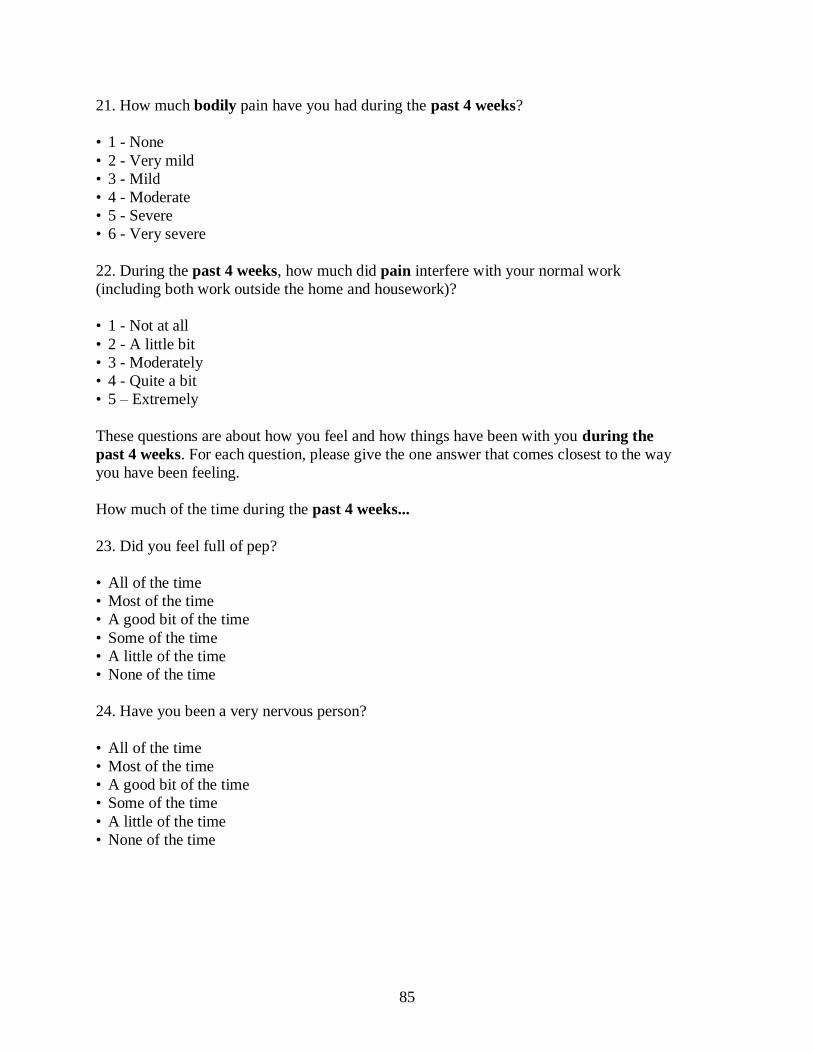
85
21. How much bodily pain have you had during the past 4 weeks?
•1 - None
•2 - Very mild
•3 - Mild
•4 - Moderate
•5 - Severe
•6 - Very severe
22. During the past 4 weeks, how much did pain interfere with your normal work
(including both work outside the home and housework)?
•1 - Not at all
•2 - A little bit
•3 - Moderately
•4 - Quite a bit
•5 – Extremely
These questions are about how you feel and how things have been with you during the
past 4 weeks. For each question, please give the one answer that comes closest to the way
you have been feeling.
How much of the time during the past 4 weeks...
23. Did you feel full of pep?
•All of the time
•Most of the time
•A good bit of the time
•Some of the time
•A little of the time
•None of the time
24. Have you been a very nervous person?
•All of the time
•Most of the time
•A good bit of the time
•Some of the time
•A little of the time
•None of the time

86
25. Have you felt so down in the dumps that nothing could cheer you up?
•All of the time
•Most of the time
•A good bit of the time
•Some of the time
•A little of the time
•None of the time
26. Have you felt calm and peaceful?
•All of the time
•Most of the time
•A good bit of the time
•Some of the time
•A little of the time
•None of the time
27. Did you have a lot of energy?
•All of the time
•Most of the time
•A good bit of the time
•Some of the time
•A little of the time
•None of the time
28. Have you felt downhearted and blue?
•All of the time
•Most of the time
•A good bit of the time
•Some of the time
•A little of the time
•None of the time
29. Did you feel worn out?
•All of the time
•Most of the time
•A good bit of the time
•Some of the time
•A little of the time
•None of the time

87
30. Have you been a happy person?
•All of the time
•Most of the time
•A good bit of the time
•Some of the time
•A little of the time
•None of the time
31. Did you feel tired?
•All of the time
•Most of the time
•A good bit of the time
•Some of the time
•A little of the time
•None of the time
32. During the past 4 weeks, how much of the time has your physical health or emotional
problems interfered with your social activities (like visiting with friends, relatives, etc.)?
•1 - All of the time
•2 - Most of the time
•3 - Some of the time
•4 - A little of the time
•5 - None of the time
How TRUE and False is each of the following statements for you.
33. I seem to get sick a little easier than other people
•Definitely true
•Mostly true
•Don’t know
•Mostly false
•Definitely false
34. I am as healthy as anybody I know
•Definitely true
•Mostly true
•Don’t know
•Mostly false
•Definitely false

88
35. I expect my health to get worse
•Definitely true
•Mostly true
•Don’t know
•Mostly false
•Definitely false
36. My health is excellent
•Definitely true
•Mostly true
•Don’t know
•Mostly false
•Definitely false
Coding and Categorization
Step 1: Precode each numeric values using the scoring key below. Each item is scored on a 0
(less desirable health state) to 100 (more desirable health state). Recoding values are detailed
below.
Item Numbers Change original response
category*
To recoded value of
1,2,20,22,34,36 1
2
3
4
5
100
75
50
25
0
3,4,5,6,7,8,9,10,11,12 1
2
3
0
50
100
13,14,15,16,17,18,19 1
2
0
100
21,23,26,27,30 1
2
3
4
5
6
100
80
60
40
20
0
24,25,28,29,31 1
2
3
0
20
40

89
4
5
6
60
80
100
32,33,35 1
2
3
4
5
0
25
50
75
100
Step 2: Average together items in the same scale. This creates the 8 scale scores. Items in each
scale are detailed in the table below. When calculating scale scores, missing data should not be
taken into account.
Scale Number of Items After recoding, average the
following
Physical Functioning 10 3,4,5,6,7,8,9,10.11.12
Role Limitations Due to
Physical Health
4 13,14,15,16
Role Limitations due to
Emotional Problems
3 17,18,19
Energy/Fatigue 4 23,27,29,31
Emotional Well-Being 5 24,25,26,28,30
Social Functioning 2 20,32
Pain 2 21,22
General Health 5 1,33,34,35,36
Reference
Hays, R.D. (1994). The Medical Outcomes Study (MOS) Measures of Quality of Life. Retrieved
from the RAND Corporation website:https://www.rand.org/health/surveys_tools/mos/36-
item-short-form/survey-instrument.html Accessed on February 25, 2018.

90
VITA
Jamie Benefield
EDUCATION
B.A. Nutrition and Dietetics, University of Mississippi, December 2015.