food dyes and adhd: state of the statistical...
TRANSCRIPT

Food Dyes and ADHD: State of the Statistical Evidence
Joel Nigg, Ph.D.
Professor, Departments of Psychiatry and Behavioral Neuroscience,
Director, ADHD Program Oregon Health & Science University
Marketing to Kids Webinar Series
June 3, 2015

ADHD
l Extreme, persistent, impairing levels of l Inattention-‐disorganization (“dysexecutive”) l Hyperactivity-‐impulsivity (“dysregulated”)
l Critical ancillary features
l Emotional problems-‐tantrums, irritability, poorly controlled, over-‐reactive
l Cognitive problems—learning, IQ

What is neurodevelopmental disorder?
Attention-‐deficit/hyperactivity disorder
(AD/HD)
Autism spectrum disorder (ASD)
Learning and
language disorders
(LD)

Common
Early onset, persistent
Clinically managed ---not cured
Brain = relevant organ in the body
Multifactorial GxE causality
SOME FEATURES OF THESE DISORDERS

Why we care about the environment
l ADHD is heritable—significant genetic piece
l But G x E crucialà epigenetic effects likely
l Susceptibility to the environment is a theme; l genes may confer sensitivity “for good or for ill”
l Persistent findings of response to environmental intervention in some children

Ó Major changes in dietary content in recent centuries Ó Positive and negative health effects apparent Ó Brain is 2% of body mass, 20% of calorie use, 40% of glucose use. Ô Likely *most* responsive organ to food content/quality
Ó Gut-‐‑brain axis increasingly salient Ó Artificial food additives could trigger toxicological (inflammatory) or allergic (histamine) reactions
Rationale: Food is one of the major environments of obvious interest for child development and health

Ñ Long history in relation to behavioral outcome Ó 1926-‐‑Albert Rowe: “Allergy of the nervous system” Ó 1934-‐‑LaPage: food and child behavior problems Ó 1976-‐‑Hall: elimination diet for mental illness Ó 1977-‐‑Feingold: elimination diet for hyperkinesis with focus on synthetic dyes, preservatives, & salicylates
Ñ Focus here on updated extant meta-‐‑analyses
History
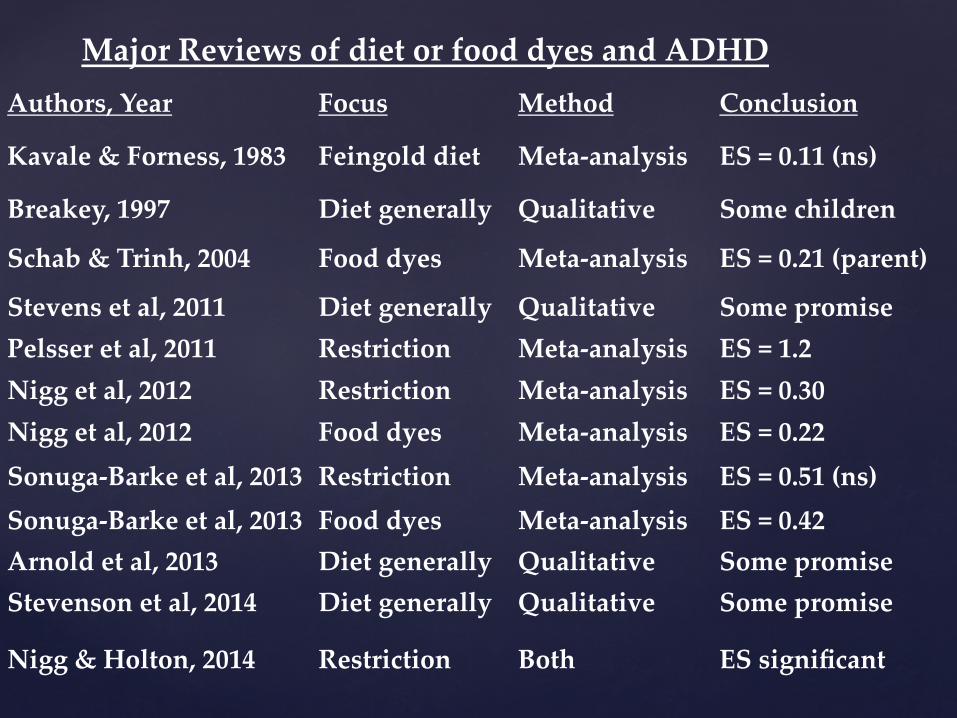
Authors, Year Focus Method Conclusion
Kavale & Forness, 1983 Feingold diet Meta-‐‑analysis ES = 0.11 (ns)
Breakey, 1997 Diet generally Qualitative Some children
Schab & Trinh, 2004 Food dyes Meta-‐‑analysis ES = 0.21 (parent)
Stevens et al, 2011 Diet generally Qualitative Some promise Pelsser et al, 2011 Restriction Meta-‐‑analysis ES = 1.2 Nigg et al, 2012 Restriction Meta-‐‑analysis ES = 0.30 Nigg et al, 2012 Food dyes Meta-‐‑analysis ES = 0.22 Sonuga-‐‑Barke et al, 2013 Restriction Meta-‐‑analysis ES = 0.51 (ns) Sonuga-‐‑Barke et al, 2013 Food dyes Meta-‐‑analysis ES = 0.42 Arnold et al, 2013 Diet generally Qualitative Some promise Stevenson et al, 2014 Diet generally Qualitative Some promise
Nigg & Holton, 2014 Restriction Both ES significant
Major Reviews of diet or food dyes and ADHD

Color Name FDA Approved
EU Approved
FD&C blue #1 (brilliant blue) Yes Yes FD&C blue #2 (indigotine) Yes Yes FD&C Green #3 (fast green) Yes Yes Orange B Yes No Citrus Red #2 (Amaranth) Yes Yes FD&C Red #3 (Erythrosine) Yes Yes FED&C Red #40 (Allura Red) Yes Yes Warning Label FD&C Yellow #5(Tartrazine) Yes Yes Warning Label FD&C Yellow #6(Sunset Yellow) Yes Yes Warning Label Quinoline Yellow No Yes Warning Label Carmoisine No Yes Warning Label Ponceau No Yes Warning Label
Food Color Regulation USA and EU as of 2013

META-ANALYSIS: STATE OF THE ART FOR SYNTHESIZING SCIENTIFIC KNOWLEDGE • Selecting and then Pooling all available studies • Weight by sample size • Examine moderators (such as measure type, study quality) • Compute EFFECT SIZE and CONFIDENCE INTERVAL • EFFECT SIZE
• D, or g, mean the same thing • Standard deviation units • d=1.0 means a 1 standard deviation separation or about a 50% overlap of
the two populations in a “normal curve” • Most treatment effects are d=1.0 or more • Most clinically relevant effects are d=.5 or larger • Smaller effects can have population ramifications when risks are common
due to large number of people affected
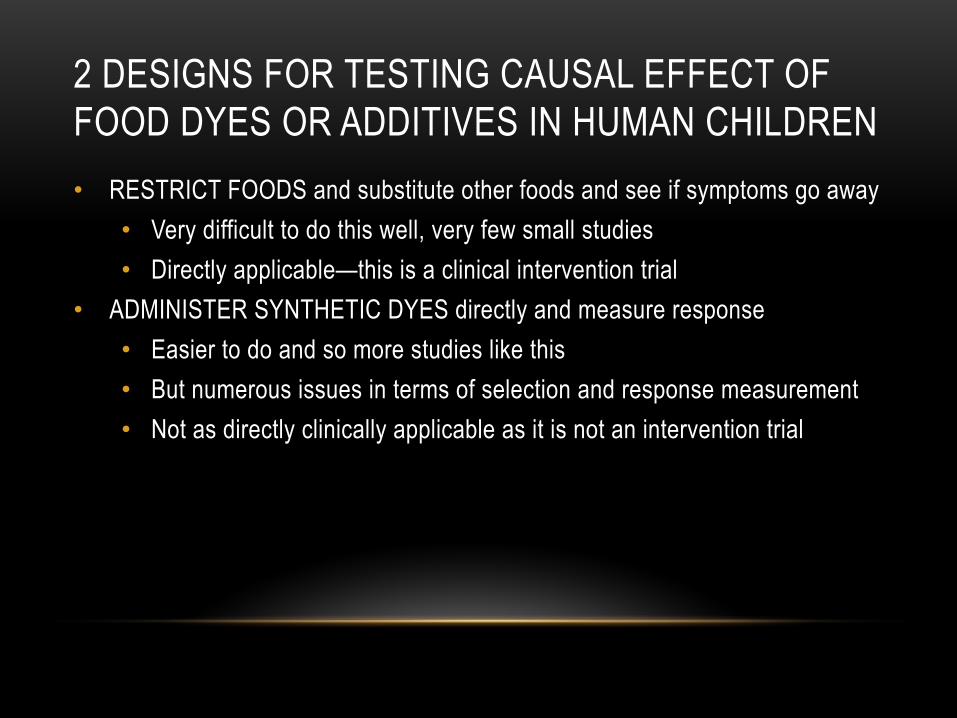
2 DESIGNS FOR TESTING CAUSAL EFFECT OF FOOD DYES OR ADDITIVES IN HUMAN CHILDREN • RESTRICT FOODS and substitute other foods and see if symptoms go away
• Very difficult to do this well, very few small studies • Directly applicable—this is a clinical intervention trial
• ADMINISTER SYNTHETIC DYES directly and measure response • Easier to do and so more studies like this • But numerous issues in terms of selection and response measurement • Not as directly clinically applicable as it is not an intervention trial

PRISMA 2009 Flow Diagram
Records identified of restriction diets)
Screen
ing
Includ
ed
Eligibility
Iden
tification
Records identified specifically of artificial food dyes)
Records after duplicates removed (n = 53 human studies)
Records screened (n = 53)
Records excluded (n =0)
Full-‐text articles assessed for eligibility (n =53 )
Full-‐text articles excluded, with reasons
(n = 18)
Studies included in qualitative synthesis
(n =35)
Studies included in quantitative synthesis
(meta-‐analysis) (n = 25)

OUR META-ANALYSIS OF FOOD DYE CHALLENGE NIGG ET AL., 2012
• Source K N • Parent: 20 794 • Teacher/observer 10 323 • Objective tests 6 154

Food Colors and ADHD: Nigg et al 2012
Synthetic Food Colors associated with slight increase in ADHD symptoms by parent, teacher (not quite), & objective aaention tests

Food Colors and ADHD: Nigg et al 2012
Synthetic Food Colors associated with slight increase in ADHD symptoms by parent, teacher (not quite), & objective aaention tests

Food Colors and ADHD: Nigg et al 2012
Synthetic Food Colors associated with slight increase in ADHD symptoms by parent, teacher (not quite), & objective aaention tests

A narrow study selection: 1) Only in children formally diagnosed with ADHD 2) Only looking at ‘probably blinded raters’
(Sonuga Barke et al., 2013)

Summary of two major recent reviews and meta-‐‑analyses
Nigg Sonuga Barke N of studies 20 8 best reporter d=.42* parent (bias corrected) g=.12* Teacher (all studies) g=.07 (ns) Teacher (high quality) g=.22* acention test g=.27* *survives correction for publication bias Suggests a bit larger effect in studies of children diagnosed with ADHD versus community studies
{
What about intervention trials with restriction diets in real children with ADHD?

Restriction elimination diets with adequate blinding. Source: Nigg et al 2012, J Am Acad Child Adol Psych, 51, 86-‐‑97
33% response rate

Restriction Diet alternative analysis of effect size (*not* response rate) Limited to children diagnosed with ADHD (Sonuga Barke et al., 2013)

Authors, Year Δ Criterion N
Rate (%)
LL (%) UL (%)
Conners et al, 1978 25% 15 26.7 10.4 53.3 Harley et al, 1978 10% 23 22.8 12.6 37.8 Kaplan et al, 1989 25% 24 41.7 24.1 61.7 Schmidt et al, 1997 100% 49 24.5 14.5 38.3 Williams et al, 1978 33% 24 19.2 8.2 38.7 Pooled effect 135 26.4 20.0 34.1
Updated Estimated Response rate to Restriction diet for children with ADHD not preselected for dietary problem or response in adequately blinded and controlled trials (Nigg & Holton 2014)
Note: N, Year of studies

CONSOLIDATING RESTRICTION DIET RESPONSE DATA Study Nigg 2012 Sonuga Barke
2013 Nigg 2013
Conners 1976 X - X
Williams 1978 - - X
Harley 1978 - - X
Egger 1985** X X -
Kaplan 1989 X X X
Carter, 1993 - X -
Boris, 1994 - X -
Schmidt 1997** X X X
** Reason for differences in review results: Egger x2 and Schmidt effect size disagreement
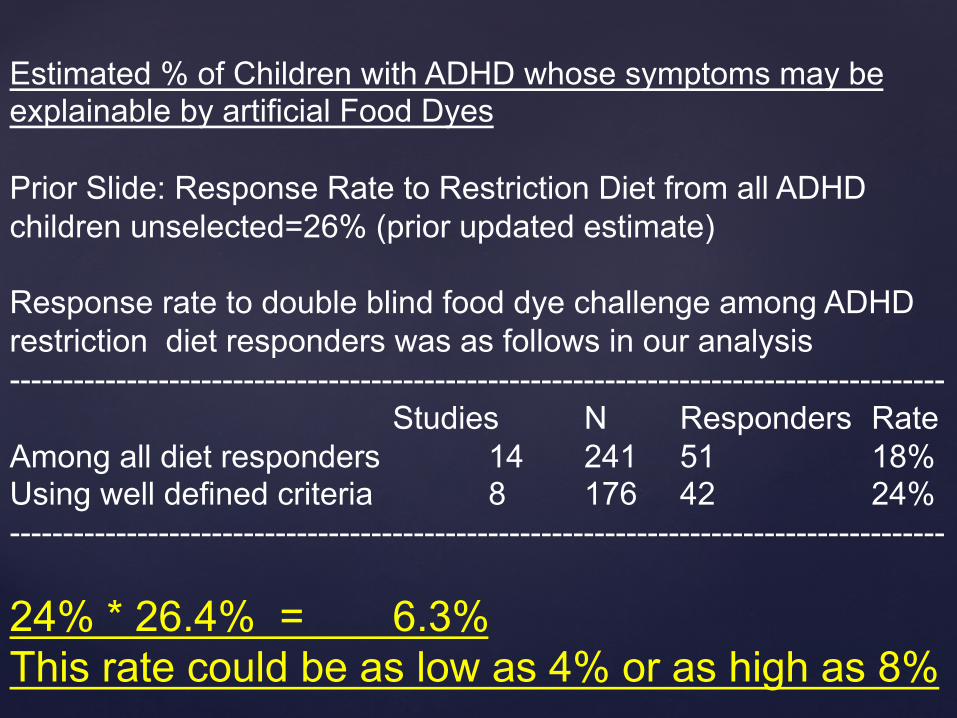
Estimated % of Children with ADHD whose symptoms may be explainable by artificial Food Dyes Prior Slide: Response Rate to Restriction Diet from all ADHD children unselected=26% (prior updated estimate) Response rate to double blind food dye challenge among ADHD restriction diet responders was as follows in our analysis ----------------------------------------------------------------------------------------
Studies N Responders Rate Among all diet responders 14 241 51 18% Using well defined criteria 8 176 42 24% ---------------------------------------------------------------------------------------- 24% * 26.4% = 6.3% This rate could be as low as 4% or as high as 8%

{
Who are the “responders” ?

Effect of food additives on hyperactivity in 8 yr olds is moderated by histamine degradation gene (HNMT Thr105Ile and HNMT T939C). On the left (Thr105ile), note that when the T allele is present, the food additive challenge has no effect. When the T allele is absent, the food additives cause more hyperactivity than the placebo. Source: Stevenson et al., 2010, Am J Psychiatry, 167, 1108-‐‑1115. H3 receptors in the brain may be the mechanism.
New Directions: Personalized medicine. Who should get these interventions?

Ñ “Reliable effect”: CAUSAL EFFECT REAL Ó Parent ratings quite limited BUT Ó Effect larger in highest quality studies, objective tests of acention
Ó Most reliable if preservatives and EU included Ñ “Small” effect: Dyes UNLIKELY a MAJOR cause Ñ ADHD: Dyes likely one part of a larger story Ñ Estimated potential for about 6% of ADHD cases to be clinically affected by food dyes or other food additives
Ñ SMALL TOTAL N STUDIED! OLD LITERATURE!
Caveats and Meaning

OCEBM evidence strength for ADHD treatments. From S Faraone & K Antshel, (2014) Child and Adolescent Clinics of N American 23 (4), 965-972, Fig 1

CONTEXT: Treatment Effect Sizes for Different ADHD Treatments For ADHD Symptom Change Source: Faraone and Antshel, 2014

Conclusions Ñ Synthetic food dyes effect ADHD: real but small
Ó Other food additives may worsen the effect Ñ Average effect: misleading
Ó A small number of children may respond markedly Ñ The literature: old, small, very limited
Ó Urgent need for modern, well designed studies Ñ Study design: should be genetically informed
Ó Identify who will benefit dietary intervention Ñ Consumer protection policy: should be precautionary
Ó Evidence of risk is not ignorable

END

Ñ Include a physician/nurse practitioner and a dietician in planning. Ñ Complete a comprehensive physical and a diet history assessment. Ñ Based on the results of the dietary history, may need RDI/RDA suppl. Ñ Treat documented specific nutritional deficiencies or insufficiencies Ñ Eliminate documented food allergies or sensitivities from the diet. Ñ Monitor closely for efficacy (standardized ratings), side effects, AE’s. Ñ Apply SECS vs. RUDE guidelines (safety, ease/difficulty, expense, success
likelihood. Ñ Consider risk of delaying more well established tx by up to months. Ñ Prepare family for week to months of trial prior to knowing Ñ Do parents have time, energy for the effort (e.g., elimination diet) Ñ Initiate only one treatment at a time and monitor systematically
Overall Recommendations dietary tx (Arnold et al 2014)