food and water security indicators in an arctic … · food and water security indicators in an...
TRANSCRIPT
Food and Water Security Indicators in an Arctic Health Context
A report by the AHHEG/SDWG, and the AMAP/HHAG during the
Swedish chairmanship of the Arctic Council 2011-2013
Lena Maria Nilsson
Birgitta Evengård
Publications from Arctic Research Centre no. 1
Umeå University
www.arcum.umu.se

© Arctic Research Centre at Umeå university
ISBN: 978-91-7459-553-6
Photo: “Vivi-Ann, en fiskare vid Bölesholmarna, Umeå”, In English: “Vivi-Ann, a fisherwoman at Bölesholmarna, Umeå”, by John Hutilainen Electronic version available at: http://umu.diva-portal.org/
Tryck/Printed by: Print & Media, Umeå
Umeå, Sweden 2013
Authors:
Lena Maria Nilsson PhD, Public Health and Clinical Medicine, Nutritional research, Umeå university, Umeå, Sweden.
Birgitta Evengård MD,PhD, prof, Div Infectious diseases, Dept Clin Microbiol, Umeå university, Umeå, Sweden
Project group:
Ann Ragnhild Broderstad MD, PhD, Center for Sami Health Research, University of Tromsø, Tromsø,Norway
Jon Oyvind Odland MD, PhD, prof, Faculty of Health Sciences, University of Tromsø, Tromsø, Norway
Jay Van Oostdam DVM, MPH, Senior Science Advisor Health Canada, present position Senior Consultant, Ottawa, Canada
Reference group:
Jim Berner MD, Senior Director for Science, Division of Community Health, Alaska Native Tribal Health Consortium, Anchorage, Alaska
Christopher Cornish Regional Director, Northern Region, Health Canada, Canada
Alexey Dudarev PhD, Dr.Med.Sc., head of hygiene department,
Northwest Public Health Research Center, St-
Petersburg, Russia
Victoria L. Edge MSc PhD, Manager, Population Health
Assessment, Epidemiology, Public Health
Agency of Canada/
Leanna Ellsworth Health and Climate Change Officer, Inuit
Circumpolar Council (ICC), Canada
Gert Mulvad, MD, Dronning Ingrids sykehus, Nuuk, Greenland
Alan Parkinson PhD, Deputy Director, Arctic Investigations Program, US Centers for Disease Control & Prevention, Anchorage, Alaska
Arja Rautio MD, PhD, professor, Thule Institute, University of Oulu, Oulu, Finland
Constantine Tikhonov MD, MHA, Chief, Surveillance and Risk Analysis, Environmental Public Health Division, First Nations and Inuit Health Branch, Health Canada.
Mary Trifonopoulos MSc, RD, Senior Nutritionist, Health Promotion and Disease Prevention Division, First Nations and Inuit Health Branch, Health Canada
--------------------
”Å ha du hört att söderut där dem hava allting
å vräka sig i äpplen å vete å rosblommer
- där hava dem int snåttra!
He jer tjänligt åt dem.”
(ur ”Hjortronlandet”, av Sara Lidman)
In English:
“And have you heard that down south, where they have everything
and revel in apples, wheat and roses
– they do not have cloudberries!
Serves them right. “
(translation: Lena Maria Nilsson)
i
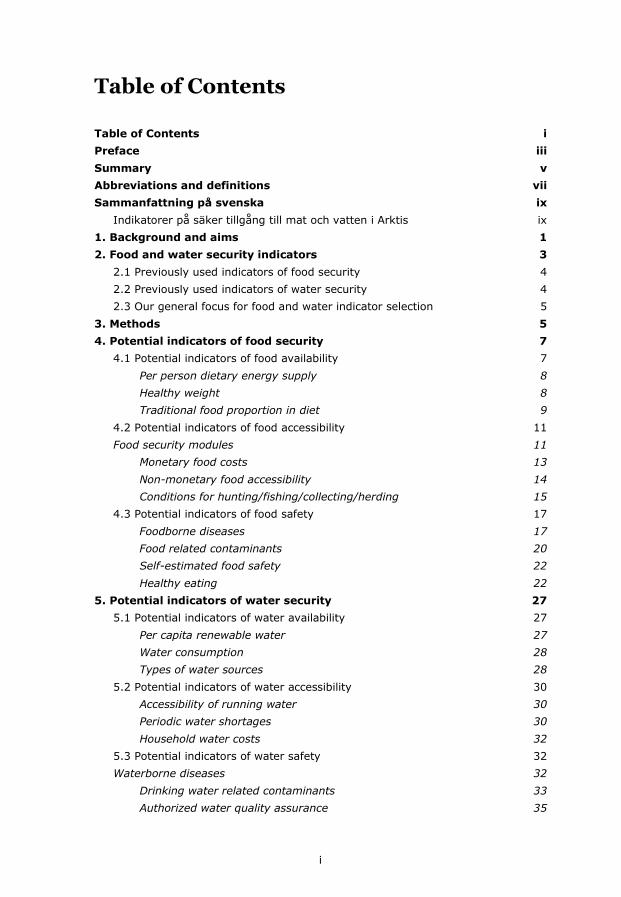
Table of Contents
Table of Contents i Preface iii Summary v Abbreviations and definitions vii Sammanfattning på svenska ix
Indikatorer på säker tillgång till mat och vatten i Arktis ix 1. Background and aims 1 2. Food and water security indicators 3
2.1 Previously used indicators of food security 4 2.2 Previously used indicators of water security 4 2.3 Our general focus for food and water indicator selection 5
3. Methods 5 4. Potential indicators of food security 7
4.1 Potential indicators of food availability 7 Per person dietary energy supply 8 Healthy weight 8 Traditional food proportion in diet 9 4.2 Potential indicators of food accessibility 11 Food security modules 11 Monetary food costs 13 Non-monetary food accessibility 14 Conditions for hunting/fishing/collecting/herding 15 4.3 Potential indicators of food safety 17 Foodborne diseases 17 Food related contaminants 20 Self-estimated food safety 22 Healthy eating 22
5. Potential indicators of water security 27 5.1 Potential indicators of water availability 27 Per capita renewable water 27 Water consumption 28 Types of water sources 28 5.2 Potential indicators of water accessibility 30 Accessibility of running water 30 Periodic water shortages 30 Household water costs 32 5.3 Potential indicators of water safety 32 Waterborne diseases 32 Drinking water related contaminants 33 Authorized water quality assurance 35
ii
Water Safety Plans (WSP) 35 6. Results and workshop discussions 37
6.1 Rationale for food security indicators promoted 37 Healthy weight, BMI, Obesity 37 Traditional food proportion in diet 37 Monetary food costs 38 Conditions for hunting/ fishing/collecting/herding 38 Food borne diseases 38 Food related contaminants 39 6.2 Rational for food security indicators for further development 39 Food security modules 39 Non-monetary food accessibility 40 Healthy eating 40 Food availability support programs 40 6.3 Rationale for food security indicators deemed to be not “feasible” 40 Per person dietary energy supply (DES) 41 Self estimated food safety 41 6.4 Rationale for water security indicators promoted 41 Per capita renewable water 41 Types of water sources 41 Accessibility of running water 41 Periodic water shortages 42 Water borne diseases 42 Drinking water related contaminants 42 Authorized water quality assurance 42 Water safety plans 42 6.5 Rational for food security indicators for further development 43 Types of water sources 43 Periodic water shortages 43 6.6 Rational for water security indicators deemed to be “not feasible” 43 Water consumption 43 Household water costs 44
7. Conclusion 45 8. Acknowledgements 47 9. References 49
iii
Preface
The Arctic context is in a state of change. These changes occur due to
global climate change, most and earliest noticeable in the North including
involvement of complex feed-back systems, but also to other drivers as
increasing political interest for the region. Economical and social drivers
affect the arctic environment and vulnerable eco-systems pass resilience and
transform into other states. Animals and humans living in the region are
already, and will continue to be affected in many ways. The many indigenous
groups in the Arctic live often close to nature, and are thus even more
vulnerable than other humans. But also societies with developed infra-
structure will be affected. Systems of different kinds need to be under
surveillance so data of high quality can be made available for policymakers
showing continuous updates of ongoing processes.
Food and water are central elements for life. During the Swedish
chairmanship of the Arctic Council food and water security was a prioritized
project and the Arctic Human Health Expert Group, SDWG/AHHEG has
collaborated with the AMAP Human Health Assessment Group,
AMAP/HHAG in a first phase of a Food and Water Security project
presented here. We also present suggestions for phase two of this project.

iv
v
Summary
The aim of this report is to provide a basis for indicator selection that is
relevant for food and water security in the circumpolar areas and which
could be used in international collaborations of surveillance in the Arctic.
Indicators used in scientific papers and in official statistics from all eight
countries involved have been considered. We found 21 potential indicators of
food and water security that could be used for further initiatives in an Arctic
health context. During an international workshop 12 of these indicators of
food security (n=6) and water security (n=6) were promoted, 5 were
considered in need of further development and 4 were rejected.
Indicators considered to be usable from an Arctic health perspective
differed from indicators in focus in international FAO discussions on food
and water security. As a first step, focusing on data already available in most
Arctic countries, we suggest a joint effort focusing on:
Healthy weight
Self estimated proportion of traditional food in diet (SLiCA
questionnaire can be used as baseline for indigenous people)
Presence of hunter/fisher/collector/herder in family/household
Cost of a nutritious food basket in relation to income
Food borne diseases – incidence rates and seroprevalence in human
Food related contaminants
Per capita renewable water
Accessibility of running water (SLiCA data can be used as baseline
for indigenous people)
Waterborne diseases – incidence rates and seroprevalence in human
Water related contaminants
Authorized water quality assurance
Water safety plans
In a second phase selected indicators of interest should be further
developed by organized expert groups. An international joint effort to collect
data from the Arctic nations and regions should then be performed, with the
aim to reduce inequality and improve the service for all Arctic people.
Continuing collaborations between the two health groups in the Arctic
Council, especially concerning food related contaminants, use of existing
biobanks, and future joint biosampling was considered necessary especially
from a food security perspective. Concrete projects will be developed as main
pillars of phase 2.

vi
vii
Abbreviations and definitions
24HR 24 hour record interview
AHHEG The Arctic Human Health Experts Group within the Arctic Council (connected to SDWG)
AMAP The Arctic Monitoring and Assessment Programme within the Arctic Council
Arctic Sweden The counties of Norrbotten and Västerbotten, Sweden
BMI Body mass index (kg/m2)
DES Per person dietary energy supply
ECDC European Centre for Disease Prevention and Control
FAO The Food and Agricultural Organization of the United Nations
FFQ Food frequency questionnaire
FSSM Food Security Survey Module
HEI Healthy Eating Index
HFSSM Household Food Security Survey Module
HHAG The Human Health Assessments Group within the Arctic Council (connected to AMAP)
IPY International Polar Year
NA Not available
NNFB National nutritious food basket (Canada)
PRO Pensionärernas riksorganisation, the Swedish National Pensioners’ Organisation
RA Restricted availability – data are available to some extent, but it involves costs and/or a lot of work to get access to it.
viii
RA/RM Risk Assessment/Risk Mangement
Sápmi The traditional Sami area in Norway, Sweden,
Finland and the Kola Peninsula of Russia.
SCB Statistics Sweden
SDWG The Sustainable Development Working Group within the Arctic Council
SLiCA A Survey of Living Conditions in the Arctic:
Inuit, Saami, and the Indigenous Peoples of
Chukotka
Swedish Sápmi The traditional Sami area of Sweden, i.e. the
counties of Norrbotten, Västerbotten, Väster-
norrland and Jämtland.
TDI provisional tolerable daily intake
OTC drugs Medicines that may be sold directly to a
consumer without a prescription from a
healthcare professional
USDA United States Department of Agriculture
WHO the World Health Organisation
WSP Water Safety Plans
ix
Sammanfattning på svenska
Indikatorer på säker tillgång till mat och vatten i Arktis
Miljögifter och global uppvärmning är ett hot mot det sårbara ekosystemet i
Arktis. I förlängningen innebär detta även ett hot mot tillgången på mat och
vatten för de människor och djur som lever här. Under det svenska
ordförandeskapet i Arktiska rådet (2011-2013) har tillgång till mat och vatten
varit en prioriterad fråga. Syftet med denna rapport är att beskriva olika
indikatorer för säker tillgång till mat och vatten som bedöms vara
användbara i ett arktiskt internationellt sammanhang.
Sverige är en del i det arktiska samarbetet, som berör en tredjedel av vår
totala landyta och 6 % av vår befolkning (det vill säga länen Norrbotten och
Västerbotten). Tillsammans med övriga arktiska länder: Finland, Ryssland,
Alaska (USA), Canada, Grönland (Danmark), Island och Norge har vi många
gemensamma angelägenheter. År 1996 bildades Arktiska rådet (Arctic
Council), där utrikesministrar och representanter för de åtta arktiska
ländernas nordligaste urfolk regelbundet samlas för att diskutera sådana
angelägenheter.
Miljögifter och global uppvärmning är centrala frågor i Arktiska rådet och
internationella expertgrupper som AHHEG/SDWG (med inriktning mot
människors hälsa och livsvillkor), och AMAP/HHAG (med inriktning mot
miljöövervakning) förbereder underlag för diskussionerna.
Indikatorer används för att visa på förändringar i samhället, både önskade
(till exempel resultatet av hälsoinriktade samhällsinsatser) och oönskade (till
exempel effekter av klimatförändringen). I en litteraturgenomgång,
identifierade vi 21 indikatorer på säker tillgång till mat och vatten, som
tidigare använts i olika arktiska sammanhang - både ur ett helhetsperspektiv
och med fokus på urbefolkningen. Vi tittade både i vetenskapliga artiklar och
i officiell statistik och i möjligaste mån försökte vi även hitta indikatorer där
uppgifter om kvinnor och män presenterades var för sig.
Tolv av dessa indikatorer klassades som direkt användbara under en
internationell workshop med experter från både AHHEG/SDWG och
AMAP/HHAG. Fem ansågs vara i behov av ytterligare utveckling och fyra
ansågs mindre värdefulla. Slutsatsen blev att Arktisk rådet bör stödja en
gemensam satsning med fokus på följande tolv indikatorer:
Hälsosam vikt
Självskattad andel av traditionell mat i kosten
x
Förekomst av jägare/fiskare/samlare/renskötare i familjerna/
hushållen
Matkostnader
Livsmedelsburna sjukdomar
Miljögifter i mat
Sötvattenreserv räknat per invånare
Tillgång till kranvatten
Vattenburna sjukdomar
Miljögifter i vatten
Andel av befolkningen som har tillgång till kvalitetssäkrat vatten.
Lagstiftning om så kallade ”Water safety plans”, som förespråkas av
WHO.
I framtiden bör expertgrupperna fortsätta utvecklingen av intressanta
indikatorer på säker tillgång till mat och vatten i Arktis. En internationell
gemensam insats bör även göras för att samla in data från nationer och
regioner, så att jämställdhet och service kan främjas för alla som lever och
bor här.
Vi förespråkar också ett fortsatt samarbete mellan de två hälsorelaterade
expertgrupperna i Arktiska rådet, särskilt när det gäller miljögifter i mat och
vatten. Vi vill särskilt peka på möjligheterna att använda befintliga
biobanker för detta syfte, eller att bygga upp nya internationella biobanker
med inriktning mot övervakning av säker tillgång till mat och vatten i Arktis.
1
1. Background and aims
Food and water security have been highlighted priority issues for Sweden
during its chairmanship of the Arctic Council 2011-2013. These determinants
of health were important issues at the Health Ministerial Meeting in Nuuk,
Greenland in February 2011. Aspects of human health being affected by the
environmental and social changes taking place in the Arctic is a very recent
perspective. The theme for the WHO Assembly in 2008 was climate change
and health - bringing the global health perspective into the debate on the
changes occurring. The Swedish Chairmanship wants to bring attention to
how health is affected in the North with the hope that this focus will continue
in following chairmanships. This is of course a very complex area, and it was
decided that Food and Water Security should be given priority, as food and
water are fundamental to human existence and more directly and rapidly
affected by environmental changes, both caused by nature, e.g. climate
change, and by human activities such as taking use of new natural resources
found in the Arctic.
The World Food Summit of 1996 defined food security as existing “when all
people at all times have access to sufficient, safe, nutritious food to
maintain a healthy and active life”(1). The concept of food security is
commonly defined as including both physical and economic access to food
that meets people's dietary needs as well as their food preferences. Thus,
food can be available but not accessible for the population as it is too
expensive or too contaminated. Food security is a complex issue and is
linked to a variety of factors.
When studying food security among indigenous populations, unique
considerations must be taken into account. This includes both traditional
and market food systems. Different subpopulations, such as hospitalized
infants and elderly people, may also have very specific nutritional needs to
take into account (e.g. (2, 3)). In this report, however, we focus on food and
water security related to general households. Water security may be defined
as when each individual has access to sufficient safe and affordable water to
satisfy their needs for drinking, washing, and livelihood (4). Thus, food and
water security is about the availability, accessibility and safety of food and
water in a complex web of factors (5).
On an international level, some attempts have been made to aggregate data
on food and water safety from different countries, for example within the
European Centre for Disease Prevention and Control (ECDC) (6). However,
since these data are not collected systematically in all countries involved, due
to for example difference in legislation, there is still a lack of overview from a
European perspective. Furthermore, no initiative has been taken so far on
2
an Arctic level to collaborate on such a project, despite the fact that the
climate change occurring in the North has substantial impact on the region.
As climate change affects the North earlier and more severely than the rest of
the globe, much can be learned by the rest of the world about mitigation and
adaptation, even if the number of people living in the North is small.
Knowledge and awareness of the importance of food and water security for
human health differs between countries and regions in the Arctic.
Documentation does, however, exist, and so there is a need for a circum-
Arctic report presenting the situation and possible solutions. There is no
comprehensive overview of the different areas and the different needs for
surveillance and problem solution. This project aims to identify areas where
intervention has been an immediate issue, and to start the discussion on
which areas intervention should be planned. The project also aims to define
challenges to be overcome in a broader perspective, including collaboration
outside the circumpolar region (e.g. effects of climate change and long-range
transport of contaminants in a circumpolar and a global perspective) leading
to a sustainable development of the field. Some Arctic regions already have
good solutions for food and water security; in other areas local ownership
and participation in finding solutions for defined problems must be
achieved. Opportunities for transferring good solutions and best practices
between areas should be assessed.
Swedish legislation requires all official data to be gender-divided and it has
been a highlight during the Swedish chairmanship that we have been able to
present gender-divided analyses. In this report, we use gender-divided data
when available and point out when no such data is available. There is
evidence that climate changes affect men and women differently and in
analysis it is necessary to include this perspective from the start (7, 8).
As a first step in this process, the aim of this report is to provide a basis for
indicator selection which is relevant for food and water security in the
circumpolar areas. We have reviewed literature published from 2000 and
onwards and official statistics for indicators used. For a future collaboration,
which would possibly include the monitoring and surveillance of change,
selected indicators could be used, and it is therefore necessary to come to a
general agreement on the value of the chosen indicators. The Swedish
chairmanship sees this first step as a technical step, starting a collaboration
where more complex dimensions of the effects of change will be investigated
and followed (5). Indicators used in scientific papers and in official statistics
are considered in this pragmatic, action-oriented initiative.
Thus, these indicators could be used to monitor change occurring in a fragile
part of the globe, in sustainable collaborations within the Arctic Council.
3
2. Food and water security indicators
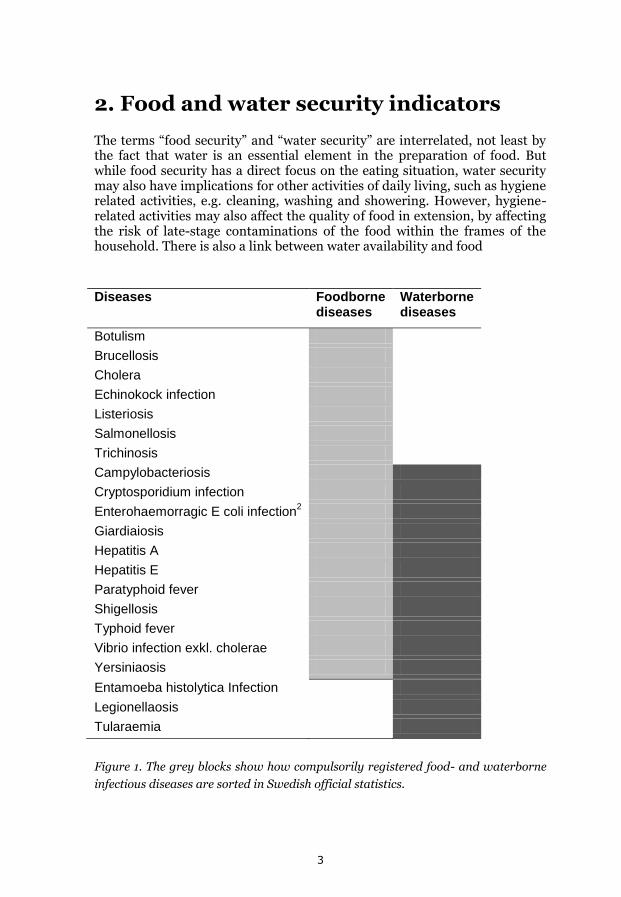
The terms “food security” and “water security” are interrelated, not least by the fact that water is an essential element in the preparation of food. But while food security has a direct focus on the eating situation, water security may also have implications for other activities of daily living, such as hygiene related activities, e.g. cleaning, washing and showering. However, hygiene-related activities may also affect the quality of food in extension, by affecting the risk of late-stage contaminations of the food within the frames of the household. There is also a link between water availability and food
Diseases Foodborne
diseases Waterborne diseases
Botulism
Brucellosis
Cholera
Echinokock infection
Listeriosis
Salmonellosis
Trichinosis
Campylobacteriosis
Cryptosporidium infection
Enterohaemorragic E coli infection2
Giardiaiosis
Hepatitis A
Hepatitis E
Paratyphoid fever
Shigellosis
Typhoid fever
Vibrio infection exkl. cholerae
Yersiniaosis
Entamoeba histolytica Infection
Legionellaosis
Tularaemia
Figure 1. The grey blocks show how compulsorily registered food- and waterborne
infectious diseases are sorted in Swedish official statistics.
4
production. Globally, agriculture represents 70% of total water use (9).
Accordingly, the World Economic Forum has described water security as
“the gossamer that links together the web of food, energy, climate,
economic growth and human security challenges that the world economy
faces over the next two decades” (10).
Food and water security may also to some extent be overlapping. For
example, in Sweden drinking water and food are both sorted under the label
“livsmedel” (a compound noun combining the words for “life” and
“resources”), which has equivalents in Danish and Finnish, but no equivalent
in English. Accordingly, water is generally described as our most important
“livsmedel” (e.g. (11)). Livsmedelsverket, the Swedish National Food Agency,
is responsible for both food and water security, and in Swedish official
statistics definitions of foodborne and waterborne diseases are overlapping
to a high extent, as shown in Figure 1.
Despite the strong interrelation, in this report we have decided to present
indicators of food and water security separately, as is also the case in most of
the scientific reporting on these two issues.
2.1 Previously used indicators of food security
Food security indicators have been defined as “summary measures of one or more of the dimensions of food security used to demonstrate change or the result of a program activity for a target population”(12). According to a technical guide from 1999, approximately 200 different definitions and 450 indicators of food security had previously been used at that time (13). Thus, it is concluded that “consequently, an important methodological problem for development practitioners is to determine which indicators are appropriate, given the project being proposed” (13). Some general measures may be more frequently used than others. For example, until 2010, food security in the world was mainly described by the World Health Organisation (WHO) by two measures: undernourishment and per person dietary energy supply (DES) (14) (Annex 2). Since 2012 the FAO uses a set of more than 20 food security indicators (14).
2.2 Previously used indicators of water security
As with food security indicators, water security indicators may be defined as “summary measures of one or more of the dimensions of water security used to demonstrate change or the result of a program activity for a target population”. As with food security, multiple definitions and indicators have also been used for water security (15) and thus, determining which indicators are appropriate in this context presents an equivalent challenge. From an availability, FAO perspective, per capita renewable water (m3 per capita) is the most widely used indicator of national water scarcity (16). From a safety
5
perspective, only 3 of 8 Arctic countries (Norway, Finland and the Russian Federation) have ratified the WHO Protocol on Water and Health (17). A part of this legally binding agreement is to identify “indicators that are designed to show how far that progress (=program related) has contributed towards preventing, controlling or reducing water-related disease.” (17).
2.3 Our general focus for food and water indicator selection
Both food and water security indicators can be divided into two main groups: direct measures and indirect measures. Direct measures includes different kinds of methods to describe the actual food or water intake on an individual or household level, as well as the perception of food and security related to seasonal shortfalls and the cultural acceptability of foods (12). Indirect measures includes factors that may be associated with food or water security, such as household size/composition, sources of household income, access to credit, sale of assets and food stores (12). In this report we will primarily describe direct and indirect indicators, that have been used previously to measure different dimensions of food and water security in a circumpolar context, i.e. indicators already described and possible to identify through a general literature search. The perspective of indigenous peoples will also be considered.
3. Methods
For the selection of indicators, the literature search was primarily based on references found in the recommended literature, included in the project plan (Appendix 1). The reports included in this list were read in a comprehensive way, focusing on headlines and illustrations related to possible indicators of food and water security. When identifying possible indicator candidates, relevant references from the reports were added to the literature list.
Some additional reference papers (including a specific search on Inuit+ food security+other food related issues) were provided from other members of the network. Furthermore, a search in the PubMed database1 based on the Arctic Health website2 was done, in which the syntax for the PubMed search was run with “food safety” exchanged by “food security” respectively “water security” in the search box, and filters for time (later than 2000-01-01), species (human) and availability (full text available) were added. As a result of this effort, 231 papers on food security and 19 on water security were identified. Papers deemed irrelevant from the PubMed search were excluded. Complementary material was also collected from the Arctic health Publications database.
1 http://www.ncbi.nlm.nih.gov/pubmed 2 http://www.arctichealth.org/healthtopicmain.php?topic_id=110
6
For foodborne diseases, specific searches of “disease”+Arctic + human were executed. A complementary search was also completed for relevant reports on food and water security from FAO and WHO, by searching on the official homepages of these organizations. Further indicators of food and water security, available through web-published official statistics in Sweden (Statistics Sweden, Swedish national institute of public health, Swedish environmental protection agency, Swedish national food agency) were also identified. The protocols of the large circumpolar SLiCA survey (A Survey of Living Conditions in the Arctic: Inuit, Saami, and the Indigenous Peoples of Chukotka) (18, 19) were also studied to identify possible food and water security related indicators.
Indicators and data described in Russian concerning 18 regions of the Russian north, Siberia and Far East, were identified through collaboration with Alexey Dudarev, head of the Hygiene Department of the Northwest Public Research Center. Russian data was identified from:
1. Regional Statistical Yearbooks, 2. Regional State Reports on “Sanitary-epidemiological situation”, 3. Federal Automatic system “Social-Hygienic Monitoring”, 4. Federal annual statistical collections “Morbidity of population of Russian
Federation”.
The indicator search was based on six Russian scientific peer-reviewed
journals (translated titles: “Hygiene and sanitation”, “Problems of nutrition”,
“Health care of the Russian Federation”, “Human ecology”, “Bulletin of the
Siberian branch of the Russian Academy of Medical Science”, “Yakutski
medical journal”. Of these, the last three were not indexed in PubMed or
other web libraries, which is why a routine search in each journal was needed
additionally as a comprehensive thematic web catalogue of Russian hygienic
literature does not yet exist (this is under development).
In order to identify food and water security indicators, focus was mainly put on the descriptions provided by the scientific abstracts/summaries and official statistics. When statistics on food security were presented in the abstracts, a further review of the methods description was also done if clarifications were needed.
The result from this indicator search (further described under the Materials A-B sections) did serve as a basis for validation, during a workshop in Stockholm December 19th – 20th 2012. Expert representatives from all eight countries participated. Official statistics was also presented in tables (partly presented in the Materials A-B sections) in order to manifest the potential feasibility of selected indicators during these discussions.
7
4. Potential indicators of food security
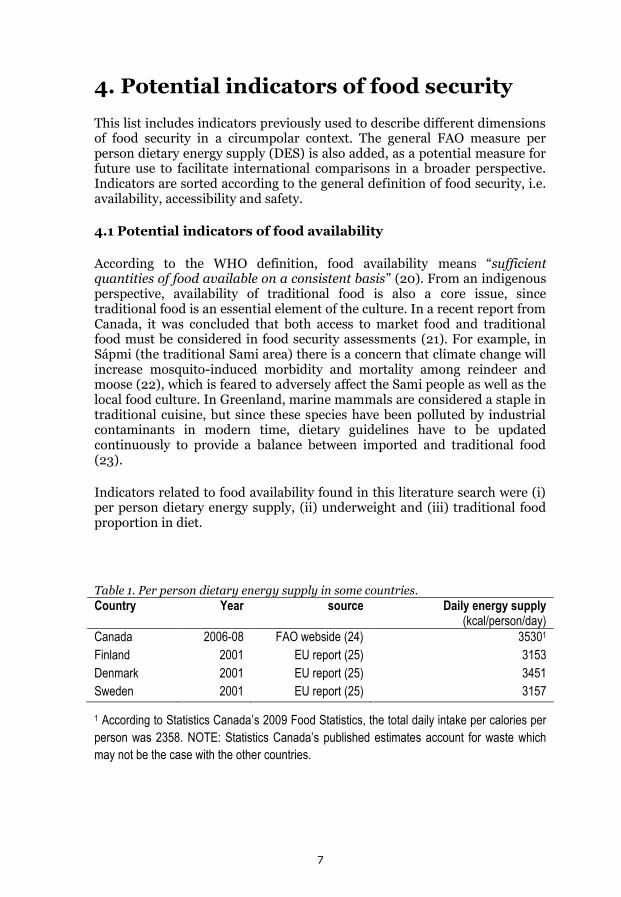
This list includes indicators previously used to describe different dimensions of food security in a circumpolar context. The general FAO measure per person dietary energy supply (DES) is also added, as a potential measure for future use to facilitate international comparisons in a broader perspective. Indicators are sorted according to the general definition of food security, i.e. availability, accessibility and safety.
4.1 Potential indicators of food availability
According to the WHO definition, food availability means “sufficient quantities of food available on a consistent basis” (20). From an indigenous perspective, availability of traditional food is also a core issue, since traditional food is an essential element of the culture. In a recent report from Canada, it was concluded that both access to market food and traditional food must be considered in food security assessments (21). For example, in Sápmi (the traditional Sami area) there is a concern that climate change will increase mosquito-induced morbidity and mortality among reindeer and moose (22), which is feared to adversely affect the Sami people as well as the local food culture. In Greenland, marine mammals are considered a staple in traditional cuisine, but since these species have been polluted by industrial contaminants in modern time, dietary guidelines have to be updated continuously to provide a balance between imported and traditional food (23).
Indicators related to food availability found in this literature search were (i) per person dietary energy supply, (ii) underweight and (iii) traditional food proportion in diet.
Table 1. Per person dietary energy supply in some countries.
Country Year source Daily energy supply (kcal/person/day)
Canada 2006-08 FAO webside (24) 35301
Finland 2001 EU report (25) 3153
Denmark 2001 EU report (25) 3451
Sweden 2001 EU report (25) 3157
1 According to Statistics Canada’s 2009 Food Statistics, the total daily intake per calories per
person was 2358. NOTE: Statistics Canada’s published estimates account for waste which
may not be the case with the other countries.
8
Per person dietary energy supply
Per person dietary energy supply (DES) is a measure of the food available for
human consumption within a certain area or population. Since not all
available food is de facto consumed – some might be wasted - there is an
overestimate built into this measure. Furthermore, the amount of household
waste has been demonstrated to increase disproportionately strongly with
rising DES levels (26). Despite this, DES is a commonly used indicator for
food security in many different FAO reports (14). In the Arctic literature, this
measure is not apparent, at least from an abstract review perspective, but on
an EU-level, a report with data based on calculations from FAOSTAT-1 for
Finland, Denmark and Sweden was found (25). Per person dietary energy
supply in different countries are shown in Table 1. The measure is available
kcal/person/day.
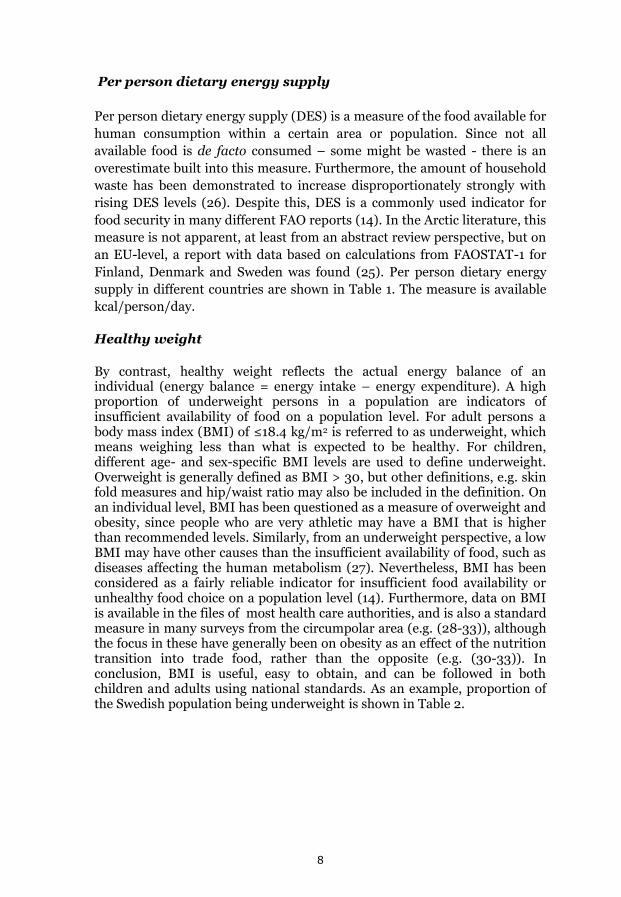
Healthy weight
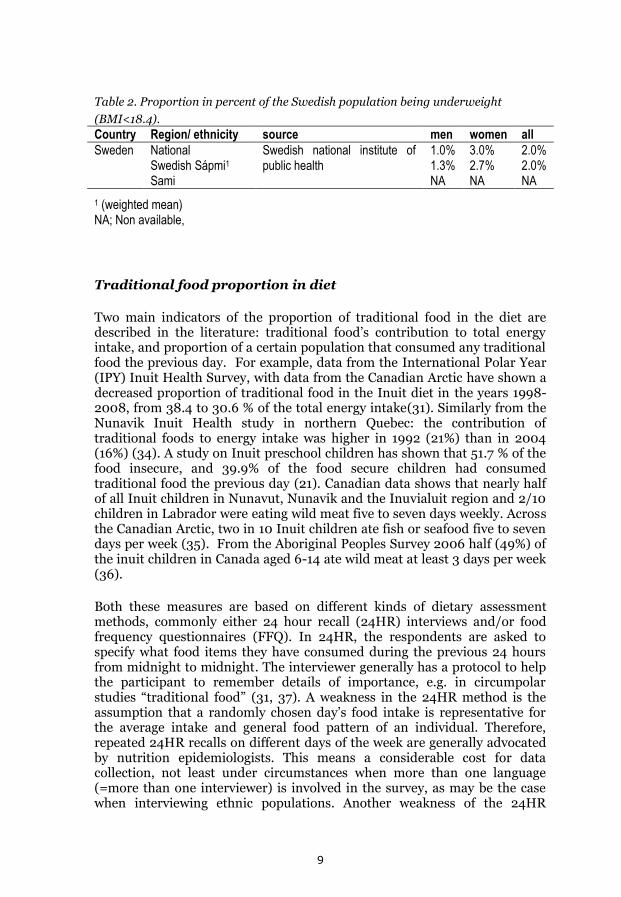
By contrast, healthy weight reflects the actual energy balance of an individual (energy balance = energy intake – energy expenditure). A high proportion of underweight persons in a population are indicators of insufficient availability of food on a population level. For adult persons a body mass index (BMI) of ≤18.4 kg/m2 is referred to as underweight, which means weighing less than what is expected to be healthy. For children, different age- and sex-specific BMI levels are used to define underweight. Overweight is generally defined as BMI > 30, but other definitions, e.g. skin fold measures and hip/waist ratio may also be included in the definition. On an individual level, BMI has been questioned as a measure of overweight and obesity, since people who are very athletic may have a BMI that is higher than recommended levels. Similarly, from an underweight perspective, a low BMI may have other causes than the insufficient availability of food, such as diseases affecting the human metabolism (27). Nevertheless, BMI has been considered as a fairly reliable indicator for insufficient food availability or unhealthy food choice on a population level (14). Furthermore, data on BMI is available in the files of most health care authorities, and is also a standard measure in many surveys from the circumpolar area (e.g. (28-33)), although the focus in these have generally been on obesity as an effect of the nutrition transition into trade food, rather than the opposite (e.g. (30-33)). In conclusion, BMI is useful, easy to obtain, and can be followed in both children and adults using national standards. As an example, proportion of the Swedish population being underweight is shown in Table 2.
9
Table 2. Proportion in percent of the Swedish population being underweight
(BMI<18.4).
Country Region/ ethnicity source men women all
Sweden National Swedish national institute of public health
1.0% 3.0% 2.0% Swedish Sápmi1 1.3% 2.7% 2.0% Sami NA NA NA
1 (weighted mean) NA; Non available,
Traditional food proportion in diet
Two main indicators of the proportion of traditional food in the diet are described in the literature: traditional food’s contribution to total energy intake, and proportion of a certain population that consumed any traditional food the previous day. For example, data from the International Polar Year (IPY) Inuit Health Survey, with data from the Canadian Arctic have shown a decreased proportion of traditional food in the Inuit diet in the years 1998-2008, from 38.4 to 30.6 % of the total energy intake(31). Similarly from the Nunavik Inuit Health study in northern Quebec: the contribution of traditional foods to energy intake was higher in 1992 (21%) than in 2004 (16%) (34). A study on Inuit preschool children has shown that 51.7 % of the food insecure, and 39.9% of the food secure children had consumed traditional food the previous day (21). Canadian data shows that nearly half of all Inuit children in Nunavut, Nunavik and the Inuvialuit region and 2/10 children in Labrador were eating wild meat five to seven days weekly. Across the Canadian Arctic, two in 10 Inuit children ate fish or seafood five to seven days per week (35). From the Aboriginal Peoples Survey 2006 half (49%) of the inuit children in Canada aged 6-14 ate wild meat at least 3 days per week (36).
Both these measures are based on different kinds of dietary assessment methods, commonly either 24 hour recall (24HR) interviews and/or food frequency questionnaires (FFQ). In 24HR, the respondents are asked to specify what food items they have consumed during the previous 24 hours from midnight to midnight. The interviewer generally has a protocol to help the participant to remember details of importance, e.g. in circumpolar studies “traditional food” (31, 37). A weakness in the 24HR method is the assumption that a randomly chosen day’s food intake is representative for the average intake and general food pattern of an individual. Therefore, repeated 24HR recalls on different days of the week are generally advocated by nutrition epidemiologists. This means a considerable cost for data collection, not least under circumstances when more than one language (=more than one interviewer) is involved in the survey, as may be the case when interviewing ethnic populations. Another weakness of the 24HR
10
method is the underreporting of food that is not consumed on a regular basis. To assess such dietary items, FFQ methodology is generally a better approach. FFQ is a cheaper, less time-consuming method, but it limits the amount of food items that can be reported. Thus, FFQs seldom reflect reliable data on total daily energy intakes, but is nevertheless considered a reliable tool for ranking individuals. In addition, FFQ is always culture-specific, which means that that it should be designed specifically for the target population (e.g. (38)), and the participants’ literacy may also dilute the results.
In the circumpolar literature there are examples of both 24HR and FFQ methodology used to reflect different kinds of proportions of traditional food in the diet from a food security perspective (21, 31, 37, 39-44). Though most of these studies only included one single 24HR, we also found examples of repeated 24HR methodology (42, 43). There were also examples where the interpretation of data from a 24HR was improved by combining the data with data from an FFQ (41).
Aside from the concept of food security, there are examples of circumpolar studies in which traditional food intake among indigenous people has been accessed in a systematic way by FFQ or 24HR methodology to a certain extent (e.g. (28, 45)).
FFQ Data from an AMAP coordinated study has been used to examine
dietary exposure to persistent organic pollutants and metals in the Russian
Arctic Chukotka, though in this study the proportion of traditional food in
the diet was not presented (46).
In the SLiCA study, an ongoing Arctic joint research project (18), self-
estimated proportions of traditional food have been assessed from
participants in eight circumpolar countries by the following question (core
questionnaire):
A39. Think about all the meat and fish your household ate in the past 12 months. How much of this meat and fish was traditional food, that is, nikipaq: none, less than half, about half, or more than half?
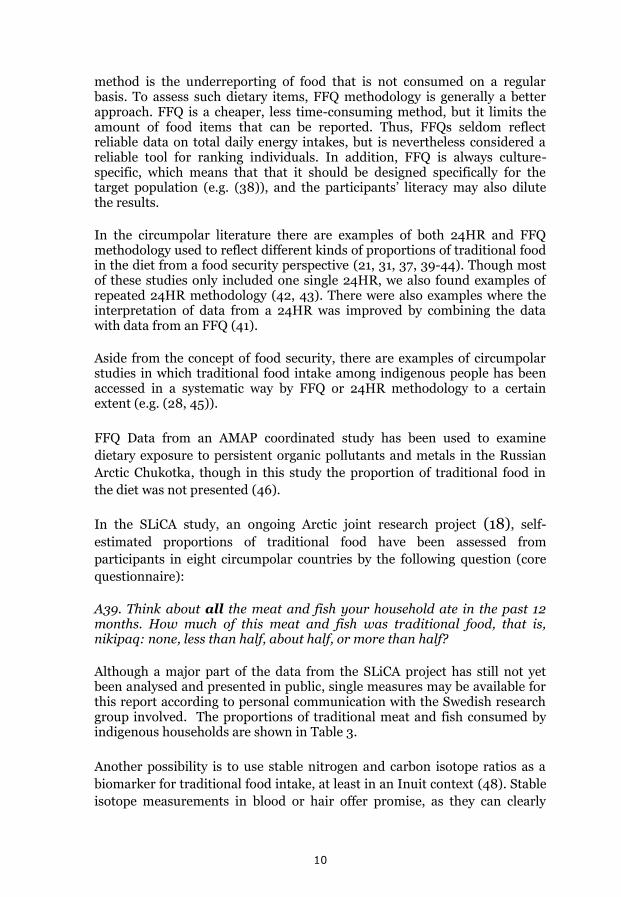
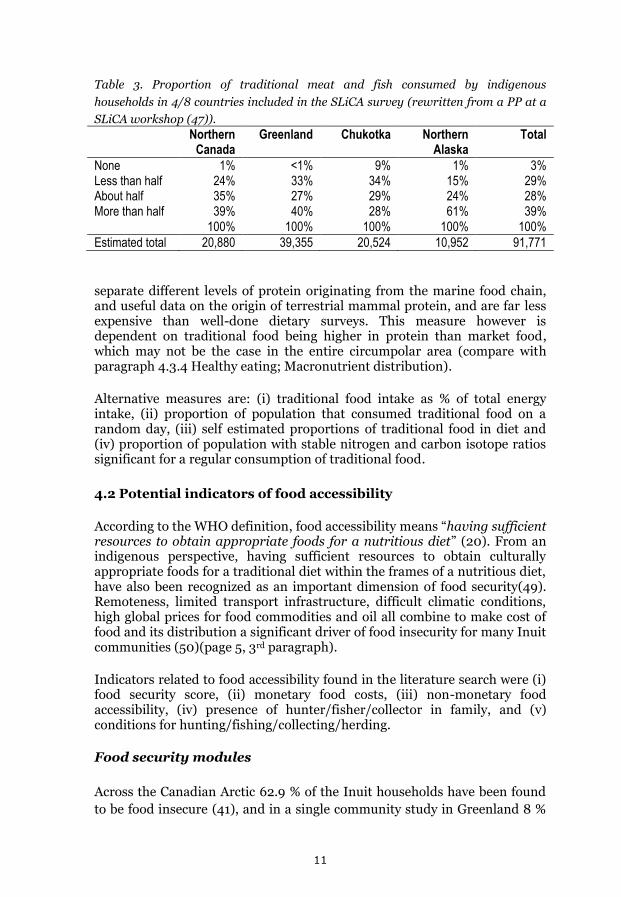
Although a major part of the data from the SLiCA project has still not yet been analysed and presented in public, single measures may be available for this report according to personal communication with the Swedish research group involved. The proportions of traditional meat and fish consumed by indigenous households are shown in Table 3.
Another possibility is to use stable nitrogen and carbon isotope ratios as a
biomarker for traditional food intake, at least in an Inuit context (48). Stable
isotope measurements in blood or hair offer promise, as they can clearly
11
Table 3. Proportion of traditional meat and fish consumed by indigenous
households in 4/8 countries included in the SLiCA survey (rewritten from a PP at a
SLiCA workshop (47)).
Northern Canada
Greenland Chukotka Northern Alaska
Total
None 1% <1% 9% 1% 3% Less than half 24% 33% 34% 15% 29% About half 35% 27% 29% 24% 28% More than half 39% 40% 28% 61% 39% 100% 100% 100% 100% 100%
Estimated total 20,880 39,355 20,524 10,952 91,771
separate different levels of protein originating from the marine food chain, and useful data on the origin of terrestrial mammal protein, and are far less expensive than well-done dietary surveys. This measure however is dependent on traditional food being higher in protein than market food, which may not be the case in the entire circumpolar area (compare with paragraph 4.3.4 Healthy eating; Macronutrient distribution).
Alternative measures are: (i) traditional food intake as % of total energy intake, (ii) proportion of population that consumed traditional food on a random day, (iii) self estimated proportions of traditional food in diet and (iv) proportion of population with stable nitrogen and carbon isotope ratios significant for a regular consumption of traditional food.
4.2 Potential indicators of food accessibility
According to the WHO definition, food accessibility means “having sufficient resources to obtain appropriate foods for a nutritious diet” (20). From an indigenous perspective, having sufficient resources to obtain culturally appropriate foods for a traditional diet within the frames of a nutritious diet, have also been recognized as an important dimension of food security(49). Remoteness, limited transport infrastructure, difficult climatic conditions, high global prices for food commodities and oil all combine to make cost of food and its distribution a significant driver of food insecurity for many Inuit communities (50)(page 5, 3rd paragraph).
Indicators related to food accessibility found in the literature search were (i) food security score, (ii) monetary food costs, (iii) non-monetary food accessibility, (iv) presence of hunter/fisher/collector in family, and (v) conditions for hunting/fishing/collecting/herding.
Food security modules
Across the Canadian Arctic 62.9 % of the Inuit households have been found
to be food insecure (41), and in a single community study in Greenland 8 %
12
(51). Both these measures are based on a similar food security survey module
(FSSM). In Nunavut, using a modified version of the United States
Department of Agriculture (USDA) Household Food Security Module
(HFSSM), 69.6 % of Inuit preschoolers have been found to reside in food
insecure households (52).
FSSMs can be seen as methods of combining different food security
indicators, focusing on the actual consumption narrative of the
individual/family, i.e. the narrative of food accessibility, into one measure.
In USA and Canada the 18-item USDA Household Food Security Survey
Module (HFSSM) is widely used to measure income-related household food
insecurity (Appendix 1). This module captures the complex and managed
process of household food insecurity and assesses such household situations
as“anxiety about the food budget or food supply; the perception that food is
inadequate in quality or quantity; reduced food intake by adults; and
reduced food intake by children” (12). Statements such as “I worried whether
my food would run out before I got money to buy more”, are graded on the
scale “was often true - sometimes true - never true during the last 12
months”.
The score is calculated by the number of affirmative answers in the questionnaire (10 questions for adults and 8 questions for children), and has been interpreted according to the following:
Adults, children, 0-1 point = food secure Adults 2-5 points, children 2-4 points = moderately food insecure Adults ≥ 6 points, children ≥ 5 points = severely food insecure
The 18-item HFSSM has been shown to be a valid measurement of food
insecurity and hunger for population and individual uses (53, 54).
For the Alberta Northern River Basin Food Consumption Survey, the 18-item HFSSM was modified by prefacing the food security statements with the phrase “Some families might say”, to make it more acceptable to the Inuit. To avoid questioning the respondent’s truthfulness, the answers were also graded on the scale “happened often - happened sometimes - happened never during the last 12 months”. Further the expression “balanced meals” was replaced by “healthy meals” (55). This modified HFSSM has been used fully or partly in other Arctic studies (e.g. (37, 41, 51, 56)).
According to Huet et al, a limitation with the HFSSM methodology is that “ it
does not take into account the use and importance of traditional foods,
harvesting practice and food-sharing systems for contribution to food
security, which includes both access to market and traditional food
13
systems”(41). Furthermore, this tool does not measure food safety,
nutritional quality or adequacy of diets, the social acceptability of food
sources, or coping strategies (12). It focuses on monetary aspects of food
insecurity rather than a broad spectrum of reasons for not having food to put
on the table, such as disability to hunt, fish or collect food because of age or
illness. The measure is number of affirmative answers in the USDA HFSSM,
0-18 points.
Monetary food costs
Monetary food costs is an important indicator of food accessibility, albeit
difficult to compare on an international level where different currencies are
involved. One way of dealing with this is to study the proportion of
disposable income that is spent on food. Then the measure will be currency
independent.
In Canada, a “national nutritious food basket” (NNFB) has been used since
1974 to monitor the cost and affordability of healthy eating (57). This food
basket has been deemed a practical proxy estimate of individual food
accessibility, since it can be implemented easily and quickly at low cost (58).
Though no directly comparable measures have been collected in different
communities, this local monitoring has shown that food costs in the
Canadian north may be even more than twice as high as in the south, (e.g.
(59, 60)).
In Sweden, volunteer elderly people from the National Pensioners’
Organisation (PRO) has regularly monitored a food basket since 1991 on a
national level (61). Contrary to the Canadian food basket, this food basket is
not based on any health pointers and it also includes some non-edible
consumables such as tooth paste and OTC drugs. In 2011, price levels for this
food basket in the Arctic part of Sweden were close to the average price levels
in Sweden (61). However, since the content of the food basket is known to
the merchants, regional variation in prices may be more likely to be found
among food items not included in the basket.
Statistics Sweden (SCB) also performs a yearly monitoring of household costs in a representative sample of households (62). In this survey, actual costs for food are monitored as well as costs for housing, leisure activities, and transportation. Though not designed to be divided into regional data, extraction of data for Arctic Sweden is possible for the period of 2007-2009. However, it is worth noticing that
participation rates are rather low (51-56%), which may affect the reliability of
the results.
14
If the cost for standardized healthy eating is preferred for international
comparisons, one such food basket has been defined in Sweden by the
Swedish Consumer Agency (Konsumentverket) for calculation of reasonable
living costs (63). This food basket is based on a four-week standard healthy
menu. It includes 190 food items and is monitored regularly in a central
Swedish city deemed to be at an average price level according to the PRO
food basket (i.e. Örebro). Theoretically, this methodology could be applied in
any city in Arctic Sweden for comparisons. According to these data, healthy
eating in the Swedish city Örebro would mean a food cost of approximately
13 % of the disposable income (own calculations).
According to Alexey Dudarev, the suitability of this indicator for Russian
regions is doubtful because costs fluctuated tremendously during the last
decade with different dispersion in different regions.
Non-monetary food accessibility
In Arctic areas, harvesting, sharing and exchanging food may also be an important part of food security. In the SLiCA survey the proportion of non-monetary accessibility to traditional food is measured by the four questions A40-43 (core questionnaire) as follows:
A40. Still thinking about all the meat and fish your household ate in the past 12 months, how much did members of your household harvest: none, less than half, about half, or more than half?
A41. This next question still concerns the traditional foods consumed by your household over the past 12 months. Did your household receive traditional food from others? a. Did your household receive traditional food in exchange for helping other households? b. Did your household receive traditional food from others, by exchanging one traditional food for another? c. Did your household receive a gift of traditional food from others?
A42. Did your household share traditional food by sending it to households in other places?
A43. Did your household pay for any of the traditional food your household ate in the past 12 months?
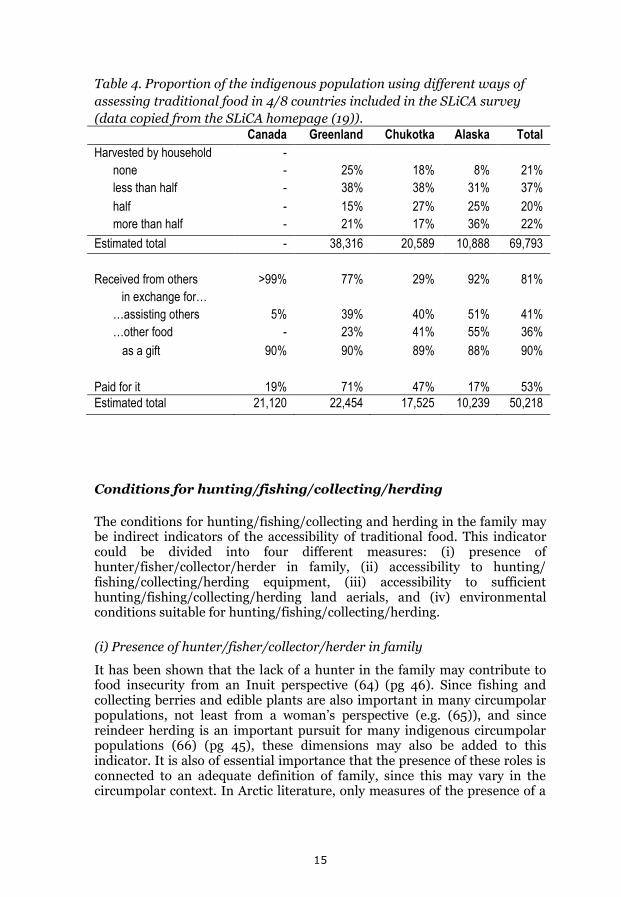
Proportion of the indigenous population using different ways of assessing
traditional food is shown in Table 4.
15
Table 4. Proportion of the indigenous population using different ways of
assessing traditional food in 4/8 countries included in the SLiCA survey
(data copied from the SLiCA homepage (19)). Canada Greenland Chukotka Alaska Total
Harvested by household -
none - 25% 18% 8% 21%
less than half - 38% 38% 31% 37%
half - 15% 27% 25% 20%
more than half - 21% 17% 36% 22%
Estimated total - 38,316 20,589 10,888 69,793
Received from others >99% 77% 29% 92% 81%
in exchange for…
…assisting others 5% 39% 40% 51% 41%
…other food - 23% 41% 55% 36%
as a gift 90% 90% 89% 88% 90%
Paid for it 19% 71% 47% 17% 53%
Estimated total 21,120 22,454 17,525 10,239 50,218
Conditions for hunting/fishing/collecting/herding
The conditions for hunting/fishing/collecting and herding in the family may be indirect indicators of the accessibility of traditional food. This indicator could be divided into four different measures: (i) presence of hunter/fisher/collector/herder in family, (ii) accessibility to hunting/ fishing/collecting/herding equipment, (iii) accessibility to sufficient hunting/fishing/collecting/herding land aerials, and (iv) environmental conditions suitable for hunting/fishing/collecting/herding.
(i) Presence of hunter/fisher/collector/herder in family
It has been shown that the lack of a hunter in the family may contribute to food insecurity from an Inuit perspective (64) (pg 46). Since fishing and collecting berries and edible plants are also important in many circumpolar populations, not least from a woman’s perspective (e.g. (65)), and since reindeer herding is an important pursuit for many indigenous circumpolar populations (66) (pg 45), these dimensions may also be added to this indicator. It is also of essential importance that the presence of these roles is connected to an adequate definition of family, since this may vary in the circumpolar context. In Arctic literature, only measures of the presence of a
16
hunter in the family is apparent from an abstract review perspective (41). The method for collecting these data is interview/ questionnaire.
The measure is % families with hunters in the population, % families with fishers in the population, % families with collectors in the population % families with herders in the population.
(ii) Accessibility to hunting/ fishing/collecting/herding equipment
Similarly as with the previous indicator, accessibility to hunting and fishing equipment has been pointed out as key elements contributing to food insecurity in a circumpolar context (64) (pg 46). And similarly, taking the female perspective into account, we have added collecting equipment to the list. In contrast to the previously described indicator, this indicator is more connected to individuals than to the family. However, it is important to stress that accessibility does not necessarily mean private ownership of equipment. For example, some people may share boats for fishing and capitalintensive investments such as cutting huts for hunting. Accessibility to consumables used in modern hunting/fishing/collection/herding, such as fuel for transportation and ammunition, may also be included in the equipment concept. In an interview study from Arctic Canada, up to 50% of the respondents indicated poor access to hunting and fishing equipment (67), but no measures of collecting equipment is mentioned on an abstract level in the literature. The method for collecting these data is interview/ questionnaire.
The measure is % of population who have access to a complete hunting equipment, % of population who have access to a complete fishing equipment, % of population who have access to a complete collecting equipment, % of population who have access to a complete herding equipment.
(iii) Accessibility to sufficient hunting/ fishing/collecting/herding land
areas
This is not an indicator found in the literature, but it is derived from the previous ones, from an ever-date discussion from an indigenous perspective. The method of collecting this data is interview/ questionnaire. The measure is % of population who have access to sufficient hunting land areas, % of population who have access to sufficient fishing land areas, % of population who have access to a sufficient collecting land areas, % of population who have access to a sufficient herding land areas.
(iv)Environmental conditions suitable for hunting/fishing/collecting/
herding
Another factor that affects the ability of Arctic people to access traditional food is environmental conditions caused by climate change, such as poor ice or snow conditions for fishing or hunting, and changed activity patterns
17
among game and reindeer (e.g.(68-70)). Though there are studies describing plausible effects of climate change on food security (22, 69-79), definite indicators of this are hard to identify. In the SLiCA study (18), a general question on perceived climate change is included (H10 g, core questionnaire), with a possibility to specify general environmental concerns in words. However, from a food security monitoring aspect a more straightforward question would be more informative, such as: “Have climate change affected environmental conditions for hunting/fishing/collecting/ herding?” (yes/no) if answer is yes, describe how it has been affected.
4.3 Potential indicators of food safety
Food safety means prevention of illness, disability, and death due to foodborne diseases, both infectious and non-communicable, such as poisoning by contaminants. In some contexts healthy eating has been considered a separate dimension of food security outside the concept of food safety. However, since unsafe food choices are inextricably linked to the causal pathway of diseases such as cancer and cardiovascular disease (80, 81), we have consequently chosen to include healthy eating as an aspect of food safety in this report.
Indicators related to food safety found in this literature search were thus (i) foodborne diseases, (ii) contaminants in food, (iii) self-estimated food safety, and (iv) healthy eating.
Foodborne diseases
It has been hypothesized that global warming may cause an increase in some
temperature-sensitive foodborne diseases, for example certain types of
gastroenteritis, paralytic shellfish poisoning and botulism in the Arctic area
(82). In Arctic populations, foodborne diseases are usually focused on
subsistence species, and diseases acquired in field dressing a hunter’s kill,
slicing, packaging, storing, selecting tissues to be consumed, and cooking
practices. All this makes the spectrum of zoonotic diseases carried in the
subsistence species likely to be acquired by the subsistence hunter and
consumer. Thus, indicators of foodborne diseases could be defined either as
(i) incidence rates of common foodborne diseases in human, (ii)
seroprevalence of foodborne diseases in human, or (iii) seroprevalence of
foodborne diseases in subsistence species.
(i) Incidence rates of foodborne diseases in human
The incidence rates of foodborne diseases must be described regionally, not
nationally, as an indicator of food safety, since regional differences may
exist. Besides a general measure on the total incidence of foodborne diseases,
18
data on foodborne diseases with special relevance from a circumpolar
perspective may be selected.
For example, foodborne botulism has been a health threat among northern
indigenous populations for centuries (83). In Alaska an average of 5.2
cases/100 000 inhabitants occur each year, which is 836 times higher than
the overall US rate (84). The main cause of the disease is consumption of
contaminated traditional fermented aquatic game foods such as fish and seal
(82), and it is hypothesized that there may be future increases in foodborne
botulism in the circumpolar area as a result of increasing temperatures and
climate change (82).
On the other hand, a decreased consumption of traditional foods by younger
Alaskan natives may decrease the incidence of botulism, in accordance with
the apparent tendency since the late 1990’s (85).
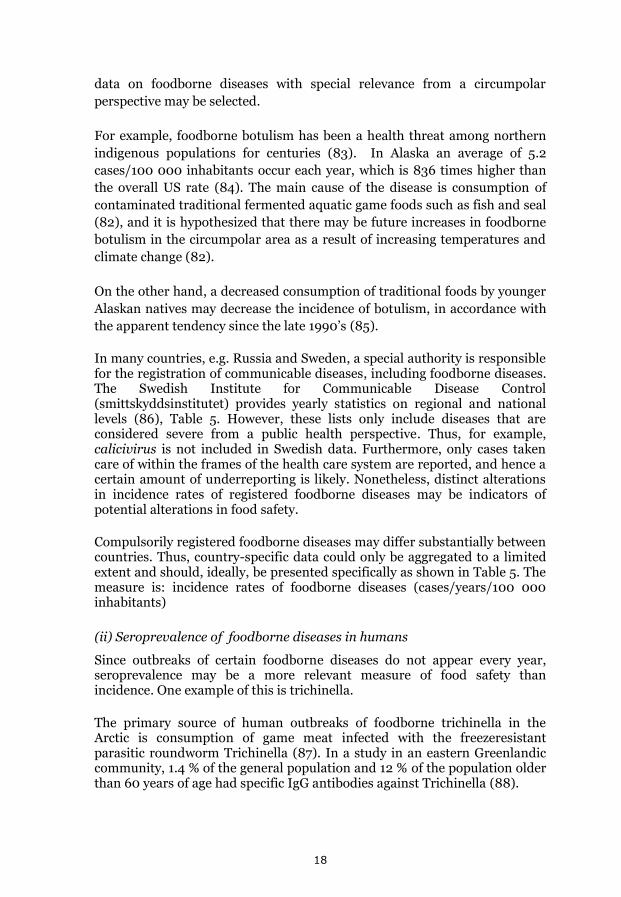
In many countries, e.g. Russia and Sweden, a special authority is responsible for the registration of communicable diseases, including foodborne diseases. The Swedish Institute for Communicable Disease Control (smittskyddsinstitutet) provides yearly statistics on regional and national levels (86), Table 5. However, these lists only include diseases that are considered severe from a public health perspective. Thus, for example, calicivirus is not included in Swedish data. Furthermore, only cases taken care of within the frames of the health care system are reported, and hence a certain amount of underreporting is likely. Nonetheless, distinct alterations in incidence rates of registered foodborne diseases may be indicators of potential alterations in food safety.
Compulsorily registered foodborne diseases may differ substantially between countries. Thus, country-specific data could only be aggregated to a limited extent and should, ideally, be presented specifically as shown in Table 5. The measure is: incidence rates of foodborne diseases (cases/years/100 000 inhabitants)
(ii) Seroprevalence of foodborne diseases in humans
Since outbreaks of certain foodborne diseases do not appear every year, seroprevalence may be a more relevant measure of food safety than incidence. One example of this is trichinella.
The primary source of human outbreaks of foodborne trichinella in the Arctic is consumption of game meat infected with the freezeresistant parasitic roundworm Trichinella (87). In a study in an eastern Greenlandic community, 1.4 % of the general population and 12 % of the population older than 60 years of age had specific IgG antibodies against Trichinella (88).
19
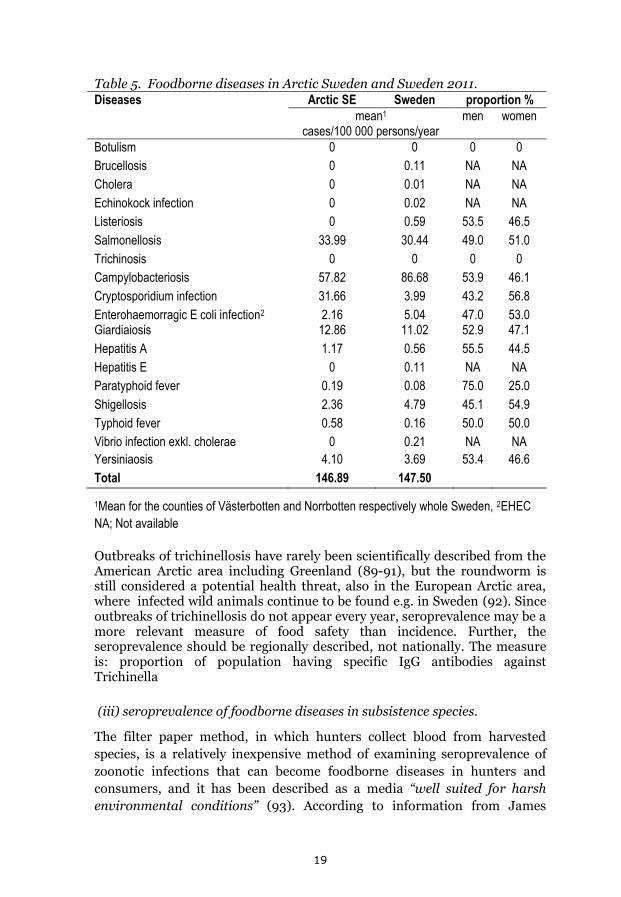
Table 5. Foodborne diseases in Arctic Sweden and Sweden 2011. Diseases Arctic SE Sweden proportion %
mean1 cases/100 000 persons/year
men women
Botulism 0 0 0 0
Brucellosis 0 0.11 NA NA
Cholera 0 0.01 NA NA
Echinokock infection 0 0.02 NA NA
Listeriosis 0 0.59 53.5 46.5
Salmonellosis 33.99 30.44 49.0 51.0
Trichinosis 0 0 0 0
Campylobacteriosis 57.82 86.68 53.9 46.1
Cryptosporidium infection 31.66 3.99 43.2 56.8
Enterohaemorragic E coli infection2 2.16 5.04 47.0 53.0 Giardiaiosis 12.86 11.02 52.9 47.1
Hepatitis A 1.17 0.56 55.5 44.5
Hepatitis E 0 0.11 NA NA
Paratyphoid fever 0.19 0.08 75.0 25.0
Shigellosis 2.36 4.79 45.1 54.9
Typhoid fever 0.58 0.16 50.0 50.0
Vibrio infection exkl. cholerae 0 0.21 NA NA
Yersiniaosis 4.10 3.69 53.4 46.6
Total 146.89 147.50
1Mean for the counties of Västerbotten and Norrbotten respectively whole Sweden, 2EHEC
NA; Not available
Outbreaks of trichinellosis have rarely been scientifically described from the American Arctic area including Greenland (89-91), but the roundworm is still considered a potential health threat, also in the European Arctic area, where infected wild animals continue to be found e.g. in Sweden (92). Since outbreaks of trichinellosis do not appear every year, seroprevalence may be a more relevant measure of food safety than incidence. Further, the seroprevalence should be regionally described, not nationally. The measure is: proportion of population having specific IgG antibodies against Trichinella
(iii) seroprevalence of foodborne diseases in subsistence species.
The filter paper method, in which hunters collect blood from harvested
species, is a relatively inexpensive method of examining seroprevalence of
zoonotic infections that can become foodborne diseases in hunters and
consumers, and it has been described as a media “well suited for harsh
environmental conditions” (93). According to information from James
20
Berner3, the AMAP Human Health Assessment Group members from
Alaska, Norway, Finland, Canada and Russia are currently planning a project
in which they aim to equip hunters to take samples of animals they kill.
These samples can then be used to follow the trends in zoonotic
seroprevalence in key subsistence species, so that appropriate advice can be
given to populations that are dependent on these animals, in order to reduce
the risk of exposure. No results from this study are available as of now.
The measure is the proportion of harvested animals that have a zoonotic
infection, which, in turn, presents a risk of infection to the hunter and
consumer
Food related contaminants
Chemical and microbiological contaminants endanger food safety, especially
in populations with a high frequency of traditional food included in their
diets. From a food security perspective different kinds of indicators may be
possible. In this report we have chosen to focus on the following: (i) chemical
contaminants in food and/or species, (ii) microbiological contaminants in
food, and (iii) chemical contaminants in human tissue.
(i) Chemical contaminants in food and/or species
Chemical contaminants endanger food safety, particularly in populations
with a high frequency of traditional food included in their diets. From a food
security perspective, different kinds of indicators may be possible. One is to
focus on measures provided by various kinds of environmental monitoring
programs, and on national threshold levels. This could be done for residues
such as pesticides, mercury and lead.
(ii) Microbiological contaminants in food
Measures of microbiological contaminants in food may also be an indicator
of food safety. For example in Russia, data on microbiological contaminants
in food is collected on a regular basis (94). Hygienic standards on
microbiological safety of foods include the following groups of
microorganisms:
microbial pathogens and agents of parasitic diseases, toxins that
cause infectious and parasitic diseases hazardous to human and
animal health - not allowed.
3 Senior Director for Science at the Alaska Native Tribal Health Consortium
21
mesophilic aerobic and facultative–anaerobic coli form bacteria of
the family Enterobacteriaceae, enterococci – not allowed;
Conditionally-pathogenic microorganisms, which include: E. coli, S.
aureus, bacteria genus Proteus, B. cereus and sulfite-reducing
clostridia, Vibrio parahaemolyticus – not allowed;
Pathogenic microorganisms including Salmonella and Listeria
monocytogenes, bacteria of the genus Yersinia - not allowed;
Spoilage microorganisms - yeasts and molds, lactic acid bacteria -
standard reflects the number of colony forming units in 1 g (ml) of
the product (CFU / g, ml);
fermentation microflora and probiotic microorganisms (lactic acid
bacteria, propionate bacteria, yeast, bifidobacteria, acidophilus
bacteria and etc.) - in products with a controlled level of
biotechnological microflora and probiotic products - standard
reflects the number of colony forming units in 1 g (ml) of the product
(CFU / g, ml);
In canned food, microorganisms that are able to grow at storage temperature
and microorganisms and microbial toxins that are dangerous to human
health are not allowed.
Regarding microbial contamination of food, data has been collected (for the
majority of regions) from a combination of food samples (from 2007-2011)
which do not meet hygienic regulations: samples contaminated by
microorganisms (when their presence are not allowed) + when
contamination exceeded the established limit (if the limit had been
established).
(iii) Chemical contaminants in human tissue
An indirect measure of “chemical contaminants food” is chemical
contaminants in human tissue, e.g. hair and blood, already described from
an Arctic perspective in a number of AMAP reports (64, 95-97). According to
the latest of these reports “The proportion of women of childbearing age
who exceed blood level guidelines for PCBs, mercury, and lead is
decreasing” (64)(pg xiii). Methylmercury in blood is associated with
consumption of fish, fish-eating mammals and birds in the circumpolar area.
This measure, with a special focus on women in childbearing age, may be an
indicator of food security from an environmental contaminant perspective.
22
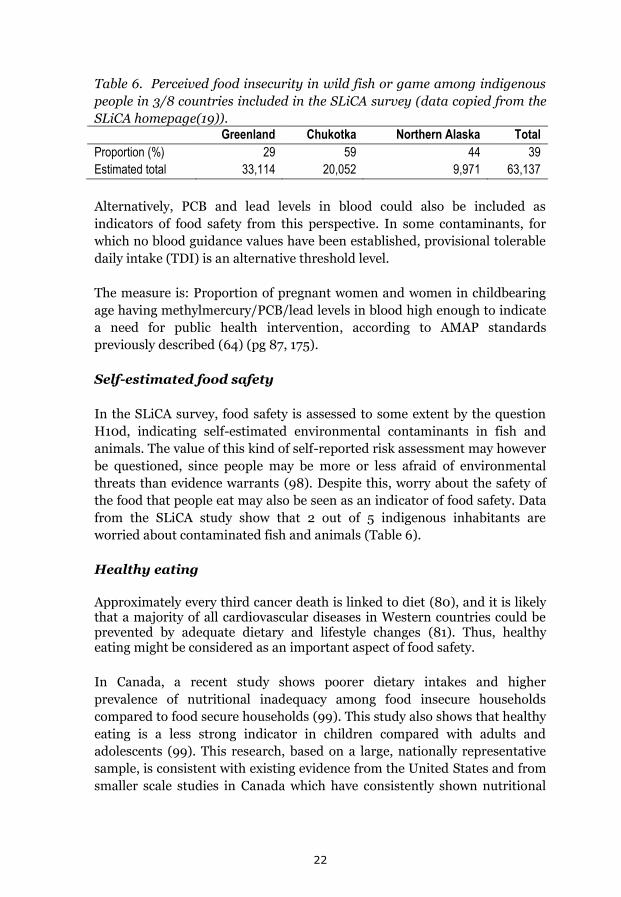
Table 6. Perceived food insecurity in wild fish or game among indigenous
people in 3/8 countries included in the SLiCA survey (data copied from the
SLiCA homepage(19)). Greenland Chukotka Northern Alaska Total
Proportion (%) 29 59 44 39
Estimated total 33,114 20,052 9,971 63,137
Alternatively, PCB and lead levels in blood could also be included as
indicators of food safety from this perspective. In some contaminants, for
which no blood guidance values have been established, provisional tolerable
daily intake (TDI) is an alternative threshold level.
The measure is: Proportion of pregnant women and women in childbearing
age having methylmercury/PCB/lead levels in blood high enough to indicate
a need for public health intervention, according to AMAP standards
previously described (64) (pg 87, 175).
Self-estimated food safety
In the SLiCA survey, food safety is assessed to some extent by the question
H10d, indicating self-estimated environmental contaminants in fish and
animals. The value of this kind of self-reported risk assessment may however
be questioned, since people may be more or less afraid of environmental
threats than evidence warrants (98). Despite this, worry about the safety of
the food that people eat may also be seen as an indicator of food safety. Data
from the SLiCA study show that 2 out of 5 indigenous inhabitants are
worried about contaminated fish and animals (Table 6).
Healthy eating
Approximately every third cancer death is linked to diet (80), and it is likely that a majority of all cardiovascular diseases in Western countries could be prevented by adequate dietary and lifestyle changes (81). Thus, healthy eating might be considered as an important aspect of food safety.
In Canada, a recent study shows poorer dietary intakes and higher
prevalence of nutritional inadequacy among food insecure households
compared to food secure households (99). This study also shows that healthy
eating is a less strong indicator in children compared with adults and
adolescents (99). This research, based on a large, nationally representative
sample, is consistent with existing evidence from the United States and from
smaller scale studies in Canada which have consistently shown nutritional
23
compromises in food insecure households, especially among adult members
(100-105).
In a study on diet quality on Greenland, it was concluded that dietary quality did not increase when consumption of traditional food decreased. The conclusion was a recommendation to improve the quality of imported food, keeping the traditional food intake level stable (106). Similarly, Canadian studies have noted that even small amounts of traditional food intake increased nutrient intakes among Inuit, and that “reduced reliance on traditional food” has been associated with increased processed market foods high in refined carbohydrates, including added sugars, saturated and trans-fat, and sodium, with consequences for diet quality and nutrient adequacy (37).
Healthy eating can be assessed in many different ways, for example by
healthy eating indexes, intake of fruit and vegetables as a proxy for healthy
eating or by estimates of proportions of macronutrients in the diet.
(i) Healthy eating index
The Healthy Eating Index (HEI) is a measure of diet quality that assesses conformance to dietary guidelines, for example as described in the USA Healthy Eating Index 1999-2000 report (107). “The HEI score is the sum of 10 components, each representing different aspects of a healthful diet:
Components 1-5 measure the degree to which a person’s diet
conforms to serving recommendations for the five major food
groups of the Food Guide Pyramid: grains (bread, cereal, rice, and
pasta), vegetables, fruits, milk (milk, yogurt, and cheese), and meat
(meat, poultry, fish, dry beans, eggs, and nuts).
Component 6 measures total fat consumption as a percentage of
total food energy (calorie) intake.
Component 7 measures saturated fat consumption as a percentage
of total food energy intake.
Component 8 measures total cholesterol intake.
Component 9 measures total sodium intake.
Component 10 examines variety in a person’s diet.
Each component of the Index has a maximum score of 10 and a minimum score of zero. Intermediate scores are computed proportionately. The maximum overall score for the 10 components combined is 100. High component scores indicate intakes close to recommended ranges or amounts; low component scores indicate less compliance with recommended ranges or amounts. An HEI score over 80 implies a “good”
24
diet, an HEI score between 51 and 80 implies a diet that “needs improvement,” and an HEI score less than 51 implies a “poor” diet.”
Generally, the diet of most western populations needs improvement from an HEI perspective, i.e. have mean HEI points below 80 (e.g. (108-110)), though levels of deviation from the recommended diet may differ. In the circumpolar area the situation is likely to be similar. For example, in a Canadian population in Montreal the mean HEI score, adapted for Canadian circumstances, was measured to 70-75 points (111), while a mean HEI score of 51-55 points was measured among Inuit in Arctic Canada (41). In the last two examples, HEI was adapted to Canadian dietary recommendations (41, 111). There is also examples where HEI has been further adapted, e.g. in relation to different age groups and dietary assessment techniques (21).
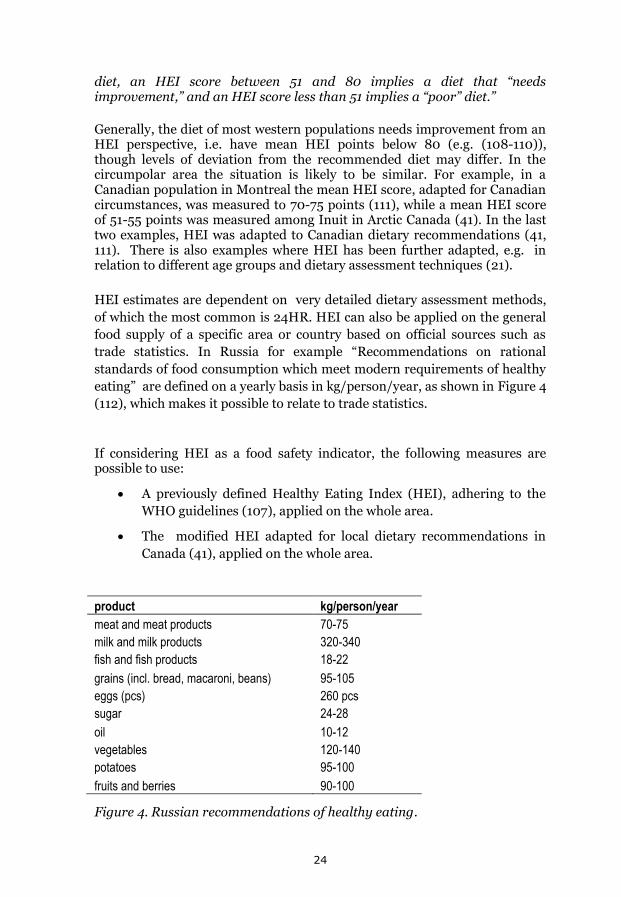
HEI estimates are dependent on very detailed dietary assessment methods,
of which the most common is 24HR. HEI can also be applied on the general
food supply of a specific area or country based on official sources such as
trade statistics. In Russia for example “Recommendations on rational
standards of food consumption which meet modern requirements of healthy
eating” are defined on a yearly basis in kg/person/year, as shown in Figure 4
(112), which makes it possible to relate to trade statistics.
If considering HEI as a food safety indicator, the following measures are possible to use:
A previously defined Healthy Eating Index (HEI), adhering to the
WHO guidelines (107), applied on the whole area.
The modified HEI adapted for local dietary recommendations in
Canada (41), applied on the whole area.
product kg/person/year
meat and meat products 70-75
milk and milk products 320-340
fish and fish products 18-22
grains (incl. bread, macaroni, beans) 95-105
eggs (pcs) 260 pcs
sugar 24-28
oil 10-12
vegetables 120-140
potatoes 95-100
fruits and berries 90-100
Figure 4. Russian recommendations of healthy eating.
25
Country-based modified HEIs, such as the Canadian, (21, 41),
Healthy Nordic Diet (113) or the Russian (97).
Locally culturally-based modified HEIs adapted for local dietary
recommendations on an ethnic level, such as the ten dietary advices
from the nutrition dietary advisory board of Greenland (114), if
present.4
The measure may be: Proportion of the population having a poor adherence to HEI, i.e. <51 HEI points.
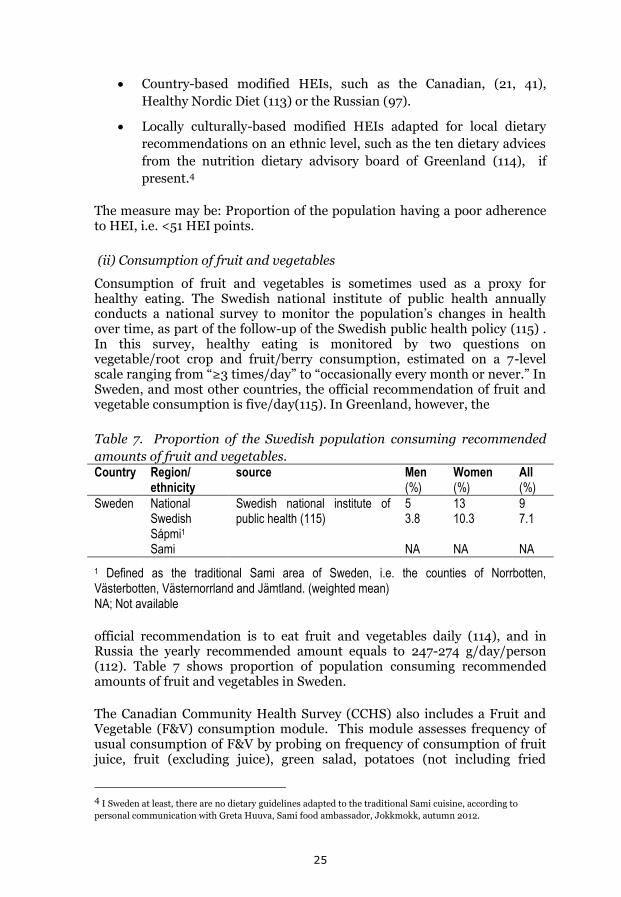
(ii) Consumption of fruit and vegetables
Consumption of fruit and vegetables is sometimes used as a proxy for healthy eating. The Swedish national institute of public health annually conducts a national survey to monitor the population’s changes in health over time, as part of the follow-up of the Swedish public health policy (115) . In this survey, healthy eating is monitored by two questions on vegetable/root crop and fruit/berry consumption, estimated on a 7-level scale ranging from “≥3 times/day” to “occasionally every month or never.” In Sweden, and most other countries, the official recommendation of fruit and vegetable consumption is five/day(115). In Greenland, however, the
Table 7. Proportion of the Swedish population consuming recommended
amounts of fruit and vegetables. Country Region/
ethnicity source Men
(%) Women (%)
All (%)
Sweden National Swedish national institute of public health (115)
5 13 9 Swedish Sápmi1
3.8 10.3 7.1
Sami NA NA NA
1 Defined as the traditional Sami area of Sweden, i.e. the counties of Norrbotten, Västerbotten, Västernorrland and Jämtland. (weighted mean) NA; Not available
official recommendation is to eat fruit and vegetables daily (114), and in Russia the yearly recommended amount equals to 247-274 g/day/person (112). Table 7 shows proportion of population consuming recommended amounts of fruit and vegetables in Sweden.
The Canadian Community Health Survey (CCHS) also includes a Fruit and Vegetable (F&V) consumption module. This module assesses frequency of usual consumption of F&V by probing on frequency of consumption of fruit juice, fruit (excluding juice), green salad, potatoes (not including fried
4 I Sweden at least, there are no dietary guidelines adapted to the traditional Sami cuisine, according to
personal communication with Greta Huuva, Sami food ambassador, Jokkmokk, autumn 2012.
26
potatoes, carrots, and any other vegetables. The module questions are currently under review. Results from the CCHS 2009-10 show significant discrepancy in frequency of fruit and vegetable consumption between Arctic Canada (4.6 times per day) and non-Arctic Canada (5.0 times per day)(116). The measure is proportion of population consuming recommended amounts of fruit and vegetables.
(iii) Macronutrient distribution
The macronutrient distribution in the diet (E% of protein, carbohydrates and fat) may also be associated with food safety. Similarly as with HEI, this measure is dependent on different kinds of dietary assessment methods, of which the most common are 24h recall and food frequency questionnaires (FFQ). From a FAO perspective, these estimates on national levels are commonly based on census data. It is also possible to apply them on data such as trade statistics. The measure is: average proportions of macronutrients in different populations’ diets.
27
5. Potential indicators of water security
This list includes indicators previously used to describe different dimensions
of water security in a circumpolar context. The general FAO measure “per
capita renewable water” is also added, to point out as a possibly future
measure to facilitate international comparisons from a broader perspective.
Indicators are sorted according to availability, accessibility and safety.
5.1 Potential indicators of water availability
In Arctic areas, humans rely in many ways on surface water for water supply (117). The continued degradation of permafrost due to global warming is feared to have a significant impact on water availability in many parts of the circumpolar area (78, 117). Moreover, there may be a seasonal variation in availability, which must be taken into account when assessing water availability in this area. Indicators of water availability defined in this study were: (i) per capita renewable water, (ii) water consumption, and (iii) types of water sources.
Per capita renewable water
Per capita renewable water is a measure that was primarily based on estimates of the number of people that can live reasonably with a certain unit of water resources (16), i.e. internal freshwater resources (internal river flows and groundwater from rainfall) in the country. If renewable water resources are <500 m3 per capita and year, countries or regions are considered to be facing “absolute water scarcity”. If renewable water resources are between 500 and 1 000 m3 per capita and year, the diagnosis is “chronic water shortage”, and between 1 000 and 1 700 m3 per capita and year it is labeled “regular water stress”(16).
Though this measure is widely used because of its simplicity, it has the disadvantage of ignoring seasonal variability of water available for consumption and the potential for water recycling. Moreover, in large countries with strong regional variations, the mean per capita renewable water should rather be presented by region than as a country-based average (16). For example, from a country perspective, there is no general water scarcity in the circumpolar region over the total year (Table 8):
Though it is well known that the abundant water supplies within the Arctic area is not “readily available in sufficient quantity and quality for the Arctic’s inhabitants”(66)(pg 137), we did not find any regional data describing seasonal variation in internal freshwater resources per capita in the circumpolar area. The measure is: m3 per capita and year.
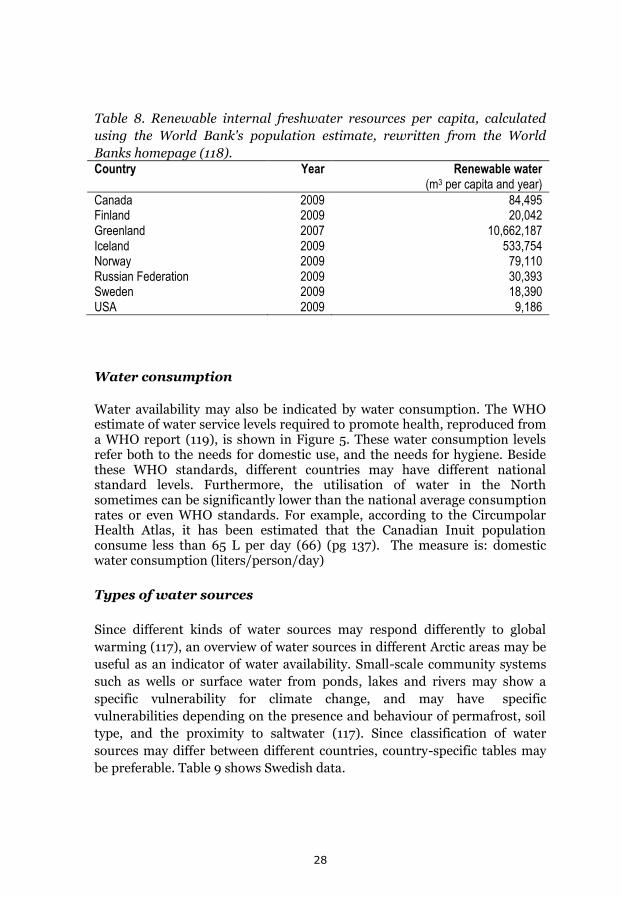
28
Table 8. Renewable internal freshwater resources per capita, calculated
using the World Bank's population estimate, rewritten from the World
Banks homepage (118). Country Year Renewable water
(m3 per capita and year)
Canada 2009 84,495 Finland 2009 20,042 Greenland 2007 10,662,187 Iceland 2009 533,754 Norway 2009 79,110 Russian Federation 2009 30,393 Sweden 2009 18,390 USA 2009 9,186
Water consumption
Water availability may also be indicated by water consumption. The WHO estimate of water service levels required to promote health, reproduced from a WHO report (119), is shown in Figure 5. These water consumption levels refer both to the needs for domestic use, and the needs for hygiene. Beside these WHO standards, different countries may have different national standard levels. Furthermore, the utilisation of water in the North sometimes can be significantly lower than the national average consumption rates or even WHO standards. For example, according to the Circumpolar Health Atlas, it has been estimated that the Canadian Inuit population consume less than 65 L per day (66) (pg 137). The measure is: domestic water consumption (liters/person/day)
Types of water sources
Since different kinds of water sources may respond differently to global
warming (117), an overview of water sources in different Arctic areas may be
useful as an indicator of water availability. Small-scale community systems
such as wells or surface water from ponds, lakes and rivers may show a
specific vulnerability for climate change, and may have specific
vulnerabilities depending on the presence and behaviour of permafrost, soil
type, and the proximity to saltwater (117). Since classification of water
sources may differ between different countries, country-specific tables may
be preferable. Table 9 shows Swedish data.
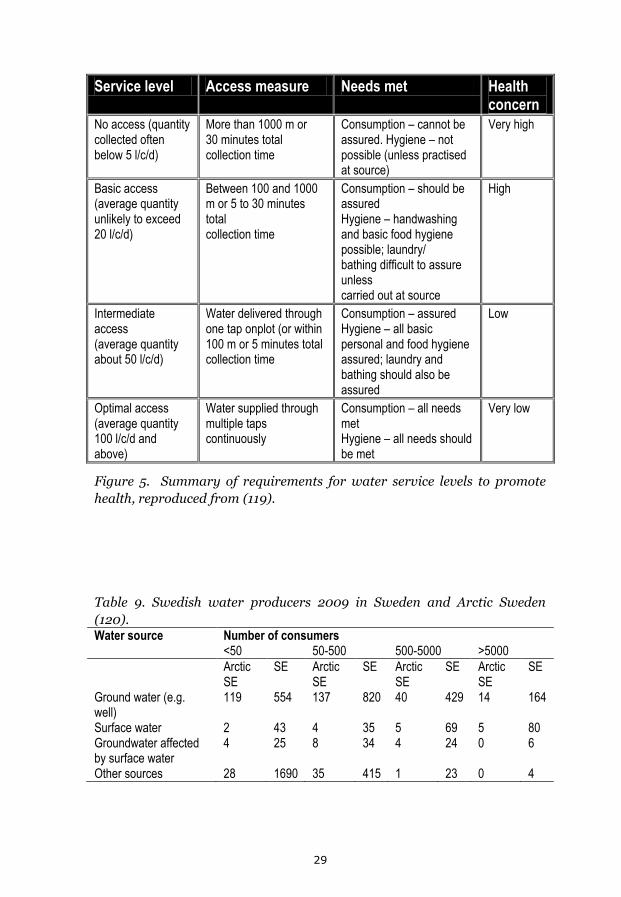
29
Service level Access measure Needs met Health concern
No access (quantity collected often below 5 l/c/d)
More than 1000 m or 30 minutes total collection time
Consumption – cannot be assured. Hygiene – not possible (unless practised at source)
Very high
Basic access (average quantity unlikely to exceed 20 l/c/d)
Between 100 and 1000 m or 5 to 30 minutes total collection time
Consumption – should be assured Hygiene – handwashing and basic food hygiene possible; laundry/ bathing difficult to assure unless carried out at source
High
Intermediate access (average quantity about 50 l/c/d)
Water delivered through one tap onplot (or within 100 m or 5 minutes total collection time
Consumption – assured Hygiene – all basic personal and food hygiene assured; laundry and bathing should also be assured
Low
Optimal access (average quantity 100 l/c/d and above)
Water supplied through multiple taps continuously
Consumption – all needs met Hygiene – all needs should be met
Very low
Figure 5. Summary of requirements for water service levels to promote
health, reproduced from (119).
Table 9. Swedish water producers 2009 in Sweden and Arctic Sweden
(120). Water source Number of consumers <50 50-500 500-5000 >5000
Arctic SE
SE Arctic SE
SE Arctic SE
SE Arctic SE
SE
Ground water (e.g. well)
119 554 137 820 40 429 14 164
Surface water 2 43 4 35 5 69 5 80 Groundwater affected by surface water
4 25 8 34 4 24 0 6
Other sources 28 1690 35 415 1 23 0 4
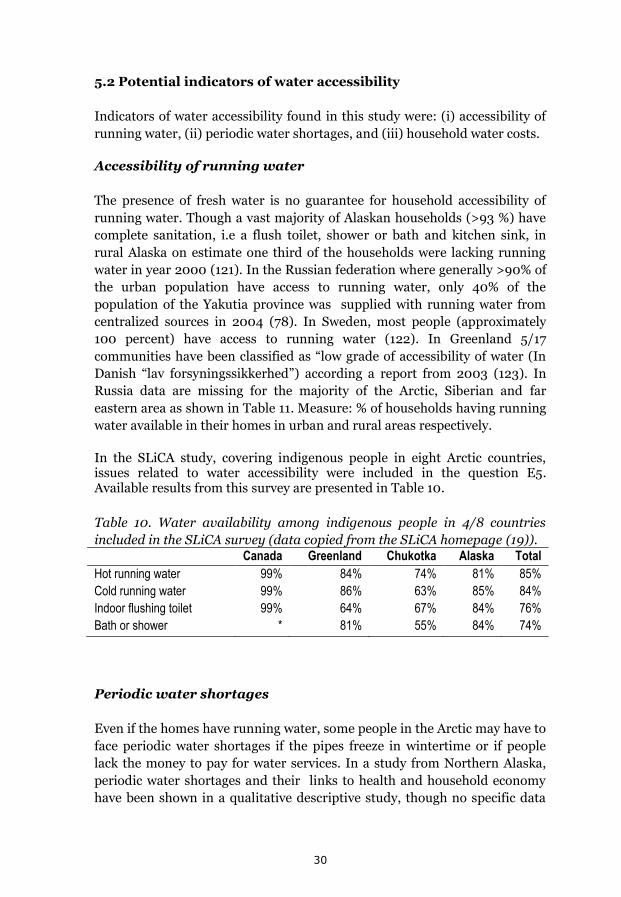
30
5.2 Potential indicators of water accessibility
Indicators of water accessibility found in this study were: (i) accessibility of
running water, (ii) periodic water shortages, and (iii) household water costs.
Accessibility of running water
The presence of fresh water is no guarantee for household accessibility of
running water. Though a vast majority of Alaskan households (>93 %) have
complete sanitation, i.e a flush toilet, shower or bath and kitchen sink, in
rural Alaska on estimate one third of the households were lacking running
water in year 2000 (121). In the Russian federation where generally >90% of
the urban population have access to running water, only 40% of the
population of the Yakutia province was supplied with running water from
centralized sources in 2004 (78). In Sweden, most people (approximately
100 percent) have access to running water (122). In Greenland 5/17
communities have been classified as “low grade of accessibility of water (In
Danish “lav forsyningssikkerhed”) according a report from 2003 (123). In
Russia data are missing for the majority of the Arctic, Siberian and far
eastern area as shown in Table 11. Measure: % of households having running
water available in their homes in urban and rural areas respectively.
In the SLiCA study, covering indigenous people in eight Arctic countries, issues related to water accessibility were included in the question E5. Available results from this survey are presented in Table 10.
Table 10. Water availability among indigenous people in 4/8 countries
included in the SLiCA survey (data copied from the SLiCA homepage (19)). Canada Greenland Chukotka Alaska Total
Hot running water 99% 84% 74% 81% 85%
Cold running water 99% 86% 63% 85% 84%
Indoor flushing toilet 99% 64% 67% 84% 76%
Bath or shower * 81% 55% 84% 74%
Periodic water shortages
Even if the homes have running water, some people in the Arctic may have to
face periodic water shortages if the pipes freeze in wintertime or if people
lack the money to pay for water services. In a study from Northern Alaska,
periodic water shortages and their links to health and household economy
have been shown in a qualitative descriptive study, though no specific data
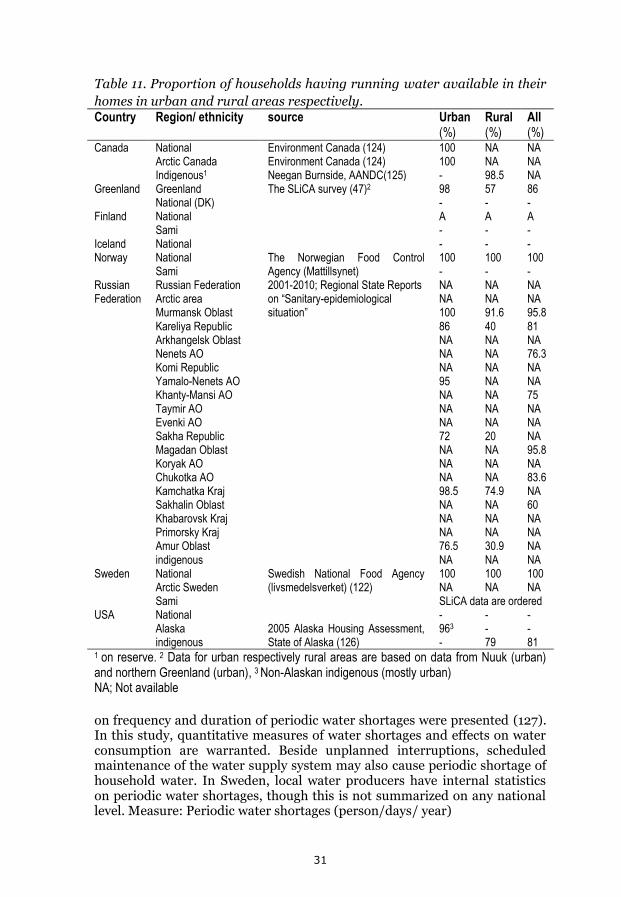
31
Table 11. Proportion of households having running water available in their
homes in urban and rural areas respectively. Country Region/ ethnicity source Urban
(%) Rural (%)
All (%)
Canada National Environment Canada (124) 100 NA NA Arctic Canada Environment Canada (124) 100 NA NA Indigenous1 Neegan Burnside, AANDC(125) - 98.5 NA
Greenland Greenland The SLiCA survey (47)2 98 57 86 National (DK) - - -
Finland National A A A Sami - - -
Iceland National - - - Norway National The Norwegian Food Control
Agency (Mattillsynet) 100 100 100
Sami - - - Russian Federation
Russian Federation Arctic area Murmansk Oblast Kareliya Republic Arkhangelsk Oblast Nenets AO Komi Republic Yamalo-Nenets AO Khanty-Mansi AO Taymir AO Evenki AO Sakha Republic Magadan Oblast Koryak AO Chukotka AO Kamchatka Kraj Sakhalin Oblast Khabarovsk Kraj Primorsky Kraj Amur Oblast
2001-2010; Regional State Reports on “Sanitary-epidemiological situation”
NA NA 100 86 NA NA NA 95 NA NA NA 72 NA NA NA 98.5 NA NA NA 76.5
NA NA 91.6 40 NA NA NA NA NA NA NA 20 NA NA NA 74.9 NA NA NA 30.9
NA NA 95.8 81 NA 76.3 NA NA 75 NA NA NA 95.8 NA 83.6 NA 60 NA NA NA
indigenous NA NA NA Sweden National Swedish National Food Agency
(livsmedelsverket) (122) 100 100 100
Arctic Sweden NA NA NA Sami SLiCA data are ordered
USA National 2005 Alaska Housing Assessment, State of Alaska (126)
- - - Alaska 963 - - indigenous - 79 81
1 on reserve. 2 Data for urban respectively rural areas are based on data from Nuuk (urban) and northern Greenland (urban), 3 Non-Alaskan indigenous (mostly urban) NA; Not available
on frequency and duration of periodic water shortages were presented (127). In this study, quantitative measures of water shortages and effects on water consumption are warranted. Beside unplanned interruptions, scheduled maintenance of the water supply system may also cause periodic shortage of household water. In Sweden, local water producers have internal statistics on periodic water shortages, though this is not summarized on any national level. Measure: Periodic water shortages (person/days/ year)
32
Household water costs
Water prices may also reflect accessibility. For example, it has previously been demonstrated how increases in energy costs have led to decreased domestic water access in Alaska (127).
The way water is paid for may vary between different communities and countries. In a study from Alaska, it was described that there was a fixed fee for water and sewer, and that this fee was dependent on total production costs. Thus, when pipes were frozen, the fee could be raised, and a prize of $150 per month was mentioned as extremely high (127). In Sweden, prizes are based on quantities consumed and local production costs (128). For comparisons between different communities, two standard household types are generally presented as follows:
Household type 1: Lives in a single house without pavement with 5
rooms, 1 kitchen, 1 bath, 2 flush toilets, and 1 garage. Water
consumption is 150 m3/year.
Household type 2: Lives in a multifamily house with 15 apartments.
Total water consumption for the multifamily house is 2000 m3/year.
Measure is median (maximum, minimum) water cost per household
and year as a proportion of disposable income.
5.3 Potential indicators of water safety
According to WHO, around 6% of the global burden of disease is related to
water, and it is estimated that “water, sanitation and health intervention
typically reduces diarrhoeal diseases by 15–30%, and significantly reduces
other diseases” (129). Indicators of water safety found in this study were (i)
incidence rate of waterborne infectious diseases, (ii) contaminants in
drinking water, (iii) access of authorized quality assured water, and (iv)
national implementation of water security plans according to WHO.
Waterborne diseases
According to WHO, water-related disease means “any significant adverse
effects on human health, such as death, disability, illness or disorders,
caused directly or indirectly by the condition, or changes in the quantity or
quality, of any waters” (17). Waterborne infectious diseases have been
reported from many Arctic countries (131-136), and it has been suggested
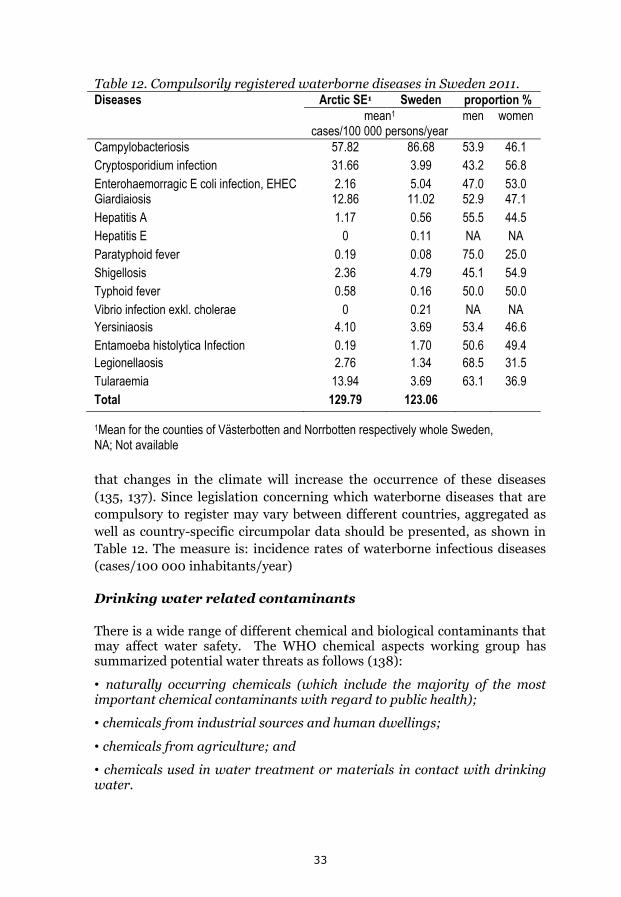
33
Table 12. Compulsorily registered waterborne diseases in Sweden 2011. Diseases Arctic SE1 Sweden proportion %
mean1 cases/100 000 persons/year
men women
Campylobacteriosis 57.82 86.68 53.9 46.1
Cryptosporidium infection 31.66 3.99 43.2 56.8
Enterohaemorragic E coli infection, EHEC 2.16 5.04 47.0 53.0 Giardiaiosis 12.86 11.02 52.9 47.1
Hepatitis A 1.17 0.56 55.5 44.5
Hepatitis E 0 0.11 NA NA
Paratyphoid fever 0.19 0.08 75.0 25.0
Shigellosis 2.36 4.79 45.1 54.9
Typhoid fever 0.58 0.16 50.0 50.0
Vibrio infection exkl. cholerae 0 0.21 NA NA
Yersiniaosis 4.10 3.69 53.4 46.6
Entamoeba histolytica Infection 0.19 1.70 50.6 49.4
Legionellaosis 2.76 1.34 68.5 31.5
Tularaemia 13.94 3.69 63.1 36.9
Total 129.79 123.06
1Mean for the counties of Västerbotten and Norrbotten respectively whole Sweden, NA; Not available
that changes in the climate will increase the occurrence of these diseases
(135, 137). Since legislation concerning which waterborne diseases that are
compulsory to register may vary between different countries, aggregated as
well as country-specific circumpolar data should be presented, as shown in
Table 12. The measure is: incidence rates of waterborne infectious diseases
(cases/100 000 inhabitants/year)
Drinking water related contaminants
There is a wide range of different chemical and biological contaminants that may affect water safety. The WHO chemical aspects working group has summarized potential water threats as follows (138):
• naturally occurring chemicals (which include the majority of the most important chemical contaminants with regard to public health);
• chemicals from industrial sources and human dwellings;
• chemicals from agriculture; and
• chemicals used in water treatment or materials in contact with drinking water.
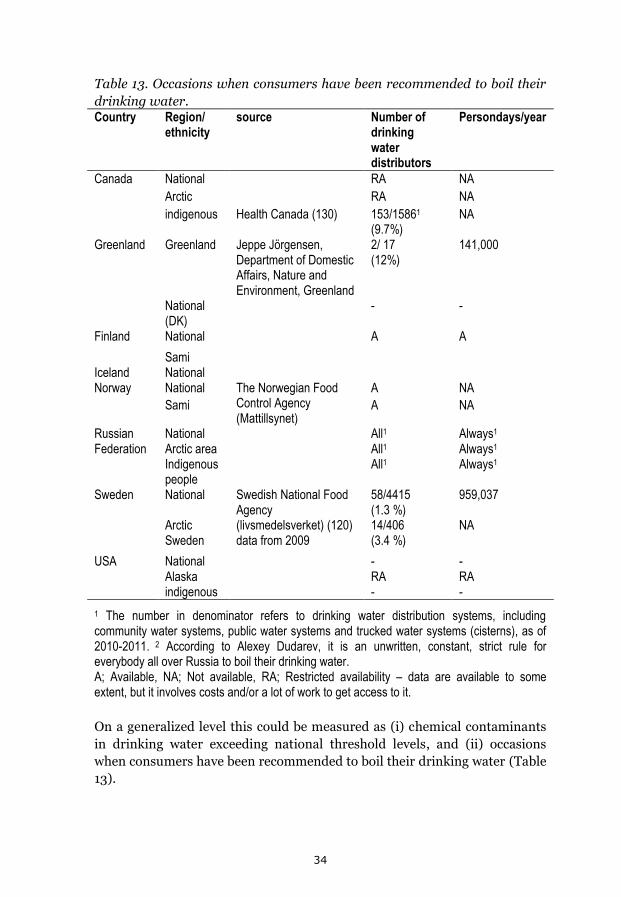
34
Table 13. Occasions when consumers have been recommended to boil their
drinking water. Country Region/
ethnicity source Number of
drinking water distributors
Persondays/year
Canada National RA NA
Arctic RA NA
indigenous Health Canada (130) 153/15861
(9.7%) NA
Greenland Greenland Jeppe Jörgensen, Department of Domestic Affairs, Nature and Environment, Greenland
2/ 17 (12%)
141,000
National (DK)
- -
Finland National A A
Sami Iceland National Norway National The Norwegian Food
Control Agency (Mattillsynet)
A NA
Sami A NA
Russian Federation
National All1 Always1 Arctic area All1 Always1 Indigenous people
All1 Always1
Sweden National Swedish National Food Agency (livsmedelsverket) (120) data from 2009
58/4415 (1.3 %)
959,037
Arctic Sweden
14/406 (3.4 %)
NA
USA National - - Alaska RA RA indigenous - -
1 The number in denominator refers to drinking water distribution systems, including community water systems, public water systems and trucked water systems (cisterns), as of 2010-2011. 2 According to Alexey Dudarev, it is an unwritten, constant, strict rule for everybody all over Russia to boil their drinking water. A; Available, NA; Not available, RA; Restricted availability – data are available to some extent, but it involves costs and/or a lot of work to get access to it.
On a generalized level this could be measured as (i) chemical contaminants
in drinking water exceeding national threshold levels, and (ii) occasions
when consumers have been recommended to boil their drinking water (Table
13).
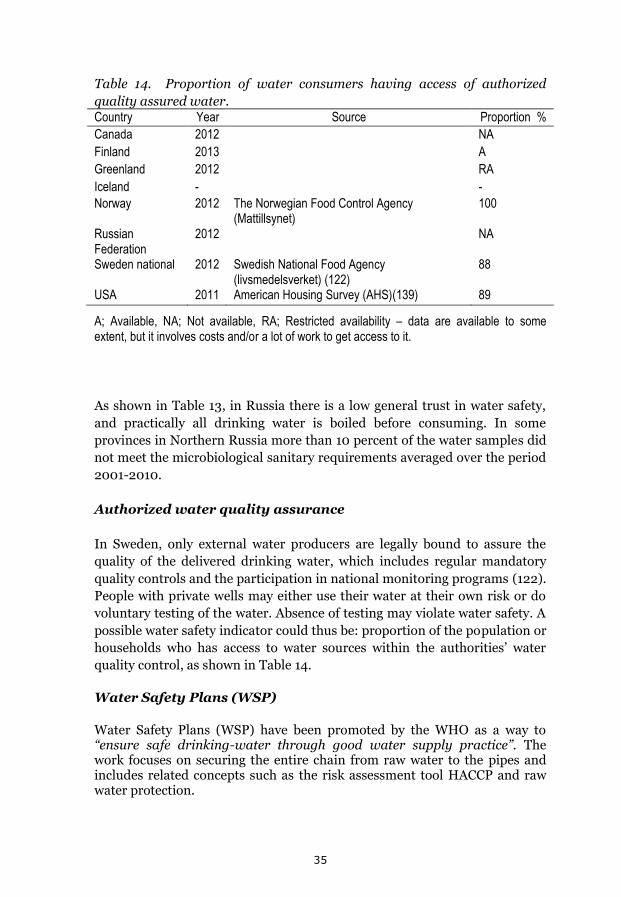
35
Table 14. Proportion of water consumers having access of authorized
quality assured water. Country Year Source Proportion %
Canada 2012 NA
Finland 2013 A
Greenland 2012 RA
Iceland - -
Norway 2012 The Norwegian Food Control Agency (Mattillsynet)
100
Russian Federation
2012 NA
Sweden national 2012 Swedish National Food Agency (livsmedelsverket) (122)
88
USA 2011 American Housing Survey (AHS)(139) 89
A; Available, NA; Not available, RA; Restricted availability – data are available to some extent, but it involves costs and/or a lot of work to get access to it.
As shown in Table 13, in Russia there is a low general trust in water safety,
and practically all drinking water is boiled before consuming. In some
provinces in Northern Russia more than 10 percent of the water samples did
not meet the microbiological sanitary requirements averaged over the period
2001-2010.
Authorized water quality assurance
In Sweden, only external water producers are legally bound to assure the
quality of the delivered drinking water, which includes regular mandatory
quality controls and the participation in national monitoring programs (122).
People with private wells may either use their water at their own risk or do
voluntary testing of the water. Absence of testing may violate water safety. A
possible water safety indicator could thus be: proportion of the population or
households who has access to water sources within the authorities’ water
quality control, as shown in Table 14.
Water Safety Plans (WSP)
Water Safety Plans (WSP) have been promoted by the WHO as a way to “ensure safe drinking-water through good water supply practice”. The work focuses on securing the entire chain from raw water to the pipes and includes related concepts such as the risk assessment tool HACCP and raw water protection.
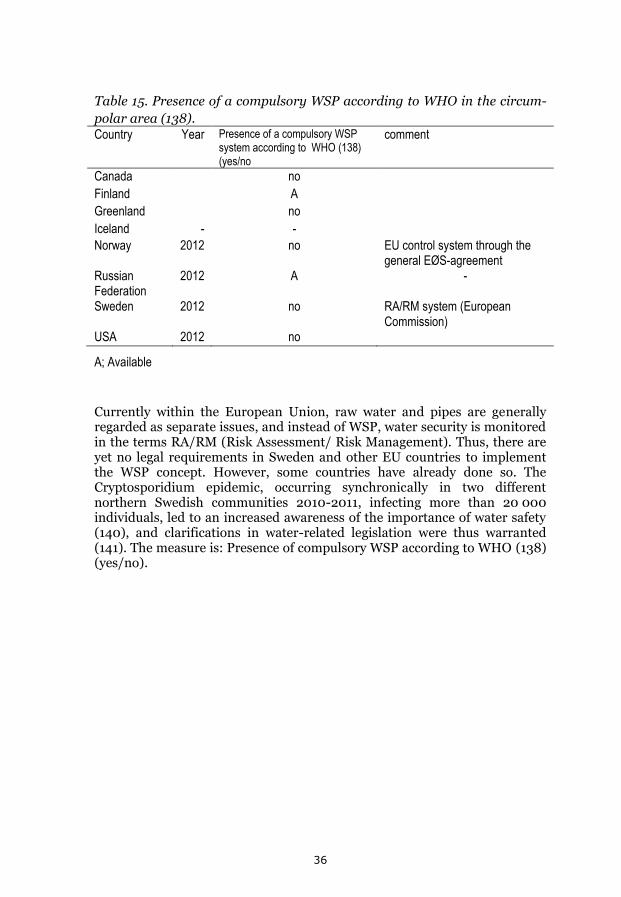
36
Table 15. Presence of a compulsory WSP according to WHO in the circum-
polar area (138). Country Year Presence of a compulsory WSP
system according to WHO (138) (yes/no
comment
Canada no
Finland A
Greenland no
Iceland - -
Norway 2012 no EU control system through the general EØS-agreement
Russian Federation
2012 A -
Sweden 2012 no RA/RM system (European Commission)
USA 2012 no
A; Available
Currently within the European Union, raw water and pipes are generally regarded as separate issues, and instead of WSP, water security is monitored in the terms RA/RM (Risk Assessment/ Risk Management). Thus, there are yet no legal requirements in Sweden and other EU countries to implement the WSP concept. However, some countries have already done so. The Cryptosporidium epidemic, occurring synchronically in two different northern Swedish communities 2010-2011, infecting more than 20 000 individuals, led to an increased awareness of the importance of water safety (140), and clarifications in water-related legislation were thus warranted (141). The measure is: Presence of compulsory WSP according to WHO (138) (yes/no).
37
6. Results and workshop discussions
The results of the workshop discussions on potential indicators of food and
water security are summarized in the following paragraphs. Of 11 suggested
indicators of food security, 6 were promoted, 3 were considered in need of
further development and 2 were disapproved. Of 10 suggested indicators of
water security, 6 were promoted, 2 were considered in need of further
development and 2 were disapproved.
6.1 Rationale for food security indicators promoted
The arguments for promoting 6 indicators of food security are briefly
summarized in the following paragraphs.
Healthy weight, BMI, Obesity
BMI is a universally used measure, it is easy to calculate and is likely
abundantly collected at least in children all over the Circumpolar area.
Obesity is an alternative measure, if for example some areas use alternative
measures of metabolic imbalances, e.g. skin fold measures. Both obesity and
BMI was considered measures with a relatively high information value to a
relatively low cost.
Excluded:
Underweight was not promoted as a measure of healthy weight, since
underweight is not a general problem in the Arctic area.
Traditional food proportion in diet
The proportion of traditional food in the diet was considered a useful
indicator of traditional food security, provided that comparable surveys are
used, and that these surveys are regularly repeated. The measures promoted
were “self estimated proportion of traditional food in diet”, and “proportion
eating traditional food the previous day and week”. It was stressed that a
single measure of traditional food in diet the previous day may be biased.
Though all measures of traditional food proportion in diet were considered
to have a moderate information value from a food security perspective and
data collection cost were estimated to be relatively high, the workshop
promoted surveying this indicator, since this indicator also could serve as a
proxy indicator of cultural strength.
38
Excluded:
Energy % of traditional food in diet was not considered a good food security
indicator, because of high data collection costs and methodological
complexity.
Monetary food costs
Monetary food costs was promoted as an indicator, since it was considered a
comparable, practical and potentially universal/standardized measure.
Among suggested measures, a standardized nutritious food basket was
promoted. However it was also pointed out that this indicator needs to be
correlated to indicators on purchasing power, and that may not be reflective
of actual consumption. Further it is not yet standardized for use all over the
Circumpolar area. Monetary food costs was considered an indicator of high
information value to a low monitoring cost.
Excluded:
Common food basket (PRO) and 4 week healthy menu.
Conditions for hunting/ fishing/collecting/herding
Conditions for hunting/fishing/collecting/herding was considered a relevant
indicator, with all the advantages and disadvantages of survey data.
Repeated surveys of a representative subpopulation could be useful for
showing trends. However, in most countries no single agency surveys all four
suggested measures, and this indicator is not surveyed regularly. Among the
suggested measures “Presence of hunter/fisher/collector/herder in the
family was considered the most easy to monitor, and thus the most feasible.
However, none of the suggested measures were considered impossible to
develop into a relevant survey measure in the future. Conditions for
hunting/fishing/collecting/herding was considered an indicator of medium
information value to a medium monitoring cost.
Food borne diseases
Data on food borne diseases are collected continuously in many countries
and is thus a widely available indicator of food security. All measures
suggested were promoted.
Regarding incidence rate of food borne diseases in human it was stressed
that many cases may be underdiagnosed. Thus it is rather an indirect than a
direct measure of how safe food is. However this was the only possible
indicator to use for comparisons with Russia. The measure of seroprevalence
39
of food borne diseases in human tells us about the population at risk. It is an
indicator of high predictive value.
By measuring seroprevalence, underdiagnosed cases will also be identified,
and already collected biological samples may be used for this monitoring. A
disadvantage with seroprevalence in human tissues, is that there may be a
limited availability of biological samples in some countries, and that there is
a need to develop universal methods for the area, to make the results
comparable. The information value is high, but monitoring costs may be
medium to high both regarding incidence rate and seroprevalence in human.
Seroprevalence in subsistence species is an important issue to follow, for
information to the population. But it is a high cost for collecting and data is
not available in all countries.
Food related contaminants
The AMAP/ HHAG supports biomonitoring of food related contaminants in
the Arctic. Since data are collected continuously in many countries, this is a
widely available indicator of food security. All measures suggested were
promoted, and it was stressed that it is important to collaborate with AMAP
in this task.
Regarding chemical contaminants in food particularly fish, marine
mammals, reindeer and caribou is of interest from an Arctic health
perspective. However, it is important to monitor all food, not only traditional
food. Measuring Chemical contaminants in human may be problematic from
a Russian point of view, because of limited data. Further exceeding of
threshold levels is over-simplification. A more complete data presentation is
warranted. The informative value of this measure was deemed to be high,
and so were also the monitoring costs.
6.2 Rational for food security indicators for further development
The arguments for considering three suggested indicators of food security as
in need of development before using in an Arctic heath context are briefly
summarized in the following paragraphs.
Food security modules
Independent of which models that are used, food security modules are a well
established survey measure. It assesses the perception of food security, and it
is useful if repeated regularly in the same population. However, this
40
methodology is not in use in all Arctic countries. The informative value is
estimated to be medium high and monitoring costs are estimated to be
medium to high.
Non-monetary food accessibility
This is an important indicator from an indigenous perspective, though
presently it has not been collected longitudinally. The information value is
high and the estimated cost for monitoring is medium to high. It was
discussed whether or not some of the suggested measures could be merged.
A new measure “received from society or community (e.g. food banks)” was
also suggested.
Healthy eating
Most of the suggested measures of healthy eating were deemed not relevant,
because the reference group thought they were more measures of lifestyle
and nutrition than of food safety. Furthermore, it is difficult to define what is
healthy and not with a cultural perspective. However, data on consumption
of fruit and vegetables, as a proxy for healthy eating, is available in many
Arctic countries. For example many Nordic countries are monitoring this
from a public health perspective. This measure may thus add a value for
policy makers. It was discussed whether fruit and vegetable consumption
should be merged or be presented as two separate measures. The
informative value was considered relatively low, and the cost for monitoring
medium high.
Food availability support programs
Instead of the excluded indicator “per person dietary energy supply” (se
following paragraph), a new indicator “food availability support programs,
such as food banks and community freezers” was suggested. Do food
availability support programs exist? And, if they exist, on which level are
they active (society, community, charity)?
6.3 Rationale for food security indicators deemed to be not
“feasible”
The arguments for disapproving two indicators of food security a in an Arctic
heath context are briefly summarized in the following paragraphs.
41
Per person dietary energy supply (DES)
Per person dietary energy supply was not considered to be a useful indicator
of food security in the Arctic area, since this area is generally food sufficient,
because of food availability support programs such as food banks and
community freezers. Both information value and monitoring cost were
estimated to be low.
Self estimated food safety
Self estimated food safety is easy to collect, but of limited value since it is too
complicated issue for people to be able to report adequately. Both
information value and monitoring cost were estimated to be low.
6.4 Rationale for water security indicators promoted
The arguments for promoting 6 indicators of water security are briefly
summarized in the following paragraphs.
Per capita renewable water
Per capita renewable water was considered to be a good indicator of water
security, since this may be affected by climate change and since it is easy to
find available data (World bank, OECD). This indicator was considered to
have a high information value and a low estimated monitoring cost.
Types of water sources
There was a general agreement that types of water sources ought to be
monitored, though none of the suggested measures of this were considered
good enough in present state. Different sources of water may be differently
vulnerable for climate change and pollution. The different categories of
water sources should be selected to fit the entire Arctic region.
Accessibility of running water
Accessibility of running water is a widely used measure, with a high
information value to a low monitoring cost.
Excluded:
The subcategories of running water accessibility used in the SLiCA study
were not considered to add much information in comparison with only a
general measure of accessibility of running water, and were thus excluded.
42
Periodic water shortages
“Periodic water shortages” is a problem spot that might increase in future,
and thus important to get a measure of. However there was no consensus
which of the suggested measures that was the most fit. Further discussions
are needed. Generally it was thought that a relatively high information value
could be received about this to a relatively low cost.
Water borne diseases
Similarly with food borne diseases, data on water borne diseases are
collected continuously in many countries and is thus a widely available
indicator of water security, though many cases may be underdiagnosed. A
relatively high information value could be achieved to a relatively low
monitoring cost.
Drinking water related contaminants
Every country in the Arctic region are already monitoring water related
contaminants, and since all exceeding do not necessarily lead to an advisory,
both numbers of exceedings and proportional values are of importance to
monitor. If measuring exceedings it is important to stress the fact that
threshold levels may differ between the countries. All suggested measures
were promoted, i.e. chemical contaminants in drinking water exceeding
national threshold levels, occasions when consumers have been
recommended to boil their drinking water, and the microbiological quality of
water.
Authorized water quality assurance
It was considered to be important to describe different parts of the Arctic
area from this perspective, but there may be difficulties in finding data for
people outside authorized water distribution systems. Furthermore, people
may have more than one house/settlement, and there is a risk that there are
too diverse systems in different areas of the Arctic to make it suitable for
international comparisons. A relatively high information value was
considered to be possible to achieve to a relatively low cost.
Water safety plans
The presence of water safety plans was also considered to be of importance
to monitor, though further discussions on this issue are warranted. Similarly
43
with authorized water quality assurance, a relatively high information value
was considered to be possible to achieve to a relatively low cost.
6.5 Rational for food security indicators for further development
The arguments for considering two suggested indicators of water security as
in need of development, before using in an Arctic heath context, are briefly
summarized in the following paragraphs.
Types of water sources
There was a general agreement that types of water sources ought to be
monitored, though none of the suggested measures of this were considered
good enough in present state. Different sources of water may be differently
vulnerable for climate change and pollution. The different categories of
water sources should be selected to fit the entire Arctic region.
Periodic water shortages
“Periodic water shortages” is a problem spot that might increase in future,
and thus important to get a measure of. However there was no consensus
which of the suggested measures that was the most fit. Further discussions
are needed. Generally it was thought that a relatively high information value
could be received about this to a relatively low cost.
6.6 Rational for water security indicators deemed to be “not
feasible”
The arguments for disapproving two indicators of water security a in an
Arctic heath context are briefly summarized in the following paragraphs.
Water consumption
Water consumption, measured in litres/person/day, was not considered a s a
feasible indicator of water security in the Arctic area, since there are many
difficulties in achieving an accurate measure. For example people with
private wells do not report their consumption. In some countries, region
specific data are absent. Available data do generally only cover centralized
water consumption. To summarize, there was an agreement regarding this
indicator, that a low information value would be achieved to a high cost.
44
Household water costs
It was generally considered that data on household water costs do not add much information because of big variation in prizes and considerable seasonal variations. It was also considered to be difficulties in achieving comparable data from different countries. Thus, a low information value would be achieved to a high cost.
45
7. Conclusion
In this report we have described 21 potential indicators of food and water
security selected from research papers and from official statistics that were
considered to have potentials to be used in surveillance and for further
initiatives in an Arctic health context. During an international workshop
these indicators were thoroughly discussed between health experts from all
eight countries in the Arctic. A reference-group was also involved during the
process.
12 of these indicators of food security (n=6) and water security (n=6) were
promoted, 5 were considered in need of further development and 4 were
disapproved.
A major conclusion is that neither from an international, nor from an Arctic
perspective, does it yet exist a golden standard manageable and feasible set
of food and water security indicators to serve as a base for monitoring and
policy making, though there is an ongoing discussion on this issue within the
FAO (14). Our experience from the work with this report and especially the
workshop discussions in December 2012, is that this discussion must
continue, especially from an Arctic health perspective.
While underweight/undernourishment and dietary energy supply are
important measures from a world-wide hunger prevention perspective, these
measures were not considered as relevant from an Arctic health perspective.
On the other hand, many indicators of relevance from an indigenous Arctic
perspective, such as non-monetary food accessibility and conditions for
hunting/fishing/collecting/herding, were not repeatedly monitored before,
and were deemed to need methodological development in the future.
As a first step, focusing on data already available in most Arctic countries, we
suggest a joint effort focusing on:
Healthy weight
Self estimated proportion of traditional food in diet (SLiCA
questionnaire can be used as baseline for indigenous people)
Presence of hunter/fisher/collector/herder in family/household
Cost of a nutritious food basket in relation to income
Food borne diseases – incidence rates and seroprevalence in
human
Food related contaminants
46
Per capita renewable water
Accessibility of running water (SLiCA data can be used as
baseline for indigenous people)
Waterborne diseases – incidence rates
Water related contaminants
Authorized water quality assurance
Water safety plans
Of these measures especially the “cost of a nutritious food basket “need more discussions, to make measures as comparable as possible over the Arctic area. During the workshop there were disagreements whether the cost of a nutritious food basket should be related to average disposable or total income.
Concerning incidence rate of food and waterborne diseases, only diseases that are monitored in the entire Arctic area should be included. For future joint efforts we also suggest further development of the following indicators: food security modules, non-monetary food accessibility, healthy eating, types of water sources and periodic water shortages.
This report is the first phase of identifying indicators of particular interest for the Arctic countries. As a second phase we recommend continuing work with development of the indicators that were considered to have potentials and to perform an international study within the Arctic nations and regions.
We also want to stress the possibility of using already existing biobanks or future joint biosampling programs for monitoring seroprevalence of food and waterborne diseases, as well as chemical contaminants in human. Since this indicator is largely overlapped by already existing AMAP activities, collaboration with AMAP is warranted.
There is no doubt within the group about the value of international joint efforts to survey the dramatic changes which are taking place in the North, a region of increasing interest to the rest of the world. These changes, caused by climate change, by resource development, by political decisions or other drivers occur due to complex interactions of all these influences. However, for the health and wellbeing of humans and of animals we recommend international cooperation for surveillance of chosen systems. We have here presented indicators that we consider being of the highest relevance for surveillance of Food and Water Security, for nations and for regions, in the Arctic.
47
8. Acknowledgements
This work was supported by grants from Nordforsk, which is acknowledged.
Beside the members of the project group and the reference group, the
authors would like to thank Lisa Hogervorst, Health Canada, Kathrine
Tronhjem, Ministry of Health, Greenland, Jeppe Bender Jørgensen,
Government of Greenland, for valuable advice, discussions and input to the
report. We also want to thank professor Kate Murray and Sigrid Brudie,
Alaska Medical Library, and Maria Nyman, Umeå university Library for their
help in the literature search and reference management.

48
49
9. References
1. World Food Summit 1996 1996 [cited 2012 October 9]. Available from: http://www.fao.org/unfao/bodies/cfs/cfs32/index_en.htm.
2. Heersink JT, Brown CJ, Dimaria-Ghalili RA, Locher JL.
Undernutrition in hospitalized older adults: patterns and correlates, outcomes, and opportunities for intervention with a focus on processes of care. J Nutr Elder. 2010;29(1):4-41.
3. Hartman C, Shamir R, Hecht C, Koletzko B. Malnutrition screening tools for hospitalized children. Curr Opin Clin Nutr Metab Care. 2012;15(3):303-9.
4. Rijsberman FR. Water scarcity: Fact or fiction? Agricultural Water Management. 2006 Feb 24;80(1-3):5-22.
5. Webb P, Coates J, Frongillo EA, Rogers BL, Swindale A, Bilinsky P.
Measuring household food insecurity: why it's so important and yet so difficult to do. J Nutr. 2006 May;136(5):1404S-8S.
6. The European Union summary report on trends and sources of zoonoses, zoonotic agents and food-borne outbreaks in 2010: Euro Surveill. 2012 Mar 8;17(10). pii: 20113.; 2012.
7. Natalia K. Climate change effects on human health in a gender perspective: some trends in Arctic research. Global health action. 2011;4(7913):22.
8. Preet R, Nilsson M, Schumann B, Evengard B. The gender
perspective in climate change and global health. Global health action. 2012;2010(9):5720.
9. FAO. Review of global agricultural water use per country 2012 [cited 2012 October 9]. Available from: http://www.fao.org/nr/water/aquastat/water_use/index6.stm.
10. World Economic Forum (WEC) (2009) The Bubble is Close to Bursting: A Forecast of the Main Economic and Geopolitical Water Issues Likely to Arise. Davos: World Economic Forum. 2009.
11. Svenskt Vatten. Dricksvatten - vårt viktigaste livsmedel (In English:
Drinking water our most important food) [cited 2012 November 16]. Available from: http://www.svensktvatten.se/vattentjanster/dricksvatten/.
50
12. Glacken JB. Food Security Knowledge Initiative: Community-Based Food Security Evaluation Toolkit: Food Security Indicators and Tools: A Review of the Literature, Public Health Agency of Canada. 2009.
13. Hoddinott J. Choosing outcome indicators of household food
security. Washington, DC: International Food Policy Research Institute. 1999.
14. FAO. The State of Food Insecurity in the World Economic growth is necessary but not sufficient to accelerate reduction of hunger and malnutrition. Food and Agriculture Organization of the United Nations, Rome, 2012.
15. Cook C, Bakker K. Water security: Debating an emerging paradigm. Global Environmental Change-Human and Policy Dimensions. 2012 Feb;22(1):94-102.
16. FAO. Water reports 38: Coping with water scarcity - an action
framework for agriculture and food security. 2012.
17. WHO. Protocol on water and health 2006 [cited 2012 October 10]. Available from: http://www.euro.who.int/__data/assets/pdf_file/0007/88603/E89602.pdf.
18. Eliassen BM, Melhus M, Kruse J, Poppel B, Broderstad AR. Design and methods in a survey of living conditions in the Arctic - the SLiCA study. Int J Circumpolar Health.71:17229. Epub 2012/03/30.
19. Survey of Living Conditions in the Arctic: Inuit, Saami, and the
Indigenous Peoples of Chukotka [cited 2012 October 24]. Available from: http://www.arcticlivingconditions.org/.
20. WHO. Trade, foreign policy, diplomacy and health: Food security 2012 [cited 2012 October 9]. Available from: http://www.who.int/trade/glossary/story028/en/.
21. Egeland GM, Williamson-Bathory L, Johnson-Down L, Sobol I. Traditional food and monetary access to market-food: correlates of food insecurity among Inuit preschoolers. Int J Circumpolar Health. 2011 Sep;70(4):373-83. Epub 2011/09/01.
22. Laaksonen S, Pusenius J, Kumpula J, Venalainen A, Kortet R,
Oksanen A, et al. Climate change promotes the emergence of serious
51
disease outbreaks of filarioid nematodes. EcoHealth. 2010 Aug;7(1):7-13.
23. Bjerregaard P, Mulvad G. The best of two worlds: how the Greenland
Board of Nutrition has handled conflicting evidence about diet and health. Int J Circumpolar Health. 2012;71:1-5. Epub 2012/07/14.
24. FAO. Country Profile: Food Security Indicators, Country: Canada 2011. Available from: http://www.fao.org/fileadmin/templates/ess/documents/food_security_statistics/country_profiles/eng/Canada_E.pdf.
25. Schmidhuber J. The EU Diet–Evolution, Evaluation and Impacts of the CAP. Document presented at theWHO Forum on Trade and Healthy Food and Diets Montréal 2007. Available from: http://www.fao.org/fileadmin/templates/esa/Global_persepctives/Presentations/Montreal-JS.pdf.
26. Kantor LS, Lipton K, Manchester A, Oliveira V. Estimating and
Addressing America’s Food Losses 1997 [cited 2012 October 12]. Available from: http://www1.calrecycle.ca.gov/ReduceWaste/Food/FoodLosses.pdf.
27. Payne C, Wiffen PJ, Martin S. Interventions for fatigue and weight loss in adults with advanced progressive illness. Cochrane Database Syst Rev. 2012;2012(18).
28. Brustad M, Parr CL, Melhus M, Lund E. Dietary patterns in the population living in the Sami core areas of Norway--the SAMINOR study. Int J Circumpolar Health. 2008 Feb;67(1):82-96. Epub 2008/05/13.
29. Johansson I, Nilsson LM, Stegmayr B, Boman K, Hallmans G,
Winkvist A. Associations among 25-year trends in diet, cholesterol and BMI from 140,000 observations in men and women in Northern Sweden. Nutr J. 2012;11(1):1475-2891.
30. Kozlov A, Vershubsky G, Kozlova M. Indigenous Peoples of Northern Russia: Anthropology and Health. Circumpolar Health Supplements eISSN 1797-237X, ISSN 1797-2361. 2007.
31. Sheikh N, Egeland GM, Johnson-Down L, Kuhnlein HV. Changing dietary patterns and body mass index over time in Canadian Inuit communities. Int J Circumpolar Health. 2011;70(5):511-9.
52
32. Hopping BN, Erber E, Mead E, Roache C, Sharma S. High levels of physical activity and obesity co-exist amongst Inuit adults in Arctic Canada. Journal of Human Nutrition and Dietetics. 2010;23(SUPPL. 1):110-4.
33. Hopping BN, Erber E, Beck L, De Roose E, Sharma S. Inuvialuit
adults in the Canadian Arctic have a high body mass index and self-reported physical activity. Journal of Human Nutrition and Dietetics. 2010;23(SUPPL. 1):115-9.
34. Qanuippitaa - Nutrition and food consumption among Inuit of Nunavik” (p. 30). Institut national de santé publique du Québec, Gouvernement du Québec. 2008.
35. Harvesting and community well-being among Inuit in the Canadian Arctic: Preliminary findings from the 2001 Aboriginal Peoples Survey - Survey of Living Conditions in the Arctic” Heather Tait. Statistics Canada(2006). Catalogue no. 89-619-XIE.
36. Aboriginal Peoples Survey, 2006. Inuit Health and Social
Conditions” Heather Tait, Statistics Canada (2008). Catalogue no. 89-637-X - No. 001.
37. Egeland GM, Johnson-Down L, Cao ZR, Sheikh N, Weiler H. Food insecurity and nutrition transition combine to affect nutrient intakes in Canadian arctic communities. J Nutr. 2011 Sep;141(9):1746-53. Epub 2011/07/15.
38. Rittmueller SE, Roache C, Sharma S. Dietary adequacy and dietary quality of Inuit in the Canadian Arctic who smoke and the potential implications for chronic disease. Public health nutrition. 2012 Jan 24:1-8.
39. El Hayek J, Egeland G, Weiler H. Vitamin D status of Inuit
preschoolers reflects season and vitamin D intake. Journal of Nutrition. 2010;140(10):1839-45.
40. Erber E, Hopping BN, Beck L, Sheehy T, De Roose E, Sharma S. Assessment of dietary adequacy in a remote Inuvialuit population. Journal of Human Nutrition and Dietetics. 2010;23(SUPPL. 1):35-42.
41. Huet C, Rosol R, Egeland GM. The prevalence of food insecurity is high and the diet quality poor in Inuit communities. J Nutr. 2012 Mar;142(3):541-7. Epub 2012/02/11.
53
42. Hopping BN, Mead E, Erber E, Sheehy C, Roache C, Sharma S. Dietary adequacy of Inuit in the Canadian Arctic. Journal of Human Nutrition and Dietetics. 2010;23(SUPPL. 1):27-34.
43. Sharma S. Assessing diet and lifestyle in the Canadian Arctic Inuit
and Inuvialuit to inform a nutrition and physical activity intervention programme. Journal of Human Nutrition and Dietetics. 2010;23(SUPPL. 1):5-17.
44. Kozlov A. Impact of economic changes on the diet of Chukotka Natives. Int J Circumpolar Health. 2004;63(3):235-42.
45. Haglin L. The nutrient density of present-day and traditional diets and their health aspects: the Sami- and lumberjack families living in rural areas of Northern Sweden. Int J Circumpolar Health. 1999 Jan;58(1):30-43. Epub 1999/04/20.
46. Dudarev AA. Dietary exposure to persistent organic pollutants and
metals among Inuit and Chukchi in Russian Arctic Chukotka. Int J Circumpolar Health. 2012;71(18592):18592.
47. Kruse J. Survey of living conditions in the Arctic: Owerview of methods & results, PP-presentation at a workshop March 22, 2007 at the University of Alaska Anchorage campus 2007 [cited 2012 October 22]. Available from: http://www.iser.uaa.alaska.edu/Projects/living_conditions/images/jack_slica_results.pdf.
48. Nash SH, Bersamin A, Kristal AR, Hopkins SE, Church RS, Pasker RL, et al. Stable Nitrogen and Carbon Isotope Ratios Indicate Traditional and Market Food Intake in an Indigenous Circumpolar Population. The Journal of Nutrition. 2012 January 1, 2012;142(1):84-90.
49. Lambden J, Receveur O, Kuhnlein HV. Traditional food attributes
must be included in studies of food security in the Canadian Arctic. Int J Circumpolar Health. 2007 Sep;66(4):308-19.
50. Inuit Circumpolar Council (ICC) Canada Report, Food Security Across the Arctic, 2012).
51. Goldhar C, Ford JD, Berrang-Ford L. Prevalence of food insecurity in a Greenlandic community and the importance of social, economic and environmental stressors. International journal of circumpolar health. 2010;69(3):285-303.
54
52. Egeland GM, Pacey A, Cao Z, Sobol I. Food insecurity among Inuit preschoolers: Nunavut Inuit Child Health Survey, 2007-2008. CMAJ. 2010 Feb 23;182(3):243-8. Epub 2010/01/27.
53. Swindale A, Bilinsky P. Development of a universally applicable
household food insecurity measurement tool: process, current status, and outstanding issues. J Nutr. 2006 May;136(5):1449S-52S.
54. Frongillo EA. Validation of Measures of Food Insecurity and Hunger. The Journal of Nutrition. 1999 February 1, 1999;129(2):506.
55. Lawn J, Harvey D. Nutrition and food security in Kugaaruk, Nunavut: baseline survey for the Food Mail Pilot Project. Ottawa: Minister of Indian Affairs and Northern Development; 2003. p. 85. 2003.
56. Willows N, Veugelers P, Raine K, Kuhle S. Associations between
household food insecurity and health outcomes in the Aboriginal population (excluding reserves). Health Rep. 2011;22(2):15-20.
57. National Nutritious Food Basket; Health Canada [cited 2012 October 29]. Available from: http://www.hc-sc.gc.ca/fn-an/surveill/basket-panier/index-eng.php.
58. Nathoo T, Shoveller J. Do healthy food baskets assess food security? Chronic Dis Can. 2003;24(2-3):65-9.
59. Weekly Cost of the Revised Northern Food Basket for a Family of
Four, Kivalliq Region 2005 - 2010; Aboroginal Affairs and Northern Development Canada [cited 2012 October 29]. Available from: http://www.aadnc-aandc.gc.ca/eng/1100100035971/1100100035973.
60. The Cost of the Nutritous Food basket in Toronto; Living in Toronto [cited 2012 October 29]. Available from: http://www.toronto.ca/health/food_basket.htm.
61. PRO, pensionärernas riksorganisation, Prisundersökning 2011: Receptfria läkemedel har blivit billigare. In English: the National Pensioners’ Organisation, price survey year 2011. 2011 [cited 2012 October 31]. Available from: http://www.pro.se/konsumentmakt/Prisundersokning/Prisundersokning-2011/.
55
62. Statistics Sweden (SCB), Hushållens utgifter (HUT) 2007-2009 Utgifts- och inkomstrapport. In English: Household Budget Survey (HBS) 2007-2009, Expenditure and income report . In: Statistiska meddelanden HE 35 SM 1001 2011.
63. Konsumentverket 2009. Skäliga levnadskostnader, Beräkningar av
Konsumentverket. Report number 2009:8. In English: the Swedish Consumer Agency: calculations of reasonable living costs.
64. AMAP. AMAP assessment 2009 : human health in the arctic. Oslo: Arctic Monitoring and Assessment Programme; 2009.
65. Nilsson LM, Dahlgren L, Johansson I, Brustad M, Sjolander P, Van Guelpen B. Diet and lifestyle of the Sami of southern Lapland in the 1930s--1950s and today. Int J Circumpolar Health. 2011 Jun;70(3):301-18. Epub 2011/06/03.
66. Young TK, Rawat R, Dallmann W, Chatwood S, Bjerregaard P,
editors. Circumpolar Health Atlas. Toronto: University of Toronto Press; 2012.
67. Lambden J, Receveur O, Marshall J, Kuhnlein HV. Traditional and market food access in Arctic Canada is affected by economic factors. Int J Circumpolar Health. 2006 Sep;65(4):331-40.
68. McClymont Peace D, Myers E. Community-based participatory process--climate change and health adaptation program for Northern First Nations and Inuit in Canada. Int J Circumpolar Health. 2012;71(0):1-8.
69. Furberg M, Evengard B, Nilsson M. Facing the limit of resilience:
perceptions of climate change among reindeer herding Sami in Sweden. Global health action. 2011;2011(4):28.
70. Brubaker M, Berner J, Chavan R, Warren J. Climate change and health effects in Northwest Alaska. Global health action. 2011;4.
71. Beaumier MC, Ford JD. Food insecurity among inuit women exacerbated by socioeconomic stresses and climate change. Canadian journal of public health. 2010;101(3):196-201.
72. Beddington J, Asaduzzaman M, Fernandez A, Clark M, Guillou M,
Jahn M, et al. Achieving food security in the face of climate change: Summary for policy makers from the Commission on Sustainable Agriculture and Climate Change. CGIAR Research Program on
56
Climate Change, Agriculture and Food Security (CCAFS) Copenhagen, Denmark. 2011.
73. Brubaker MY, Bell JN, Berner JE, Warren JA. Climate change health
assessment: A novel approach for alaska native communities. International journal of circumpolar health. 2011;70(3):266-73.
74. Downing A, Cuerrier A. A synthesis of the impacts of climate change on the First Nations and Inuit of Canada. Indian Journal of Traditional Knowledge. 2011;10(1):57-70.
75. Ford JD. Vulnerability of Inuit food systems to food insecurity as a consequence of climate change: A case study from Igloolik, Nunavut. Regional Environmental Change. 2009;9(2):83-100.
76. Guyot M, Dickson C, Paci C, Furgal C, Chan HM. Local observations
of climate change and impacts on traditional food security in two northern Aboriginal communities. Int J Circumpolar Health. 2006 Dec;65(5):403-15.
77. Nancarrow TL, Chan HM. Observations of environmental changes and potential dietary impacts in two communities in Nunavut, Canada. Rural and remote health. 2010;10(2):1370.
78. Revish B. Climate change impact on public health in the Russian Arctic. Report UN in the Russian Federation 2009 [cited 2012 October 10]. Available from: http://www.unrussia.ru/sites/default/files/doc/Arctic-eng.pdf.
79. Wenzel GW. Canadian Inuit subsistence and ecological instability—
if the climate changes, must the Inuit? Polar Research. 2009;28:89-99, doi 10.1111/j.751-8369.2009.00098.x.
80. Anand P, Kunnumakara A, Sundaram C, Harikumar K, Tharakan S, Lai O, et al. Cancer is a Preventable Disease that Requires Major Lifestyle Changes. Pharmaceutical Research. 2008;25(9):2097-116.
81. Hu FB, Willett WC. Optimal diets for prevention of coronary heart disease. JAMA. 2002 Nov 27;288(20):2569-78. Epub 2002/11/28.
82. Parkinson AJ, Butler JC. Potential impacts of climate change on
infectious diseases in the Arctic2005.
83. Horowitz BZ. Type E botulism. Clinical toxicology (Philadelphia, Pa). 2010 Nov;48(9):880-95. Epub 2010/12/22.
57
84. Fagan RP, McLaughlin JB, Castrodale LJ, Gessner BD, Jenkerson SA, Funk EA, et al. Endemic Foodborne Botulism among Alaska Native Persons—Alaska, 1947–2007. Clinical Infectious Diseases. 2011 March 1, 2011;52(5):585-92.
85. Austin JW, Leclair D. Botulism in the North: a disease without
borders. Clinical infectious diseases : an official publication of the Infectious Diseases Society of America. 2011 Mar 1;52(5):593-4. Epub 2011/02/05.
86. Smi, smittskyddsinstitutet. Data and statistics. [cited 2012 November 11]. Available from: http://www.smittskyddsinstitutet.se/in-english/statistics/.
87. Isomursu M, Kunnasranta M. Trichinella nativa in grey seal Halichoerus grypus: spill-over from a highly endemic terrestrial ecosystem. J Parasitol.97(4):735-6.
88. Moller LN, Koch A, Petersen E, Hjuler T, Kapel CM, Andersen A, et
al. Trichinella infection in a hunting community in East Greenland. Epidemiol Infect. 2010;138(9):1252-6.
89. Houze S, Ancelle T, Matra R, Boceno C, Carlier Y, Gajadhar AA, et al. Trichinellosis acquired in Nunavut, Canada in September 2009: meat from grizzly bear suspected. Euro Surveill. 2009;14(44):19383.
90. Moller LN, Petersen E, Kapel CM, Melbye M, Koch A. Outbreak of trichinellosis associated with consumption of game meat in West Greenland. Vet Parasitol. 2005;132(1-2):131-6.
91. Serhir B, MacLean JD, Healey S, Segal B, Forbes L. Outbreak of
trichinellosis associated with arctic walruses in northern Canada, 1999. Can Commun Dis Rep. 2001;27(4):31-6.
92. Pozio E, Christensson D, Steen M, Marucci G, La Rosa G, Brojer C, et al. Trichinella pseudospiralis foci in Sweden. Vet Parasitol. 2004;125(3-4):335-42.
93. Curry PS, Elkin BT, Campbell M, Nielsen K, Hutchins W, Ribble C, et al. Filter-paper blood samples for elisa detection of brucella antibodies in caribou Journal of Wildlife Diseases. 2011 Jan;47(1):12-20.
58
94. SanPiN 2.3.2.1078-01 "Hygienic safety and nutritional value of food products" with multiple amendments is the main normative on food safety in Russia. Sanitary Rules and Norms, 2001.
95. AMAP. Persistent Toxic Substances, Food Security and Indigenous
Peoples of the Russian North. Final Report. Oslo: Arctic Monitoring and Assessment Programme (AMAP); 2004.
96. AMAP. AMAP Assessment 2002: Human Health in the Arctic: Arctic Monitoring and Assessment Programme (AMAP); 2003.
97. AMAP. AMAP Assessment Report: Arctic Pollution Issues. Oslo, Norway: Arctic Monitoring and Assessment Programme (AMAP);
1998. xii+859pp p.
98. Ropeik D. The Perception Gap: Recognizing and managing the risks that arise when we get risk wrong. Food Chem Toxicol. 2012;50(5):1222-5.
99. Kirkpatrick SI, Tarasuk V. Food insecurity is associated with nutrient inadequacies among Canadian adults and adolescents. J Nutr. 2008;138(3):604-12.
100. Bhattacharya J, Currie J, Haider S. Poverty, food insecurity, and
nutritional outcomes in children and adults. J Health Econ. 2004;23(4):839-62.
101. Dixon LB, Winkleby MA, Radimer KL. Dietary intakes and serum nutrients differ between adults from food-insufficient and food-sufficient families: Third National Health and Nutrition Examination Survey, 1988-1994. J Nutr. 2001;131(4):1232-46.
102. Jacobs Starkey L, Kuhnlein HV. Montreal Food Bank Users' Intakes Compared With Recommendations of Canada's Food Guide to Healthy Eating. Can J Diet Pract Res. 2000;61(2):73-5.
103. McIntyre L, Glanville NT, Raine KD, Dayle JB, Anderson B, Battaglia
N. Do low-income lone mothers compromise their nutrition to feed their children? CMAJ. 2003;168(6):686-91.
104. McIntyre L, Glanville NT, Officer S, Anderson B, Raine KD, Dayle JB. Food insecurity of low-income lone mothers and their children in Atlantic Canada. Canadian journal of public health. 2002;93(6):411-5.
59
105. Tarasuk V, Fitzpatrick S, Ward H. Nutrition inequities in Canada. Appl Physiol Nutr Metab. 2010;35(2):172-9.
106. Deutch B, Dyerberg J, Pedersen HS, Aschlund E, Hansen JC.
Traditional and modern Greenlandic food - dietary composition, nutrients and contaminants. Sci Total Environ. 2007;384(1-3):106-19.
107. Basiotis PP, Carlson A, Gerrior SA, Juan WY, Lino M. The Healthy Eating Index: 1999-2000. U.S. Department of Agriculture, Center for Nutrition Policy and Promotion. CNPP-12. . 2002.
108. Drewnowski A, Fiddler EC, Dauchet L, Galan P, Hercberg S. Diet quality measures and cardiovascular risk factors in France: applying the Healthy Eating Index to the SU.VI.MAX study. J Am Coll Nutr. 2009 Feb;28(1):22-9. Epub 2009/07/03.
109. Norte Navarro AI, Ortiz Moncada R. [Spanish diet quality according
to the healthy eating index]. Nutricion hospitalaria : organo oficial de la Sociedad Espanola de Nutricion Parenteral y Enteral. 2011 Mar-Apr;26(2):330-6. Epub 2011/06/15. Calidad de la dieta espanola segun el indice de alimentacion saludable.
110. Tsigga M, Filis V, Hatzopoulou K, Kotzamanidis C, Grammatikopoulou MG. Healthy Eating Index during pregnancy according to pre-gravid and gravid weight status. Public health nutrition. 2011 Feb;14(2):290-6. Epub 2010/07/21.
111. Shatenstein B, Nadon S, Godin C, Ferland G. Diet Quality of Montreal-Area Adults Needs Improvement: Estimates from a Self-Administered Food Frequency Questionnaire Furnishing a Dietary Indicator Score. Journal of the American Dietetic Association. 2005;105(8):1251-60.
112. Order of Ministry of health and social development of Russian
Federation, August 2010, # 593n.
113. Olsen A, Egeberg R, Halkjaer J, Christensen J, Overvad K, Tjonneland A. Healthy aspects of the Nordic diet are related to lower total mortality. J Nutr. 2011 Apr 1;141(4):639-44. Epub 2011/02/25.
114. Niclasen B, Bjerregaard P. Folkesundhed blandt skolebørn - resultater fra HBSC Greenland undersøgelsen 2010. SIF’s Grønlandsskrifter nr. 22. Copenhagen: Statens Institut for Folkesundhed; 2011. p. 125.
60
115. Folkhälsoinsitutet. Frukt och grönsakskonsumtion i Sverige. Läns- och kommundata 2008-2011. In English: Fruit and vegetable consumption in Sweden. County and municipal data, 2008-2011. Public Health Institute. [cited 2012 October 15]. Available from: http://www.fhi.se/PageFiles/16061/Frukt-och-gr%C3%B6nsakskonsumtion-i-Sverige-l%C3%A4n-kommun-2008-2011.pdf.
116. Canadian Community Health Survey - Annual Component (CCHS)
[cited 2012 December 27]. Available from: http://www23.statcan.gc.ca/imdb/p2SV.pl?Function=getSurvey&SDDS=3226&lang=en&db=imdb&adm=8&dis=2.
117. White DM, Craig Gerlach S, Loring P, Tidwell AC, Chambers MC. Food and water security in a changing arctic climate. Environmental Research Letters. 2007;2(4).
118. The World Bank: Renewable internal freshwater resources per capita (cubic meters) [cited 2012 October 9]. Available from: http://data.worldbank.org/indicator/ER.H2O.INTR.PC.
119. Howard G, Bartram J. Domestic Water Quantity, Service, Level and
Health, WHO report number WHO/SDE/WSH/03.02. Geneva2003.
120. Statens Livsmedelsverk (SLV) Rapportering av dricksvattenkontrollen 2009. Kontrollmyndigheternas rapportering av dricksvattenkontrollen. In English: Swedish National Food Agencies (SLV) report of the drinking water control 2009. Control authorities reporting of drinking water control. Report number 11 - 2010. 2010.
121. Hennessy TW, Ritter T, Holman RC, Bruden DL, Yorita KL, Bulkow L, et al. The relationship between in-home water service and the risk of respiratory tract, skin, and gastrointestinal tract infections among rural Alaska natives. Am J Public Health. 2008 Nov;98(11):2072-8. Epub 2008/04/03.
122. Livsmedelsverket. Nationellt nätverk för dricksvatten En gemensam
strategi. In English: A national network for drinkingwater - a strategy. by the Swedish National Food Agency [cited 2012 November 26]. Available from: http://www.slv.se/upload/dokument/livsmedelsforetag/dricksvatten/Strategi%202011.pdf.
61
123. Lene Sarah Hansen AD, Jens Asger Andersen, Jørgen Bille-Hansen. Grønlands drikkevandsforsyning. Et datagrundlag for en vandforsyningsstrategi. Denmark: Greenland Survey, ASIAQ; 2003.
124. Environment Canada, Quickfacts, bullet 65 [cited 2012 December].
Available from: http://www.ec.gc.ca/eau-water/default.asp?lang=En&n=11A8CA33-1.
125. National Assessment of First Nations Water and Wastewater Systems, April 2011. Available from: http://www.aadnc-aandc.gc.ca/DAM/DAM-INTER-HQ/STAGING/texte-text/enr_wtr_nawws_rurnat_rurnat_1313761126676_eng.pdf.
126. 2005 Alaska Housing Assessment: Part I, September 2005 [cited 2013 January 8]. Available from: http://www.infoinsights.com/wp-content/uploads/alaska_housing_assessment_parti.pdf.
127. Eichelberger LP. Living in Utility Scarcity: Energy and Water
Insecurity in Northwest Alaska. American Journal of Public Health. 2010;100(6):1010-8.
128. Svenskt vatten: taxestatistik, in English: Swedish Water: fee statistics [cited 2012 October 24]. Available from: http://www.svensktvatten.se/Vattentjanster/Management/VASS/Taxa/.
129. WHO. Water and sanitation: facts and figures [cited 2012 October 10]. Available from: http://www.euro.who.int/en/what-we-do/health-topics/environment-and-health/water-and-sanitation/facts-and-figures.
130. First Nations and Inuit Health Branch, Health Canada, Nov.30,
2012.
131. Nygard K, Gondrosen B, Lund V. [Water-borne disease outbreaks in Norway]. Tidsskr Nor Laegeforen. 2003;123(23):3410-3.
132. Halonen JI, Kivimaki M, Oksanen T, Virtanen P, Virtanen MJ, Pentti J, et al. Waterborne outbreak of gastroenteritis: effects on sick leaves and cost of lost workdays. PLoS One. 2012;7(3):19.
133. Kvitsand HM, Fiksdal L. Waterborne disease in Norway:
emphasizing outbreaks in groundwater systems. Water Sci Technol. 2010;61(3):563-71.
62
134. Maal-Bared R, Bartlett KH, Bowie WR. Dealing with waterborne disease in Canada: challenges in the delivery of safe drinking water. Rev Environ Health. 2008;23(2):119-33.
135. Parkinson AJ, Butler JC. Potential impacts of climate change on
infectious diseases in the Arctic. Int J Circumpolar Health. 2005;64(5):478-86.
136. Sergevnin VI, Sarmometov EV, Skovorodin AN. [Waterborne outbreaks of Sonne dysentery are not myth but reality]. Zh Mikrobiol Epidemiol Immunobiol. 1999;6:112-3.
137. Thomas KM, Charron DF, Waltner-Toews D, Schuster C, Maarouf AR, Holt JD. A role of high impact weather events in waterborne disease outbreaks in Canada, 1975 - 2001. Int J Environ Health Res. 2006;16(3):167-80.
138. WHO (World Health Organisation) 2005 Water Safety Plans,
Managing drinking-water quality from catchment to consumer. [cited 2012 November 16]. Available from: http://www.who.int/water_sanitation_health/dwq/wsp0506/en/index.html.
139. American Housing Survey (AHS) [cited 2013 January 8]. Available from: http://www.census.gov/housing/ahs/data/national.html.
140. Lindberg A, Lusua J, Nevhage B. Cryptosporidium i Östersund vintern 2010/2011, Konsekvenser och kostnader av ett stort vattenburet sjukdomsutbrott. In English "Cryptosporidium in Östersund during the Winter 2010/2011, Consequences and Costs from an Outbreak of a Waterborne Disease". (summary in English). Report number FOI-R--3376--SE. Totalförsvarets forskningsanstalt (FOA) Totalförsvarets forskningsanstalt, Livsmedelsverket, 2011.
141. Har vi rent dricksvatten i kranen? In English "Do we have clean
water in the pipes?" a seminar report. Seminarierapport, Gotlands högskola, Almedalsveckan, 4 juli 2011 [cited 2012 November 15]. Available from: http://www.swedishwaterhouse.se/swh/resources/1317644031835Seminarierapport-Har-vi-rent-dricksvatten-i-kranen-110704.pdf.