amplified surface temperature and climate change indicators in the arctic amplified surface...
TRANSCRIPT
Amplified Surface Temperature and Climate Change Indicators in the ArcticAmplified Surface Temperature and Climate Change Indicators in the ArcticJosefino Comiso, Code 615, NASA GSFCJosefino Comiso, Code 615, NASA GSFC
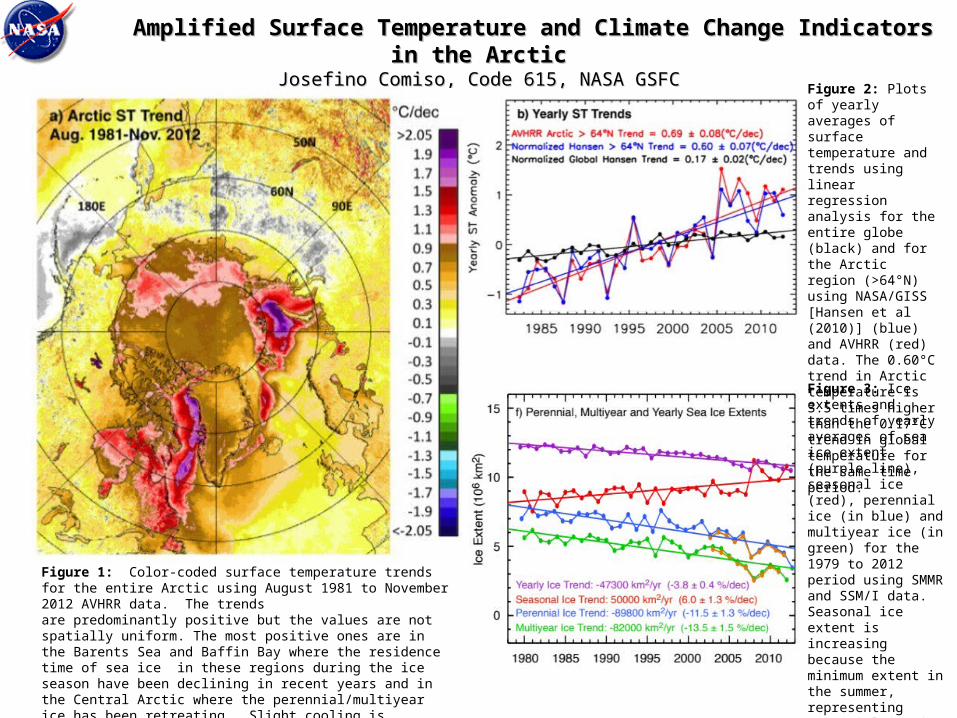
Figure 1: Color-coded surface temperature trends for the entire Arctic using August 1981 to November 2012 AVHRR data. The trends are predominantly positive but the values are not spatially uniform. The most positive ones are in the Barents Sea and Baffin Bay where the residence time of sea ice in these regions during the ice season have been declining in recent years and in the Central Arctic where the perennial/multiyear ice has been retreating. Slight cooling is apparent in the Bering Sea and parts of Siberia reflecting the complexity of the Arctic climate system.
Figure 2: Plots of yearly averages of surface temperature and trends using linear regression analysis for the entire globe (black) and for the Arctic region (>64°N) using NASA/GISS [Hansen et al (2010)] (blue) and AVHRR (red) data. The 0.60°C trend in Arctic temperature is 3.5 times higher than the 0.17°C trend in global temperature for the same time period. Figure 3: Ice extents and trends of yearly averages of sea ice extent (purple line), seasonal ice (red), perennial ice (in blue) and multiyear ice (in green) for the 1979 to 2012 period using SMMR and SSM/I data. Seasonal ice extent is increasing because the minimum extent in the summer, representing perennial ice is declining much faster than the maximum extent in subsequent winter.
Name: Josefino C. Comiso, NASA/GSFC E-mail: [email protected]: 301-614-5708
Abstract: The surface temperature in the Arctic increased at a rate that is 3.5 times larger than that of global temperature from 1981 to 2012. The amplified warming is manifested in many cryospheric parameters. Among the most visible is the 13.5% per decade decline in the extent of the multiyear ice cover since 1979 and the 2.1% per decade retreat of the snow cover since 1967. Moreover, the temperature of the active layer of permafrost has increased while glaciers worldwide and the Greenland ice sheet have been losing mass at the rate of 275 and 228 Giga-tons per year, respectively, in recent years. These results suggest that profound changes in the ecology, environment and climate of the Arctic are imminent.
References: Comiso, J. C. and D. K. Hall, (2014, In Press) Climate Trends in the Arctic, WIREs (Wiley Interdisciplinary Reviews) Climate Change, Advanced Review (invited).
Parkinson, C. L. and J. C. Comiso (2013) On the 2012 record low Arctic sea ice cover: Combined impact of preconditioning and an August storm, Geophy. Res. Lett., 40, 1-6, doi:10.1002/grl.50349.
Hall, D. K., J. C. Comiso, N. E. DiGirolamo, C. A. Shuman, J. E. Box, and L. S. Koenig (2013), Variability in the surface temperature and melt extent of the Greenland Ice Sheet from MODIS, Geophys. Res. Lett., doi:10.1002/grl.50240.
Data Sources: Surface temperature data are either from NASA/GISS or derived from NOAA/AVHRR and MODIS data. Sea ice concentration, ice extent and ice area are from brightness temperatures provided by NSIDC/Univ. of Colorado using Nimbus-7/SMMR, DMSP/SSM/I and EOS-Aqua/AMSR-E data and algorithms developed at NASA/GSFC.
Technical Description of Images:Figure 1: Color-coded surface temperature trends for the entire Arctic using August 1981 to November 2012 AVHRR data. The trend in each data element is estimated using linear regression on monthly anomalies with climatological average (i.e., average of 1981 to 2012 data) as the baseline. Data from several AVHRR sensors are used in the study and temporal consistency is achieved through the use of meteorological station and other in situ data.
Figure 2:, Plots of yearly averages of surface temperature and trends using linear regression analysis for the entire globe (black) and for the Arctic region (>64°N) using NASA/GISS [Hansen et al (2010)] (blue) and AVHRR (red) data. The trends and statistical errors (1 standard deviation) are indicated in the plots.
Figure 3: Ice extents and trends of yearly averages of sea ice extent (purple line), seasonal ice (red), perennial ice (in blue) and multiyear ice (in green) for the 1979 to 2012 period using SMMR and SSM/I data. Also similar plots using AMSR-E data from 2003 to 2012 (gold) are presented for perennial and multiyear ice. The perennial ice is ice that survives the summer melt and the extent is derived from the ice cover during summer minimum. Multiyear ice is ice that survives at least two summer melt periods and the extent is derived from winter data taking advantage of the large contrast in the emissivity of multiyear ice and seasonal ice. Also, seasonal ice extent is the difference of the extent during winter maximum and that of the minimum during the previous summer. The numerical value of the trends in km2 and the percentage changes per decade are indicated in the plots.
Scientific significance: The Arctic is one of the regions in our planet where strong climate change signals are observed and where large environmental and ecological changes are imminent. The surface temperature trend in the Arctic during the 1979 to 2012 period is shown to be 3.5 time that of global surface temperature trends. Such amplification of the signal is manifested in many cryospheric parameters such as the multiyear ice cover which has lost more than half its extent since 1979 when consistent and continuous satellite data became available. Snow cover in spring has been on a significant decline as well and the temperature of the active layer of the permafrost has been increasing in many areas. Significant losses in ice mass in the glaciers and on Greenland are also observed from satellite data showing consistency with the increasing rate of sea level rise.
Relevance for future science and relationship to Decadal Survey: The observed amplification of surface temperature and the changes in cryospheric parameters in the Arctic are very relevant to NASA’s mission to better understand the Earth’s climate system and the decadal survey. It is very relevant to the ongoing “Ice Bridge” project and ICESat-2 satellite mission to be launched in 2017 and helps fulfill the goals of Aqua and Terra missions. Some of the changes observed in the Arctic are dramatic if not unexpected and should be monitored continuously in the future as part of the decadal survey to better understand the impacts and to obtain an improved assessment of the rates of change and their implications.
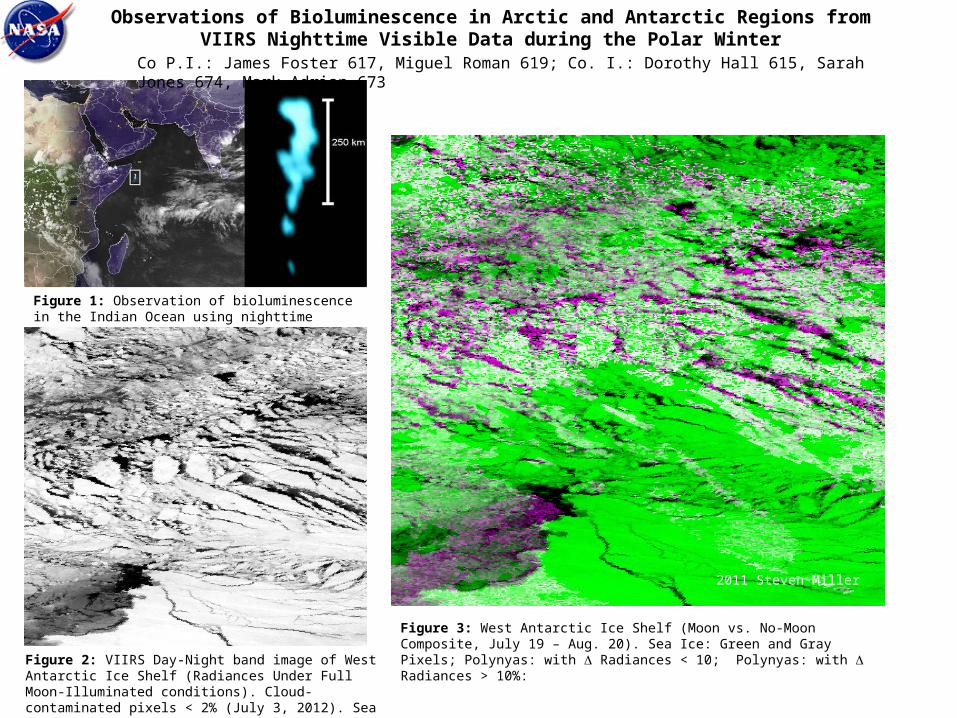
Figure 1: Observation of bioluminescence in the Indian Ocean using nighttime visible DMSP (OLS) data
Figure 2: VIIRS Day-Night band image of West Antarctic Ice Shelf (Radiances Under Full Moon-Illuminated conditions). Cloud-contaminated pixels < 2% (July 3, 2012). Sea Ice: White; Polynyas (open water): Black and Gray.
Figure 3: West Antarctic Ice Shelf (Moon vs. No-Moon Composite, July 19 – Aug. 20). Sea Ice: Green and Gray Pixels; Polynyas: with Radiances < 10; Polynyas: with Radiances > 10%:
Observations of Bioluminescence in Arctic and Antarctic Regions from VIIRS Nighttime Visible Data during the Polar Winter
Co P.I.: James Foster 617, Miguel Roman 619; Co. I.: Dorothy Hall 615, Sarah Jones 674, Mark Adrian 673
2011 Steven Miller
Abstract: In order to detect low level, bioluminescence of zooplankton blooms and possibly luminous bacteria in Arctic and Antarctic waters, VIIRS nighttime visible observations were made in polynyas and or other ice free areas when the Moon was completely below the horizon. The objective was to determine if we could detect these blooms, map their distributions and determine their longevity and frequency.
References: Foster, J. and D. Hall (1991):Observations of snow and ice features during the polar winter using moonlight as a source of illumination, Remote Sens. of Environ., 37, 74-78.
Miller, S., S. Haddock, C. Elvidge, and T. Lee (2005): Detection of a bioluminescent milky sea from space. Proceedings of the National Academy of Sciences, USA, 102:14181-14184.
Roman, M. (2013): Overview of VIIRS Land products. AGU Proceedings, San Francisco, CA.
Data Sources: Day/Night Band (DNB) on the Visible/Infrared Imager/Radiometer Suite (VIIRS) onboard Suomi-NPP and JPSS satellites
Technical Description of Figures:Figure 1: DMSP nighttime visible image showing validated bioluminescence in the Indian Ocean
Figure 2: VIIRS Day-Night band image of West Antarctic Ice Shelf illuminated by the full Moon on July 3, 2012. This is a “nighttime” visible image – illumination is provided only by moonlight. July is polar winter in Antarctica – the Sun is always below the horizon.
Figure 3: VIIRS view of West Antarctic Ice Shelf. This Moon vs. No-Moon Composite utilizes images acquired over the course of a complete lunar cycle, from July 19, 2012 through August 20, 2012. Based on an algorithm we developed to filter extraneous light, the brightness of the open water areas is not caused by aurora artifacts or by clouds. The magenta colors may be bioluminescence, but the presence of bioluminescent blooms here has not yet been confirmed.
Scientific Significance: Our team was one of the first to use the VIIRS Day/Night band for research purposes. The greater sensitivity and radiometric resolution of the VIIRS DNB compared to the OLS resulted in greater detection of auroras and clouds, which makes detection and observation of bioluminescence more challenging. An aurora detection protocol was developed to ensure that these high altitude light sources were not confused with ocean bioluminescence.
Relevance for future science and relationship to Decadal Survey: This work has utility in improving estimates of biomass in polar regions and in helping to gain insight regarding the formation, longevity and frequency of these enigmatic blooms.
Name: James Foster, Code 617, NASA/GSFC E-mail: [email protected]: 301-614-5769