follow up question proforma confidential no. from criteria
TRANSCRIPT

Question No. From
Proforma section
Criteria Question Date question asked Date response required Date receivedFollow up
to Question #
Confidential (Y/N)
1 JM 9 N/A
Under Project Deliverable 1 you have listed 9% of the NIC funding request against the standard Project Deliverable relating to compliance with the Governance Document. As indicated within the Full Submission Guidance this Project Deliverable should not have any funding allocated against it, as non-compliance would be a licence breach. Please can you provide an amended breakdown of the Funding Allocated against each project deliverable? 22 August 2017 24 August 2017 24 August 2017
2 CO n/a b) Value for money
Within the ENWL network, if LCT demand tends to be clustered and it is mostly in affluent areas, it implies that more affluent areas will also be the first beneficiaries of the efficiency measures which will be paid for by less affluent customers. Is that correct? Or will less affluent areas sharing networks with affluent ones be targeted? 22 August 2017 24 August 2017 24 August 2017
3 CO n/a b) Value for moneyIf PV is deployed by the DNO at target properties or substations, who will own the PV and will they also benefit from any energy generated through FiTs or equivalents or will this be socialised? 22 August 2017 24 August 2017 24 August 2017
4 CO n/a d) Is innovative
The customer engagement part of the project will carry the most risk as several previous Tier 1 and Tier 2 LCNF projects requiring large scale recruitment among customers have not been as successful as hoped. What lessons have been learnt from these failed projects? Identify the projects learnt from. 22 August 2017 24 August 2017 24 August 2017
5 CO n/ag) Robust methodology/ready to
implementThe development of a new CBA tool is probably an industry activity. Has it been considered as collective project under the umbrella of, for example, the ENA? 22 August 2017 24 August 2017 24 August 2017
6 NC A.1 a) Enviro+consumer bensPlease amend Figures A1.1, A1.2 and A1.3 to include a total line which has the sum of the benefits for all the methods. 24 August 2017 29 August 2017 29 August 2017
7 SS n/a c) Generates new knowledgeFor Trials 1, 2, 3 and 5, please highlight the additional benefits of conducting the trials over a desktop exercise. 24 August 2017 29 August 2017 29 August 2017
8 SS B.1 N/A
In Appendix B.1 you state that monitoring will be conducted at substation level only for all trials other than the heating trials, however elsewhere its stated that monitoring will be conducted at customer level for all trials. Please confirm whether or not monitoring will be conducted at the sites where energy efficiency measures are installed. 24 August 2017 29 August 2017 29 August 2017
9 NC a) Enviro+consumer bens
Your submission shows the financial benefits of the proposed trial method versus conventional reinforcement. Please explain why conventional reinforcement is the most efficient method in use today. Have you considered other methods to address the problem, eg ANM or DSR. Within the Poyry report (which accompanied the Innovation Review) you contributed data to indicates 37% of the methods trialled under the LCN Fund are ready for use in business as usual and a further 41% are ready for use in the right circumstances. This would imply that there are more efficient methods available to licensees than traditional reinforcement. 24 August 2017 29 August 2017 29 August 2017
10 EP n/a Multiple Please explain the exact network problem you believe this solution will resolve? 05 September 2017 07 September 2017 07 September 2017
11 EP n/a MultiplePlease advise if successful, how the proposed network tool will change your internal p2/6 implementation policy? 05 September 2017 07 September 2017 07 September 2017
12 EP n/a Multiple Please outline how you have engaged with the suppliers/ providers of the existing ECO scheme? 05 September 2017 07 September 2017 07 September 2017
13 EP n/ag) Robust methodology/ready to
implementPlease provide examples you have considered as part of your background research for the project in other industries approach to changing customers' behaviour? How successful has this been? 05 September 2017 07 September 2017 07 September 2017
14 EP n/a a) Enviro+consumer bensPlease could you clarify the discrepancies between figures listed for the carbon benefits listed in the Full Submission on p.18 / the appendices and the one listed in the 1st bilateral meeting materials presentation 12 September 2017 14 September 2017 14 September 2017
15 EP n/a a) Enviro+consumer bensPlease provide the capacity savings benefits in terms of the peak network capacity released rather than the reduction in energy use by the network customers who receive the energy efficient solutions. 12 September 2017 14 September 2017 14 September 2017
16 EP b) Value for money What are the barriers to collaborating with retailers/manufacturers and undertaking this work as BAU? 12 September 2017 14 September 2017 14 September 2017
17 EPg) Robust methodology/ready to
implement
Please provide more information on how you have considered the best practice examples from other sectors in relation to the proposed consumer engagement within the project - you have only cited one document within your application. 12 September 2017 14 September 2017 14 September 2017
18 EP n/a b) Value for money
Your submission states the energy efficiency measures will be treated as regulatory assets with the cost being spread over 45 years, please clarify how this will work for energy efficiency measures which have an expected lifetime of less than this, e.g. energy efficient lightbulbs? 12 September 2017 14 September 2017 14 September 2017

19 EP n/a b) Value for moneyPlease confirm when the industry CBA model created by the project will be signed off? How much money will have been spent by this juncture? 12 September 2017 14 September 2017 14 September 2017
20 NC 9 Mulitple
Project deliverable five appears to be focussed on project inputs rather than on learning from the project. Therefore the associated funding appears high relative to other deliverables more focussed on outputs. Please provide a justification that the proposed percentage of funding associated with this deliverable is appropriate. 14 September 2017 19 September 2017 19 September 2017
21 EP n/a MulitplePlease provide an indicative figure the amount a PV prosumer would currently expect to receive per KW of electricity generated. 21 September 2017 26 September 2017 26 September 2017
22 EP n/a a) Enviro+consumer bensPlease confirm the choice of carbon intensity figures used to derive the estimates of GB Carbon savings in Figure A.1.3 and comment on the potential range of total GB savings. 21 September 2017 26 September 2017 26 September 2017 14
23 CO n/a b) Value for money
Based on your submission we understand that the day rates of your team will be as follows:ENW , Impact Research , BRE , Delta-ee , Energy Saving Trust , NERA
and Uni of Salford . The rates of several of the partner organisations are well above the average for NIC and the academic rate is the highest of all submissions. Can you please justify these rates and explain the benefit and contribution these Contractor s will make to the project.
21 September 2017 26 September 2017 26 September 2017
24 EP n/a MulitplePlease complete the attached table for each intervention listed in the Full Submission (please add additional rows for any which are not listed) 28 September 2017 03 October 2017 03 October 2017
25 EP n/a a) Enviro+consumer bens As per the discussion in the bilateral please provide the numbers behind the graph on slide 8 of the pack 05 October 2017 10 October 2017 10 October 2017
26 EP n/a a) Enviro+consumer bens
The 'Cap Headroom' model presented within the meeting assumed energy efficient devices would become the standard option in 2032 - please explain why the NPV level analysis shows benefits will continue to accrue after this? What are you fundamentally assuming at this point? 05 October 2017 10 October 2017 10 October 2017
27 EP n/a e) Partners and ext. funding
At the bilateral you were asked to provide a written outline of what NERA will be bringing to the project and how you have ensured this provides value for money to customers. Please provide this in response to this question 05 October 2017 10 October 2017 10 October 2017
28 EP n/ag) Robust methodology/ready to
implementPlease provide more details on the interactions you have had with Government departments/ officials regarding the project. 05 October 2017 10 October 2017 10 October 2017

Electricity North West Power Saver Plus Q&A
Network Innovation Competition 2017 – Q&A
Electricity North West’s Power Saver Plus Project
The following written answers are the responses issued individually to Ofgem combined into one document for ease of review.
Question number Response issued to Ofgem
Question number Response issued to Ofgem
Q1 24 August 2017 Q23 26th September 2017
Q2 24 August 2017 Q24 3rd October 2017
Q3 24 August 2017 Q25 10th October 2017
Q4 24 August 2017 Q26 10th October 2017
Q5 24 August 2017 Q27 10th October 2017
Q6 29 August 2017 Q28 10th October 2017
Q7 29 August 2017 Q29
Q8 29 August 2017 Q30
Q9 29 August 2017 Q31
Q10 7th September 2017
Q11 7th September 2017
Q12 7th September 2017
Q13 7th September 2017
Q14 14th September 2017
Q15 14th September 2017
Q16 14th September 2017
Q17 14th September 2017
Q18 14th September 2017
Q19 14th September 2017
Q20 19th September 2017
Q21 26th September 2017
Q22 26th September 2017

Electricity North West Power Saver Plus Q&A
Question 1:
Section 9 – Project Deliverables
Under Project Deliverable 1 you have listed 9% of the NIC funding request against the standard Project Deliverable relating to compliance with the Governance Document. As indicated within the Full Submission Guidance this Project Deliverable should not have any funding allocated against it, as non-compliance would be a licence breach. Please can you provide an amended breakdown of the Funding Allocated against each project deliverable?
Answer 1:
Apologies, this was our oversight on the latest guidance. The costs attributed under the compulsory deliverable were all costs associated with learning and dissemination activities, report writing, the independent review of deliverables being met and a proportion of project management/support costs. We have apportioned these costs elsewhere under their associated deliverables. The revised percentages are as follows. We will include these revised numbers in our resubmission following the second bilateral.
Values Revised Original
Deliverable 1 0% 9%
Deliverable 2 15% 14%
Deliverable 3 7% 7%
Deliverable 4 20% 20%
Deliverable 5 15% 14%
Deliverable 6 19% 17%
Deliverable 7 6% 5%
Deliverable 8 7% 6%
Deliverable 9 10% 8%

Electricity North West Power Saver Plus Q&A
Question 2:
b) Value for money
Within the ENWL network, if LCT demand tends to be clustered and it is mostly in affluent areas, it implies that more affluent areas will also be the first beneficiaries of the efficiency measures which will be paid for by less affluent customers. Is that correct? Or will less affluent areas sharing networks with affluent ones be targeted?
Answer 2:
Within the trials, during the site selection procedure we will focus on selecting a representative set of networks and a representative set of customers on these networks. The selection of a representative customer group is crucial to ensure replicability and to test the hypothesis that this approach can work across GB as a whole.
The Power Saver Tool will be constructed in such a way that it will provide a balanced customer and network focus, and can be agnostic of the type of customer it benefits. Equally it could be used to focus on vulnerable customers within a constrained area. In practice, the cost effective delivery of energy efficiency measures as an alternative to network reinforcement will deliver a benefit to all customers, as reinforcement cost is avoided, and this saving is shared by all customers on our network.
Including the wider societal benefits of energy efficiency within the updated CBA will allow the different categories of customer on a network to be monetized. For instance, a £10 reduction on utilities spend for a fuel poor customer has a greater real world value to them than the same £10 avoided for a more affluent customer. This monetization of customer types will add a further layer to a DNO’s decision-making to ensure that the work it carries out meets the needs of the network and its customers.

Electricity North West Power Saver Plus Q&A
Question 3:
b) Value for money
If PV is deployed by the DNO at target properties or substations, who will own the PV and will they also benefit from any energy generated through FiTs or equivalents or will this be socialised?
Answer 3:
The monetised benefits for PV on municipal buildings presented within the submission are achieved through deferment of reinforcement and reduction in the upstream generation required. However, once deployed by Electricity North West, ownership is expected to be transferred to the customer, thus customers would be free to directly benefit from FiTs or equivalent mechanisms if they were metered.
Substation PV installations would be deployed to offset local losses and would not be metered. The DNO would therefore not be in a position to benefit from FiTs or equivalent mechanisms. Instead the financial benefit of offsetting losses at the local level are expected to be socialised through modification of the line loss factor which PS+ aims to inform.

Electricity North West Power Saver Plus Q&A
Question 4:
d) Is innovative
The customer engagement part of the project will carry the most risk as several previous Tier 1 and Tier 2 LCNF projects requiring large scale recruitment among customers have not been as successful as hoped. What lessons have been learnt from these failed projects? Identify the projects learnt from.
Answer 4:
Electricity North West reviewed a range of comparable innovation projects requiring large scale recruitment ahead of the submission and focused on the live projects such as SSEN’s SAVE and UKPN’s energywise to gain the most recent learning which has already taken account of earlier learning.
The learning from these live projects and the ENWL funded Power Saver Challenge project, identifies the initial and ongoing customer engagement, recruitment and education phase as crucial to ensuring successful delivery of the project. We have engaged with a lead partner on this key area of the Power Saver Plus project, who has extensive experience of carrying out this work on similar projects within our region.
SSEN SAVE set out to trial their methods within a comparable sample size to PS+ and the learning from the recruitment phase is relevant to our project. The project suffered a significant attrition rate within the first six months which was three times greater than anticipated. It has been identified that sustained communication with customers between recruitment and the trial is key to maintain engagement. Separately, potentially valuable participant data was lost due to a number of the in-home monitoring devices not polling data back to the web-based portal. The complexity and cost associated with maintaining in-home monitoring has been accounted for in PS+, with the project focusing predominately on substation level monitoring.
UKPN energywise concentrates on vulnerable and fuel poor customers and has tailored its approach to engage with this specific portion of the domestic customer base. The project has trialled a limited selection of energy efficiency measures and a time of use tariff through their supplier partner. In incorporating two separate methodologies, delivered via a both a supplier and a DNO, some participant confusion was identified. The PS+ approach limits the number of points of contact with the end-customer, focusing on delivery of energy saving measures. The branding used on project materials was identified by UKPN as creating confusion and being one reason for reduced participation. The PS+ branding will be consistent throughout and ENWL will closely review this area of the trial to draw in any additional learning.
Under our own project, Power Saver Challenge, key learning has been taken into account when drafting the methodology for this submission. The most pertinent areas of this learning for successful recruitment are:
• Obtain the support of local councils and other community bodies from the outset • Have one central customer-focused partner handling all communications • Apply sufficient resource and time to the development of effective communication
messages / materials

Electricity North West Power Saver Plus Q&A
• Recruit and train local residents to recruit on our behalf and become ‘PS+ champions’ • Over-recruit at the beginning (recruit a sufficiently higher number than the final required
number of participants) • Allow sufficient time for recruitment and allow for ongoing engagement with recruits • Employ a mixture of face-to-face, telephone and digital recruitment methods • Employ a range of appropriate incentives and rewards for participation.
The Power Saver Plus project team will work with Impact Research and The Energy Saving Trust to design an engagement and recruitment strategy for the customers participating in the trial, directly communicating with other DNOs such as SSEN and UKPN as required. This strategy will encompass multiple channels of engagement, recognising that different approaches are needed in order to reach all types of customers.

Electricity North West Power Saver Plus Q&A
Question 5:
g) Robust methodology/ready to implement
The development of a new CBA tool is probably an industry activity. Has it been considered as collective project under the umbrella of, for example, the ENA?
Answer 5:
We consider that the fastest and most cost-effective route to development of the CBA is to take a staged approach with ENWL using the expert guidance of an economic and technical partner who is experienced in building these models. The first key stage is to conduct the fundamental thinking and conceptual development of what could reasonably be included within the CBA, including how each area could be measured and monetized to create NPV values and a list of potential scenarios. This creates the foundation set of scenarios upon which a final solution could be built.
Once this first stage has been carried out we will then (under the final calibration phase) engage with the wider industry to present these scenarios and work with other stakeholders in the industry to agree upon a preferred approach based upon the work carried out.

Electricity North West Power Saver Plus Q&A
Question 6:
A.1 – a) Enviro+consumer bens
Please amend Figures A1.1, A1.2 and A1.3 to include a total line which has the sum of the benefits for all the methods.
Answer 6:
The tables below have been amended to include the total sum of benefits for all of the 6 trial methods. We will include these revised tables in our resubmission following the second bilateral.
A.1.1
A.1.2
Method cost(£k)
1 0.35 0.223 0.35 0.48 0.572 0.75 0.223 0.31 0.43 0.53 0.04 0.223 0.5 0.7 0.824 0.27 0.223 0.24 0.33 0.395 0.28 0.223 0.13 0.19 0.236 21.4 0.223 0.35 0.32 0.28
Total 23.09 1.338 1.88 2.45 2.79
Financial benefit (£m) – per individual solution on an NPV basisBenefit (£m)
Scale Trial Base case cost (£m)
2030 2040 2050 Notes Cross referenc
esPost-trial deployment (individual solutions)
See below
Method cost(£k)
1 0.35 0.223 2.29 4.36 5.672 0.75 0.223 2.02 3.84 5.023 0.04 0.223 3.3 6.28 8.254 0.27 0.223 1.56 2.96 3.855 0.28 0.223 0.24 0.44 0.576 21.4 0.223 1.58 2.6 3.06
Total 23.09 1.338 10.99 20.48 26.421 0.35 0.223 30.48 57.89 75.242 0.75 0.223 26.82 50.94 66.713 0.04 0.223 43.89 83.36 109.54 0.27 0.223 20.72 39.37 51.175 0.28 0.223 3.17 5.79 7.536 21.4 0.223 20.98 34.53 40.64
Total 23.09 1.338 146.06 271.88 350.79
Financial benefit (£m) – scaled up to Electricity North West and GB including NPV effectsBenefit (£m)
Scale Trial Base case cost (£m)
2030 2040 2050 Notes Cross referenc
esElectricity NorthWest scale
See below
GB scale See below

Electricity North West Power Saver Plus Q&A
A.1.3
Scale Trial 2030 2040 2050 Notes
Cross referenc
es1 331 487 6382 407 600 7853 435 641 8394 562 828 10835 25 51 766 354 857 980
Total 2114 3464 4401
Energy savings (MWh)
Post-trial deployment (individual solutions)
Benefit
See below
Trial 2030 2040 2050 Notes
Cross referenc
es1 2,460 6,654 12,2222 3,031 8,197 15,0553 3,237 8,756 16,0814 4,181 11,307 20,7675 107 439 1,0096 1,767 5,388 10,832
Total 14,783 40,741 75,9661 32,674 88,368 162,3032 40,249 108,854 199,9293 42,993 116,274 213,5564 55,522 150,159 275,7925 1,425 5,833 13,3986 23,466 71,553 143,849
Total 196,329 541,041 1,008,827
Energy savings (MWh)Benefit
ScaleElectricity NorthWest scale
See below
GB scale See below

Electricity North West Power Saver Plus Q&A
Scale Trial 2030 2040 2050
Cross referenc
es1 122 157 1692 151 194 2083 161 207 2224 208 267 2875 10 16 176 127 210 235
Total 779 1051 1138
See below
Carbon savings (tCO2)Benefit
NotesPost-trial deployment (individual solutions)

Electricity North West Power Saver Plus Q&A
Question 7:
c) Generates new knowledge
For Trials 1, 2, 3 and 5, please highlight the additional benefits of conducting the trials over a desktop exercise.
Answer 7:
Desktop modelling of the measures in trials 1-3 and 5 would have to be based on a set of assumptions. The combined effect of these assumptions could result in findings very different to the result of delivery and adoption of these measures in the real world. It is only via a practical trial that the impact on energy demand of these interventions can be assessed. The results from the application of these methods are the foundation of the Power Saver Tool and to model the results would have a significant impact on the validity of the tool.
A desktop exercise can assume a notional benefit for one customer and extrapolate this, but the price point to achieve the required concentration of uptake to achieve the desired network benefit needed is unknown. The actual KWh saved and peak demand reduction at network level, where factors such as diversity can act to either multiply or dilute benefits, are also unknown, and this learning can be used to inform and refine future desktop modelling. Indeed, Northern Power Grid’s project with NEA & Agility Eco (a desk based study that considered energy efficiency) explicitly states that in order to gain confidence in desk-based assumptions, practical pilots are necessary to show that the peak demand reductions can actually be delivered.
Power Saver Plus is a significant departure conceptually and practically from current BAU for a DNO; we consider that it is important to test the acceptability and practical application of this approach in a trial environment. We also believe that this approach has the potential to bring significant benefits to our customers, in terms of alleviating fuel poverty, reducing network costs and other environmental and societal benefits. Without gathering customer insights of these benefits in a real word trial environment, we believe that this significant learning would not be captured.
The output from the trials will have wide application across the industry and government in terms of understanding the true impact of energy efficiency measures – and hence the optimum strategies for incentivisation.

Electricity North West Power Saver Plus Q&A
Question 8:
B.1
In Appendix B.1 you state that monitoring will be conducted at substation level only for all trials other than the heating trials, however elsewhere it’s stated that monitoring will be conducted at customer level for all trials. Please confirm whether or not monitoring will be conducted at the sites where energy efficiency measures are installed.
Notes on question: Under section 2.3 we state that we will measure electricity consumption and peak loading data at customer level by deploying a small number of energy monitoring devices and accessing smart meter data where available. Under Appendix B.1 we state that we intend to conduct in-home monitoring for all heating trial participants.
Answer 8:
We considered the deployment of in-home monitoring carefully when designing the scope of the trials. Given the focus of the trials on demonstrating network benefit and the significant cost of deployment of in-home monitoring over a trial of this scale, we determined that the cost of in-home monitoring adds value to the project in heating trial alone, so that usage data can be linked with thermal monitoring data in the home. This is the only trial for which we have included a cost for in-home monitoring. The smart meter rollout may give us the option to access customer level usage data and we will explore any opportunities arising from availability of this additional data, applying robust data privacy controls for any customers who provide us with authority to access their usage data.
The trials will seek to gain insight on access to a customer’s usage data through the customer engagement and recruitment phases of the trials and deliver a “Good practice guide on personal data related to PS+ as business as usual” (Reference 4 of Successful Delivery Reward). Prior to this learning and project deliverable being generated, we consider that asking all participants to provide access to home level usage data could be a barrier to recruitment and retention of trial participants.

Electricity North West Power Saver Plus Q&A
Question 9:
a) Enviro+consumer bens
Your submission shows the financial benefits of the proposed trial method versus conventional reinforcement. Please explain why conventional reinforcement is the most efficient method in use today. Have you considered other methods to address the problem, eg ANM or DSR. Within the Poyry report (which accompanied the Innovation Review) you contributed data to indicate 37% of the methods trialled under the LCN Fund are ready for use in business as usual and a further 41% are ready for use in the right circumstances. This would imply that there are more efficient methods available to licensees than traditional reinforcement.
Answer 9:
The methods described in the Poyry report are defined as those which have potential for use in business as usual (BAU) now, could contribute to BAU in the future and those which would need significant further work before a BAU solution is obtained.
The Electricity North West projects considered within the Poyry report were: Tier 2: Capacity to Customers (C2C), FLARE, Smart Street and CLASS and Tier 1: The Bidoyng Smart Fuse, Low Voltage Integrated Automation (LoVIA) and Voltage Management of LV Busbars. All of these projects are based around cost-effective management of our own assets. PS+ differs fundamentally from these forerunners in that we are examining the network benefit of the delivery of efficiency at the customer side of the meter.
Electricity North West and other DNOs have initiated new and significant work under innovation funding initiatives so far and we have selected the PS+ project as it complements and adds to the work already carried out, and would provide additional benefits to our customers, our network and the environment.
We have traditional methods as a known reference point against which benefits can be measured. In conducting our CBA, we are looking to deliver a solution at a lower cost than the most efficient method currently in use. This is the approach taken in all trials and allows comparison of smart, non-traditional and energy efficiency measures against a common base. We have based our cost benefit modelling for traditional approaches around solutions that are deliverable under BAU today. We cannot consider approaches that have yet to be launched and proven under BAU as alternatives to the energy efficiency measures we are intending to trial, as these methods are not proven or included under the current Ofgem CBA. Our stated savings are not based upon the next best un-proven smart solution; however where these are included in the future then these can be factored in where appropriate as alternative options.
The examples of ANM and DSR cited differ to the methods we are proposing to deploy under PS+ in that they are only used at HV or EHV level and are not currently proven at LV level. These approaches are also methods of load management and load shifting, whereas the measures we intend to trial look beyond the meter to reduce the total load and usage through our network rather than shift the time of use, delivering additional network, customer and carbon benefits.

Electricity North West Power Saver Plus Q&A
Question 10:
Multiple
Please explain the exact network problem you believe this solution will resolve?
Answer 10:
The primary aim of the PS+ trials is to demonstrate that strategically deployed energy efficiency measures and distributed generation in areas of network constraint can be used as one of a range of tools to deliver a cost effective solution for deferring the load related replacement of assets. This approach is one of the ways we can utilise our assets efficiently and minimise load-related expenditure.
The continued move towards greater domestic level electrification of heat and transport will result in capacity limits being breached on the local network. Here load diversity is lowest thus forecast increases will lead to thermal and or voltage constraints. The PS+ solution will reduce consumption, facilitating the connection of further low carbon technologies without the need to conduct costly reinforcement. PS+ methods would be added to the innovative tools ready for BAU deployment or currently under development, forming a toolkit of measures that could be deployed individually or in combination instead of traditional reinforcement. The unique attribute of energy efficiency in the context of these tools is that as well as delivering a network benefit, it has the potential to build upon the benefits of low carbon technologies to deliver a wide range of additional benefits to our customers and the environment. Through our cost benefit analysis modelling we have shown that when compared to the alternatives included within the existing Ofgem CBA model, energy efficiency deployment shows a positive NPV value for customers. This benefit figure could be considered as a conservative view, as there are a range of additional non energy system related benefits which could be considered under a revised CBA and would further add to this positive figure.
The trials will prove that using the appropriate channels of engagement, a DNO can engage with its whole customer base to deliver a network benefit at scale. It will deliver the tools with which a DNO could consider this approach alongside other solutions and make an informed decision to take the same approach.

Electricity North West Power Saver Plus Q&A
Question 11:
Multiple
Please advise if successful, how the proposed network tool will change your internal p2/6 implementation policy?
Answer 11:
P2 is an annex 1 document to the Distribution Code and specifies the level of security of supply to be provided to customers in varying levels of demand groups. It does not specify how any capacity constraint should be resolved.
Power Saver Plus aims to show that energy efficiency measures are an efficient and viable means of solving capacity constraints.
Power Saver Plus would provide DNOs with a tool set to deploy energy efficiency measures at scale as an alternate way to resolve network constraints. It also provides via the CBA a means to select the most efficient technique to deploy in any given scenario, i.e. to choose between all available techniques including traditional, smart interventions and efficiency measures.
Our internal p2/6 implementation policy allows for the consideration of alternative approaches to ensuring security of supply.
The PS+ trials will generate qualitative and quantitative real world data which will inform the tool and enable more accurate consideration of efficiency measures as an approach to ensure security of supply.
If the energy efficiency approach is proven in this real world trial, it will stand with other proven system security interventions and form part of our implementation policy for compliance with p2/6.
It is of note that ENWL chairs the current P2 working group and will ensure the new P2/7 recognises the contribution that energy efficiency measures can make.

Electricity North West Power Saver Plus Q&A
Question 12:
Multiple
Please outline how you have engaged with the suppliers/ providers of the existing ECO scheme?
Answer 12:
During the scoping phase of the PS+ trials we reached out to a number of energy suppliers and engaged with a ‘big six’ energy supplier and another, more recent entrant to the market. We found it challenging to gain insights from delivery of their ECO obligations, but had some high level interaction and conducted some wider research.
We established that the large suppliers typically have in house resource to deal with the delivery of their obligation under ECO, or bring elements of the supply chain in house to deliver improved service and greater control and reporting. The smaller supplier we spoke to had only just reached the threshold for ECO obligation and as such did not have internal resource to fulfil its requirements, therefore they outsourced to a third party for delivery and the required reporting outputs were provided to them by the third party.
It is important to note that suppliers target a non geographically specific volume of customers to achieve a given energy and carbon saving.
Power Saver Plus is aiming to target very specific groups of customers located in defined areas of the network. This has significantly different delivery challenges to energy company obligations requiring much higher customer acceptance rates to mitigate network constraints. However it also significantly increases the benefits to customers from efficiency measures, as network benefits including reduced capacity investment and reduced network losses, are stacked in addition to the benefits delivered by current arrangements.

Electricity North West Power Saver Plus Q&A
Question 13:
Multiple
Please provide examples you have considered as part of your background research for the project in other industries approach to changing customers' behaviour? How successful has this been?
Answer 13:
Through the previous projects and experience of our partners we have drawn upon perspectives on customer engagement and behavioural change outside the energy industry, as well as using the findings from our own forerunner project, the Power Saver Challenge. When conducting the cost benefit analysis modelling of behavioural change we needed to establish some wider insights on behaviour change and a realistic timescale over which the effects of behavioural change could be measured. We decided to focus on energy usage behaviour change rather than include other types of behaviour change, as these would provide us with insight with which we could draw meaningful parallels with our own trials.
Our partner, the Energy Saving Trust provided us with a short research paper on energy behaviour change and its persistence over time, drawing from its own research and a literature review of previous work in this area. This paper is included as Appendix E to our main submission.
Line 35 of our project plan is for a literature review that evaluates existing data and literature (including an overview of other industries approach to changing customers’ behaviour). Learning will be transferred where appropriate to deliver a positive impact on energy consumption.
Electricity North West Power Saver Plus Q&A
Question 14:
a) Enviro+consumer bens
Please could you clarify the discrepancies between figures listed for the carbon benefits listed in the Full Submission on p.18 / the appendices and the one listed in the 1st bilateral meeting materials presentation
Answer 14:
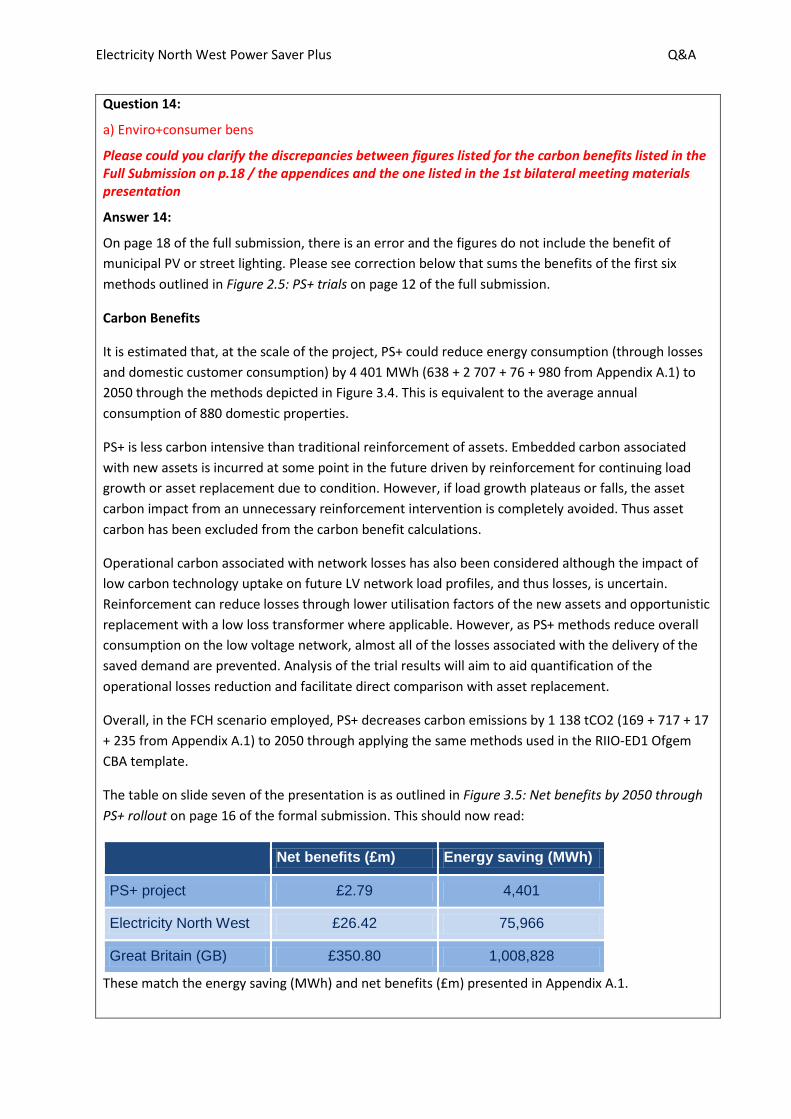
On page 18 of the full submission, there is an error and the figures do not include the benefit of municipal PV or street lighting. Please see correction below that sums the benefits of the first six methods outlined in Figure 2.5: PS+ trials on page 12 of the full submission.
Carbon Benefits
It is estimated that, at the scale of the project, PS+ could reduce energy consumption (through losses and domestic customer consumption) by 4 401 MWh (638 + 2 707 + 76 + 980 from Appendix A.1) to 2050 through the methods depicted in Figure 3.4. This is equivalent to the average annual consumption of 880 domestic properties.
PS+ is less carbon intensive than traditional reinforcement of assets. Embedded carbon associated with new assets is incurred at some point in the future driven by reinforcement for continuing load growth or asset replacement due to condition. However, if load growth plateaus or falls, the asset carbon impact from an unnecessary reinforcement intervention is completely avoided. Thus asset carbon has been excluded from the carbon benefit calculations.
Operational carbon associated with network losses has also been considered although the impact of low carbon technology uptake on future LV network load profiles, and thus losses, is uncertain. Reinforcement can reduce losses through lower utilisation factors of the new assets and opportunistic replacement with a low loss transformer where applicable. However, as PS+ methods reduce overall consumption on the low voltage network, almost all of the losses associated with the delivery of the saved demand are prevented. Analysis of the trial results will aim to aid quantification of the operational losses reduction and facilitate direct comparison with asset replacement.
Overall, in the FCH scenario employed, PS+ decreases carbon emissions by 1 138 tCO2 (169 + 717 + 17 + 235 from Appendix A.1) to 2050 through applying the same methods used in the RIIO-ED1 Ofgem CBA template.
The table on slide seven of the presentation is as outlined in Figure 3.5: Net benefits by 2050 through PS+ rollout on page 16 of the formal submission. This should now read:
Net benefits (£m) Energy saving (MWh)
PS+ project £2.79 4,401
Electricity North West £26.42 75,966
Great Britain (GB) £350.80 1,008,828
These match the energy saving (MWh) and net benefits (£m) presented in Appendix A.1.

Electricity North West Power Saver Plus Q&A
Question 15:
a) Enviro+consumer bens
Please provide the capacity savings benefits in terms of the peak network capacity released rather than the reduction in energy use by the network customers who receive the energy efficient solutions.
Answer 15:
While the energy efficiency of each device is known and documented, there is limited evidence for the peak reduction these can offer when deployed across a wide geographical area with a diverse customer base and variety of housing types.
This project will provide vital insight into the actual peak reduction achievable, but to define the network benefits some base assumptions must be made. These are as follows:
Appliances
• Peak load reduction of 0.148kW o Assume utilisation is eight hours, 0.74 hours and 0.85 hours per day for fridge /freezers,
washing machines/tumble dryers and dishwashers respectively o Using the average reduction between A+++ and the most commonly owned and
utilisation the peak load is calculated at 0.212kW o Assume 70% diversity factor, reducing to 0.148kWp
Heating
• Peak load reduction of 0.385kW o Assume the local thermal constraint is during the winter peak o kWh / days in year / h/day = 0.385kW
Lighting
• Peak load reduction of 0.027kW o Assume only 25% of the lights contributing to the 150kWh reduction are on during an
evening peak o 10 halogen bulbs are replaced with 10 LED lights (roughly this is a 60W light bulb going to
a 6W light bulb; so a 54W reduction in load Behaviour
• Peak load reduction of 0.074kW as derived by Delta-ee. Little saving at peak time included for in the model which is a pessimistic approach
This data can be presented in an updated version of Figure 3.6: Customer benefits per intervention which is depicted below.

Electricity North West Power Saver Plus Q&A

Electricity North West Power Saver Plus Q&A
Question 16:
b) Value for money
What are the barriers to collaborating with retailers/manufacturers and undertaking this work as BAU?
Answer 16:
PS+ will focus on proving the business case for energy efficiency from a network perspective, but the introduction of a retailer/manufacturer in a BAU scenario has not been discounted. While a supplier may offer discounts for bulk purchasing at the trial stage, based upon experiences under our Power Saver Challenge project, the likelihood of financial support was believed unlikely. There would be no guaranteed income stream for the retailer, as until the business case is proven, it is not certain which methods will prove the most effective.
From a trial perspective, introduction of a retailer could introduce a risk to the trials as their brand, customer engagement and external media campaigns could influence behaviour preventing fair comparison of the methods on trial. When ready to roll out to BAU, a retailer having been involved in the trials could have an unfair advantage over its competitors limiting competition and failing to deliver best value.
DNO leadership is core to this project, enabling methods to be trialled independently on a like for like unbiased basis and later in partnership to gather the results to form an optimal solution. The power saver tool combines this learning, stacking the benefits and enabling more informed decision making for a range of stakeholders.
Once proven in the trials, ENWL proposes that DNOs should engage with appropriate manufacturers and retailers to initiate a procurement process and encourage competition to deliver the best balance of price and quality for the DUoS customer.

Electricity North West Power Saver Plus Q&A
Question 17:
g) Robust methodology/ready to implement
Please provide more information on how you have considered the best practice examples from other sectors in relation to the proposed consumer engagement within the project - you have only cited one document within your application.
Answer 17:
Impact Utilities and the Energy Savings Trust have a deep knowledge and wide range of experience in delivering innovative and effective customer engagement and advice programmes; large scale measures installation programmes and field trials and technology evaluations across a range of traditional and emerging technologies. The partners are currently running a number of highly relevant programmes for utilities and national governments. A short of summary of some of these is provided below: Ofwat: Price Review 19 (PR19) customer engagement
One of our partners has developed an innovative customer-focused process to enable water companies to deliver a business plan with an increased focus on the end customer. The project incorporates multiple opportunities for engaging with customers through in-depth qualitative research as well as quantitative research. Customers will be educated about how they can support the delivery of services and directly involved in the development of a customer-centric survey measurement tool. This will ensure a thorough understanding of customers’ attitudes and behaviours that will feed into a business investment and prioritisation plan for PR19.

Electricity North West Power Saver Plus Q&A
The project partner has drawn upon their first-hand experience to identify best practice in customer engagement for this project. Their proposed approach incorporates the elements that are known, through first-hand experience, to be most effective at establishing effective and sustained customer engagement. The approach transfers significant learning from other sectors; a method the partners propose to emulate in the PS+ project. Scottish Water efficiency trial
One partner is currently running a water efficiency trial with Scottish Water trialling the use of innovative water saving interventions in 1,000 homes. This programme has involved 550 in-home visits and an in-depth evaluation of the most effective behavioural advice approaches and technologies for reducing water consumption in homes. Relevant learning from this trial will be brought to the PS+ trials. Welsh Government fuel poverty programme: NEST
One of our partners is responsible for the customer segmentation, targeting, recruitment, marketing, telephone advice and referrals mechanisms in support of the primary contractor, British Gas. In addition, they are responsible for the nationwide marketing, PR, media communications, social media and direct targeting via mail and phone. The scheme is deemed highly successful consistently exceeding the target of 5,000 referrals for measures each year.

Electricity North West Power Saver Plus Q&A
BEIS: National Energy Saving Advice Service (ESAS)
One of our partners manages the Energy Saving Advice Service on behalf of BEIS. ESAS supports a range of national policy initiatives including ECO, RHI and FiTs. They operate a dedicated customer support centre, through their partners HGS and provide:
Design and continual improvement of the customer journey through complex referral routes
Training for the customer contact centre staff The knowledge base and FAQ tools for use by advisers A customer energy assessment tool to enable the advisers to produce bespoke reports for
each customer The CRM for contact management Managing the referral routes for customers through to energy suppliers and other
organisations Managing an automatic, online funding eligibility check service in partnership with the
Department of Work and Pensions and HMRC Creating digital ‘self-service’ tools that enable digitally able customers to undertake basic
user journeys quickly and effectively
The ESAS call centre deals with over 150,000 customer contacts per year. Over 60% of current ECO activity is verified by our automatic eligibility referral process with the DWP and HMRC. The project’s success demonstrates their ability to design effective customer journeys and to iterate these in response to user feedback and changing policy initiatives. Scottish Government: Home Energy Scotland renewables and energy efficiency specialist advice service (HREESAS)
Our project partners run an extensive array of customer advice and intervention programmes for the Scottish Government. One programme of direct relevance to the ELNW programme is HREESAS. This service provides a tailored, impartial advice service to householders on possible domestic renewables and solid wall insulation (SWI) action they could take alongside other energy efficiency recommendations. Customers of the service receive advice through an in-person property audit or ‘remote’ in-depth support by a specialist advisor via telephone or email.
61% of all advice recipients implemented at least one recommendation and a further 11% are planning to implement at least one recommendation.
85% of advice recipients that had taken action attributed at least one action to the specialist support provided; 83% of advice recipients are satisfied or very satisfied with the service overall [1].
This project demonstrates partner experience of delivering high-quality in home surveys and advice that customers value and act on. [1] (Source: Evaluation of the specialist renewables and energy efficiency programmes, Energy Saving Trust, 22 December 2016 (Winning Moves))

Electricity North West Power Saver Plus Q&A
Question 18:
b) Value for money
Your submission states the energy efficiency measures will be treated as regulatory assets with the cost being spread over 45 years, please clarify how this will work for energy efficiency measures which have an expected lifetime of less than this, e.g. energy efficient lightbulbs?
Answer 18:
All devices issued in trials 1, 2, 3, 4, 5, 6 and 8 are to be customer owned post deployment. Only the PV deployed on substations would be owned and operated by the DNO as it will be installed on ENWL property. We have not pre-determined that the cost of all measures would be recovered over 45 years, but we have the ability to spread the cost over up to 45 years as appropriate. Appliances and Heating have an assumed asset life of 15 years as stated on Page 51 of our full submission. It is assumed that at the end of the asset life, the customer would replace with an equally or more efficient device. LED lights have an estimated life of 11 to 13 years and the assumption has been made that these too would be replaced with an equally efficient device in the future. To maintain the influence of behaviour coaching, re-engagement is required once every 6 years. The model includes a cost of £210 per customer (which is annuitised) for face-to-face re-engagement. In the case of PV, the asset life is taken to be 15 years. As its replacement by the DNO would be costly to the customer, it has been assumed that it may not be replaced. Thus benefits are only achieved for 15 years following deployment. As the output of panels presently decreases over time, an annual 1% reduction has been applied across the 15 years of active life. 1 Ofgem (2013), “Strategy decision for the RIIO-ED1 electricity distribution price control - Business plans and proportionate treatment”.

Electricity North West Power Saver Plus Q&A
Question 19:
b) Value for money
Please confirm when the industry CBA model created by the project will be signed off? How much money will have been spent by this juncture?
Answer 19:
Ofgem set out its approach to CBA at RIIO-ED1 in its final strategy decision published in 2013.1 Ofgem required companies to use CBA to demonstrate that the proposals in their business plans provided “the optimum solution which demonstrates best value for consumers”. In overview, Ofgem required companies’ CBAs to follow the guidance set out in the HM Treasury Green Book, which provides general principals and recommendations for CBA for central government policies, programmes and projects. Ofgem also provided DNO’s with a template spreadsheet which they were asked to populate for each project for which CBA was carried out. The CBA has two applications. Primarily it is used at the time of agreeing the scope of work for DNOs in setting a price control review. Ofgem’s guidanceis that “the overall investment plan should constitute all projects which have positive (or strictly non-negative) NPVs.” An example of this is the £10m losses improvement budget included in Electricity North West’s business plan for RIIO-ED1 for the construction of low-loss equipment. The justification for this entire expenditure was a CBA that demonstrated the value of carbon reduction to customers, despite the fact that the energy consumption costs and the value of carbon are not factors that have any effect on DNO revenues. The second application of the CBA model is the ongoing checking of project validity during the price control period. DNOs are obligations under the Regulatory Instructions and Guidance to utilise the CBA model to re-evaluate proposed projects and confirm their continuing validity before works commence. Ofgem envisage that the CBA approach will develop over time and should factor in the value of externalities to the Distribution Business. “CBA should include those non-marketed goods that can be monetised. We will continue to work with licensees to discuss and agree the principal monetised non-marketed goods for inclusion in the CBA. This may include for example the loss of supply, the value of carbon abatement, restoration costs, environmental damage and the value of preventing fatalities and injuries.” Currently the only monetised non-marketed good included in the basket of benefits that does NOT effectively accrue directly to the DNO is the cost of carbon. The RIIO-ED1 CBA approach is therefore limited in the extent to which it evaluated the external costs and benefits of projects in the business plan. Sensitivity analysis primarily concerns the economic life and the performance of the asset, rather than the sensitivity of benefits to future scenarios and uncertainty over valuations of attributes over time. In addition, the existing model does not take account of the wider costs and savings for consumers due to the impact of investment proposals on the wider electricity system, eg. savings in transmission network costs and savings in energy costs. Whilst Power Saver Plus is primarily aimed at reducing distribution network costs, the energy-saving measures used will have various other, wide-ranging benefits for consumers, such as cost savings in energy bills for those taking part, and externalities (eg. environmentally) to the benefit of all

Electricity North West Power Saver Plus Q&A
consumers. Therefore, a revised CBA is proposed in order to incorporate all benefits into investment decisions. There are three phases to development of the industry CBA model developed by PowerSaver Plus, with a usable product delivered at the end of each phase: Phase 1: Update Ofgem’s CBA model to take account of benefits accrued by the DNO as well as related savings in the energy system, such as transmission costs and energy costs. (April 2018 to December 2018). Phase 2: Updating CBA models to account for wider benefits accrued by society (January 2019 to September 2020) Phase 3: Regulatory Calibration; benchmarking the newly developed Phase 2 models against those used in other industries, and refining to take account of regulatory best practice. Formal consultation with Ofgem, DNOs and other stakeholders on whether the revised CBA should be incorporated into the Ofgem issued CBA for RIIO-ED2. (October 2020 until project completion) In Ofgem’s open letter on the RIIO-2 Framework, dated 12 July 2017, Ofgem set out their broad approach to stakeholder engagement including the high-level timetable for the framework review which will conclude Q2 of 2018 with publication of the RIIO 2 Framework decision. Electricity North West will engage in this process to raise awareness of the Power Saver Plus project and CBA development. During consultation on RIIO 2 Strategy, a meeting of the Price Control Review Forum will be held in addition to policy working groups to develop further thinking on the output measures and their associated incentives. Power Saver Plus will seek to publish and consult on options for Phase 1 and Phase 2 of the CBA model development in line with these timescales. Input from stakeholders, including the cost assessment team at Ofgem will be sought to inform the approach to sign off of each phase of the CBA. Costs associated with this work are outlined in the table below.

Electricity North West Power Saver Plus Q&A
In light of this question, we have recognised that our project plan and budget omits activities or costs associated with stakeholder engagement and consultation for agreement and approval of the new CBA models. We will assess what these requirements will be and include in our resubmission. By following the above process we will ensure that Ofgem and other stakeholders have full visibility of the CBA model development and that they are able to input to its final form. In its phase 3 form it will constitute a final CBA proposal for use by DNOs in their RIIO-ED2 submission preparations and also for use in RIIO-ED1 investment decision making. The Power Saver Plus CBA model will therefore become the revised industry CBA tool for capacity investment management.
2018 2019 2020 2021 2022Phase 1Review of Ofgem's existing CBA modelsDraw up full list of "level one" benefitsReview appropriate valuation optionsConstruct updated CBA modelProduce Good Practice Guide for implementing CBA
Subtotal £62,000
Phase 2Draw up long-list of "level two" benefitsFinalise short-list of appropriate benefits to be quantifiedReview of appropriate valuation optionsUpdate CBA model to take account of "level two" benefitsUpdate Good Practice Guide
Subtotal £43,700
Phase 3Benchmarking against other CBA programmesProduce gap analysis reportUpdating CBA models and Good Practice GuideContinued regulatory support
Subtotal £38,880
Total £144,580

Electricity North West Power Saver Plus Q&A
Question 20:
Multiple
Project deliverable five appears to be focussed on project inputs rather than on learning from the project. Therefore the associated funding appears high relative to other deliverables more focussed on outputs. Please provide a justification that the proposed percentage of funding associated with this deliverable is appropriate.
Answer 20:
Our approach to allocation of project funding to each deliverable was to reflect the costs in delivering that activity and outputs. Deliverable five includes the purchase price of the monitoring equipment as well as installation, commissioning, storing and analysing the resulting data. This captures a wide range of elements which all link into and are vital for the successful delivery of other project outputs.
The 14% allocated also includes costs for subsequent decommissioning of the substation monitoring equipment. It includes full project costs for the collation, storage and analysis of all monitoring data gathered in the trials which will be a vital input to the Power Saver Tool. The learning generated will be delivered through production and publication of reports on the substation monitoring installs during and at the end of trial and a platform to ensure that monitoring data is available upon request. The cost includes the analysis of all substation data across the trials and the creation, peer review and publishing of reports detailing analysis and findings throughout the project. The costs associated with monitoring also include project management costs, contingency costs, replacement of failed monitoring units and re-visits to substations where data communications fail.
We have also included an element of the ENWL Trials & Technical lead costs across this deliverable as they have a portion of their costs associated here.
We have included a percentage allocation of costs under this deliverable for site selection and customer engagement activity. The early data analysis from the PS+ trials or new learning from other projects may require us to revisit our site selection procedure and target different areas of our network, or there may be a rationale to improve our approach by employing different engagement methods or reinforcing messaging to drive engagement.
All of the above elements are vital to the outcome of the project, ensuring that good quality consistent data is available to be fed into the project outputs. The cost also allows for course correction and alteration of our approach to bring in the latest learning to our trials and to establish the robust data required to feed into the outputs of the project

Electricity North West Power Saver Plus Q&A
Question 21:
Multiple
Please provide an indicative figure the amount a PV prosumer would currently expect to receive per KW of electricity generated.
Answer 21:
The purpose behind trialling the installation of PV on municipal buildings is to evaluate the network benefit of reducing load on highly loaded areas of our network. As such the PV installations will be sized and located such that the majority of energy generated is consumed within the host customer’s premises. Part of the work we will carry out prior to installation will be to consider what effects, if any, there may be on our network to identify and mitigate any unintended negative network effects.
The primary benefit to the customer of the PV installation is the avoided cost of imported electricity. Where generation does export onto our network we will advise the customer on the potential routes available for application for export tariffs, generation tariffs and FiTs to enable the customer to obtain the maximum benefit from the installation.
The prevailing rate of Feed in Tariff for properties with an EPC rating of A-D is 4.07p/kWh for installations with a capacity of <10kW, and 4.29p/kWh for installations with a capacity of 10-50kW. The actual income a customer will receive from each of the tariffs available will vary dependent upon the sites selected, the size of their installation, how much energy the export and the prevailing rates of the relevant tariffs.

Electricity North West Power Saver Plus Q&A
Question 22:
a) Enviro+consumer bens
Please confirm the choice of carbon intensity figures used to derive the estimates of GB Carbon savings in Figure A.1.3 and comment on the potential range of total GB savings.
Follow up to question 14
Answer 22:
As outlined on page 46 of the full submission, the Carbon Savings are based on the Electricity GHG conversion factors presented within the 2012 Guidelines to Defra / DECC's GHG Conversion Factors for Company Reporting document*.
The report provides a tonnes per MWh factor for 2012 and predicts a factor for all proceeding years up to 2050. The figure reduces year on year as the carbon intensity of electricity decreases. In the first year of the project the factor is 0.474, decreasing to 0.30 by 2030 and 0.01 by 2050.
The total GB savings have been extrapolated from the ENWL wide figures. This has been based upon previous work conducted by TNEI Services Limited for the Smart Street project, which analysed the replicability of PS+ based on the LV network types within the ENWL licence area.
*https://www.gov.uk/government/publications/2012-greenhouse-gas-conversion-factors-for-company-reporting

Electricity North West Power Saver Plus Q&A
Question 23:
b) Value for money
Based on your submission we understand that the day rates of your team will be as follows:
ENW , Impact Research ), BRE , Delta-ee , Energy Saving Trust ( , NERA and Uni of Salford . The rates of several of the partner organisations are well above the average for NIC and the academic rate is the highest of all submissions. Can you please justify these rates and explain the benefit and contribution these Contractor’s will make to the project.
Answer 23:
We have reviewed our cost calculations and have re-approached each of our project partners to validate the total number of days and day rate costs associated against our project costings. From this we have found that some of the average day rates presented in our bid have included some fixed costs for materials, software and other costs. Please see below the revised average day rate calculations based upon our corrected calculations.
Organis-ation
Electricity North West
Impact Research BRE Delta-ee University
of Salford
Energy Saving Trust
NERA
No of days 3 690 3 359 186 219 156 194 78
Day rates (average)
Before we selected our project partners for PS+ we ran a comprehensive procurement process, inviting proposals for collaboration on delivery of the key areas of the project in which ENWL would need support. We received responses from over 20 organisations across all areas to support us in the delivery of our project. We evaluated these responses on a like for like basis with the support of our internal procurement team and benchmarked each on a like for like basis. Our selection was based upon a balanced view of a range of criteria including quality, understanding of the project and overall cost. We believe that this approach of running a competitive process in the market enables us to demonstrate best value for our customers.
BRE consulting and Delta EE were selected as the lead partners on the delivery of the Power Saver Tool as well as having input into the customer engagement workstream and the other project outputs. Delta EE have a proven expertise in energy networks and energy efficiency and have committed some of their most senior consultants to the project. BRE have experience of building energy efficiency evaluation tools for other industries and bring a wealth of experience in the real world effects of energy efficiency in the built environment. They also authored the 2016 Every Home Counts report.
Impact Research and Energy Saving Trust are jointly delivering our customer engagement workstream and both have a detailed understanding of the best routes to engagement for a trial of this scale. Energy Saving Trust will provide a non-DNO led perspective on the project, bringing in a wealth of experience delivering customer engagement and advice in other industries and sectors. They will work closely with BRE and Delta EE on the Trials and Analysis and Learning and Dissemination workstreams.

Electricity North West Power Saver Plus Q&A
Salford University will provide input into the project using the expertise of their applied building and energy research group to inform all of our trials. They are also the project lead on the heating trial, having a specific expertise in the real world potential effects of heating in customers’ homes and aspects of thermal comfort and wellbeing linked with home heating.

Electricity North West Power Saver Plus Q&A
Question 24:
Mulitple
Please complete the attached table for each intervention listed in the Full Submission (please add additional rows for any which are not listed)
Answer 24:
Please see separate attached document.

Electricity North West Power Saver Plus Q&A
Question 25:
a) Enviro+consumer bens
As per the discussion in the bilateral please provide the numbers behind the graph on slide 8 of the pack
Answer 25:
PS+ interventions will be trialled with a fixed number of deployed devices. Once rolled out as BAU, the intervention selected will be the most efficient for each particular case. The benefit distribution and number of each intervention is therefore subject to some variation, yet based on the pre-trial data the following ‘break even’ point distribution can be estimated.
Note that the figures shown are the numbers of customers not devices. In response to questions and feedback from the Expert Panel during the second bilateral around value for money, we have interrogated project costs, specifically the amount of funding requested for the energy efficient appliances deployed in the trial. We have approached a number of electrical appliance retailers/installers and obtained indicative figures for volume discounts achievable for orders in the quantities we will require during the PS+ trials. In addition we intend to revise costs for appliances based on an assumed mix of free issue and subsidised interventions. We will incorporate these reductions and intend to submit revised project costs on this basis.

Electricity North West Power Saver Plus Q&A
Question 26:
a) Enviro+consumer bens
The 'Cap Headroom' model presented within the meeting assumed energy efficient devices would become the standard option in 2032 - please explain why the NPV level analysis shows benefits will continue to accrue after this? What are you fundamentally assuming at this point?
Answer 26:
The PS+ cost benefit analysis is based upon the Green Ambition scenario of the Electricity North West capacity forecasting tool which presents an anticipated load at each secondary substation out to 2050. The PS+ methods are only deployed to approximately 10% of the forecasted secondary network constraints, where existing learning indicated it is most economic to do so.
The benefits are calculated from their year of installation through to 2050, as it is assumed that customers would replace with an equally efficient device at the end of its useful life. Methods delivered out to 2050 are based upon the efficiencies of appliances available in 2017. However, as the efficiency of in-home devices is set to improve further, benefits can continue to be realised through DNO-led early adoption¹.
PS+ figures are based on deployment of the methods in to a relatively small portion of the forecasted network constraints and conservative load savings. Thus trialling of the methods is crucial as it facilitates validation and verification of the business case and directs BAU deployment to the areas of greatest benefit. ¹ Evaluation of the Energy Labelling Directive and specific aspects of the Ecodesign Directive ENER/C3/2012-523 – Final Technical Report

Electricity North West Power Saver Plus Q&A
Question 27:
e) Partners and ext. Funding
At the bilateral you were asked to provide a written outline of what NERA will be bringing to the project and how you have ensured this provides value for money to customers. Please provide this in response to this question
Answer 27:
The development of the CBA model was identified as a key work stream in the project, and as such the output required specialist assistance from an economic consultant in the field of cost benefit analyses, ideally with experience in the utilities sector.
We ran a procurement process for the selection of the consultant required and received responses from three economic consultancies. One declared a conflict of interest and declined to bid and we received completed quotes from two. We evaluated these responses on a like-for-like basis including cost, relevant experience and understanding of our requirements. Each proposal submitted was a competitive quote and was comparable in terms of cost, with day rates in this field notably higher than consultants in other areas of the project.
We awarded the work stream to NERA on the basis that we had carried out a full selection process and identified the solution with the best fit and with best value for our project. Their proposal put forward a set of fixed day rates for the duration of the project, with no inflationary increase applied. In addition NERA proposed to bring forward evidence from previous work they have carried out in this area (including previous research into international regulatory arrangements governing efficiency schemes) and we were able to recognise the value of this work as a contribution to our project.
Given the importance of the CBA model to the whole UK network RIIO-ED2 investment plan, it is critical that the development is conducted in a robust and acceptable manner. To that end and mindful of the Expert Panel’s comments, whilst academic input or lower cost consultancy would reduce project costs, in our view we would recommend that a consultancy with the experience and subject matter expertise such as NERA be used. Without this, the project risks not producing a CBA model acceptable by Ofgem and other key stakeholders.

Electricity North West Power Saver Plus Q&A
Question 28:
g) Robust methodology/ready to implement
Please provide more details on the interactions you have had with Government departments/ officials regarding the project.
Answer 28:
Our commercial strategy & support director, Paul Bircham, has been in liaison with a range of stakeholders at BEIS throughout the development of Power Saver Plus.
We have held three meetings and a workshop with BEIS during 2017 on the Power Saver Plus concept. We have also had numerous phone calls and provided briefing by email. Senior BEIS officials including Richard Mellish, deputy director fuel poverty and obligations and Patrick Allcorn, head of local energy have expressed their support for the project, interest in developing and realigning the ECO obligation in 2022 and agreement with the findings of the Power Saver Challenge report. We maintain regular contact with the BEIS team and our most recent discussion took place on 3 October where Patrick Allcorn enquired about progress and expressed his ongoing support for the concepts to be explored in Power Saver Plus.
15 March – First face-to-face briefing, London
Sam Balch (home and local energy)
An initial discussion took place on the idea for DNOs to take a bigger role in energy efficiency. Sam encouraged the further development of the project outline and agreed to facilitate wider discussion and a workshop with a broader range of BEIS officials. (see 18 May)
18 May – London workshop
Richard Mellish (Home and Local Energy)
Andrej Miller (Home and Local Energy)
Michael Rutter (Heat and Business energy)
Will Broad (energy strategy networks and markets)
Holly Jeffers (energy strategy networks and markets)
Electricity North West presented an overview of the project concept plus an outline of the Power Saver Challenge project and key findings.
RM was keen to explore the idea of DNOs being more involved in energy efficiency and agreed to discuss the concept of DNOs acting/investing behind the meter with Ofgem contacts.
AM complimented the project idea. He was keen to support and possibly be involved in the NIC bid. Andrej offered to write a letter of support to be included in the full submission.
June 12 – Briefing in Manchester
Helen Pearce (home & local energy)
29 June – Briefing in Workington
Patrick Allcorn (home and local energy)

Intervention
After Diversity
Peak reduction
(kW)
Gross Peak
Reduction
(kW)
Assumed
running
hours/year
kWh/year
reduction
£/kWh benefit (retail electricity
price if we are considering the
reduction on customer energy
bills)
£/ year
benefit (on
customer
energy bills)
£/kWh benefit (40% of retail
electricity price [i.e. the cost of
generating electricity] if we are
considering the avoided cost of
generation)
£/ year
benefit
(avoided cost
of generation)
Life of
measure
years
(appliance
life)
£ benefit over
life of measure
(on customer
energy bills)
£ benefit over
life of measure
(avoided cost of
generaiton)
Cost of
measure
(Appliance
cost)(£)
£/year saving in
distribution UoS
costs
£/year savings in
DNO’s network
reinforcement costs
(from deployment of
EE measure)
£/year savings in
DNO’s network
reinforcement costs
(over lifetime of EE
measure)
Appliances 0.14 0.212 627 133 £ 0.14 19.11£ 0.057£ 7.64£ 10 £ 191.12 £ 76.45 345.00£ £ 1.91 £ 1,858.00 £ 186.00
Heating 0.385 0.453 542 983 £ 0.14 141.26£ 0.057£ 56.50£ 20 £ 2,825.14 £ 1,130.06 750.00£ £ 14.13 £ 5,110.00 £ 255.00
Lighting 0.27 0.54 185 100 £ 0.14 14.37£ 0.057£ 5.75£ 30 £ 431.10 £ 172.44 50.00£ £ 1.44 £ 3,583.00 £ 119.00
Behaviour 0.072 0.085 N/A 50 £ 0.14 7.19£ 0.057£ 2.87£ 5 £ 35.93 £ 14.37 70.00£ £ 0.72 £ 956.00 £ 191.00
Solar PV 18.75 37.5 425 15938 £ 0.14 2,290.22£ 0.057£ 916.09£ 30 £ - £ 27,482.63 23,756.25£ £ 229.02 £ 610,000.00 £ 20,333.33
Combined Measures 0.357 0.51 549 280 £ 0.14 40.24£ 0.057£ 16.09£ 10 £ 402.36 £ 160.94 425.00£ £ 4.02 £ 4,738.00 £ 474.00