flow visualization and heat transfer … visualization and heat transfer characteristics for...
TRANSCRIPT

Flow Visualization and Heat Transfer Characteristicsfor Sphere-Packed Pipes
Kazuhisa Yuki,∗ Masumi Okumura,† Hidetoshi Hashizume,‡ and Saburo Toda§
Tohoku University, Miyagi 980-8579, Japan
Neil B. Morley¶
University of California, Los Angeles,
Los Angeles, California 90095-1597
and
Akio Sagara∗∗
National Institute for Fusion Science, Toki 509-5292, Japan
DOI: 10.2514/1.30141
Particle image velocimetry visualization to identify the complex flow structures in a sphere-packed pipe is carried
out by using a matched refractive-index method with a sodium iodide solution as the working fluid. The following
three flows were confirmed as representative flow structures in the pipe: a meandrous bypass flow with a high-flow
velocity due to the wall effect, two pairs of unstable twin vortices accompanied by a strong impinging flow to the pipe
wall, and a spouting flow from the central area of the pipe. In an experiment on heat transfer using water as the
working fluid, the wall-temperature distribution is measured with thermocouples and infrared thermography,
which makes clear a relation between the flow structures and the local heat transfer performance. Though an area
with a high wall temperature is formed by the flow stagnation located at a contact point between the sphere and the
heating wall, the colliding effect of the high velocity and of the meandrous bypass flow with the spheres significantly
affects the heat transport from the stagnation areas.On the other hand, the heat transfer performance is quite high in
a large gap area between the upstreamand downstream spheres because of the influence of the strong impinging flow
and the vortices that are both induced by the meandrous bypass flow.
Nomenclature
cp = specific heat at a constant pressureD = inner diameter of a circular piped = sphere diameterH = quantity of heat generation per unit volumeh = heat transfer coefficientk = thermal conductivity of a circular pipe in the heat
transfer experimentM = mass flow ratePr = Prandtl numberp = pressure of the fluidQ�z� = quantity of heat that the fluid has received from the
inlet up to location z in a streamwise direction.q = heat flux inputR = inradius of a circular pipeRed = Reynolds number based on sphere size
ReD = Reynolds number based on circular-pipe diameterr = location in a radial directionri, ro = inradius and circumradius of a circular pipeTb = bulk temperature of the fluidTw = inner wall temperature of a circular pipeT 0w = outer wall temperature of a circular pipeU = inlet velocity (superficial velocity in a sphere-packed
pipe)Up, Vp = root mean square of the velocity fluctuations in the
horizontal and vertical directions in a visualizingsection
u, v = mean velocities in the horizontal and verticaldirections in a visualizing section
z = location in a streamwise direction� = light path difference� = kinematic coefficient of viscosity
I. Introduction
N UCLEAR fusion reactors currently under research anddevelopment are generally classified as two types, a solid
breeder reactor and a liquid breeder reactor, according to thebreeding method for tritium, which is used as fuel for the fusionreaction. The liquid breeding method has the advantage of asimplified reactor system, because it enables a self-cooling systemwhereby the breeder materials, including Li, can work as a coolantfor plasma facing components. In the heliotron-type fusion reactorforce-free helical reactor (FFHR) promoted by the National Institutefor Fusion Science (NIFS), the greatest benefit of the blanket designadopting the spectral shifter [1] that Sagara and Imagawa proposed isthat it is basicallymaintenance free for 30 years, with the emphasis onblanket maintainability. However, one downside to this approach isthat the heat load on a first wall shoots up higher than ever before.High heat removal of approximately 1 MW=m2 on heat flux, bysingle-phase flow, is therefore a significant research and develop-ment issue that holds the key of realizing this blanket design.
Presented as Paper 5426 at the 9th AIAA/ASME Joint Thermophysics andHeat Transfer Conference, San Francisco, CA, 5–8 June 2006; received 3May 2007; revision received 6 December 2007; accepted for publication 10December 2007. Copyright © 2008 by the American Institute of Aeronauticsand Astronautics, Inc. All rights reserved. Copies of this paper may be madefor personal or internal use, on condition that the copier pay the $10.00 per-copy fee to the Copyright Clearance Center, Inc., 222 Rosewood Drive,Danvers, MA 01923; include the code 0887-8722/08 $10.00 incorrespondence with the CCC.
∗Assistant Professor, Department of Quantum Science and EnergyEngineering, Sendai; [email protected].
†Graduate, Department of Quantum Science and Energy Engineering,Sendai; [email protected].
‡Professor, Department of Quantum Science and Energy Engineering,Sendai; [email protected].
§Professor Emeritus, Department of Quantum Science and EnergyEngineering, Sendai; [email protected].
¶Associate Professor, Mechanical and Aerospace Engineering Depart-ment; [email protected].
∗∗Professor, Fusion and Advanced Technology System Division;[email protected].
JOURNAL OF THERMOPHYSICS AND HEAT TRANSFERVol. 22, No. 4, October–December 2008
632

On another front, the proposition of the high-temperature moltensalt FLiBe as a working fluid for FFHR holds some advantages,which are as follows: a high heat capacity, a low electricconductivity, and a low vapor pressure. However, the heat transferperformance of FLiBe, which is a highPr number fluid, is inferior tosuch liquid metals as Li or LiPb, and so the application of a heattransfer enhancement is absolutely essential. Furthermore, when it isused as the cooling technology for the commercial-type fusion powerreactor, it is not enough to simply ensure coolability with somemargins. In setting up a long-term nuclear power plant, it is importantto develop a heat transfer promoter that can withstand neutron loadandmaintain chemical compatibility between the structural materialsand the high-temperature molten salt FLiBe and can also lead to abeneficial effect on soundness, profitability, and maintainability.Additionally, heat removal at a lower flow rate is desirable whentaking into account a magnetohydrodynamic (MHD) pressure dropand electrolysis [2] that becomes problematical for the molten saltflow under a strong magnetic field. Erosion could also emerge as aproblem in a plant as large as a nuclear power plant.
To develop the heat transfer promoter for the highPr number fluidFLiBe in accordance with the strict conditions, the authors havefocused on a sphere-packed pipe (SPP) as a basic heat transferpromoter. As Fig. 1 shows, the SPP involves comparatively largemetal spheres inside the pipe and has the characteristic of being ableto easily change to a turbulent regime in comparison with the case ofa single sphere, as well as the increase of the heat transfer area. At thesame time, the SPP can also heighten the effect of neutronmultiplication required in the fuel generation with the selection of Beor Pb asmaterials for the spheres. The SPP research should ultimatelylead to the development of advanced SPP, which can dramaticallyreduce heat resistance at a contact point between the sphere and theheating wall and improve the existing fin effect by putting riblets ordimples on the sphere surface as a means of drag reduction. Againstthis background, the authors have evaluated the fundamental heattransfer performance of the SPPs using the Tohoku–NIFSThermofluid loop, which can be regarded as the largest forcedcirculation loop for high-temperature molten salt in the world [3,4].Moreover, to figure out a relation between the pressure-drop/heattransfer characteristics and the inside flow structures in the SPPregularly packed spheres, the pressure-drop characteristics wereevaluated first using water as the working fluid [5]. This experimentshowed that the SPP with a certain sphere size led to a greaterreduction in the pressure drop than that predicted by Ergun’scorrelation [6] for a packed bed flow, and the pressure drop almostcorresponds rather to a drag model [7]. On the other hand, althoughnumerous heat transfer experiments and simulations have beenconducted, in particular with the packed bed that uses amuch smallersphere than the characteristic length of the pipe, fewer studies havebeen carried out with larger spheres. Fand et al. have constructedcorrelations for the pressure-drop characteristics and the average heattransfer coefficients of the SPPflowswith relatively large, irregularlypacked glass spheres [8–11]. However, as far as the authors know,nothing is known about a relationship between the local heat transferrate and the inside flow structures of the SPP.
The purpose of this research is, first, to evaluate the flow structuresin the sphere-packed pipe with comparatively large spheres byparticle image velocimetry (PIV), using a matched refractive-indexmethod that uses a sodium iodide solution as the working fluid.Second, a relationship between the local heat transfer performanceand the flow structures is considered by conducting heat transferexperiments focusing on the wall-temperature distribution. This
research is also aimed at clarifying some engineering issues for theSPP technology that result from the high Pr number fluid.
II. Visualization and Heat Transfer Experimentson a Sphere-Packed Pipe Flow
A. PIV Visualization Using a Matched Refractive-Index Method
1. Refractive-Index Adjustment of the Sodium Iodide Solution
Where a three-dimensional flow structure around obstacles insidea pipe, such as the SPP, is visualized by a PIV technique, it isextremely difficult to grasp the whole flow structure even whentransparent spheres are used, because the difference of the refractiveindex between the working fluid and the sphere causes distortion inthe image. Therefore, it is necessary to match the refractive index ofthe working fluid with that of the sphere material. This researchemploys a sodium iodide (NaI) solution, which is easy to handle andchemically stable, as the working fluid. This solution is deliberatelychosen to be able to adjust the refractive index of the working fluid tothat of the acrylic sphere with an index of 1.49. Normally, therefractive index of a solution is not so sensitive to temperaturechange, and so the refractive index of the NaI solution is adjusted bychanging its concentration. Figure 2 shows a light path differencecaused by refraction, in which a YAG laser used in the PIVmeasurement is irradiated to an acrylic cylinder 30 mm in diameterfixed at the center of a 10-cm square acrylic box filled with NaIsolution at 30 �C. The light path difference, �, is measured at alocation 660 mm from the back of the cylinder. The differencedecreases with the increase in the NaI concentration and reaches zeroat 61.6 wt%. That means that the refractive index of the NaI solutioncompletely corresponds with that of the acrylic cylinder at thisconcentration. In actual visualization experiments, a refractive indexat this concentration under visible light, which is 1.485, was alwayschecked by using a portable refractometer before each experiment,because the change in the refractive index might be caused by thedeposition of NaI crystals onto the pipe wall and/or by volatilizationfrom the solution.
2. PIV Measurement with Fluorescence Particles
The PIV used in this experiment is a double-pulse YAG lasersystemmanufactured by JapanLaser Corporation. The laser output is25mJ at 532 nm, and themaximumoscillatory frequency is 30Hz. Inthe PIV measurement, a time series of tracer particles’ images in asheet laser is taken with a high-speed camera and then a two-dimensional flow structure is quantitatively visualized from themovement of the tracer particles. The time interval of the doublepulse and the tracer concentration is adjusted depending on the flowconditions. To process the obtained particle images, a cross-correlation scheme is adopted to get spatially dense velocityinformation. Furthermore, melamine fluorescent resin particles1–20 �m diameter are used as the tracer particles. The specificgravity of the NaI solution at the aforementioned concentration isrelatively close to that of this tracer, and so the buoyancy influencecan be ignored. When this fluorescent particle is irradiated with the
Fig. 1 Sphere-packed pipe (each sphere is a half-dimension of the
circular-pipe diameter). Fig. 2 Matched refractive-index experiment using NaI.
YUKI ET AL. 633

YAG laser, it causes excitation in the fluorescent agent, which emitslight of 580 nm in wavelength. By taking only this newly emittedlight into a CCD camera with an attached filter lens, it makes itpossible to obtain a clearer particle image than the usual tracer image,because the diffused reflection light of the laser observed on the pipewall surface and on the acrylic sphere surface can be removedsimultaneously.
3. Experimental Apparatus and Details of the Test Section
Figure 3 shows a diagram of the apparatus for the visualizationexperiment under isothermal conditions. The apparatus consists ofthe following components: a circulating pump, a flow rate measuringsection, a flow-straightened section, a test section, a bag filter, and amixing tank.All pipingmaterials and components have beenmade ofpolyvinyl chloride or acrylic materials, etc., which coexist in a stablestate with the NaI solution. The magnetic pump circulates theworking fluid inside the loop, and its maximum flow rate undersphere-unpacked conditions is approximately 200 l=min. The flowrate of the working fluid is adjusted by valves: two valves locatedbetween the magnetic pump and the flow rate measuring section anda valve of a bypass line that directly returns to the mixing tank fromthe magnetic pump.
A turbine flowmeter or an ultrasonic Doppler velocimeter is usedto measure the flow rate. The mixing tank has the followingfunctions: injection of tracer particles, deaeration of bubbles existingin the fluid, and heat exchange to control the fluid temperature. Thesection upstream of the test section has a flow straightener with ahoneycomb structure consisting of stainless steel pipes, whichstraightens and counteracts a swirling flow formed in the bendupstream. The bag filter is a polypropylene-made cartridge withstrong corrosion resistance that separates the tracer particles from theNaI solution.
Figure 4 shows a detailed view of the visualization test section.The test section is an acrylic vertical riser pipe with D� 56 mm asthe inner diameter and 670 mm as the length. The visualizing area islocated at 8:2D (460 mm) downstream from an inlet of the testsection,where a fully developedflow is anticipated. In addition, thereis a rectangular jacket surrounding the test section to reduce theimage distortion resulting from the geometry of the circular pipe. TheNaI solution is also filled into the jacket. To visualize the flowfield inthe lateral cross section of the circular pipe, an acrylic observationwindow is attached to the upper part of the test section. Both sidesupstream and downstream of the test section have a Bourdon tubepressure gauge to measure the pressure drop.
4. Sphere Packing Structure and Experimental Conditions
Figure 5 shows the packing structure of the acrylic spheres. Thesphere size prepared for this research is D=2:0 (27.6 mm) indiameter, and 68 spheres can be packed in the test section with a
porosity of 0.548. An acrylic baffle plate set between the flanges,which exist at the inlet and outlet of the test section, fixes the acrylicspheres.
The temperature of the NaI solution is 30 �C, and the visualizationof the flowfield is conducted at three Reynolds numbers(Red �Ud=�) of 800, 2000, and 4900, based on the spherediameter, d, and mean inlet velocity U. The mean inlet velocity,which is equivalent to the superficial velocity in the SPP, is 0.0376,0.0940, and 0:230 m=s, respectively. From the data of the frictionfactor, Varahasamy and Fand have classified the SPP pipe flow withD=d > 1:4 into the turbulent regime (Red > 120), the Forchheimerregime (5< Red < 80), and the Darcy regime (Red < 2:3) [11]. Inthis sense, the flow conditions in this research could be in theturbulent regime. This fact was also confirmed by the authors’experiments [5].
B. Visualization of Wall-Temperature Distribution and Evaluation
of the Local Heat Transfer Coefficient
1. Experimental Apparatus and Details of the Test Section
To clarify how the flow structures in the SPP contribute to the localheat transfer characteristics, heat transfer experiments with electricalheating of a circular pipe are performed to measure the wall-temperature distribution by means of thermocouples and infraredthermography. The experiment is carried out by using a boilingbubble visualizing facility [12] at Tohoku University, and its testsection is exchanged for the one to be described herein. To ensureconsistency with the visualization experiment, the geometries of thetest circular pipe, such as the inner diameter and the length, areidentical. In addition, this experiment uses water as the working fluidFig. 3 Experimental apparatus for visualization.
Fig. 4 Test section.
Fig. 5 Packing structure.
634 YUKI ET AL.

because an NaI solution with high electrical conductivity is notappropriate for an experiment using electrical heating. (SeeNematollahi et al. [12] for details of each component of the facility.)
The left-hand side of Fig. 6 shows the details of the test section,which is composed of the test circular pipe and themixing chambers.The circular pipe is a SUS304-made vertical riser pipe 56 mm ininner diameter, 0.5 mm in thickness, and 670 mm in length that isuniformly and electrically heated by an ac power supply [maximum60 kVA (up to 2000A)]. The acrylic spheres are packed inside thepipe with an identical alignment to that of the visualizationexperiment. Acrylic thermal conductivity is 0:17–0:25 W=�mK�,which is much lower than that of water (0:61 W=�mK� at 30 �C).Therefore, the point-contact heat conduction from the stainless pipeto the acrylic sphere can be ignored or, in other words, the wall-temperature distribution is affected mainly by the convective heattransfer. As shown on the right-hand side of Fig. 6, copper electrodesfor the joule heating are attached to the test pipe. The length of theheating region is 600 mm and electrical resistance in this region is4:77 m�. A heat insulator is wrapped around the test section toreduce heat loss to the exterior. It was confirmed that at a walltemperature of 60� the heat loss to the atmosphere and the axialdirections of the test pipe was below 1% of the thermal dose in the
heat transfer experiments. Inside the mixing chambers upstream anddownstream of the test pipe, inlet and outlet bulk temperatures aremeasured with several K types of sheathed thermocouples 1.0 mm indiameter (the uncertainty is within �0:75%). In particular, themixing chamber located downstream has several optimized baffleplates to make uniform the temperature distribution of fluid after theheating region.
2. Wall-Temperature Measurement and Data Analysis
To obtain more accurate outer wall temperatures, 50 �m of thinK-type thermocouples with an uncertainty of �0:5% are attachedonto the outer wall of the test circular pipe with a film tape. The right-hand side of Fig. 6 shows the locations of the thermocouples. Twelvelocations are selected at intervals of 50 mm in the axial direction andthree thermocouples are attached at intervals of 22.5 deg angles in thecircumferential direction at each axial location so that, in total, 36thermocouples are attached. These locations are selected by takinginto account the periodicity and symmetry of the sphere-packedstructure. A computer saves the temperature data for three minutes ina steady state through a data logger whose loading interval anduncertainty are 1 s and �0:025% full scale, respectively.Additionally, infrared thermography is used to visualize the wholedistribution of the outer wall temperature to make it easier to discussthe relation between the flow structures inside the SPP and the localheat transfer performance. In this case, the heat insulator istemporarily detached. The infrared thermography equipment isTVS-2200 manufactured by Japan Avionics Corporation, with atime resolution of 30flames per second and amaximum sensitivity of0.01�C. The thermal imagery is outputted in the form of 256-color-tone images and binary data.
The following cooling law gives the local heat transfer coefficientsunder the conditions of the uniform heat flux input q�W=m2�.
hl � q=�Tw � Tb� (1)
Fig. 6 Test section and the locations of thermocouple for the heat
transfer experiment.
Fig. 7 Visualizing section: S1.
Fig. 8 A time series of flowfields in section S1 (Red � 800, time interval� 0:07 s).
YUKI ET AL. 635
Here, Tw is an inner wall temperature of the circular pipe and Tb is abulk temperature of fluid calculated from the enthalpy increase,which is given by the following equation:
Tb�z� � Tin Q�z�=�cpM� (2)
In this equation, Tin is an inlet bulk temperature,M is a mass flowrate (kg=s), and cp is a specific heat at constant pressure. Then,Q�z�is the quantity of heat that the fluid has received from the inlet up tothe axial location z.
The inner wall temperature, Tw, in Eq. (1) is estimated from thesolution of a one-dimensional equation of heat conduction in a radialdirection in the cylindrical coordinate system as follows:
Tw �H
2k
�r2o ln
�riro
�� 1
2
�r2i � r2o
�� T 0w (3)
Here, H is the quantity of heat generation per unit volume, T0windicates the outer wall temperature measured by the thermocouple,and k is the thermal conductivity of the circular pipe. In addition, riand ro are the inner radius and outer radius, respectively. Althoughthe heat loss from the heating pipe is very small as alreadymentioned,H is calculated from Eq. (2) using both the inlet and outlettemperatures to apply a more accurate thermal dose to Eq. (3).
The heat transfer experiments are conducted under a wide range offlow conditions, including the same particle Reynolds numberconditions of Red � 800, 2000, and 4900 as those of the flowvisualization experiments, to compare the flow structure obtained bythe PIV with the aforementioned heat transfer coefficient data. The
inlet temperature is 25�C. Adjusting the current value controls thethermal dose, and the current value is basically set to three patterns,500, 700, and 900A, with an uncertainty of �0:25%. However, thedata obtained under the conditions that generate natural convectionare ruled out when evaluating the heat transfer performance. Theuncertainty of the value of the heat transfer coefficient iswithin 9.0%.
III. Flow Structures in a Sphere-Packed Pipe
A. Flow Structures in a Central Longitudinal Section
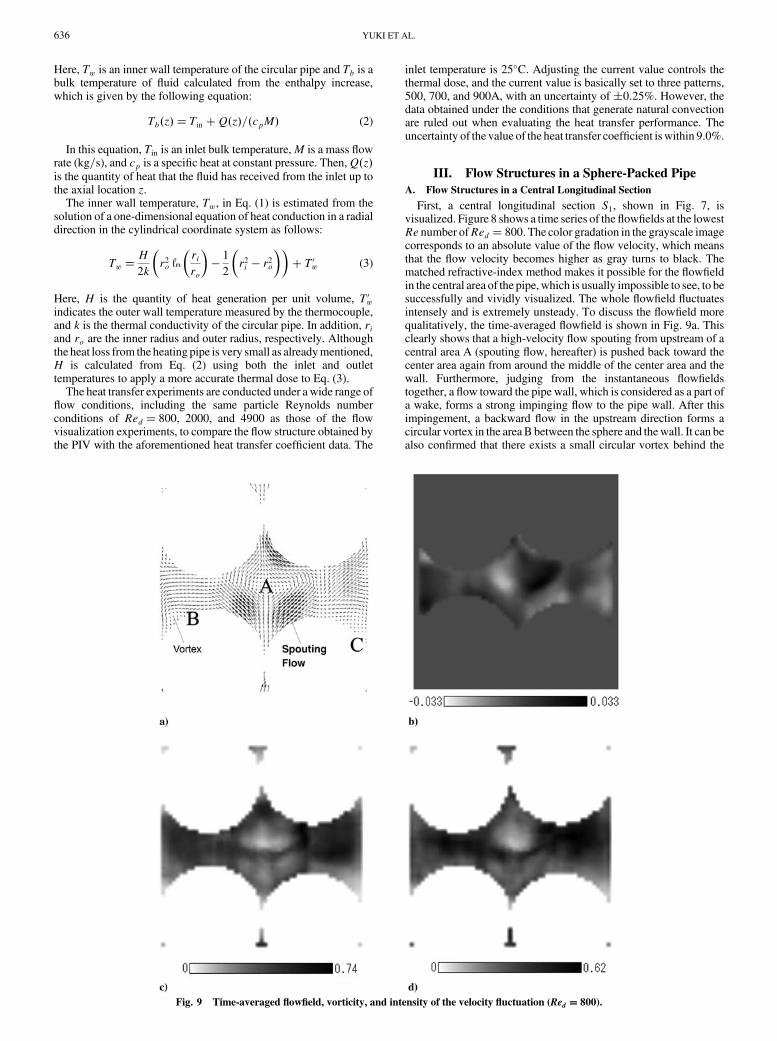
First, a central longitudinal section S1, shown in Fig. 7, isvisualized. Figure 8 shows a time series of the flowfields at the lowestRe number ofRed � 800. The color gradation in the grayscale imagecorresponds to an absolute value of the flow velocity, which meansthat the flow velocity becomes higher as gray turns to black. Thematched refractive-index method makes it possible for the flowfieldin the central area of the pipe,which is usually impossible to see, to besuccessfully and vividly visualized. The whole flowfield fluctuatesintensely and is extremely unsteady. To discuss the flowfield morequalitatively, the time-averaged flowfield is shown in Fig. 9a. Thisclearly shows that a high-velocity flow spouting from upstream of acentral area A (spouting flow, hereafter) is pushed back toward thecenter area again from around the middle of the center area and thewall. Furthermore, judging from the instantaneous flowfieldstogether, a flow toward the pipe wall, which is considered as a part ofa wake, forms a strong impinging flow to the pipe wall. After thisimpingement, a backward flow in the upstream direction forms acircular vortex in the areaB between the sphere and thewall. It can bealso confirmed that there exists a small circular vortex behind the
Fig. 9 Time-averaged flowfield, vorticity, and intensity of the velocity fluctuation (Red � 800).
636 YUKI ET AL.

impinging flow. An interesting feature is the formation of a low-velocity area in the middle of the spouting flow and the impingingflow, which seems to capture a coexisting area of different kinds ofseveral flows in the SPP. In addition, there is stagnation in the area Cclosely located to the contact point between the sphere and thewall. Itis impossible to remove enough heat in this area under the heatingconditions, and so the wall temperature could rise sharply here,especially for the high Pr number fluid. However, the areadownstream of this stagnation seems to have a high heat transferperformance due to the effect of the impinging flow. Figure 9b showsthe vorticity distribution for the time-averaged flowfield. The regionsaround area A and near the wall with high vorticity hold a high heattransport performance. Hence, the spouting flow around the centralarea and its returning effect efficiently transport enthalpy that wastransported from the heating wall by the circular vortex toward thecenter of the pipe, which could workmore effectively if there existedactive heat conduction from thewall to the sphere. Figures 9c and 9d,respectively, represent the intensities of the velocityfluctuation in theradial and streamwise directions,Up andVp, which are calculated byroot mean square and normalized by each inlet velocity U. A strongvelocity fluctuation area is formed upstream of the sphere existingdownstream. This is the region where the spouting flow is pushedback by something strong flow collidingwith the downstream sphereand branches again. Their maximum values over 0.6 indicate that theintensity of this variation is quite high. These fluctuations couldsignificantly contribute to the heat transport from the wall, becauseboth of the areas with high-velocity fluctuation spread toward thepipe wall.
Figure 10 shows distributions of the time-averaged flowfield,vorticity, and intensities of the velocity fluctuation in the radial andstreamwise directions at Red � 4900. The instantaneous flowfieldsare not shown, as it is difficult to visually understand the differencefrom the Red � 800 case, though the unsteadiness of the flowfieldsseems to be much stronger. This leads to the fact that the circularvortex observed in area B of Fig. 9a becomes ambiguous with theincrease in the Red number. It is confirmed that the high-velocityspouting flow observed around the central area is being preventedfrom spreading in a radial direction. Figure 11 presents two kinds ofprofiles at the horizontal center line of the visualizing area: one is thevelocity profile about u and v in the radial and streamwise directionsand the other is the intensity profiles of the velocity fluctuation Upand Vp. The radial velocity near the wall indicates the strength of theimpinging flow and is 1.0–1.5 times higher than the inlet velocity.The velocity profiles at Red � 4900 differ from the Red � 800 and2000 cases and indicate a lower value, especially near the wall. Thisis because the impinging flow area moves further downstream atRed � 4900. As for the streamwise velocity profile, the spoutingflow around the center area is accelerated as the Red numberincreases. Both figures show that the velocity peak position nearx=R��0:25 shifts toward the center of the pipe with an increasingRed number, which proves the aforementioned prevention of thespread of the spouting flow and also suggests the development ofsomething strong flow pushing the spouting flow back. Additionally,there are two areas with high-velocity fluctuation near x=R��0:5for each Red number, which indicates that the aforementioned twocharacteristic flow structures themselves have strong variation and
Fig. 10 Time-averaged flowfield, vorticity, and intensity of the velocity fluctuation (Red � 4900).
YUKI ET AL. 637

are closely linking with each other because of the lack of significantdifference in the variation of both theflow structures. In all data, thereexist low flow velocity and a low-velocity fluctuation area at thelocation of x=R��0:5. This location corresponds to thecoexistence area for the two flow structures that seems to existaround the right and left sides of the sphere existing in front and backof area A. The flow structure in this coexistence area will be clarifiedlater by comparison with the flow structures on the other crosssections.
B. Flow Structure of Bypass Flow Due to Wall Effect
Because the present SPP has four wide gap channels in thestreamwise direction due to the existence of the pipe wall, the flowcharacteristics of a high-velocity channeling flow, that is to say, abypass flow formed in this area, strongly affect not only the flowstructures of the spouting flow and the vortices behind the sphere butalso the heat transfer characteristics. To capture this flow, alongitudinal section S2, shown in Fig. 12, is visualized. Figures 13a–13d are the distributions of the time-averaged flowfield, vorticity,and intensities of the velocity fluctuation, respectively, in the righthalf area of S2 at the Red of 800. The bypass flow flowing in parallelwith the pipe wall is observed in the gap area between the sphere and
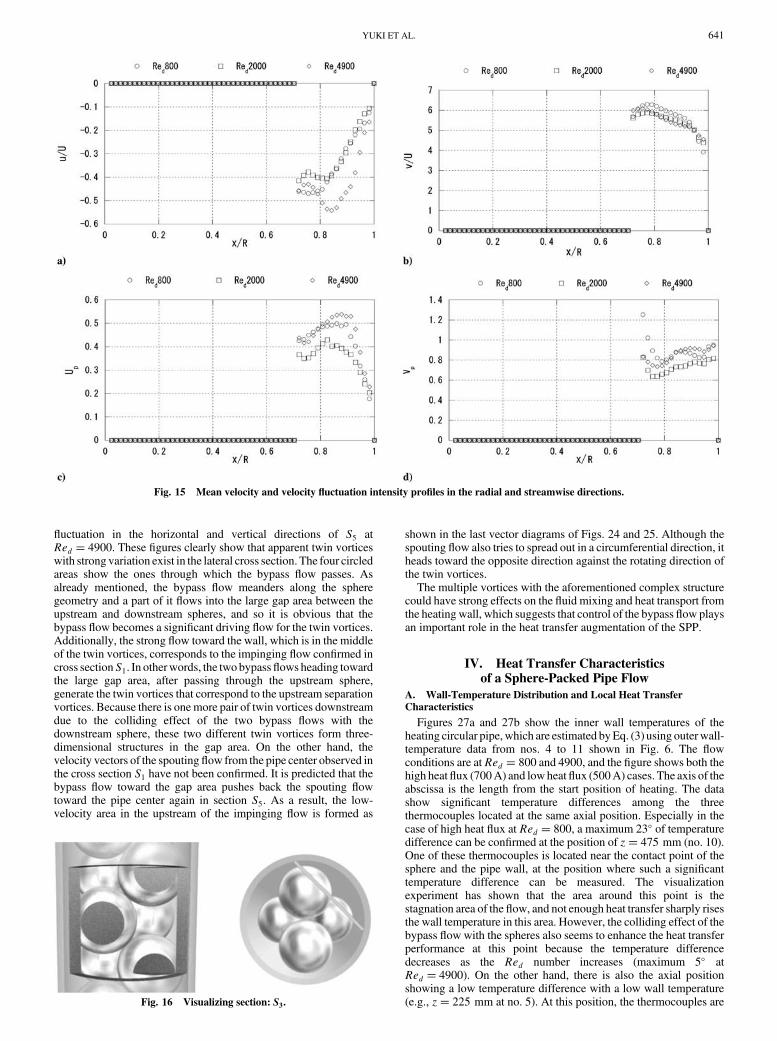
the pipe wall. The wake area behind the sphere has a high vorticity,because the flow direction shifts to the back from the front of thepaper depending on the packing structure. In addition, the intensitiesof the velocity fluctuation, Up and Vp, are more overwhelminglyintense than those in the case of the aforementioned longitudinalsection S1, which indicates a strong unsteadiness of the flowfield inthis section, especially beside and behind the sphere. A time series oftheflowfields allows us to confirm that a circular vortex or aflowwithlow velocity is intermittently formed in this area (note: this is causedby a strong variation at the bend of the bypass flow described lateron). Figure 14 shows the same distributions at Red � 4900.Although the flow velocity distribution and the vorticity distributionresemble those at Red � 800, the area with the high-velocityfluctuation behind the sphere expands more, showing a higher valuein the intensity of the velocity fluctuation, especially in the radialdirection. To quantitatively evaluate the influence of theRed numberon the flow structure of the bypass flow, Figs. 15a–15d show the flowvelocity profiles and the intensity profiles of the velocity fluctuationin the radial and streamwise directions at the horizontal center line inthe middle of S2. The minus value of the radial flow velocity meansthat the sphere shape contributes to a certain amount of momentumtransfer toward the center of the pipe. Additionally, Fig. 15b showsthat the bypassflow has quite a high velocity, whosemaximumvalueis around 6 times that of themean velocity. TheRed number does notseem to affect the valuemuch. Judging from this, it is evident that thebypass flow could be the something strong flow for the spouting flowbeing pushed back and for producing some vortices, including theimpinging flow. Though the intensity of velocity fluctuation in boththe radial and streamwise directions goes up as the Red numberincreases, the data at Red � 800 show a peculiar profile. It isconsidered that the flowfield atRed � 800 still has the characteristicsof a lowerRed number regime inwhich there exists a different kind ofvortex shedding behind the sphere.
To evaluate the three-dimensional structure of the bypass flow, wefocused on the flowfield in the longitudinal section S3 perpendicularto S2 is (see Fig. 16). Figures 17a–17d show the distributions of the
Fig. 11 Mean velocity and velocity fluctuation intensity profiles in the radial and streamwise directions.
Fig. 12 Visualizing section: S2.
638 YUKI ET AL.

time-averaged flowfield, vorticity, and intensities of the velocityfluctuation in the horizontal and vertical directions (Up andVp) of thevisualizing section at Red � 800. The bypass flow is flowing with ameandering motion through the spheres in a circumferentialdirection. Furthermore, a circular vortex is formed between theupstream and downstream spheres. As this circular vortex is formednear the downstream sphere, the flow that is branched by themeandering bypass flow colliding with the downstream sphere playsa significant role in forming the vortex. In addition, the existence of ahigh-vorticity area A being released from the sphere represents theboundary of the bypass-flow route. Regarding the velocityfluctuation Up in the horizontal direction of S3, the area with high-velocity fluctuation is formed on the bypass-flow route, whichmeansthat the bypass flow itself unsteadily changes in the circumferentialdirection. Furthermore, an area B with a high-velocity fluctuation isformed forward of the downstream sphere. As already described, apart of the bypass flow collides with the downstream sphere due to itsmeandering motion. In such areas, the flow becomes unstable andincreases the intensity of the velocity fluctuation due to the influenceof the sphere geometry. Regarding the intensity of the velocityfluctuation Vp in the vertical direction of S3, an area C with a high-velocity fluctuation exists beside the bypass-flow route between theupstream and downstream spheres. The flow loses stability in thislarge gap area by being released from the influence of the upstream
sphere surface, which could also lead to the formation of theimpinging flow mentioned before, though this flow cannot beconfirmed in section S3. Figures 18a–18d also show the samedistributions at Red � 4900. Figure 19 is a time series of theflowfields. Looked at through the time-averaged flowfieldcharacteristics, the flow structures do not show as significant achange as in the Red � 800 case. However, the time series of theflowfields show that two apparent circular vortices are formedbetween the downstream and upstream spheres. In other words, thewake structure in the large gap area between the spheres ischaracterized by the coexistence of the circular vortex formed by thecolliding effect of the bypass flow with the downstream sphere andby the separation vortex shedding from the upstream sphere. Inparticular, the small vortex shown in Fig. 8 corresponds to a part ofthis downstream vortex. The existence of these two vortices has beenalso confirmed at Red � 800. In the SPP flow, it is quite interestingthat several vortices exist between the upstream and downstreamspheres. In addition, the areas having a high vorticity and high-velocity fluctuation observed at Red � 800 spread in thecircumferential and streamwise directions, which proves that thebypass flow meanders in a larger area with an increasing Rednumber. This fact can be confirmed by Figs. 20c and 20d, whichshow the intensities of the velocity fluctuation in the horizontal andvertical directions at the horizontal center line of S3. In Fig. 20a, the
Fig. 13 Time-averaged flowfield, vorticity, and intensity of the velocity fluctuation of the bypass flow (Red � 800).
YUKI ET AL. 639

horizontal velocity indicates a minus value because of the separationvortex near the wall. Observing the streamwise velocity profiles inFig. 20b, the maximum flow velocity of the bypass flow is almost 5–6 times higher than the mean velocity, regardless of theRed number.This fact accords with the result shown in Fig. 15b. Moreover, thecentral axis of the bypass flow also seems not to be influenced by theRed number, because the peak location of the streamwise velocitydoes not shift with the change in the Red number.
C. Flow Structure Behind the Sphere
To further identify the wake structures formed between thespheres, the longitudinal section S4, shown in Fig. 21, is visualized.Figure 22 is a time series of the flowfields at Red � 4900, andFigs. 23a–23c show the distributions of the vorticity and intensitiesof the velocity fluctuation in the horizontal and vertical directions ofS4, respectively. The high-velocity flow existing in the gap betweenthe sphere and the pipe wall is the bypass flow itself. Observationusing the time series of the flowfields confirms the generation anddisappearance of a circular vortex, such as the Karman-like twinvortices behind the sphere, that is strongly affected by the inflowingof a part of the bypass flow. Because of this inflow, an area with highvorticity exists behind the sphere as shown in Fig. 23a. The shape andbehavior of these vortices are another aspect of the aforementionedseparation vortex. Though it is difficult to visualize both the upstreamand downstream circular vortices simultaneously, the downstreamcircular vortex, which should also be twin vortices, seems to be
somewhat flat in the circumferential direction and formed near thepipe wall as shown in Fig. 8. In addition, the gap area between thespheres has a high-velocity fluctuation; this also indicates the strongtime variation of these two pairs of twin vortices. These vortices donot affect the bypass flow structure and its behavior significantly,because the area with the high-velocity fluctuation by the wake doesnot spread out to the bypass-flow area. To sum up, there are twofactors that form the structure of the wake between the spheres andtheir unsteady behavior (see Fig. 23d, which illustrates the flowstructures inS3 andS4): 1) twin separation vortices shedding from thesphere in a process whereby a part of each high-velocity bypass flowpassing beside the sphere flows into the large gap area located behindthe sphere (this process also generates the strong impinging flowmentioned later), and 2) twin circular vortices generated by thecolliding and branching effects of two bypass flows in front of thedownstream sphere.
D. Flow Structure in a Cross Section of Circular Pipe
Finally, the flowfields in a lateral cross section of the pipe, that is, asecondary flow, are visualized to investigate the three-dimensionalstructure of the flowfield in the SPP. Figures 24 and 25, respectively,show a time series of the secondary flows at the Red numbers of 800and 4900 in the cross section S5 perpendicular to the longitudinalsection S1 (see the first figure in Fig. 26). The last figures in Figs. 24and 25 show the time-averaged flowfield. Figure 26 shows thedistributions of the vorticity and the intensities of the velocity
Fig. 14 Time-averaged flowfield, vorticity, and intensity of the velocity fluctuation of the bypass flow (Red � 4900).
640 YUKI ET AL.
fluctuation in the horizontal and vertical directions of S5 atRed � 4900. These figures clearly show that apparent twin vorticeswith strong variation exist in the lateral cross section. The four circledareas show the ones through which the bypass flow passes. Asalready mentioned, the bypass flow meanders along the spheregeometry and a part of it flows into the large gap area between theupstream and downstream spheres, and so it is obvious that thebypass flow becomes a significant driving flow for the twin vortices.Additionally, the strong flow toward the wall, which is in the middleof the twin vortices, corresponds to the impinging flow confirmed incross sectionS1. In otherwords, the twobypassflows heading towardthe large gap area, after passing through the upstream sphere,generate the twin vortices that correspond to the upstream separationvortices. Because there is onemore pair of twin vortices downstreamdue to the colliding effect of the two bypass flows with thedownstream sphere, these two different twin vortices form three-dimensional structures in the gap area. On the other hand, thevelocity vectors of the spoutingflow from the pipe center observed inthe cross section S1 have not been confirmed. It is predicted that thebypass flow toward the gap area pushes back the spouting flowtoward the pipe center again in section S5. As a result, the low-velocity area in the upstream of the impinging flow is formed as
shown in the last vector diagrams of Figs. 24 and 25. Although thespouting flow also tries to spread out in a circumferential direction, itheads toward the opposite direction against the rotating direction ofthe twin vortices.
The multiple vortices with the aforementioned complex structurecould have strong effects on the fluid mixing and heat transport fromthe heatingwall, which suggests that control of the bypass flow playsan important role in the heat transfer augmentation of the SPP.
IV. Heat Transfer Characteristicsof a Sphere-Packed Pipe Flow
A. Wall-Temperature Distribution and Local Heat Transfer
Characteristics
Figures 27a and 27b show the inner wall temperatures of theheating circular pipe,which are estimated byEq. (3) using outerwall-temperature data from nos. 4 to 11 shown in Fig. 6. The flowconditions are at Red � 800 and 4900, and the figure shows both thehigh heatflux (700A) and lowheatflux (500A) cases. The axis of theabscissa is the length from the start position of heating. The datashow significant temperature differences among the threethermocouples located at the same axial position. Especially in thecase of high heat flux at Red � 800, a maximum 23� of temperaturedifference can be confirmed at the position of z� 475 mm (no. 10).One of these thermocouples is located near the contact point of thesphere and the pipe wall, at the position where such a significanttemperature difference can be measured. The visualizationexperiment has shown that the area around this point is thestagnation area of the flow, and not enough heat transfer sharply risesthe wall temperature in this area. However, the colliding effect of thebypass flow with the spheres also seems to enhance the heat transferperformance at this point because the temperature differencedecreases as the Red number increases (maximum 5� atRed � 4900). On the other hand, there is also the axial positionshowing a low temperature difference with a low wall temperature(e.g., z� 225 mm at no. 5). At this position, the thermocouples are
Fig. 15 Mean velocity and velocity fluctuation intensity profiles in the radial and streamwise directions.
Fig. 16 Visualizing section: S3.
YUKI ET AL. 641

attached slightly upstream of the contact point. In this area, thereexists the strong impinging flow toward the pipe wall and thedownstream twin vortices, and so this proves that these flowssignificantly contribute to the heat transfer enhancement. Figure 28shows the distributions of the local heat transfer coefficients. Thelocal heat transfer coefficients at Red � 4900 are approximately3 times higher than those at Red � 800. A solid line in the figureshows the average heat transfer coefficient estimated by thefollowing Varahasamy and Fand’s correlation [11]:
h� CRemD�Prp��fwRew�q�tan�1�D=d�n�r�keff=D� (4)
In this correlation, Rew is the wall-modified Reynolds number,and C, m, n, p, q, and r are constants that are fixed according to avalue ofD=d and theflowconditions. Although the size (D=d� 2:0)of the sphere is basically inapplicable to Varahasamy and Fand’scorrelation, each constant is adopted under the conditions ofD=d >3:0 as a matter of convenience. Furthermore, Varahasamy and Fanddefined effective thermal conductivity keff using a porosity and athermal-conductivity ratio of fluid to sphere material. However, it isimpossible to strictly define the effective thermal conductivity in thecase of a low-thermal-conductivity material such as the acrylicsphere used in this experiment. This analysis adopted the thermalconductivity ofwater as the effective thermal conductivity, assumingthat almost no heat conduction from the heating wall to the acrylicsphere exists at the contact point. In each flow condition, the localheat transfer coefficients disperse around Varahasamy and Fand’s
correlation, though the experimental data on average seem to behigher than Varahasamy and Fand’s correlation. This means that it ispossible to apply Varahasamy and Fand’s correlation for roughlypredicting the heat transfer performance and constructing a newcorrelation applicable to the D=2:0 size of the sphere-packed pipewith regularity.
To discuss the heat transfer performance of the SPP flow by usingvisually apparent wall-temperature distribution, thermal imagery byinfrared thermography is shown in Fig. 29. The inside sphere-packedstructure is also shown on the right-hand side, corresponding to thevisualization area. The thermal imagery indicates that the Rednumber is 800 under high heatflux. It can be clearly observed that thecrescent-shaped area with the high temperature is formed in thedownstream of each contact point between the sphere and the pipewall. This is due to the formation of the stagnation, which wasobserved around the contact point in the PIV measurement.Characteristically, the incurvation area with the high temperaturecaused by the bypass flow’s meandering motion is obviouslycaptured. The reason the bypass flow has a comparatively hightemperature is thought to be because the velocity fluctuation causedby the colliding effect of the bypass flow with the spheres transportsthe heat stagnating around the contact point. Therefore, it is evidentthat the velocity fluctuation due to the colliding effect makes thewall-temperature distribution more uniform with the increase in theRed number. On the other hand, the crescent-shaped areas with thelow temperature are also clearly observed in the large gap areas.Because the pipe wall generates heat uniformly, these low-temperature areas indicate that the heat is effectively removed and
Fig. 17 Time-averaged flowfield, vorticity, and intensity of the velocity fluctuation of the bypass flow (Red � 800).
642 YUKI ET AL.

transported in these areas. It seems that the branching circularvortices and the strong impinging flow contribute to the heat transferenhancement in a wider area than expected.
B. Average Heat Transfer Performance of the SPP Flow
It is important to compare the heat transfer performance of the SPPflow with other typical heat transfer promoters. However, it is
difficult to identify a fully developed region for the temperature fielddue to the dispersion of the wall-temperature data. Therefore,following Varahasamy and Fand’s knowledge [11], an average heattransfer coefficient is evaluated by setting the region z > 3:0D as thefully developed region for the temperature field. Figure 30 shows thecharacteristics of the average heat transfer coefficients for the inletflow velocity. The heat transfer performance of the SPP flow isenhanced as the flow velocity increases. An error bar lengthens with
Fig. 18 Time-averaged flowfield, vorticity, and intensity of the velocity fluctuation of the bypass flow (Red � 4900).
Fig. 19 Time sequence of the flowfields of the bypass flow (Red � 4900, time interval� 0:07 s).
YUKI ET AL. 643

the increase in flow velocity, which absolutely proves that flatteningthe wall-temperature distribution will be a key issue of developingadvanced sphere-packed pipes for a highPr number fluid. However,the heat transfer coefficients of the SPP flow are much higher, evencomparedwith that of a twisted-tape-inserted pipeflow [13], that is, aswirl flow, with the twisted ratio of 3.0, as well as that of a smoothcircular-pipe flow estimated by the Petukhov–Gnielinski’scorrelation. For instance, at the inlet Reynolds number of ReD �10; 000 (U� 0:16 m=s), the heat transfer coefficient in the SPP flowis 5.3 times higher than that of the smooth circular-pipe flow and3.9 times higher than that of the swirl flow (at ReD � 20; 000(U� 0:32 m=s), it is 3.8 and 2.8 times higher, respectively), whichmeans that it can accomplish an objective heat transfer coefficientunder lower flow rate conditions. On the other hand, it is commonknowledge that heat transfer enhancement technology has a tradeoff
Fig. 20 Mean velocity and velocity fluctuation intensity profiles in the horizontal and vertical directions of S3.
Fig. 21 Visualizing section: S4.
Fig. 22 A time series of flowfields behind the sphere (Red � 4900, time interval� 0:07 s).
644 YUKI ET AL.

relation with pressure-drop increase. In most cases, the heat transferefficiency (which equals the rate of heat transfer enhancement timesthe rate of pressure-drop increase) shows up at much less than 1.0.Naturally, there is fear for the SPP that a tremendous increase in thepressure drop appears due to packing too many obstacles in thecircular pipe. Figure 31 shows the characteristics of the average heattransfer coefficients of the SPP flow for the pressure drop �P=L.Under the same pressure-drop conditions, the heat transferperformance of the circular-pipe flow is more than 4 times as highas that of the SPP flow under all of the flow rate conditions. Actually,the heat transfer efficiencies at ReD � 10; 000 and 20,000 indicate
very low values, respectively. However, the most important thing inactual plant design is to compare the heat transfer performance withthe pumping power. Especially when giving consideration to all ofthe pressure drops for a piping system consisting of a lot ofcomponents and/or bends, etc., a heat transfer promoter with higherheat removal performance under lower flow velocity conditionscould be also applicable from the viewpoints of reduction inelectrolysis, MHD pressure drop, and erosion. Figure 32 shows theinfluence of pumping power Ppump�W=m� �Q�m3=s� �P=L on theheat transfer performance. It shows that, under the conditions ofPpump < 0:3 W=m, the heat transfer coefficients of the SPP flow are
Fig. 23 Vorticity and velocity fluctuations (Red � 4900), and an illustration of the flow structure in S3 and S4.
Fig. 24 A time series of secondary flows (Red � 800, time interval� 0:07 s).
YUKI ET AL. 645

Fig. 25 A time series of secondary flows (Red � 4900, time interval� 0:07 s).
Fig. 26 Distributions of the vorticity and intensities of the velocity fluctuation at Red � 4900.
Fig. 27 Distributions of the wall temperatures of the sphere-packed pipe (Red � 800 and 4900).
646 YUKI ET AL.

higher than that of the circular-pipe flow. This means that the SPP isespecially effective under lower pumping power conditions.However, the heat transfer performance of the SPP flow at Ppump >0:3 W=m is lower than that of the circular-pipe flow, and almost halfat Ppump � 15 W=m, which surely suggests that it needs todramatically enhance the heat transfer performance by improving thefin effect from the heating wall to the sphere and changing thepacking structure, etc., when using a sphere of D=2:0 in diameter.For reference, the heat transfer performances for the different spheresizes,D=d� 3:0 and 1.4, are also shown in the same figure, using ofthe Fand’s correlation. Although there are some problemswith usingthe Fand’s correlation, especially for a high Red number regime, theuse of smaller-size spheres seems to be muchmore effective than theD=2:0-size sphere in the case without the fin effect. In addition, thepipe diameter D� 56 mm in this experiment is quite large for thepiping in the fusion reactor, and so the scale effect for the heat transfercoefficient is available when using a smaller-diameter pipe, whichwould lead to an effective use of the SPP under the aforementionedsuperior conditions. These evaluations prove the high potential of thesphere-packed pipe as a heat transfer promoter for the molten saltblanket system in a fusion reactor. (For more information on this,refer to Sato and Yuki [14].)
V. Conclusions
In this study, PIV visualization was performed to understand thecomplex flow structures in a sphere-packed pipe. The PIVexperiment was conducted using a matched refractive-index methodwith NaI solution as the working fluid. Then, through heat transferexperiments, the wall-temperature distribution was measured withthermocouples and infrared thermography, which made clear therelation between the flow structures and the local heat transferperformance. The knowledge obtained is summarized as follows:
1) As representative flow structures in a sphere-packed pipe, thefollowing threeflowswere confirmed: ameandrous bypassflowwithhigh-flow velocity due to the wall effect, two pairs of twin vorticesaccompaniedwith a strong impingingflow to thewall, and a spoutingflow from the central area of the pipe.
Fig. 28 Distributions of the heat transfer coefficients.
Fig. 29 Wall-temperature distribution (Red � 800).
Fig. 30 Effect of the flow velocity on the heat transfer coefficients.
Fig. 31 Effect of pressure loss on the heat transfer coefficients.
Fig. 32 Effect of pump power on the heat transfer coefficient of SPP
flows.
YUKI ET AL. 647

2) An area with a high wall temperature is formed by the flowstagnation located around a contact point between the sphere and theheating wall.
3) The heat transfer performance is quite high in a large gap areabetween the upstream and downstream spheres, due to the influencesof the impinging flow and the downstream twin vortices.
4) The colliding effect of the high-velocity, meandering bypassflowwith the spheres significantly affects the heat transport from thestagnation areas.
If it is possible to optimize the packing structure to disarrange thebypass flow more structurally and to develop a heat-conductionenhancement technique at the contact point between the sphere andthe pipe wall, it will be possible to achieve much higher heat transferperformance due to the multiplier functions of the fluidmixing effectnear the heating wall and the fin effect, which enable the flattening ofthe wall-temperature distribution. It is also necessary to evaluate thechange of the flow structures and the augmentation/suppression ofthe heat transfer performance under the magnetic field, after whichthese evaluations should be reflected in the design guide for the firstwall of FFHR.
Acknowledgment
This work was performed with the support and under the auspicesof the National Institute for Fusion Science collaborative researchprogram (NIFS06KFDA007). We wish to acknowledge theirsupport and assistance to our work.
References
[1] Sagara, A., and Imagawa, S., “Carbon Tiles as Spectral-Shifter forLong-Life Liquid Blanket in LHD-Type Reactor FFHR,” Fusion
Engineering and Design, Vol. 81, Nos. 8–14, Feb. 2006, pp. 1299–1304.doi:10.1016/j.fusengdes.2005.09.067
[2] Kobayashi, T., and Yuki, K., “Effect of Electrolysis on HighTemperatureMolten Salt Flow in aMagnetic Field,”Proceedings of the17th ANS Topical Meeting on the Technology of Fusion Energy,American Nuclear Society, La Grange Park, IL, 2006.
[3] Toda, S., Chiba, S., and Yuki, K., “Experimental Research on MoltenSalt Thermofluid Technology Using a High-Temperature Molten SaltLoopApplied for a Fusion Reactor Flibe Blanket,”Fusion Engineering
and Design, Vols. 63–64, Dec. 2002, pp. 405–409.doi:10.1016/S0920-3796(02)00195-3
[4] Chiba, S., Omae, M., and Yuki, K., “Experimental Research on HeatTransfer Enhancement for High Prandtl-Number Fluid,” Fusion
Science and Technology, Vol. 47, No. 3, 2005, pp. 569–573.[5] Okumura, M., and Yuki, K., “Evaluation of Flow Structure in Packed-
Bed Tube by Visualization Experiment,” Fusion Science and
Technology, Vol. 47, No. 4, 2005, pp. 1089–1093.[6] Ergun, S., “Fluid Flow Through Packed Columns,” Chemical
Engineering Progress, Vol. 48, No. 2, 1952, pp. 89–94.[7] Watanabe, H. J., “Comment on Izbash Equation,” Journal of
Hydrology, Vol. 58, Nos. 3–4, 1982, pp. 389–397.[8] Fand, R. M., and Thinakaran, R., “The Influence of the Wall on Flow
Through Pipes Packed with Spheres” Journal of Fluids Engineering,Vol. 112, No. 1, 1990, pp. 84–88.doi:10.1115/1.2909373
[9] Fand, R. M., Sundaram, M., and Varahasamy, M., “IncompressibleFluid Flow Through Pipes Packed with Spheres at Low DimensionRatios,” Journal of Fluids Engineering, Vol. 115, 1993, pp. 169–172.doi:10.1115/1.2910102
[10] Fand, R. M., Varahasamy, M., and Greer, L. S., “Empirical CorrelationEquations for Heat Transfer by Forced Convection from CylindersEmbedded in Porous Media that Account for the Wall Effect andDispersion,” International Journal of Heat andMass Transfer, Vol. 36,No. 18, 1993, pp. 4407–4418.doi:10.1016/0017-9310(93)90125-P
[11] Varahasamy, M., and Fand, R. M., “Heat Transfer by ForcedConvection in Pipes Packed with Porous Media Whose Matrices areComposed of Spheres,” International Journal of Heat and Mass
Transfer, Vol. 39, No. 18, 1996, pp. 3931–3947.doi:10.1016/0017-9310(96)00032-4
[12] Nematollahi, M. R., Toda, S., Hashizume, H., and Yuki, K., “VibrationCharacteristic of Heated Rod Induced Flow Boiling,” Journal of
Nuclear Science and Technology, Vol. 36, No. 7, 1999, pp. 575–583.doi:10.3327/jnst.36.575
[13] Manglik, R. M., and Bergles, A. E., “Heat Transfer and Pressure DropCorrelations for Twisted-Tape Inserts in Isothermal Tubes Part 2:Transition and Turbulent Flows, Transactions of the ASME: Journal of
Heat Transfer, Vol. 115, No. 4, 1993, pp 890–896.doi:10.1115/1.2911384
[14] Sato, T., and Yuki, K., “Heat Transfer Performance for HighPrandtl and High Temperature Molten Salt Flow in Sphere-PackedPipes,” Fusion Science and Technology, Vol. 47, No. 4, 2007,pp. 1089–1093.
648 YUKI ET AL.