flow-induced stresses and displacements in jointed
TRANSCRIPT

Article 1 Flow-induced stresses and displacements in jointed 2 concrete pipes, installed by pipe jacking method 3
4
Moses Karakouzian 1, Mehrdad Karami 2, Mohammad Nazari-Sharabian 3,* and Sajjad Ahmad 4 5 1 Professor, Department of Civil and Environmental Engineering and Construction, University of Nevada 6
Las Vegas, USA; [email protected] 7 2 M.Sc., Department of Civil Engineering, Isfahan University of Technology, Iran; 8
[email protected] 9 3 Ph.D. Candidate, Department of Civil and Environmental Engineering and Construction, University of 10
Nevada Las Vegas, USA; [email protected] 11 4 Professor, Department of Civil and Environmental Engineering and Construction, University of Nevada 12
Las Vegas, USA Affiliation 2; [email protected] 13 14 * Correspondence: [email protected] 15
16
Abstract: Transient flows result in unbalanced forces and high pressure in pipelines. Under these 17 conditions, the combined effects of flow-induced forces along with sudden pipe displacements can 18 create cracks in the pipeline, especially at the junctions. This situation consequently results in water 19 leakage and reduced operational efficiency of the pipeline. In this study, displacements and stresses 20 in a buried pressurized water transmission pipe installed by pipe jacking method are investigated 21 using numerical modeling and considering interactions between fluid, pipe, and soil. The analyses 22 were performed consecutively under no-flow, steady flow, and transient flow conditions, in order 23 to investigate the effects of flow conditions on displacements and stresses in the system. Analyses 24 of the results show that displacements and stresses in the jointed concrete pipes are significant under 25 transient flow conditions. Moreover, because of pressure transient effects, maximum tensile stresses 26 exceed the tensile strength of concrete at the junctions, leading to cracks and consequent water 27 leakage. 28
Keywords: Fluid-Structure Interaction, Soil-Structure Interaction, Transient Flow, Pipe Jacking, 29 Numerical Modeling, Abaqus FEA 30
31
1. Introduction 32 Pipe failures are usually a complex function of different circumstances, including pipe 33
properties, internal and external loadings, and environmental factors. Generally, when applied forces 34 exceed the bearing capacity of the pipe materials, failure occurs [1]. Among pipe damage and causes, 35 several failures have been reported due to pressure transient effects [2,3,4]. Transient pressure in pipe 36 networks is generally formed due to factors such as sudden changes in valve operations, starting or 37 stopping of pumps, the sudden change in reservoir level, and changes in the demand conditions. In 38 such cases, the kinetic energy of the fluid is reduced significantly, and pressure waves are transmitted 39 along the pipeline. This high-pressure build-up can damage the pipeline by creating sudden pipe 40 displacements and excessive stresses in the pipe wall [5]. Figure 1 and 2 show stress distribution in a 41 pressurized pipe, and stresses acting on the pipe wall. 42
Preprints (www.preprints.org) | NOT PEER-REVIEWED | Posted: 17 January 2019
© 2019 by the author(s). Distributed under a Creative Commons CC BY license.
Preprints (www.preprints.org) | NOT PEER-REVIEWED | Posted: 17 January 2019 doi:10.20944/preprints201901.0160.v2
© 2019 by the author(s). Distributed under a Creative Commons CC BY license.
Peer-reviewed version available at Fluids 2019, 4, 34; doi:10.3390/fluids4010034

2 of 13
43 Figure 1. Stress distribution in a pressurized pipe [5] 44
45 (a) (b) 46
Figure 2. a) Side view (z–r plane): stresses acting on pipe wall 47 b) Cross-sectional view (r–φ plane): normal stresses acting on an element of pipe wall [5] 48
In Figure 1, Pout is the soil overburden pressure on the pipe, P is the transient pressure of the 49 fluid, R is the internal radius, and e is the thickness of the pipe. 50
According to Figure 2, by considering the existence of two-dimensional axially symmetric 51 stresses in a circular ring subjected to the internal pressure P and external pressure Pout (soil pressure), 52 the pipe displacements can be described by Equation 1 and 2, as: 53
z ztut z
σρ ∂ ∂=∂ ∂
(1)
( )1r rtu rt r r r
ϕσσρ ∂ ∂= −∂ ∂
(2)
By solving Equation 1 and 2, the hoop and radial stresses can be calculated using Equation 3 and 4, 54 as: 55
2 2A Crϕσ = − +
(3)
2 2rA Cr
σ = +
(4)
A and C are determined by satisfying the following boundary conditions: 56
( , )r r R P z tσ = = −
(5)
r r R e outPσ = + = −
(6)
It follows that: 57
Preprints (www.preprints.org) | NOT PEER-REVIEWED | Posted: 17 January 2019 Preprints (www.preprints.org) | NOT PEER-REVIEWED | Posted: 17 January 2019 doi:10.20944/preprints201901.0160.v2
Peer-reviewed version available at Fluids 2019, 4, 34; doi:10.3390/fluids4010034

3 of 13
2 2( ) ( )2( 0.5 )
outR R e P PAR e e+ −=
+ (7)
2 2( )4( 0.5 )
outR P R e PCR e e− +=
+ (8)
Finally, the averaged values of σφ and σr are presented in Equation 9 and 10, as: 58
1 R e
outR
R R edr P Pe e eϕ ϕσ σ
+ += = −
(9)
1 3 122 ( 0.5 ) 4 4
R e
r r outRr dr P P
R e eσ π σ
π+
= = − −+
(10)
In recent years, the use of underground structures such as pressurized water pipes for the 59 distribution of water has increased. Trenched and trenchless drilling are two methods commonly 60 used for the construction of buried pipelines [6]. In the trenched method, the soil is removed to form 61 a trench in the ground, and as the pipes are installed, the trench is filled with soil again. In this 62 method, issues such as reduced enclosing tensions around the pipe, due to lack of proper soil 63 compaction can occur, which can consequently result in inadequate safety and instability of the 64 structure, in the event of pressure transient conditions and pipe displacements [1]. Whereas in 65 trenchless drilling, soil compaction and stresses within the soil are not significantly affected. Pipe 66 jacking is a trenchless drilling technique, used for the installation of underground structures such as 67 pipelines, ducts, and culverts. In this method, powerful hydraulic jacks are used to push concrete or 68 steel pipes through the ground at the same time as drilling is taking place within the shield [7]. In 69 this method, the end connection of a fitting that is to be assembled into another fitting is called “the 70 spigot”, and the female connection of the pipe fitting is referred to as “the socket”. The spigot end of 71 a fitting is inserted into the socket. Spigot and socket joint pipes are joined and sealed using a rubber 72 ring (Figure 3). 73
74 Figure 3. The spigot and socket ends of a concrete pipe in pipe jacking method [8] 75
1.1. Literature Review and Motivation 76 Kyriakides and Babcock [9] studied the propagation of internal pressures in circular pipes. They 77
concluded that transient pressures cause significant stresses in the pipes. In another effort, Milligan 78 et al. [10] investigated the pipe-soil interactions in the pipe jacking method and proposed a theoretical 79 model for the interactions. Using numerical modeling, Valiente [11] evaluated failures in concrete 80 pipes due to internal pressures. He presented equations to estimate maximum stresses in the pipe. 81 Gysling [12] conducted an experimental study on vibrations and displacements around unburied 82
Preprints (www.preprints.org) | NOT PEER-REVIEWED | Posted: 17 January 2019 Preprints (www.preprints.org) | NOT PEER-REVIEWED | Posted: 17 January 2019 doi:10.20944/preprints201901.0160.v2
Peer-reviewed version available at Fluids 2019, 4, 34; doi:10.3390/fluids4010034

4 of 13
pipes due to dynamic flows. He used sensors to measure displacements, and concluded that unsteady 83 pressures could be damaging to the pipeline. 84
Wasmer et al. [13] investigated the crack growth in straight and bent unburied cast iron pipes 85 under steady internal pressures, and proposed an analytical model. Meis et al. [14] conducted a 86 research study to determine the static and dynamic behavior of some typical restrained and 87 unrestrained underground pipe joints due to internal pressure and earthquakes. Gou [15] studied a 88 pipeline under oblique loading. He demonstrated the effect of pipe burial depth on displacements 89 around the pipe. Schmitt et al. [16] investigated pipeline failure due to dynamic pressure effects in a 90 case study in Tunisia. They used numerical modeling to investigate damages in the pipe. Tijsseling 91 [5] investigated the impact of dynamic pressures in a pressurized pipe, considering fluid-structure 92 interactions. He presented equations for determining tensions and displacements in unburied pipes. 93 Using the finite element method, Lydell and Riznic [17] conducted a survey on the damages to pipes 94 in various projects. They categorized various factors, including internal pressures in the pipe. 95
More recently, Vazouras et al. [18] investigated the mechanical behavior of buried steel pipelines 96 crossing an active strike-slip fault. They studied the effects of fault displacements and evaluated the 97 critical strain in the pipeline. Wu et al. [19] used a three-dimensional finite element analysis to study 98 the effects of load and displacement-controlled bending on the plastic collapse of pressurized pipes. 99 Rezai et al. [1] studied the impact of transient hydraulic conditions on pipe failures by analyzing 100 historical records and investigating different case studies. Wang [20] used the finite element method 101 to study damages in underground pipes as a function of soil overburden and surface loads. He 102 proposed a method to evaluate the magnitude of damage in pipes within a short period of time as a 103 result of an impact load on the surface. Xu et al. [21] studied the effects of soil overburden and traffic 104 loads on a concrete pipeline. The results indicated that applied loads had considerable impacts on 105 damages to the pipe. 106
The literature review indicates that flow-induced stresses and displacements in buried 107 pressurized water transmission pipes installed using trenchless drilling (pipe jacking method) have 108 not been investigated. Therefore, this study aims to fill this gap in the literature. 109
2. Materials and Methods 110 In this research, a typical water transmission concrete pipe in a soil environment is numerically 111
studied using the Abaqus FEA (Finite Element Analysis) under three scenarios: a) drilling and pipe 112 installation (no-flow condition); b) steady flow in the pipe; c) transient flow in the pipe. General steps 113 for setting up the model are presented in the following sub-sections. 114
2.1. Model Geometry 115 Geometries of the soil mass, pipe cross-section, and model boundaries are shown in Figure 4. A 116
long concrete pipe, with internal and external radii of 45 and 50 cm, respectively, was modeled. 117 Model boundaries were determined by trial and error in a way that they show the least impact on 118 analysis results. 119
120 Figure 4. Cross section of the pipe and soil 121
Preprints (www.preprints.org) | NOT PEER-REVIEWED | Posted: 17 January 2019 Preprints (www.preprints.org) | NOT PEER-REVIEWED | Posted: 17 January 2019 doi:10.20944/preprints201901.0160.v2
Peer-reviewed version available at Fluids 2019, 4, 34; doi:10.3390/fluids4010034

5 of 13
2.2. Soil and Material Properties 122 The geomechanical properties of the soil mass were selected based on the characteristics of 123
normally consolidated clay in urban areas [22]. Moreover, the properties of the pipe were selected 124 based on the characteristics of typical water transmission concrete pipes [23]. Table 1 presents soil 125 and material properties used in the model. 126
Table 1. Properties of the materials used in the model [22, 23] 127 Material Parameter Value
Soil
Log. of Bulk Modulus 0.026 Poisson’s Ratio 0.4 Tensile Limit 0
The angle of Internal Friction
23
Log. of Plastic Bulk Modulus
0.174
Density (Kg/m3) 1800 Stress Ratio 0.94
Initial Yield Surface Size (Pa)
4884
Wet Yield Surface Size 1 Flow Stress Ratio 0.778
Concrete
Young’s Modulus (GPa)
20
Compressive Strength (MPa)
28.3
Tensile Strength (MPa) 3 Poisson’s Ratio 0.25 Density (Kg/m3) 2500
Water Density (kg/m3) 1000
Bulk Modulus (GPa) 2.7
2.3. Flow Characteristics 128 Internal pressure and flow velocity in the pipe under steady flow condition were selected to be 129
0.5 MPa (72.52 psi) and 4 m/s, respectively, as typical values in urban water transmission pipes. 130
2.4. Modeling Procedure 131 In the present study, the general assumptions that were necessary to model the FSI (fluid-132
structure interaction) problem are as follows: 133 • The surrounding soil is monolith. 134 • The concrete lining behavior is considered as non-linear. 135 • A damage plasticity behavior is considered in the concrete lining. 136 • The CPE8R (8-node plane strain quadrilateral, biquadratic displacement, reduced integration) 137
elements are used for the simulation of the concrete pipe. 138 • Based on the Cam-Clay criterion, the soil is considered as a plastic material. 139 • Dynamic explicit method is applied to solve the finite element equations in the Abaqus FEA. 140
2.4.1. Acoustic Environment 141 Inside a pressurized water pipe, the only degree of freedom in nodes of the finite element model 142
of the fluid is pressure. In Abaqus FEA, acoustic environments and acoustic materials possess this 143 feature. An acoustic environment is an elastic environment where no shear stress is present 144 (assuming non-viscous fluid), and the pressure is proportional to volumetric strain. Acoustic 145 environments consider the effects of inertia and fluid compressibility. Pressure wave propagation 146 can also be simulated in these environments [24]. Therefore, in this study, acoustic elements were 147
Preprints (www.preprints.org) | NOT PEER-REVIEWED | Posted: 17 January 2019 Preprints (www.preprints.org) | NOT PEER-REVIEWED | Posted: 17 January 2019 doi:10.20944/preprints201901.0160.v2
Peer-reviewed version available at Fluids 2019, 4, 34; doi:10.3390/fluids4010034

6 of 13
implemented to simulate fluid motion in the pipe, in order to investigate the impact of transient 148 pressures on pipe displacements and the distribution of stresses in the pipe wall. 149
2.4.2. Interactions Between Model Components and Meshing 150 As stated above, the only variable in the acoustic environment is pressure. The value of this 151
variable was applied to each node by applying initial conditions using a quasi-static wave method 152 [25]. The interactions between the pipe and fluid were introduced to the model by coupling 153 displacement matrixes of the inner pipe surface with displacement matrixes of the fluid boundary 154 elements. Moreover, the interactions between the pipe and soil were introduced to the model by 155 defining cohesive elements between the soil and the outer pipe surface. Figure 5 shows the meshing 156 of the soil, pipe, and fluid environments in a 3D view. 157
158 Figure 5. Finite element model mesh – 3D View 159
2.4.3. Transient Flow in The Pipe 160 To create transient flow in the pipe, it was assumed that 90% of a valve on the path was closed. 161
In this condition, based on hydraulic analysis using the method of characteristics (MOC) [26], flow 162 velocity upstream of the valve will reach 1 m/s, and pressure waves will form in the pipe. Figure 6 163 shows the change in flow velocity as a result of the relative valve closure percentage and the closure 164 time. The flat lines in the figure continue until the end of the simulation time. 165
166 Figure 6. Flow velocity upstream of the valve and relative valve closure 167
Preprints (www.preprints.org) | NOT PEER-REVIEWED | Posted: 17 January 2019 Preprints (www.preprints.org) | NOT PEER-REVIEWED | Posted: 17 January 2019 doi:10.20944/preprints201901.0160.v2
Peer-reviewed version available at Fluids 2019, 4, 34; doi:10.3390/fluids4010034

7 of 13
If the time it takes to close the valve is less than wave travel time, the change in pressure head 168 can be obtained using Equation 11 [27]. According to Figure 6, the time it takes to close 90% of the 169 valve is about 15 s, while the wave travel time is about 59 s. Therefore, Equation 11 is applicable. 170
aH Vg
Δ = Δ
(11)
11( )
.ww
a dk E e
ρ=
+ (12)
In Equation 11, ΔH (m) is the change in pressure head, a (m/s) is the pressure wave velocity, g is 171 the acceleration of gravity, and ΔV (m/s) is the change in water velocity in the pipe. In Equation 12, 172 ρw (kg/m3) is the specific mass of water, kw (GPa) is the bulk modulus of water, d (m) is the pipe 173 diameter, E (GPa) is the modulus of elasticity of concrete, and e (m) is the thickness of the pipe [28]. 174 The calculated values for a and maximum pressure under the transient flow condition are presented 175 in Table 2. 176
Table 2. Transient flow characteristics 177 Parameter Value
a (m/s) 854 Max. Pressure (MPa) 2.61 (378.55 psi)
The calculated maximum transient pressure was applied to fluid elements in the model as 178 impact load. The transient pressure from fluid elements transfers to pipe elements, leading to pipe 179 displacements and stresses in the pipe wall. 180
3. Results 181 In the following sections, displacements in the soil environment and stresses in the pipe wall are 182
presented. Displacements under all scenarios are measured relative to their position right after 183 drilling and pipe installation (before reaching a new equilibrium). The location where displacements 184 and stresses are analyzed is near the valve, and the displacements in each stage are cumulative. 185
3.1. No-Flow Condition 186 Figure 7 and 8 show vertical (U2) and horizontal (U1) displacements in the soil environment, 187
respectively, and Figure 9 shows stresses in the pipe wall under no-flow condition. In Figure 9, as 188 well as in other figures showing stress distribution contours in the following sections, the blue color 189 shows areas in compression, while red shows areas in tension. 190
191 Figure 7. Displacements in the vertical direction under the no-flow condition 192
Preprints (www.preprints.org) | NOT PEER-REVIEWED | Posted: 17 January 2019 Preprints (www.preprints.org) | NOT PEER-REVIEWED | Posted: 17 January 2019 doi:10.20944/preprints201901.0160.v2
Peer-reviewed version available at Fluids 2019, 4, 34; doi:10.3390/fluids4010034

8 of 13
193 Figure 8. Displacements in the horizontal direction under the no-flow condition 194
195 Figure 9. Stresses in the pipe wall under no-flow condition (MPa) 196
After drilling and pipe installation, distribution of stresses in the soil will change, and 197 eventually, due to the stress release phenomenon, the soil mass will reach a new equilibrium. Figure 198 7 shows that soil at the bottom of the section has become swollen. The amount of this uplift at the 199 bottom (5 mm) is greater than the amount of displacement in the crown (1 mm). According to Figure 200 8, horizontal displacements on the top and bottom sides are quite symmetrical and uniform, with a 201 maximum of 3 mm on the sides. Therefore, under the no-flow condition and due to unloading and 202 inflation of the soil, among all displacements, the greatest occurs at the bottom. 203
Stress distribution contours mostly show compression (blue) at the top and tension (red) at the 204 bottom of the pipe (Figure 9). Under this condition, the highest tensions occurred at the bottom of the 205 pipe with a maximum value of 2.69 MPa (390.15 psi) at the junction. 206
3.2. Steady Flow Condition 207 Figure 10 and 11 show vertical (U2) and horizontal (U1) displacements in the soil environment, 208
respectively, and Figure 12 shows the stresses in the pipe wall under steady flow condition. 209
Preprints (www.preprints.org) | NOT PEER-REVIEWED | Posted: 17 January 2019 Preprints (www.preprints.org) | NOT PEER-REVIEWED | Posted: 17 January 2019 doi:10.20944/preprints201901.0160.v2
Peer-reviewed version available at Fluids 2019, 4, 34; doi:10.3390/fluids4010034

9 of 13
210 Figure 10. Displacements in the vertical direction under steady flow condition 211
212 Figure 11. Displacements in the horizontal direction under steady flow condition 213
214 Figure 12. Stresses in the pipe wall under steady flow condition (MPa) 215
As mentioned earlier, in this scenario, the pressurized pipe is operating under a steady flow with 216 0.5 MPa (72.52 psi) of pressure. Due to this pressure, as well as the fluid weight, the concrete pipe 217 moves, and this displacement transfers to the surrounding soil. As a result, displacements that took 218 place under no-flow condition will change. The figures show that the maximum displacement under 219 the steady flow condition is 1 mm, both in vertical and horizontal directions. This value is obtained 220 from the maximum vertical pipe displacement difference in Figure 7 and 10. The same value is 221 obtained by comparing horizontal displacements in Figure 8 and 11. 222
Similar to the no-flow condition, stress distribution contours mostly show compression at the 223 top, and tension at the bottom of the pipe (Figure 12). Under this condition, due to the addition of the 224
Preprints (www.preprints.org) | NOT PEER-REVIEWED | Posted: 17 January 2019 Preprints (www.preprints.org) | NOT PEER-REVIEWED | Posted: 17 January 2019 doi:10.20944/preprints201901.0160.v2
Peer-reviewed version available at Fluids 2019, 4, 34; doi:10.3390/fluids4010034

10 of 13
internal pressure, the highest tensions occurred at the bottom of the pipe, with a maximum value of 225 3.86 MPa (559.85 psi) at the junction. 226
3.3. Transient Flow Condition 227 Figure 13 and 14 show vertical (U2) and horizontal (U1) displacements in the soil environment, 228
respectively, and Figure 15 shows the stresses in the pipe wall under transient flow condition. 229
230 Figure 13. Displacements in the vertical direction under transient flow condition 231
232 Figure 14. Displacements in the horizontal direction under transient flow condition 233
234 Figure 15. Stresses in the pipe wall under transient flow condition (MPa) 235
According to Figure 13 and 14, relative to steady flow condition, displacements in the soil have 236 increased under the influence of transient pressures in the pipe. The results obtained at this stage 237 indicate that maximum displacements occurred at the upper portions of the section, with a maximum 238 value of 3.1 mm in the crown. 239
Preprints (www.preprints.org) | NOT PEER-REVIEWED | Posted: 17 January 2019 Preprints (www.preprints.org) | NOT PEER-REVIEWED | Posted: 17 January 2019 doi:10.20944/preprints201901.0160.v2
Peer-reviewed version available at Fluids 2019, 4, 34; doi:10.3390/fluids4010034
11 of 13
Similar to the two previous conditions, stress contours show areas under compression at the top 240 and areas under tension at the bottom of the pipe. In the event of a transient flow, the maximum 241 tension remained at the bottom of the pipe, with a maximum value of 8.1 MPa (1174.81 psi) at the 242 junction. 243
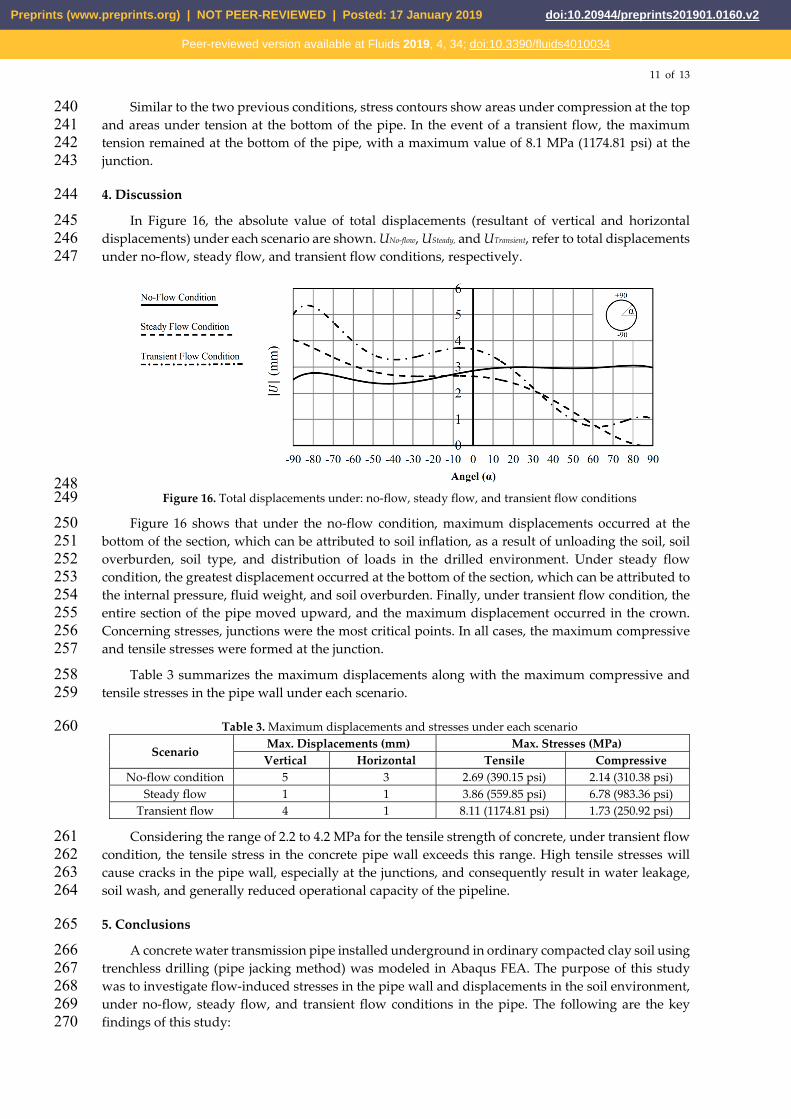
4. Discussion 244 In Figure 16, the absolute value of total displacements (resultant of vertical and horizontal 245
displacements) under each scenario are shown. UNo-flow, USteady, and UTransient, refer to total displacements 246 under no-flow, steady flow, and transient flow conditions, respectively. 247
248 Figure 16. Total displacements under: no-flow, steady flow, and transient flow conditions 249
Figure 16 shows that under the no-flow condition, maximum displacements occurred at the 250 bottom of the section, which can be attributed to soil inflation, as a result of unloading the soil, soil 251 overburden, soil type, and distribution of loads in the drilled environment. Under steady flow 252 condition, the greatest displacement occurred at the bottom of the section, which can be attributed to 253 the internal pressure, fluid weight, and soil overburden. Finally, under transient flow condition, the 254 entire section of the pipe moved upward, and the maximum displacement occurred in the crown. 255 Concerning stresses, junctions were the most critical points. In all cases, the maximum compressive 256 and tensile stresses were formed at the junction. 257
Table 3 summarizes the maximum displacements along with the maximum compressive and 258 tensile stresses in the pipe wall under each scenario. 259
Table 3. Maximum displacements and stresses under each scenario 260 Scenario
Max. Displacements (mm) Max. Stresses (MPa) Vertical Horizontal Tensile Compressive
No-flow condition 5 3 2.69 (390.15 psi) 2.14 (310.38 psi) Steady flow 1 1 3.86 (559.85 psi) 6.78 (983.36 psi)
Transient flow 4 1 8.11 (1174.81 psi) 1.73 (250.92 psi)
Considering the range of 2.2 to 4.2 MPa for the tensile strength of concrete, under transient flow 261 condition, the tensile stress in the concrete pipe wall exceeds this range. High tensile stresses will 262 cause cracks in the pipe wall, especially at the junctions, and consequently result in water leakage, 263 soil wash, and generally reduced operational capacity of the pipeline. 264
5. Conclusions 265 A concrete water transmission pipe installed underground in ordinary compacted clay soil using 266
trenchless drilling (pipe jacking method) was modeled in Abaqus FEA. The purpose of this study 267 was to investigate flow-induced stresses in the pipe wall and displacements in the soil environment, 268 under no-flow, steady flow, and transient flow conditions in the pipe. The following are the key 269 findings of this study: 270
Preprints (www.preprints.org) | NOT PEER-REVIEWED | Posted: 17 January 2019 Preprints (www.preprints.org) | NOT PEER-REVIEWED | Posted: 17 January 2019 doi:10.20944/preprints201901.0160.v2
Peer-reviewed version available at Fluids 2019, 4, 34; doi:10.3390/fluids4010034

12 of 13
• Under the no-flow condition, the most significant displacements occurred at the bottom of the 271 section. This can be attributed to the soil inflation phenomenon, as a result of drilling and 272 alteration of stress distribution in the soil environment. 273
• Under steady flow condition, the soil environment showed small displacements, due to the 274 internal pressure and fluid weight in the pipe. 275
• By the occurrence of transient pressure due to the event of transient flow in the pipe, the 276 displaced region was enlarged, and the pipe and surrounding soil showed an upward 277 movement. 278
• Under all scenarios, maximum compressive and tensile stresses were formed at the junction. The 279 maximum value was observed under the transient flow condition, where the tensile stress 280 exceeded the allowable tensile capacity of the concrete. This situation will cause cracks in the 281 pipe wall and consequently leads to water leakage and reduced operational capacity of the 282 pipeline. 283 Future work can be done on optimizing the valve closure pattern, considering the internal 284
pressure in the pipe, existing soil overburden on the pipe, and soil type, in order to minimize transient 285 pressures and resultant pipe displacements. Moreover, a comprehensive parametric study can be 286 performed on different model components to investigate the impact of each parameter on the model 287 results. 288 Author Contributions: conceptualization, Mehrdad Karami; methodology, Moses Karakouzian, Mehrdad 289 Karami, Mohammad Nazari-Sharabian, Sajjad Ahmad; software, Mehrdad Karami; writing—original draft 290 preparation, Mehrdad Karami and Mohammad Nazari-Sharabian; writing—review and editing, Moses 291 Karakouzian and Sajjad Ahmad. 292 Funding: This research received no external funding 293 Conflicts of Interest: The authors declare no conflict of interest. 294
References 295 1. Rezaei, H.; Ryan, B.; Stoianov, I. Pipe failure analysis and impact of dynamic hydraulic conditions in water 296
supply networks. Procedia Eng., 2015, 119, 253-262. 297 2. Kodikara, J.; Rathnayaka, S.; Zhang, J.; Crawly, C.; Zhang, D.; Blaha, F. Lessons Learned from Large-298
Diameter Pipe Failure Case Studies. Pipelines, 2017, doi:10.1061/9780784480885.052 299 3. Zarghamee, M. S.; Ojdrovic, R. P. Some Lessons Learned from Failure of a Pipeline. Pipelines, 2006, 300
doi:10.1061/40854(211)37 301 4. Schmitt, C.; Pluvinage, G.; Hadj-Taieb, E.; Akid, R. Water pipeline failure due to water hammer effects. 302
Fatigue Frac. Eng. Mater. Struct., 2006, 29(12), 1075-1082, doi:10.1111/j.1460-2695.2006.01071.x 303 5. Schmitt, C.; Pluvinage, G.; Hadj-Taieb, E.; Akid, R. Water pipeline failure due to water hammer effects. 304
Fatigue Frac. Eng. Mater. Struct., 2006, 29(12), 1075-1082, doi:10.1111/j.1460-2695.2006.01071.x 305 6. Ma, B.; Najafi, M. Development and applications of trenchless technology in China. Tunnelling Underground 306
Space Technol., 2008, 23(4), 476-480. 307 7. Yen, J.; Shou, K. Numerical simulation for the estimation the jacking force of pipe jacking. Tunnelling 308
Underground Space Technol., 2015, 49, 218-229. 309 8. Langley Concrete - Precast concrete products. Available online: http://www.langleyconcretegroup.com 310
(accessed 09 Oct. 2019). 311 9. Kyriakides, S.; Babcock, C. D. Experimental determination of the propagation pressure of circular pipes. J. 312
Pressure Vessel Technol., 1981, 103(4), 328-336. 313 10. Milligan, G. W. E.; Norris, P, Pipe–soil interaction during pipe jacking. Proc. Inst. Civ. Eng. Geotech. 314
Eng., 1999, 137(1), 27-44. 315 11. Valiente, A. Stress corrosion failure of large diameter pressure pipelines of prestressed concrete. Eng. Fail. 316
Anal., 2001, 8(3), 245-261. 317 12. Gysling, D. L. U.S. Patent No. 6,463,813, 2002, Washington, DC: U.S. Patent and Trademark Office. 318 13. Wasmer, K.; Nikbin, K. M.; Webster, G. A., Creep crack initiation and growth in thick section steel pipes 319
under internal pressure. Intl. J. Press. Vessels Pip., 2003, 80(7-8), 489-498. 320
Preprints (www.preprints.org) | NOT PEER-REVIEWED | Posted: 17 January 2019 Preprints (www.preprints.org) | NOT PEER-REVIEWED | Posted: 17 January 2019 doi:10.20944/preprints201901.0160.v2
Peer-reviewed version available at Fluids 2019, 4, 34; doi:10.3390/fluids4010034

13 of 13
14. Meis, R. D.; Maragakis, E. M.; Siddharthan, R. Behavior of underground piping joints due to static and 321 dynamic loading. Technical Report MCEER-03-06, 2003. 322
15. Guo, P. Numerical modeling of pipe–soil interaction under oblique loading. J. Geotech. Geoenviron. 323 Eng., 2005, 131(2), 260-268. 324
16. Schmitt, C.; Pluvinage, G.; Hadj-Taieb, E.; Akid, R. Water pipeline failure due to water hammer 325 effects. Fatigue Frac. Eng. Mater. Struct., 2006, 29(12), 1075-1082. 326
17. Lydell, B.; Riznic, J. OPDE—The international pipe failure data exchange project. Nucl. Eng. Des., 2008, 327 238(8), 2115-2123. 328
18. Vazouras, P.; Karamanos, S. A.; Dakoulas, P. Finite element analysis of buried steel pipelines under strike-329 slip fault displacements. Soil Dyn. Earthquake Eng., 2010, 30(11), 1361-1376. 330
19. Wu, G. Y.; Smith, D. J.; Pavier, M. J. Effects of load and displacement controlled bending on plastic 331 collapse of pressurized pipes. Procedia Mater. Sci., 2014, 3, 1204-1209. 332
20. Wang, S. Evaluation of underground pipe-structure interface for surface impact load. Nucl. Eng. Des., 2017, 333 317, 59-68. 334
21. Xu, M.; Shen, D.; Rakitin, B. The longitudinal response of buried large-diameter reinforced concrete 335 pipeline with gasketed bell-and-spigot joints subjected to traffic loading. Tunnelling Underground Space 336 Technol., 2017, 64, 117-132. 337
22. Ortiz, M.; Pandolfi, A. A variational Cam-clay theory of plasticity. Comput. Methods Appl. Mech. and 338 Eng., 2004, 193(27-29), 2645-2666. 339
23. Zhang, Y.; Yan, Z. G.; Zhu, H. H.; Ju, J. W. Experimental study on the structural behaviors of jacking 340 prestressed concrete cylinder pipe. Tunnelling Underground Space Technol., 2018, 73, 60-70. 341
24. ABAQUS, Theory guide, Release 12.6, ABAQUS, Inc. 342 25. Hachem, F. E.; Schleiss, A. J. A review of wave celerity in frictionless and axisymmetrical steel-lined 343
pressure tunnels. J. Fluids Struct., 2011, 27(2), 311-328. 344 26. Wylie, E. B.; Streeter, V. L.; Suo, L. Fluid transients in systems, Vol. 1.; Prentice Hall: Englewood Cliffs, NJ, 345
USA, 1993; p. 464. 346 27. Joukowsky N. On the Hydraulic Hammer in Water Supply Pipes. Division of Physical Sciences of O.L.E., 347
University of California, USA, 1897. 348 28. Halliwell, A. R. Velocity of a water-hammer wave in an elastic pipe. J. Hydraulics Div., 1963, 89(4), 1-21. 349
Preprints (www.preprints.org) | NOT PEER-REVIEWED | Posted: 17 January 2019 Preprints (www.preprints.org) | NOT PEER-REVIEWED | Posted: 17 January 2019 doi:10.20944/preprints201901.0160.v2
Peer-reviewed version available at Fluids 2019, 4, 34; doi:10.3390/fluids4010034