florida orange juice outlook - uf/ifas oci | home · florida orange juice outlook: factors that...
TRANSCRIPT
FLORIDA ORANGEFLORIDA ORANGEJUICE OUTLOOK:JUICE OUTLOOK:
Factors that ImpactFactors that ImpactSustainability of Florida CitrusSustainability of Florida Citrus
www.floridajuice.comwww.floridajuice.com
48th Annual Short Course for the Food IndustryInternational Citrus & Beverage Conference (ICBC)
Sheraton Sand Key ResortClearwater Beach, FL - September 16-19, 2008
Robert P. NorbergDeputy Executive Director of Research & Operations
FLORIDA DEPARTMENT OF CITRUSLakeland, Florida, USA
22
AGENDAAGENDA1. Introduction
2. Sustainability Concepts
3. Factors Impacting Supply-Side
4. Factors Impacting Demand-Side
5. Intersection of Supply & Demand Scenarios
6. Summary & Conclusions

33
INTRODUCTIONINTRODUCTION

4
Production and Tree Losses
► Hurricanes
► Diseases► Canker► Greening► Tristeza
► Development4
CURRENT FLORIDA CURRENT FLORIDA CITRUS SITUATIONCITRUS SITUATION

55
Intent of Presentation isIntent of Presentation isto Understand Factors thatto Understand Factors that
Impact Sustainability ofImpact Sustainability ofthe Florida Citrus Industrythe Florida Citrus Industry

66
SUSTAINABILITYSUSTAINABILITYCONCEPTSCONCEPTS

7
Definition of Definition of ““SustainableSustainable””
A characteristic of a process or state that can be maintained at a certain level indefinitely.
To keep from yielding or failing during stress or difficulty.
Widely used term to describe humans’interaction with earth’s natural ecosystem.
However, can also be used to assess an industry’s struggle to survive challenging times.
7
8
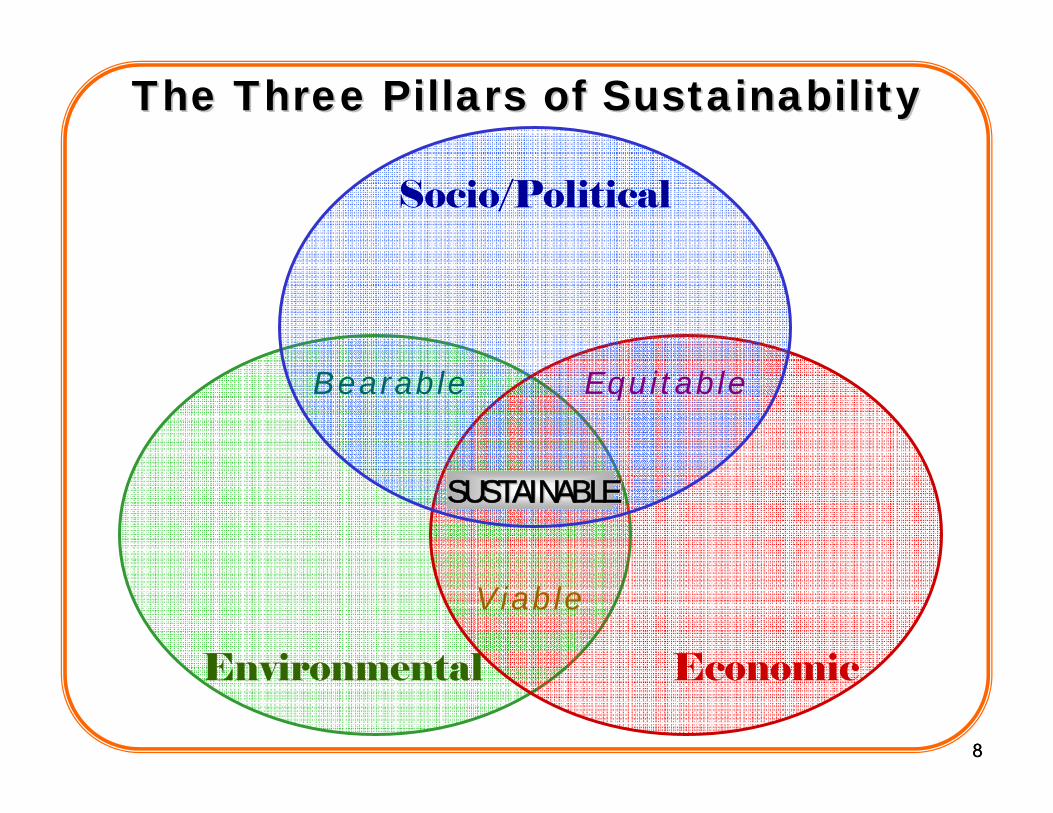
The Three Pillars of SustainabilityThe Three Pillars of Sustainability
8
Environmental Economic
Socio/Political
Bearable
Viable
Equitable
SUSTAINABLESUSTAINABLE

9
Socio/Political SustainabilitySocio/Political Sustainability
PEACE AND SECURITY► Diversions of Resources
POPULATION GROWTH► Migrations► Urbanization► Developed vs. Undeveloped
AFFLUENCE & POVERTY► Inequalities & Disparities
GOVERNANCE► Freedom & Equity
9

10
Environmental SustainabilityEnvironmental Sustainability
PROTECTION OF ECOSYSTEM ► Land, Water, Atmosphere
BIOLOGICAL PRESERVATION & DIVERSITY
PRESERVATION OF VITAL ELEMENTS► Oxygen, Water, Nitrogen, Carbon
TERMINOLOGY► Conservation & Preservation► Pollution Control► Deforestation► Extinction
10

11
Economic SustainabilityEconomic SustainabilityMACRO DEFINITION
► Market Allocation of Diminishing Resources
MICRO DEFINITION► Firm or Industry Level Profitability► Easy Entry or Exit► Transparent Knowledge
EQUILIBRIUM OF LONG-RUN SUPPLY & DEMAND CURVES ABOVE BREAK-EVEN COSTS
11

12
Economic SustainabilityEconomic SustainabilityAgricultural CommoditiesAgricultural Commodities
Quantity
RetailPrice
P1
Sustainable
12
Short-TermSupply Curve
Ps= Break-Even Cost
Unsustainable
Q0
Ps
P2

13
ShortShort--Run Supply & DemandRun Supply & Demand
Quantity
PriceS1 withoutGreening
S2 withGreening
D1
D2
Q2 Q1
14
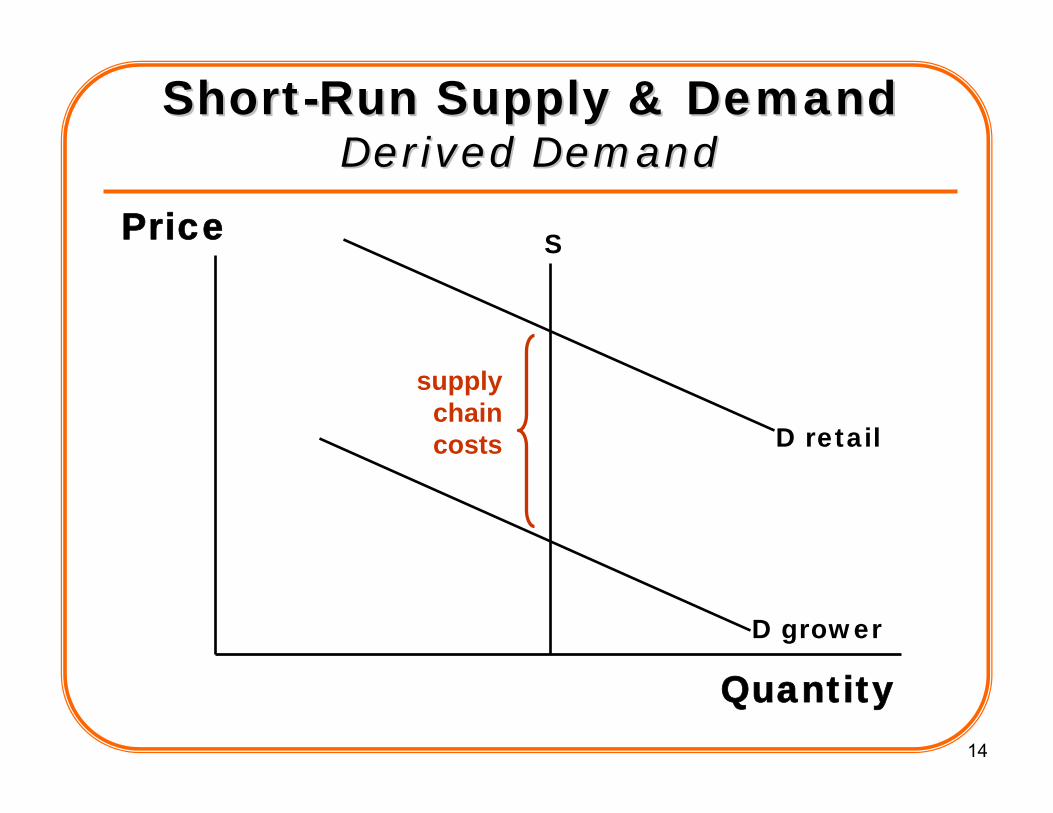
ShortShort--Run Supply & Demand Run Supply & Demand Derived DemandDerived Demand
Quantity
Price S
D retail
D grower
supplychaincosts
15
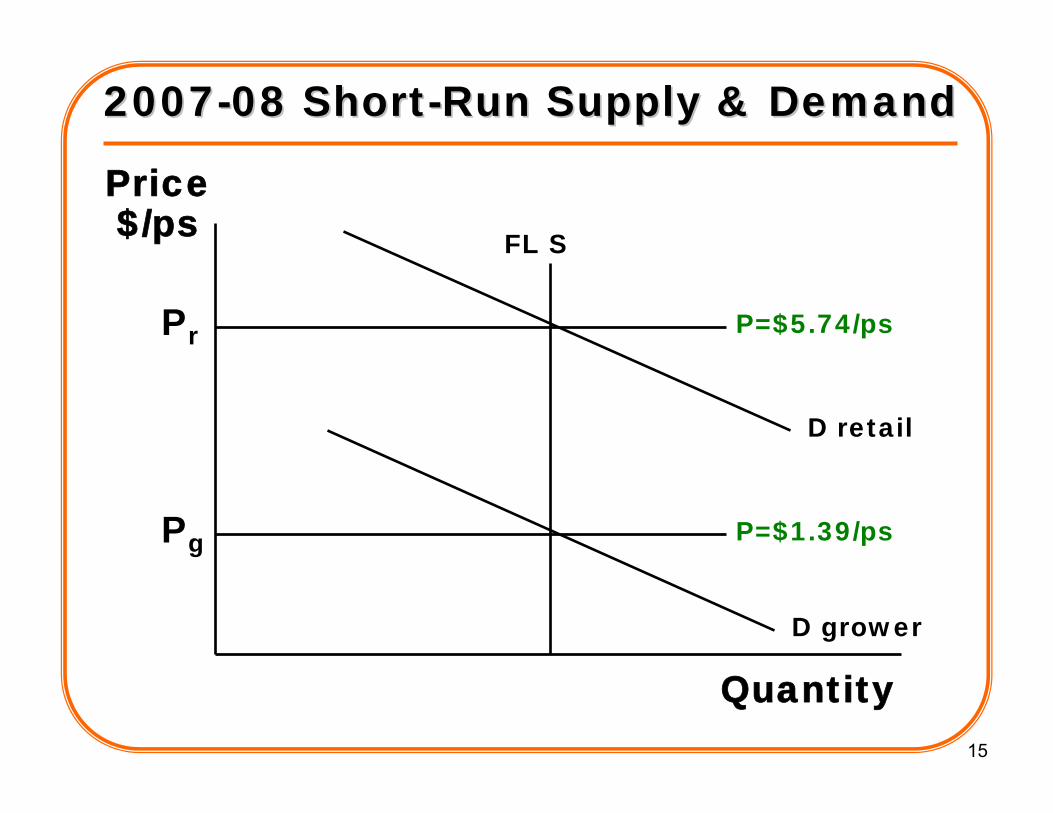
20072007--08 Short08 Short--Run Supply & DemandRun Supply & Demand
Quantity
Price$/ps FL S
D retail
D grower
P=$5.74/ps
P=$1.39/ps
Pr
Pg

16
Quantity
Price$/ps
Theoretical LongTheoretical Long--RunRunOJ Supply CurveOJ Supply Curve
Changes in Inputs
New PlantingsExisting Lands
New PlantingsNew Land

17
Quantity
Price$/ps
Long SustainabilityLong SustainabilitySupply & Demand EquilibriumSupply & Demand EquilibriumGreater Than BreakGreater Than Break--Even CostEven Cost
D1
Pg
Ps

1818
HistoricalHistoricalSustainabilitySustainability
IndicatorsIndicators
19
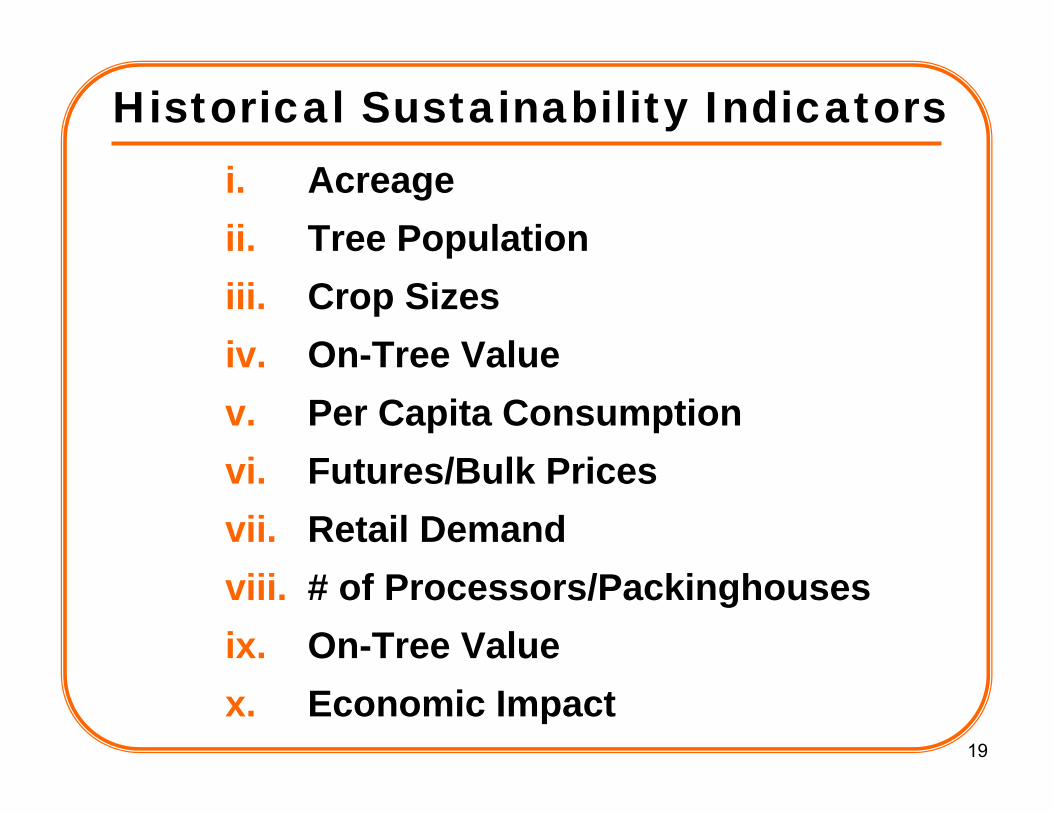
Historical Sustainability Indicatorsi. Acreageii. Tree Populationiii. Crop Sizesiv. On-Tree Valuev. Per Capita Consumptionvi. Futures/Bulk Pricesvii. Retail Demandviii. # of Processors/Packinghousesix. On-Tree Valuex. Economic Impact
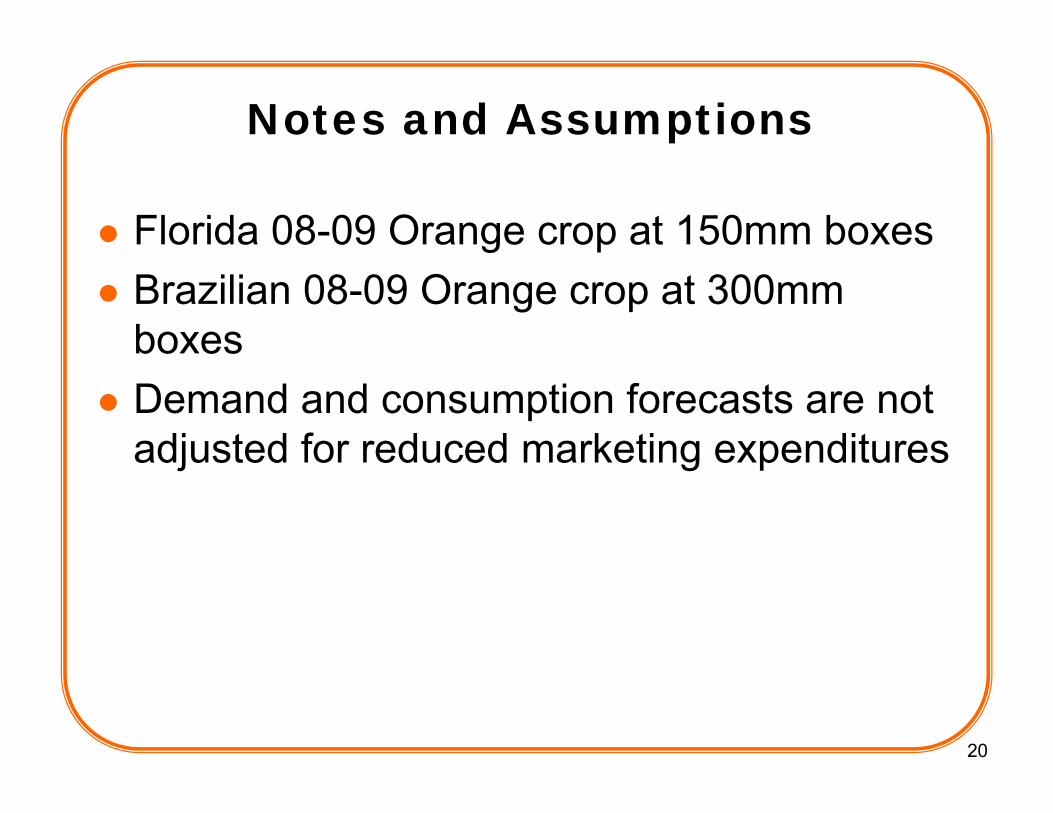
Notes and Assumptions
Florida 08-09 Orange crop at 150mm boxes Brazilian 08-09 Orange crop at 300mm boxesDemand and consumption forecasts are not adjusted for reduced marketing expenditures
20
2121
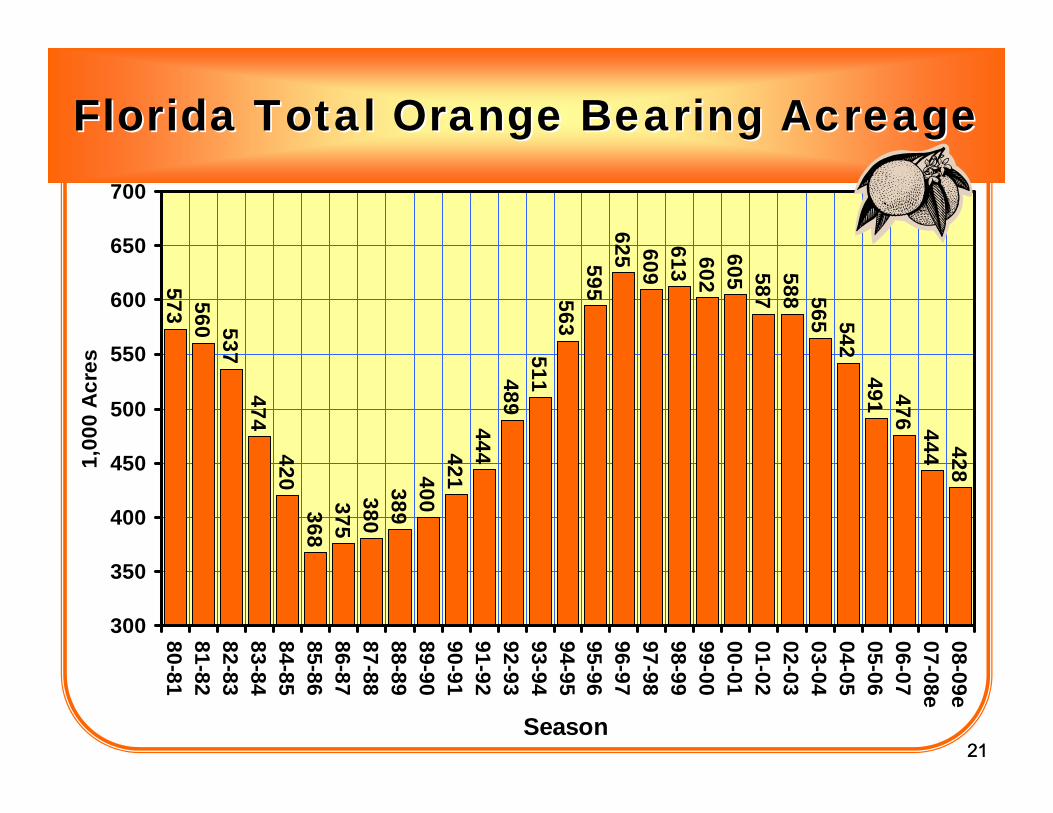
Florida Total Orange Bearing AcreageFlorida Total Orange Bearing Acreage
573 560 537474
420368
375380
389400
421444
489511
563595
625 609613 602605 587
588 565 542491 476 444 428
300
350
400
450
500
550
600
650
700
80-8181-8282-8383-8484-8585-8686-8787-8888-8989-9090-9191-9292-9393-9494-9595-9696-9797-9898-9999-0000-0101-0202-0303-0404-0505-0606-0707-08e08-09e
Season
1,00
0 A
cres

22
53.8
43.5
87.2
64
35
45
55
65
75
85
95
19661968
1970
1972
1974
1976
19781980
1982
1984
1986
1988
19901992
1994
1996
1998
2000
20022004
2006
2008eM
illio
n Tr
ees
Census Year22
SOURCE: USDA-FASS.
Florida Orange Tree PopulationFlorida Orange Tree Population

2323
Florida Total Orange Crop SizesFlorida Total Orange Crop Sizes
172126
140117 104119120
138147
110152 140
187 174206203
226244
186233 223230
203242
150148 129
170150
75
100
125
150
175
200
225
250
275
80-8181-8282-8383-8484-8585-8686-8787-8888-8989-9090-9191-9292-9393-9494-9595-9696-9797-9898-9999-0000-0101-0202-0303-0404-0505-0606-0707-08e08-09e
Season
Mill
ion
Box
es

24
World OJ Per Capita Consumption(SSE Gallons)
Country 2001-02 2002-03 2003-04 2004-05 2005-06 2006-07 2007-08Estimate
Israel 6.33 7.39 8.54 8.31 8.21 8.19 8.17U.S. 5.12 4.98 5.04 4.76 4.53 4.22 3.96Canada 4.32 4.35 4.18 4.20 4.00 3.79 3.56Australia 3.53 3.28 3.46 3.43 2.91 2.85 2.79E.U. 2.94 3.11 3.41 3.16 2.89 2.40 2.28S. Korea 1.44 1.63 1.40 1.32 1.34 1.19 1.21Japan 1.06 1.06 1.00 1.00 1.01 .98 .98Russia* .26 .36 .44 .45 .54 .55 .55Hong Kong* .36 .38 .32 .31 .31 .32 .32Turkey .30 .30 .32 .32 .31 .31 .30Brazil .12 .14 .15 .17 .21 .23 .25S. Africa .29 .38 .41 .33 .31 .16 .13Morocco .07 .08 .11 .11 .10 .10 .09Mexico .08 .06 .06 .08 .07 .08 .08China .04 .04 .05 .05 .06 .07 .07TOTAL .85 .87 .91 .86 .81 .73 .70
24
Sources: FAS; USDA; FDOC estimates for U.S., Canada & the E.U.; Global Trade Information Services, Inc. (GTI) for other countries.*NOTE: E.U. OJ consumption estimated as (Brazil) ABECitrus exports to the E.U. plus U.S. Dept. of Commerce exports to the E.U. plus USDA estimates of OJ production in Greece, Italy & Spain, plus GTI based estimates of OJ imports from other countries besides Brazil and the U.S.
minus GTI based estimates of E.U. exports.
25
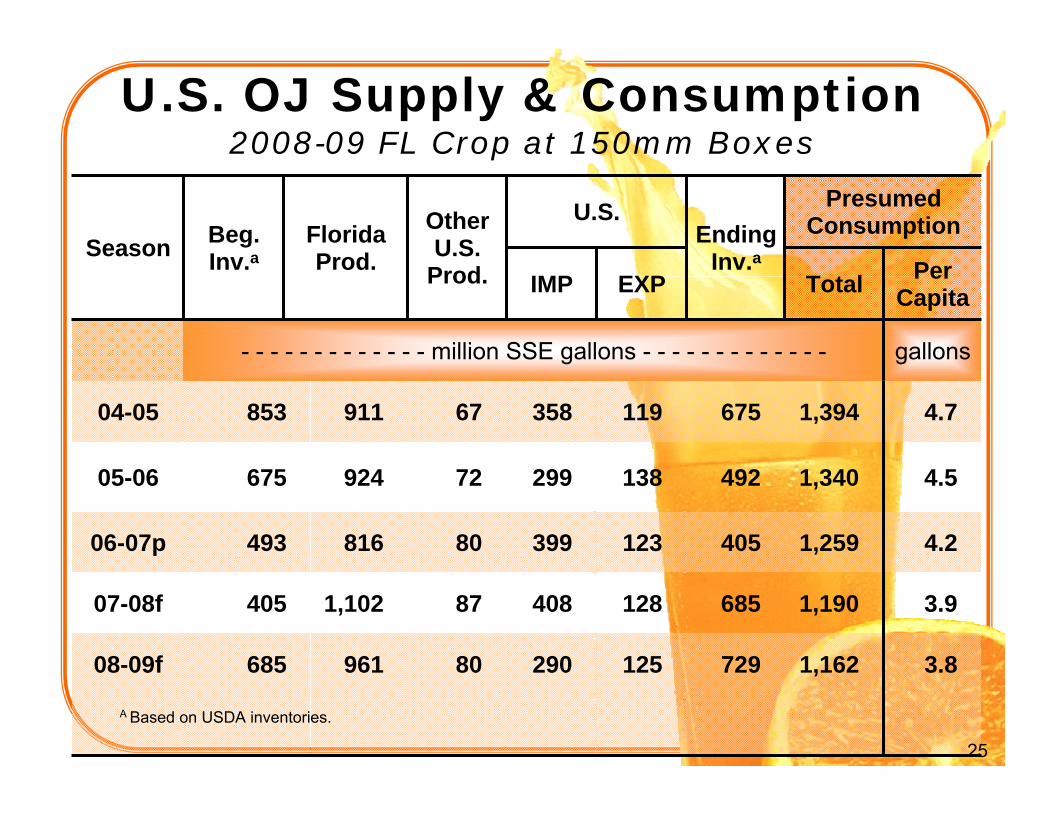
U.S. OJ Supply & Consumption2008-09 FL Crop at 150mm Boxes
Season Beg.Inv.a
FloridaProd.
OtherU.S.
Prod.
U.S.Ending
Inv.a
PresumedConsumption
IMP EXP Total PerCapita
- - - - - - - - - - - - - million SSE gallons - - - - - - - - - - - - - gallons
04-05 853 911 67 358 119 675 1,394 4.7
05-06 675 924 72 299 138 492 1,340 4.5
06-07p 493 816 80 399 123 405 1,259 4.2
07-08f 405 1,102 87 408 128 685 1,190 3.9
08-09f 685 961 80 290 125 729 1,162 3.8
25
A Based on USDA inventories.
2626
0.50
0.70
0.90
1.10
1.30
1.50
1.70
1.90
2.10
2.30
350
650
950
1,250
1,550
1,850
2,150
2,450
2,750
3,050A
ug
-99
Dec
-99
Ap
r-0
0A
ug
-00
Dec
-00
Ap
r-0
1A
ug
-01
Dec
-01
Ap
r-0
2A
ug
-02
Dec
-02
Ap
r-0
3A
ug
-03
Dec
-03
Ap
r-0
4A
ug
-04
Dec
-04
Ap
r-0
5A
ug
-05
Dec
-05
Ap
r-0
6A
ug
-06
Dec
-06
Ap
r-0
7A
ug
-07
Dec
-07
Ap
r-0
8A
ug
-08
$/PS (Futures &
Bulk)
$/M
T (R
ott
erda
m)
Month Average
Rotterdam Futures Bulk FOB
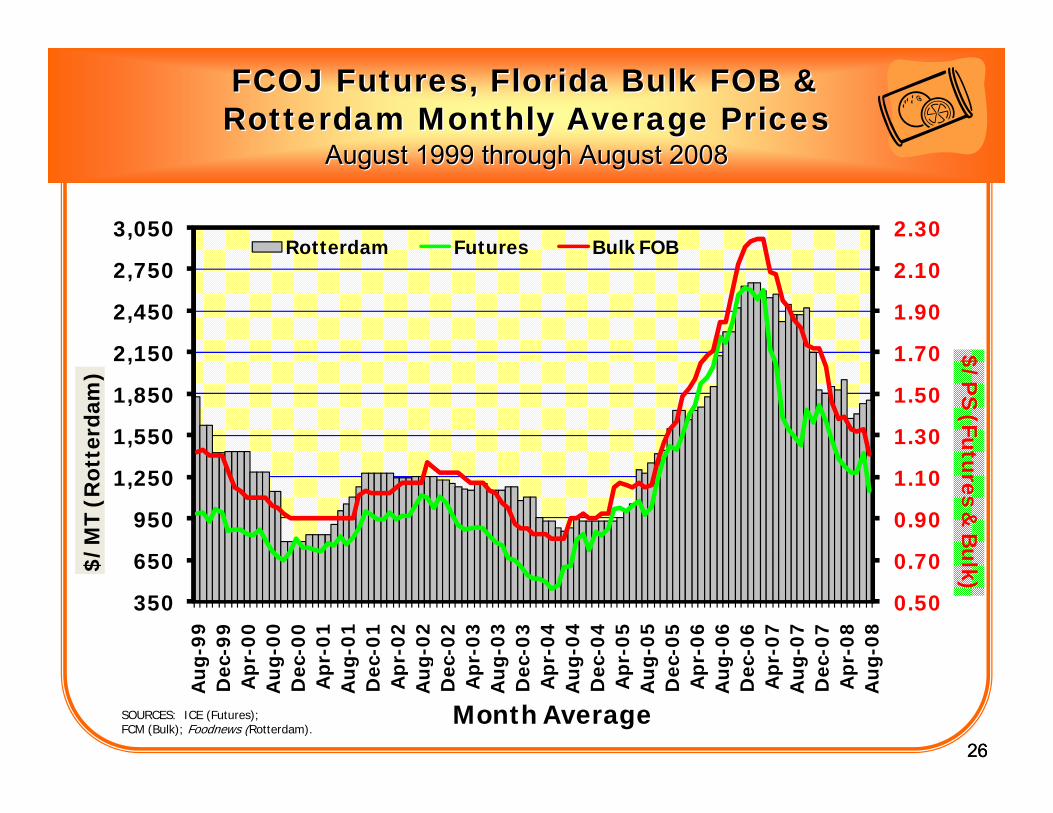
SOURCES: ICE (Futures);FCM (Bulk); Foodnews (Rotterdam).
FCOJ Futures, Florida Bulk FOB &FCOJ Futures, Florida Bulk FOB &Rotterdam Monthly Average PricesRotterdam Monthly Average Prices
August 1999 through August 2008August 1999 through August 2008
27
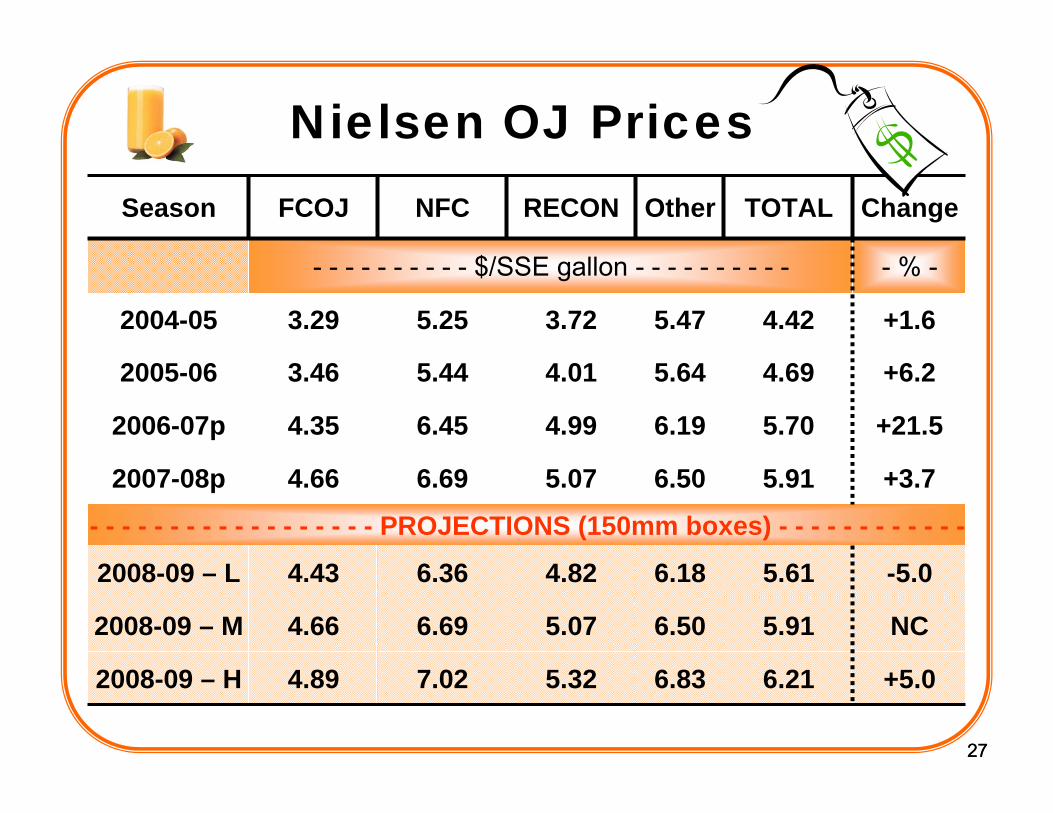
Nielsen OJ PricesSeason FCOJ NFC RECON Other TOTAL Change
- - - - - - - - - - $/SSE gallon - - - - - - - - - - - % -
2004-05 3.29 5.25 3.72 5.47 4.42 +1.6
2005-06 3.46 5.44 4.01 5.64 4.69 +6.2
2006-07p 4.35 6.45 4.99 6.19 5.70 +21.5
2007-08p 4.66 6.69 5.07 6.50 5.91 +3.7
- - - - - - - - - - - - - - - - - - PROJECTIONS (150mm boxes) - - - - - - - - - - - -
2008-09 – L 4.43 6.36 4.82 6.18 5.61 -5.0
2008-09 – M 4.66 6.69 5.07 6.50 5.91 NC
2008-09 – H 4.89 7.02 5.32 6.83 6.21 +5.0
27

28
Nielsen OJ VolumeSeason FCOJ NFC RECON Other TOTAL Change
- - - - - - - - - - million SSE gallons - - - - - - - - - - - % -
2004-05 70.1 374.7 343.8 6.7 795.3 -1.5
2005-06 62.3 373.5 303.6 5.9 745.3 -6.3
2006-07p 54.8 337.9 252.7 5.5 650.8 -12.7
2007-08p 49.4 328.0 240.0 5.5 623.0 -4.3
- - - - - - - - - - - - - - - - - - PROJECTIONS (150mm boxes) - - - - - - - - - - - -
2008-09 – L 44.9 311.5 223.1 5.2 586.7 -5.8
2008-09 – M 46.5 322.3 232.9 5.4 607.1 -2.6
2008-09 – H 48.2 334.1 241.4 5.6 629.3 +1.0
28
29
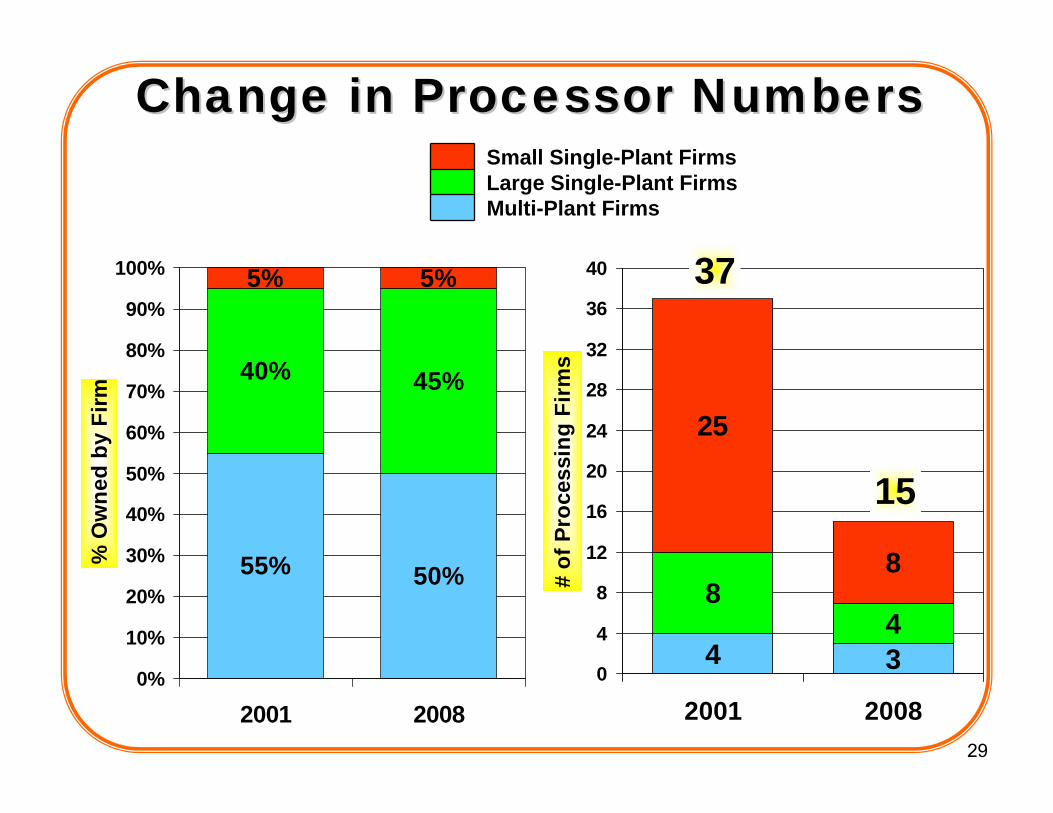
Change in Processor NumbersChange in Processor Numbers
55% 50%
40% 45%
5% 5%
0%
10%
20%
30%
40%
50%
60%
70%
80%
90%
100%
2001 2008
% O
wne
d by
Firm
4 3
84
25
8
0
4
8
12
16
20
24
28
32
36
40
2001 2008
# of
Pro
cess
ing
Firm
s
Small Single-Plant FirmsLarge Single-Plant FirmsMulti-Plant Firms
37
15

30
Change in Packinghouse NumbersChange in Packinghouse Numbers
19%9%
76%86%
5% 5%
0%
10%
20%
30%
40%
50%
60%
70%
80%
90%
100%
2001 2008
% O
wne
d by
Firm
6 1
4030
51
19
0
10
20
30
40
50
60
70
80
90
100
2001 2008
# of
Pac
king
hous
e Fi
rms
Small Single-Plant FirmsLarge Single-Plant FirmsMulti-Plant Firms
97
50
3131
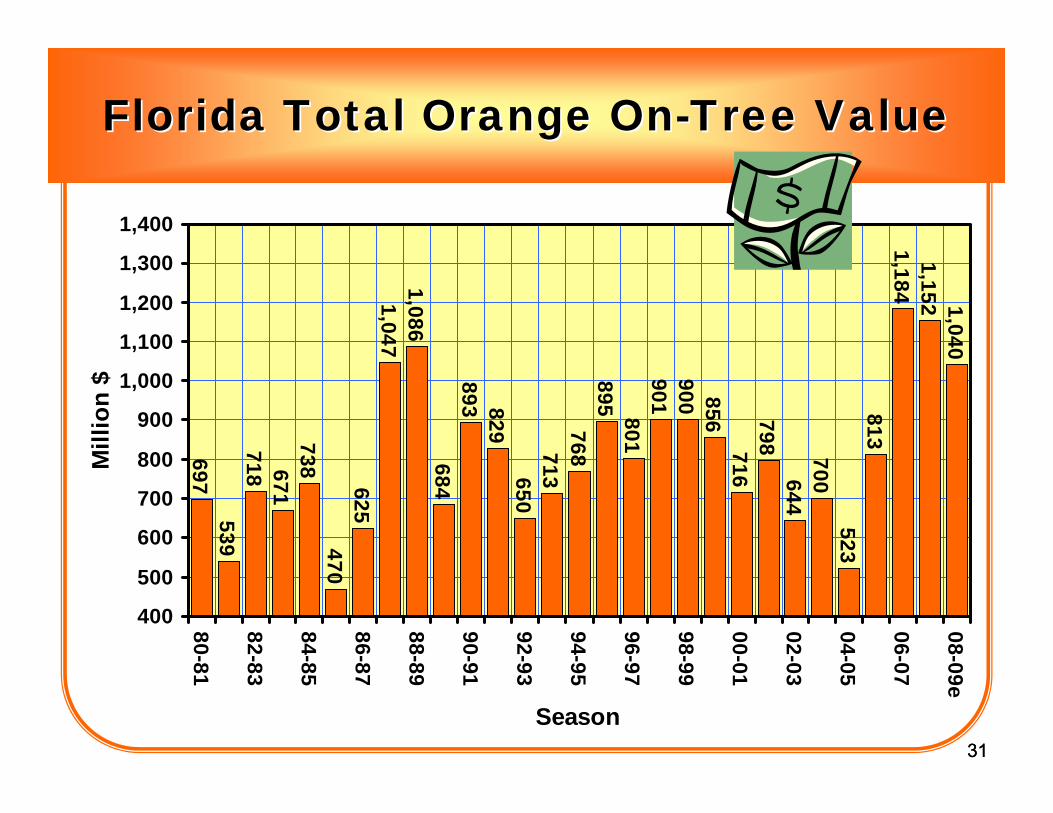
Florida Total Orange OnFlorida Total Orange On--Tree ValueTree Value
697539
718 671738
470625
1,0471,086
684893 829
650713
768895 801901900 856
716798
644700
523813
1,1841,152 1,040
400
500
600
700
800
900
1,000
1,100
1,200
1,300
1,400
80-81
82-83
84-85
86-87
88-89
90-91
92-93
94-95
96-97
98-99
00-01
02-03
04-05
06-07
08-09e
Season
Mill
ion
$
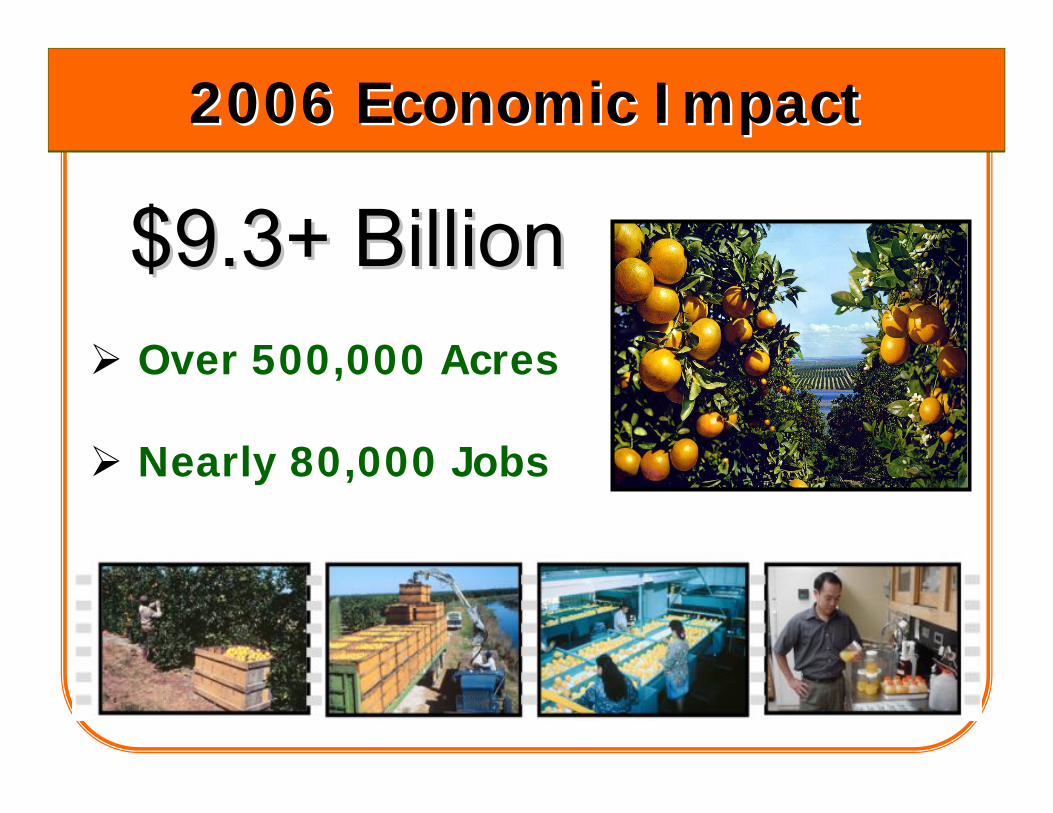
2006 Economic Impact2006 Economic Impact
$9.3+ Billion$9.3+ BillionOver 500,000 Acres
Nearly 80,000 Jobs

3333
What factors willWhat factors willinfluence theseinfluence these
indicators inindicators inthe future?the future?

3434
FACTORSFACTORSIMPACTINGIMPACTING
SUPPLYSUPPLY--SIDESIDE

35
Quantity
Price$/ps
LongLong--Run Supply CurveRun Supply Curve
3636
FACTORSFACTORSIMPACTINGIMPACTING
DEMANDDEMAND--SIDESIDE

37
Factors That Impact OJ DemandFactors That Impact OJ DemandPRICING
► Own- & Cross-Price Effects
PROMOTION► Features, Display & TPR
ADVERTISING► Generic & Branded
INCOMES► Real Per Capita Incomes
INFLATION37

38
Shifts in Demand CurvesShifts in Demand Curves
Quantity
Price
D1
D2

39
20072007--08 Supply and Demand Equilibrium08 Supply and Demand EquilibriumDerived Demand for FruitDerived Demand for Fruit
Quantity
Price$/ps FL S
D retail
D grower
P=$5.74/ps
P=$1.39/ps
Pr
Pg
supplychaincosts
4040
PricingPricing

41
4.33 4.37 4.39 4.40 4.35 4.424.69
5.705.91
5.615.91
6.21
4.00
4.50
5.00
5.50
6.00
6.50
1999-00
2000-01
2001-02
2002-03
2003-04
2004-05
2005-06
2006-07
2007-08
2008-09e
Season
$ pe
r SS
E ga
llon
Retail OJ Price
4242
Per CapitaPer CapitaIncomeIncome

43
Per Capita DisposablePersonal Income
Year Nominal Real(2008 dollars)
Change- - - - - $1,000 - - - - - - - % - -
2000 25.5 31.9 2.82001 26.3 31.9 .22002 27.2 32.5 2.02003 28.1 32.9 1.02004 29.6 33.7 2.62005 30.7 33.9 .42006 32.2 34.4 1.62007 33.7 35.0 1.82008e 35.3 35.3 .82009e 36.1 34.3 -2.0

4444
InflationInflation

45
3.4%
2.8%2.3%
2.7%
3.4%3.2%
3.8%
2.8%
1.6%
5.0%
1.0%
1.5%
2.0%
2.5%
3.0%
3.5%
4.0%
4.5%
5.0%
5.5%
2000 2001 2002 2003 2004 2005 2006 2007 2008e 2009e
Year
% C
hang
eConsumer Price Index
4646
Competitive /Competitive /SubstituteSubstituteProductsProducts
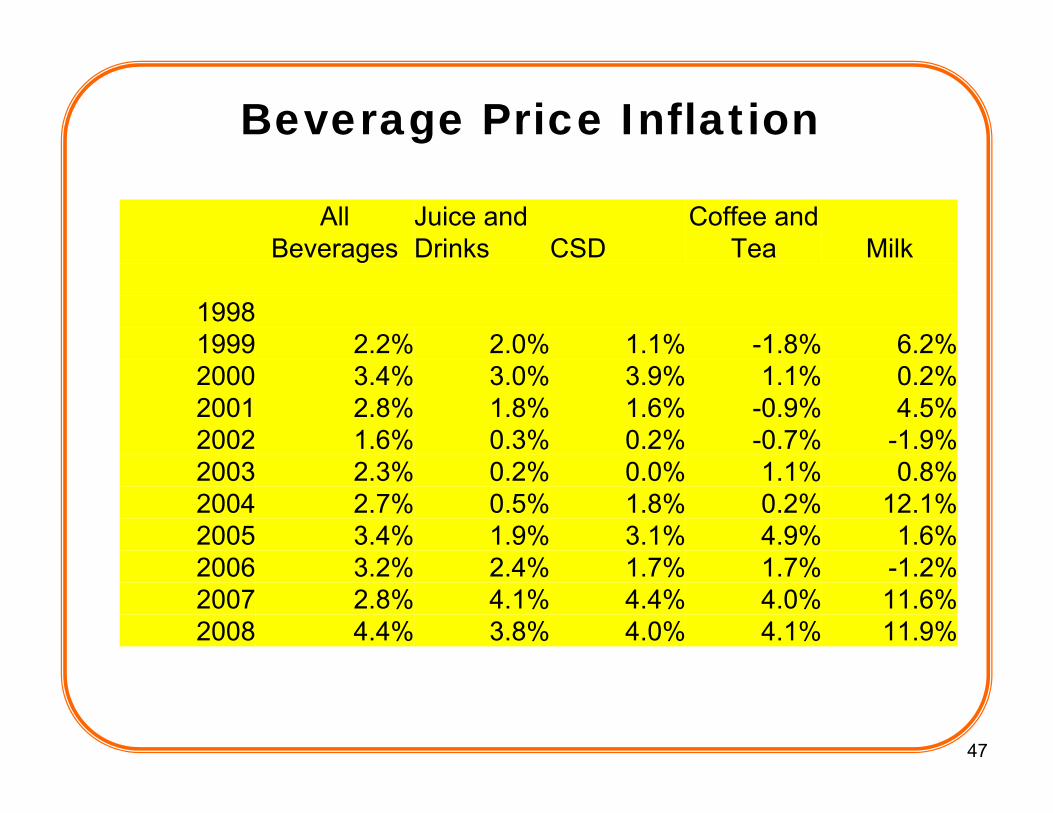
Beverage Price Inflation
47
All Beverages
Juice and Drinks CSD
Coffee and Tea Milk
19981999 2.2% 2.0% 1.1% -1.8% 6.2%2000 3.4% 3.0% 3.9% 1.1% 0.2%2001 2.8% 1.8% 1.6% -0.9% 4.5%2002 1.6% 0.3% 0.2% -0.7% -1.9%2003 2.3% 0.2% 0.0% 1.1% 0.8%2004 2.7% 0.5% 1.8% 0.2% 12.1%2005 3.4% 1.9% 3.1% 4.9% 1.6%2006 3.2% 2.4% 1.7% 1.7% -1.2%2007 2.8% 4.1% 4.4% 4.0% 11.6%2008 4.4% 3.8% 4.0% 4.1% 11.9%
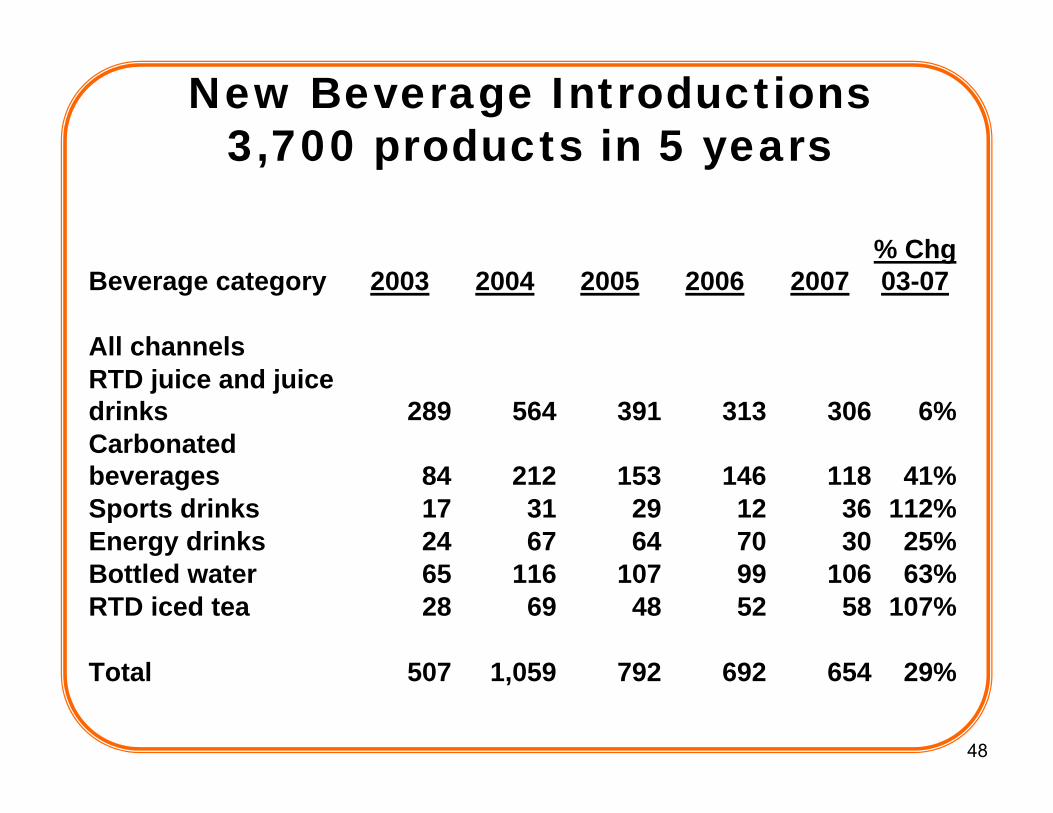
New Beverage Introductions3,700 products in 5 years
48
Beverage category 2003 2004 2005 2006 2007% Chg 03-07
All channelsRTD juice and juice drinks 289 564 391 313 306 6%Carbonated beverages 84 212 153 146 118 41%Sports drinks 17 31 29 12 36 112%Energy drinks 24 67 64 70 30 25%Bottled water 65 116 107 99 106 63%RTD iced tea 28 69 48 52 58 107%
Total 507 1,059 792 692 654 29%
4949
PromotionPromotion

50
Percent ACV with A/B Ad ActivityPercent ACV with A/B Ad ActivityTotal OJTotal OJ
50

5151
MARKETINGMARKETINGGenericGenericBrandBrand

52
Total FDOC vs. BrandTelevision Advertising
17.8 18.2 19.122.1
15.812.0 13.3
9.0
37.632.9
14.517.0
14.5
47.6
55.055.0
$0
$10
$20
$30
$40
$50
$60
01-02 02-03 03-04 04-05 05-06 06-07 07-08 08-09f
Fiscal Year
Mill
ion
Dol
lars
FDOC Brand
5353
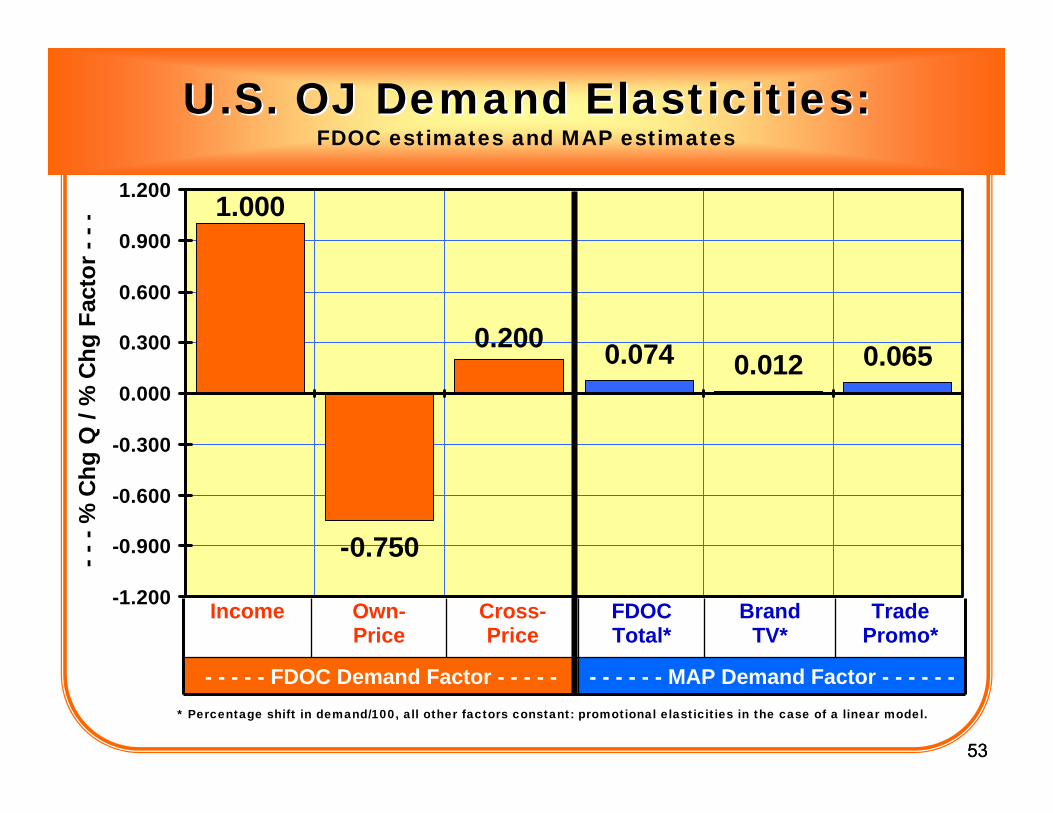
-0.750
0.074 0.012 0.065
1.000
0.200
-1.200
-0.900
-0.600
-0.300
0.000
0.300
0.600
0.900
1.200
Income Ow n-Price Cross-Price FDOC Total (3) Generic Brand TV (3) Brand Trade Promo (3)
- - -
% C
hg Q
/ %
Chg
Fac
tor -
- -
* Percentage shift in demand/100, all other factors constant: promotional elasticities in the case of a linear model.
U.S. OJ Demand Elasticities:U.S. OJ Demand Elasticities:FDOC estimates and MAP estimates
Income Own-Price
Cross-Price
FDOCTotal*
BrandTV*
TradePromo*
- - - - - FDOC Demand Factor - - - - - - - - - - - MAP Demand Factor - - - - - -
5454
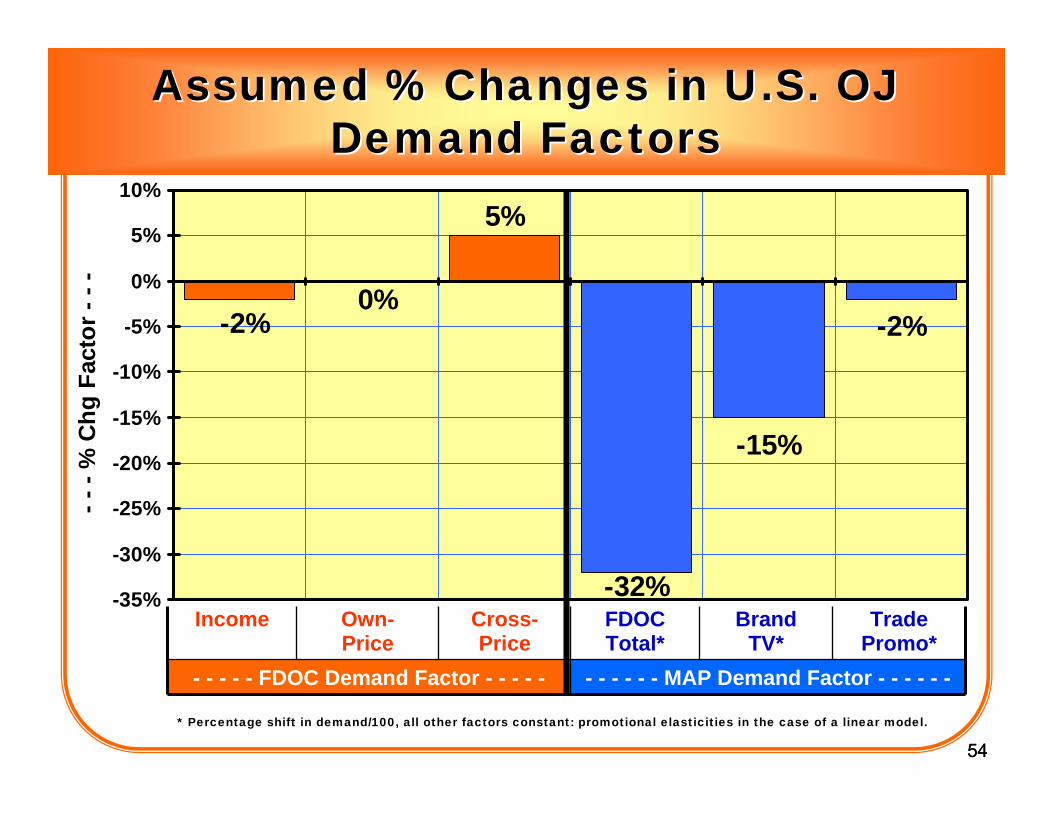
-15%
-2%
-32%
-2%0%
5%
-35%
-30%
-25%
-20%
-15%
-10%
-5%
0%
5%
10%
Income Ow n-Price Cross-Price FDOC Total (3) Generic Brand TV (3) Brand Trade Promo (3)
- - -
% C
hg F
acto
r - -
-Assumed % Changes in U.S. OJ Assumed % Changes in U.S. OJ
Demand FactorsDemand Factors
Income Own-Price
Cross-Price
FDOCTotal*
BrandTV*
TradePromo*
- - - - - FDOC Demand Factor - - - - - - - - - - - MAP Demand Factor - - - - - -
* Percentage shift in demand/100, all other factors constant: promotional elasticities in the case of a linear model.
5555
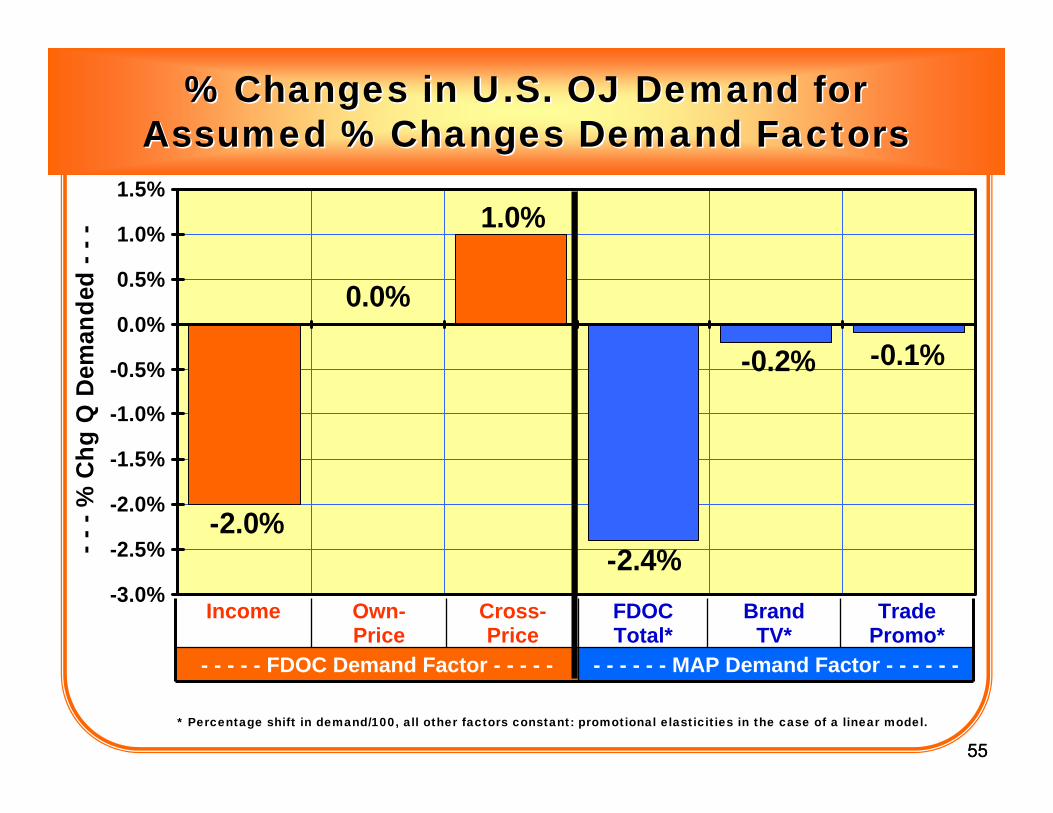
0.0%
-0.1%-0.2%
-2.4%-2.0%
1.0%
-3.0%
-2.5%
-2.0%
-1.5%
-1.0%
-0.5%
0.0%
0.5%
1.0%
1.5%
Income Ow n-Price Cross-Price FDOC Total (3) Generic Brand TV (3) Brand Trade Promo (3)
- - -
% C
hg Q
Dem
ande
d - -
-% Changes in U.S. OJ Demand for% Changes in U.S. OJ Demand for
Assumed % Changes Demand FactorsAssumed % Changes Demand Factors
Income Own-Price
Cross-Price
FDOCTotal*
BrandTV*
TradePromo*
- - - - - FDOC Demand Factor - - - - - - - - - - - MAP Demand Factor - - - - - -
* Percentage shift in demand/100, all other factors constant: promotional elasticities in the case of a linear model.
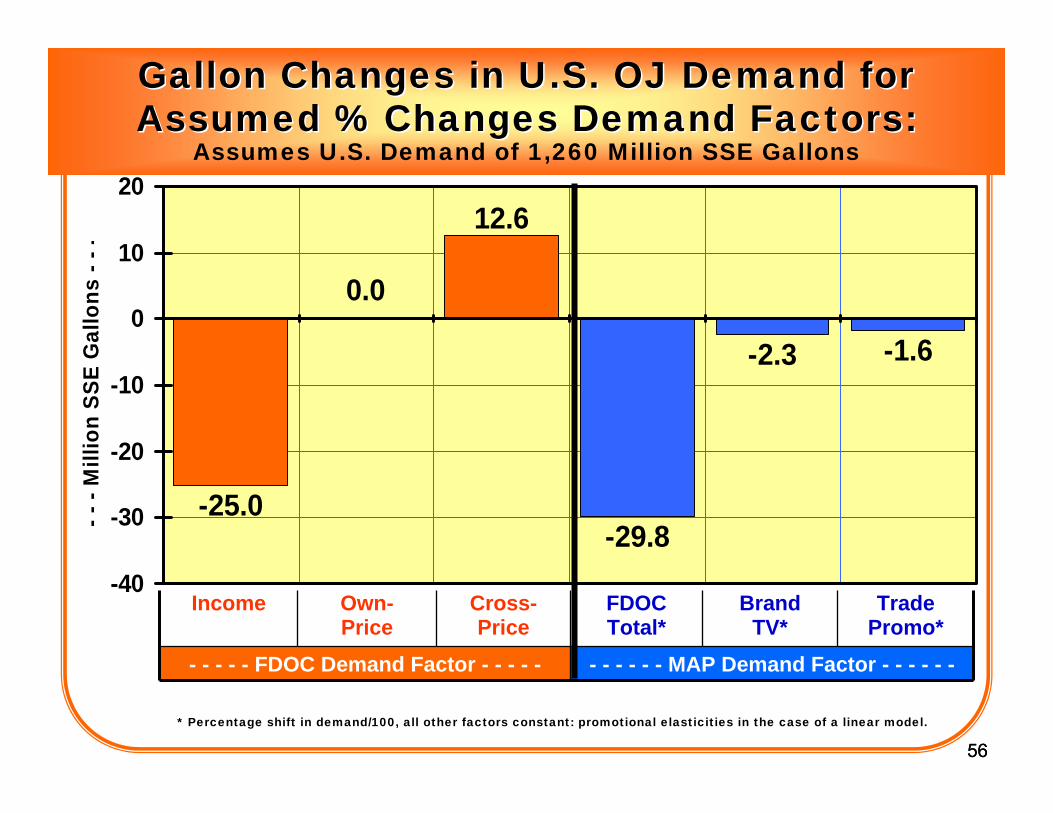
5656
0.0
-1.6-2.3
-29.8-25.0
12.6
-40
-30
-20
-10
0
10
20
Income Ow n-Price Cross-Price FDOC Total (3) Generic Brand TV (3) Brand Trade Promo (3)
- - -
Mill
ion
SSE
Gal
lons
- - -
Gallon Changes in U.S. OJ Demand forGallon Changes in U.S. OJ Demand forAssumed % Changes Demand Factors:Assumed % Changes Demand Factors:
Assumes U.S. Demand of 1,260 Million SSE Gallons
Income Own-Price
Cross-Price
FDOCTotal*
BrandTV*
TradePromo*
- - - - - FDOC Demand Factor - - - - - - - - - - - MAP Demand Factor - - - - - -
* Percentage shift in demand/100, all other factors constant: promotional elasticities in the case of a linear model.

5757
20082008--09 INTERSECTION OF09 INTERSECTION OFSUPPLY & DEMANDSUPPLY & DEMAND
SCENARIOSSCENARIOS
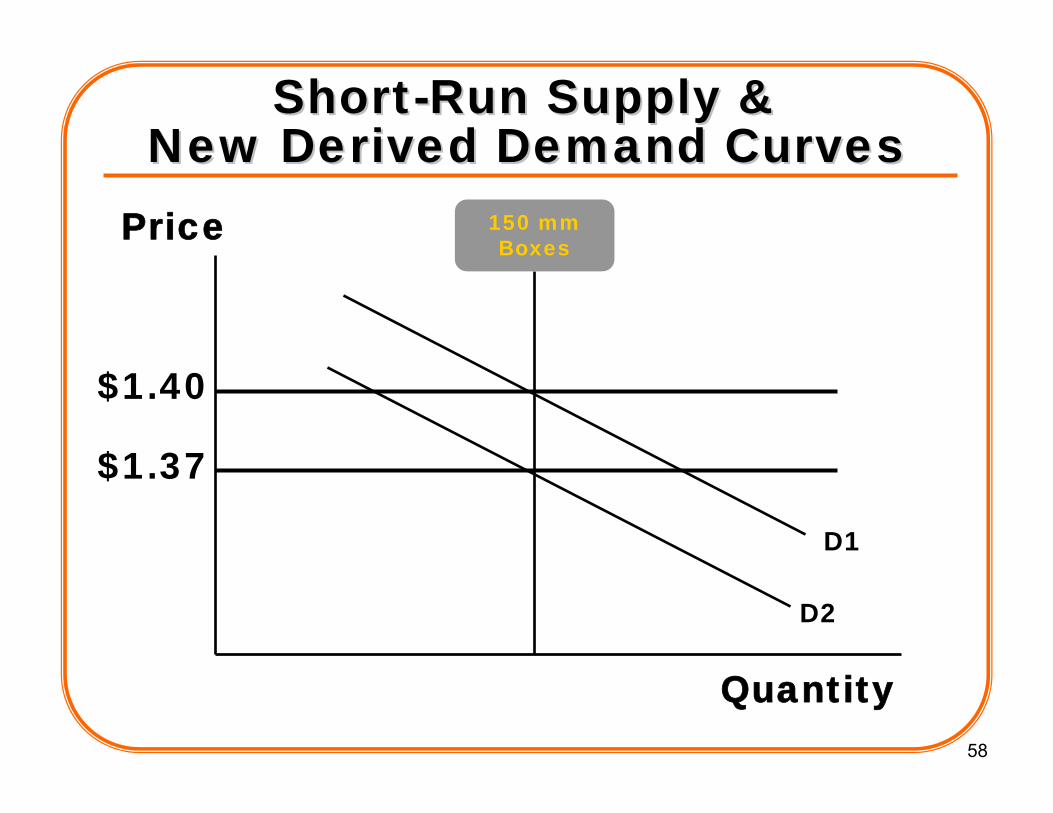
58
ShortShort--Run Supply & Run Supply & New Derived Demand CurvesNew Derived Demand Curves
Quantity
Price 150 mmBoxes
D1
$1.40
D2
$1.37
59
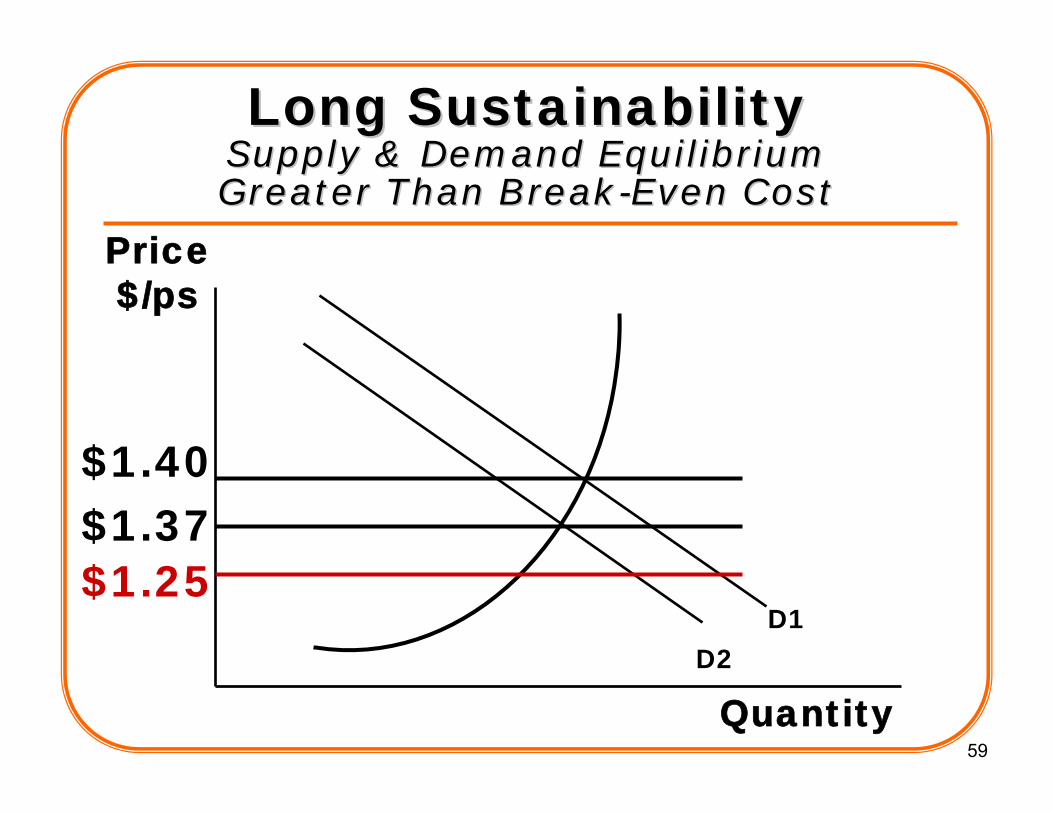
Quantity
Price$/ps
Long SustainabilityLong SustainabilitySupply & Demand EquilibriumSupply & Demand EquilibriumGreater Than BreakGreater Than Break--Even CostEven Cost
D1D2
$1.37$1.40
$1.25

6060
SUMMARYSUMMARY&&
CONCLUSIONSCONCLUSIONS

61
Florida OJ Sustainability:Florida OJ Sustainability:Economic ConsiderationsEconomic Considerations
61
Pest and Disease issues, along with weather disasters, impact the viability of Florida Growers
Costs are increasing and per-acre yields are decreasing rapidly
Shifts in demand are also impacting long-term sustainability
Today the intersection of supply and demand is slightly higher than break-even costs. Tomorrow??
Future studies can help the Industry determine the right levels of demand and supply enhancements
6262
Thank You!Thank You!