florida citrus production trends 2012-13 through 2020 … · florida citrus production trends...
TRANSCRIPT
Florida Citrus Production Trends2012-13 Through 2020-21
Economic and Market Research Department
Florida Department of Citrus
February, 2011
CIR 2011-1
MISSION: “Grow the Market for the Florida Citrus Industry” to enhance the economic
well-being of the Florida citrus grower, citrus industry, and the State of Florida.
Florida Citrus Production Trends2012-13 Through 2020-21
February, 2011
CIR 2011-1
Prepared by:
ECONOMIC AND MARKET RESEARCH DEPARTMENT
FLORIDA DEPARTMENT OF CITRUS
P.O. Box 110249Gainesville, Florida 32611-0249 USA
Phone: 352-392-1874FAX: 352-392-8634
E-Mail: [email protected]
Web Site: www.fdocgrower.com
Table of Contents
Page
LIST OF TABLES . . . . . . . . . . . . . . . . . . . . . . . . . . . . . . . . . . . . . . . . . . . . . . . . . . . . . . . . . . . ii
FLORIDA CITRUS PRODUCTION TRENDS, 2012-13 THROUGH 2020-21 . . . . . . . . . . . 1
Introduction . . . . . . . . . . . . . . . . . . . . . . . . . . . . . . . . . . . . . . . . . . . . . . . . . . . . . . . . . . . . 1
HLB Background and Update . . . . . . . . . . . . . . . . . . . . . . . . . . . . . . . . . . . . . . . . . . . . . 2
Overview of the 2010 Commercial Citrus Inventory . . . . . . . . . . . . . . . . . . . . . . . . . . . 4
Methodology and Assumptions . . . . . . . . . . . . . . . . . . . . . . . . . . . . . . . . . . . . . . . . . . . . . 5
Planting Assumptions . . . . . . . . . . . . . . . . . . . . . . . . . . . . . . . . . . . . . . . . . . . . . . 6
Tree/Acre-Loss Assumptions . . . . . . . . . . . . . . . . . . . . . . . . . . . . . . . . . . . . . . . . 7
Yield Assumptions . . . . . . . . . . . . . . . . . . . . . . . . . . . . . . . . . . . . . . . . . . . . . . . . 7
Production Estimates . . . . . . . . . . . . . . . . . . . . . . . . . . . . . . . . . . . . . . . . . . . . . . . . . . . . 8
Conclusions . . . . . . . . . . . . . . . . . . . . . . . . . . . . . . . . . . . . . . . . . . . . . . . . . . . . . . . . . . . . 9
TABLES . . . . . . . . . . . . . . . . . . . . . . . . . . . . . . . . . . . . . . . . . . . . . . . . . . . . . . . . . . . . . . . . . . . 11
ii
List of Tables
Table Page
1 Florida Citrus Acreage and Tree Numbers by Commercial Inventory . . . . . . . . . . . . . . . 13
2 Florida Round-Orange Acreage and Tree Numbers by Commercial Inventory . . . . . . . . 14
3 Florida Grapefruit Acreage and Tree Numbers by Commercial Inventory . . . . . . . . . . . . 15
4 Florida Specialty Citrus Acreage and Tree Numbers by Commercial Inventory . . . . . . . 16
5 Age Distribution of Florida Round-Orange Trees by Year of Inventory . . . . . . . . . . . . . . 17
6 Age Distribution of Florida Grapefruit Trees by Year of Inventory . . . . . . . . . . . . . . . . . 18
7 Age Distribution of Florida Grapefruit Trees by Marketing District and Variety,2010 Inventory . . . . . . . . . . . . . . . . . . . . . . . . . . . . . . . . . . . . . . . . . . . . . . . . . . . 19
8 Age Distribution of Florida Specialty Citrus Trees by Variety, 2010 Inventory . . . . . . . . 20
9 Average Annual Citrus Plantings by Variety . . . . . . . . . . . . . . . . . . . . . . . . . . . . . . . . . . . 21
10 Historical Citrus Tree- and Acreage-Loss Rates by Variety . . . . . . . . . . . . . . . . . . . . . . 22
11 Average Orange Yields by Age . . . . . . . . . . . . . . . . . . . . . . . . . . . . . . . . . . . . . . . . . . . . 23
12 Average Grapefruit Yields by Age . . . . . . . . . . . . . . . . . . . . . . . . . . . . . . . . . . . . . . . . . . 24
13 Florida Orange Production Projections . . . . . . . . . . . . . . . . . . . . . . . . . . . . . . . . . . . . . . 25
14 Florida Grapefruit Production Projections . . . . . . . . . . . . . . . . . . . . . . . . . . . . . . . . . . . . 26
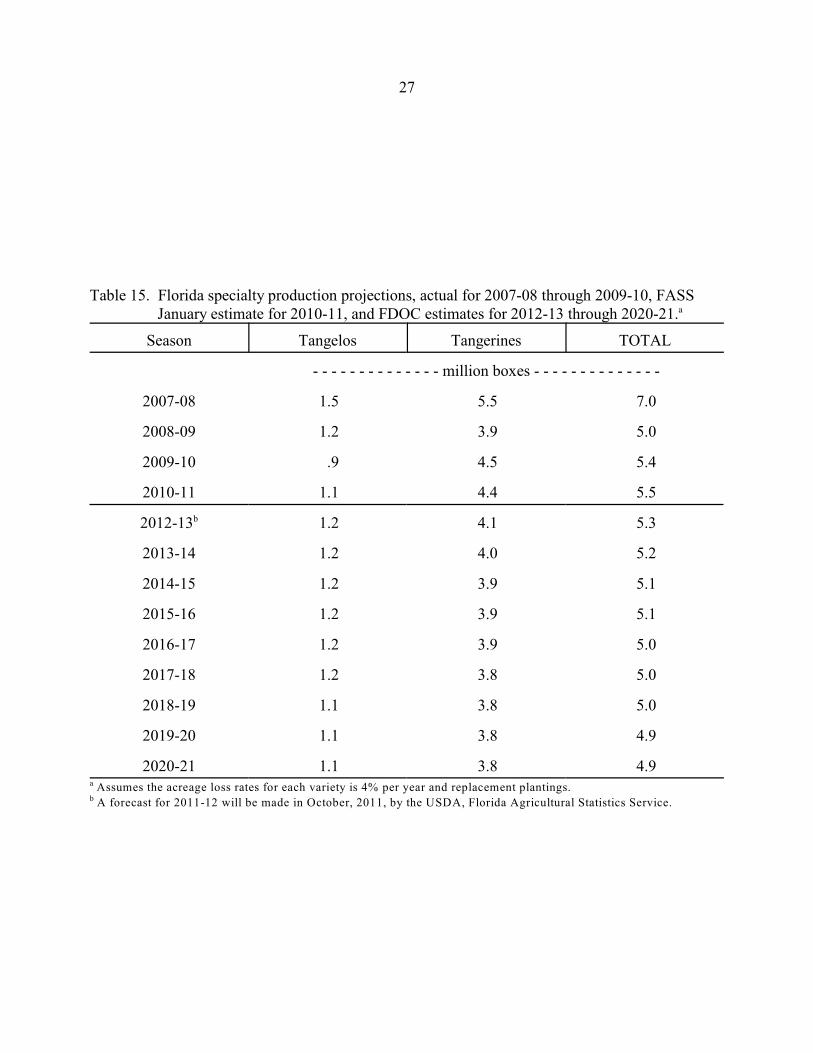
15 Florida Specialty Citrus Production Projections . . . . . . . . . . . . . . . . . . . . . . . . . . . . . . . 27
Florida Citrus Production Trends2012-13 Through 2020-21
Introduction
This report provides production projections for Florida round oranges, grapefruit and specialty
citrus for the 2012-13 through 2020-21 seasons. Production in upcoming years will depend on a
number of factors difficult to predict. Important assumptions are made on acre-loss rates, planting
rates and yields per acre. Citrus diseases, notably greening and canker, are key factors that will impact
production. Although uncertainty exists on greening’s impact over the projection period, significant
progress is being made in controlling this disease, an important factor considered in developing the
scenarios in this report.
The production projections are based on the Florida Agricultural Statistics Service (FASS)
commercial citrus inventory released in September, 2010. The inventory reports number of trees and
acres, by age, for different varieties of citrus. These data are combined with FASS yield data on boxes
of fruit per tree, by age, to estimate yields per acre. Future production is estimated by applying
average yields to projected acreage, by age.
The projections in this report are intended to indicate the trends in production as opposed to
production in any given season. The same average yields, by age, are used in estimating production
in each season to obtain the trend (many factors determine yields in a given season, and this analysis
does not attempt to estimate season-specific yields) . Yields, however, can vary significantly from
year to year (e.g., for oranges, the 95% confidence interval is about +/- 20% around the trend based
on yield variation alone). Hence, for each of the upcoming seasons considered, actual yields could
be significantly different than the average yields used here, with the result that the season’s production
2
1http://www.irchlb.org/hlb.aspx
projection in this report may be significantly different than the actual production that occurs. Given
this issue, production projections are not provided for the upcoming 2011-12 season. The first
forecasts for 2011-12 will be made in October, 2011, by the USDA, FASS.
HLB Background and Update
The citrus industry in Florida, as well as a number of other citrus-growing regions in the world,
including Brazil, have been struggling with the citrus disease Huanglongbing (HLB) or greening. This
disease eventually kills citrus trees and has the potential to devastate the Florida citrus industry. HLB
infection rates vary significantly across regions in Florida with near 100% infection in some areas and
relatively little infection in other areas. An industry estimate of the statewide incidence of HLB in
2009 was 8% to 9%, but the current incidence could be higher, around 18%. Major research on HLB1
is ongoing, and grower practices are evolving as more is learned about the disease. The ultimate goal
is to develop disease-resistant trees, but it is assumed in this report that fully achieving this goal,
including supplying resistant trees to growers and having a significant impact on production, will not
occur over the ten-year projection period considered here.
Despite the dire side of HLB, growers are finding reason for hope. Grower practices to
manage HLB have made significant progress, increasing the likelihood that Florida may be able to
maintain its citrus production at a viable level.
HLB is spread by psyllids, small insects that feed on citrus leaves and tender new growth.
These insects have been a major focus of the research. Spray programs have been developed that have
3
A possible problem may be that a high HLB infection rate in an area may result in a higher percentage of the2
psyllid population carrying the disease, and, even though the psyllid population may be reduced significantly, the
surviving psyllids may largely be carriers that continue to infect trees further, hastening their decline.
effectively suppressed psyllid populations and HLB in some areas. Growers have joined together to
form Citrus Health Management Areas (CHMAs) that have conducted large spray programs,
increasing their effectiveness. It is important that spray programs cover all citrus groves, as well as
abandoned citrus acreage. Bad neighbors not spraying may harbor psyllid populations that continue
to be a source of HLB infection. Grower adoption of new practices is not universal, with large
growers having tended to adopt new practices to deal with HLB faster than smaller ones.
The recommended approach to dealing with HLB is: 1) inspect groves thoroughly and
frequently for the presence of HLB, 2) remove infected trees, and 3) conduct an aggressive psyllid
control program. Experience with this approach indicates that it can be effective where practiced,
given the initial spread of HLB is limited. HLB may not be completely eliminated where this
approach is taken, but the disease appears to be controlled to an extent that allows survival.
In groves where HLB is relatively widespread, the above approach may not be economically
viable. With removal of HLB-positive trees, production and revenue losses may be too great to remain
in business. Many growers facing this latter situation have taken an alternative approach that focuses
on keeping HLB trees in production, using various nutritional programs. Psyllid control is still
important for this approach. When a single or a few branches on a tree are infected with HLB, the tree
can survive and be productive for some time, provided the rate of spread of HLB to the non-infected
branches is significantly reduced. Control of the psyllids keeps the infection rate down and enhances
the chances that this outcome will occur.2
4
Given the progress in controlling psyllid populations and HLB, planting activity is occurring.
In some areas, new plantings are primarily in solid blocks, including replanting of some acreage
previously lost under the canker eradication program. Trees are being planted in areas where HLB
infection rates are relatively low, as well as some other areas with higher infection rates but with
effective control of psyllid populations. In addition to solid-set plantings, resetting of trees is
occurring in some areas of the State where there has been success in suppressing the psyllid.
Alternative land uses are limited in many areas, particularly with the relatively weak real estate
market, and keeping land in citrus production is still the best use of that land in these areas.
The progress in control of psyllid populations discussed above has a major bearing on the
assumptions that underlie the citrus production projections of this report. The advances in grove care
practices suggest more optimistic assumptions compared to some of the assumptions made in previous
reports. Given better control of psyllid populations and reduced HLB infection rates in many areas,
and the likelihood that more areas may eventually have similar success, the projections in this report
are based on more moderate tree loss and higher planting rates than assumed in some of the scenarios
considered in previous reports.
Overview of the 2010 Commercial Citrus Inventory
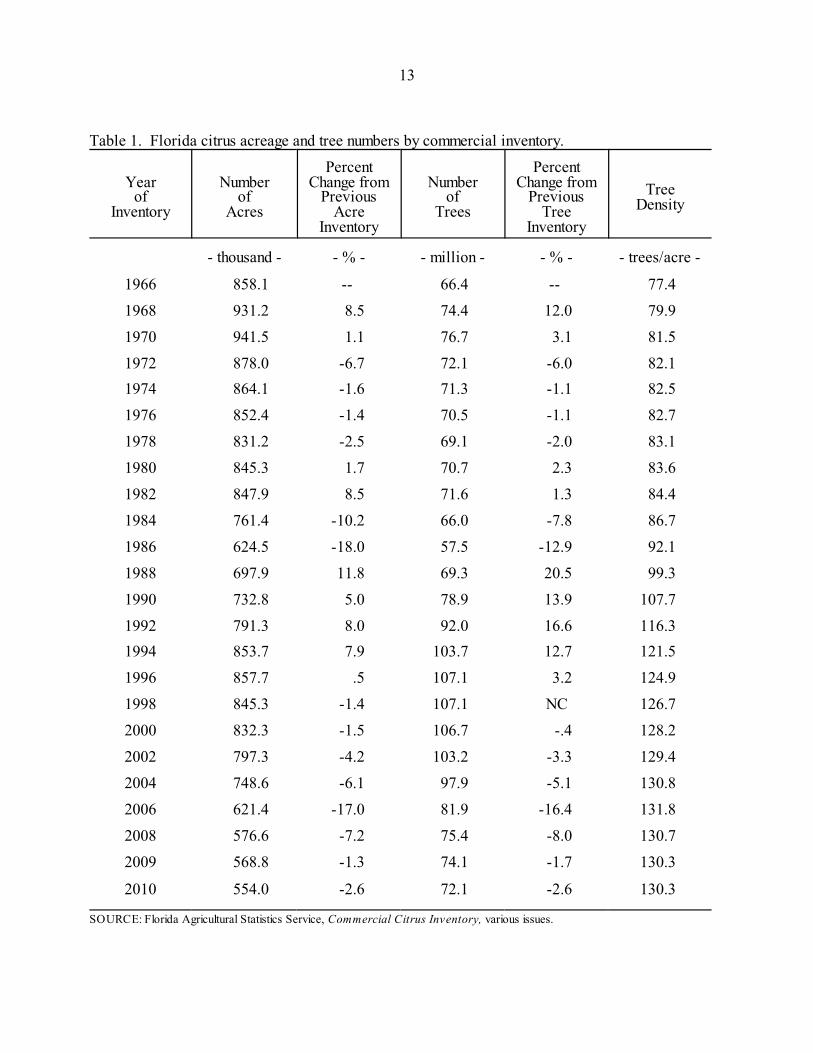
The 2010 Commercial Citrus Inventory shows that Florida’s total citrus acreage decreased by
2.6% from 568.8 thousand acres in 2009 to 554.0 thousand acres in 2010 (Table 1). Similarly, the
number of citrus trees decreased by 2.6% from 74.1 million in 2009 to72.1 million in 2010. Tree
density in 2009 and 2010 was constant at 130.3 tree per acre. Acreage and tree inventory data for
5
These projections are based on separate estimates for early and midseason oranges, late oranges, white3
seedless grapefruit including a small amount of seedy grapefruit, red and pink seedless grapefruit, tangelos and
tangerines.
individual varieties of citrus—round oranges, grapefruit and specialty citrus—are shown in Tables 2,
3 and 4, respectively.
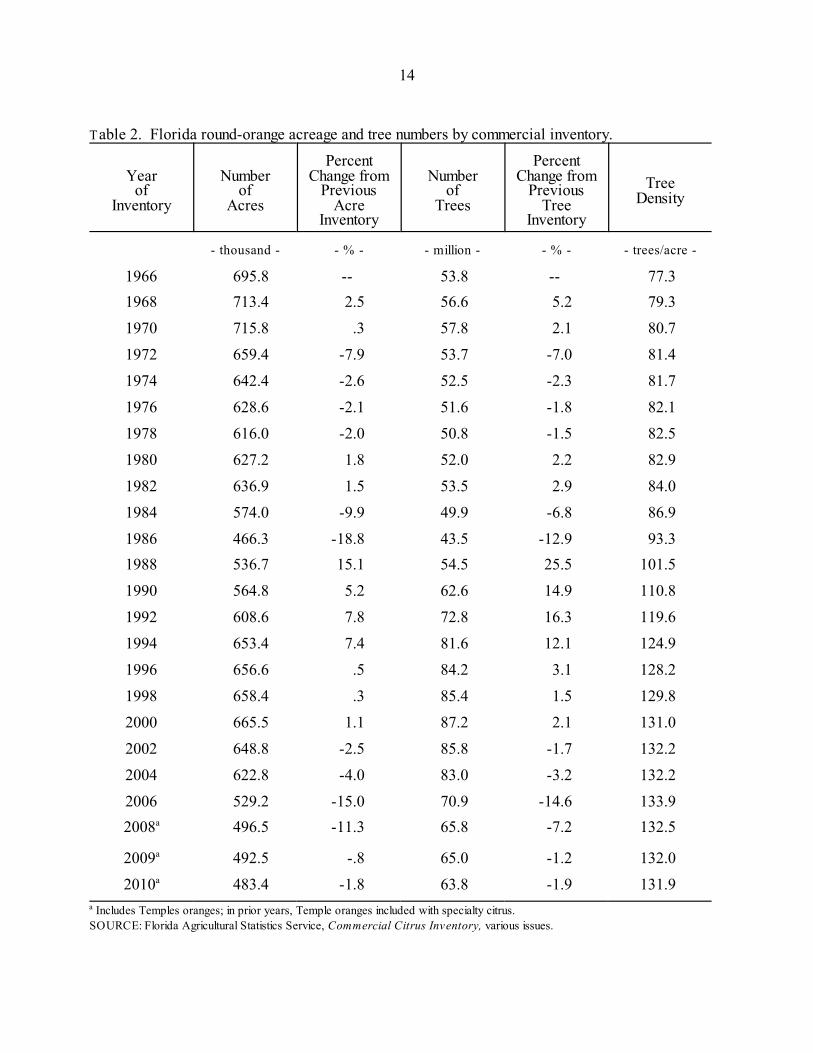
The FASS commercial citrus inventory indicates that the population of bearing and nonbearing
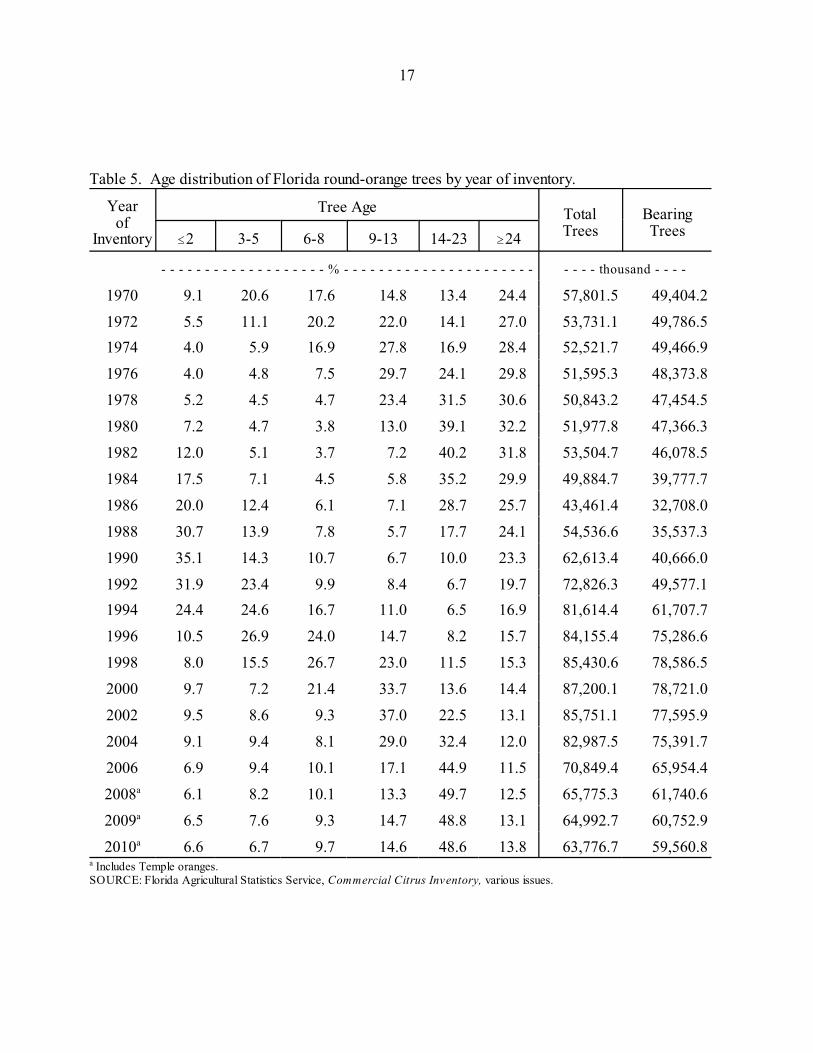
round-orange trees decreased by 1.9% from 65.0 million in 2009 to 63.8 million in 2010. As indicated
in Table 5, the orange tree population has become relatively mature compared to the decade following
the 1980s freezes when planting levels were high. The orange tree population may continue to mature
in the upcoming years, depending on planting levels, as well as loss rates across tree ages.
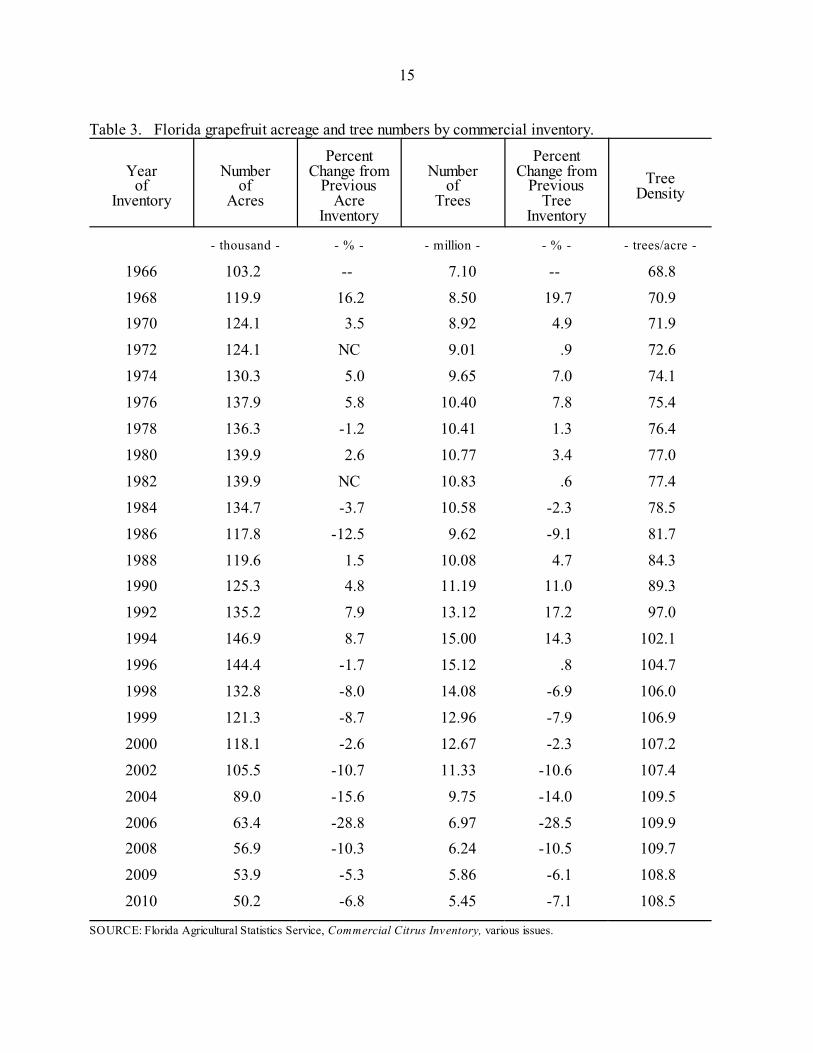
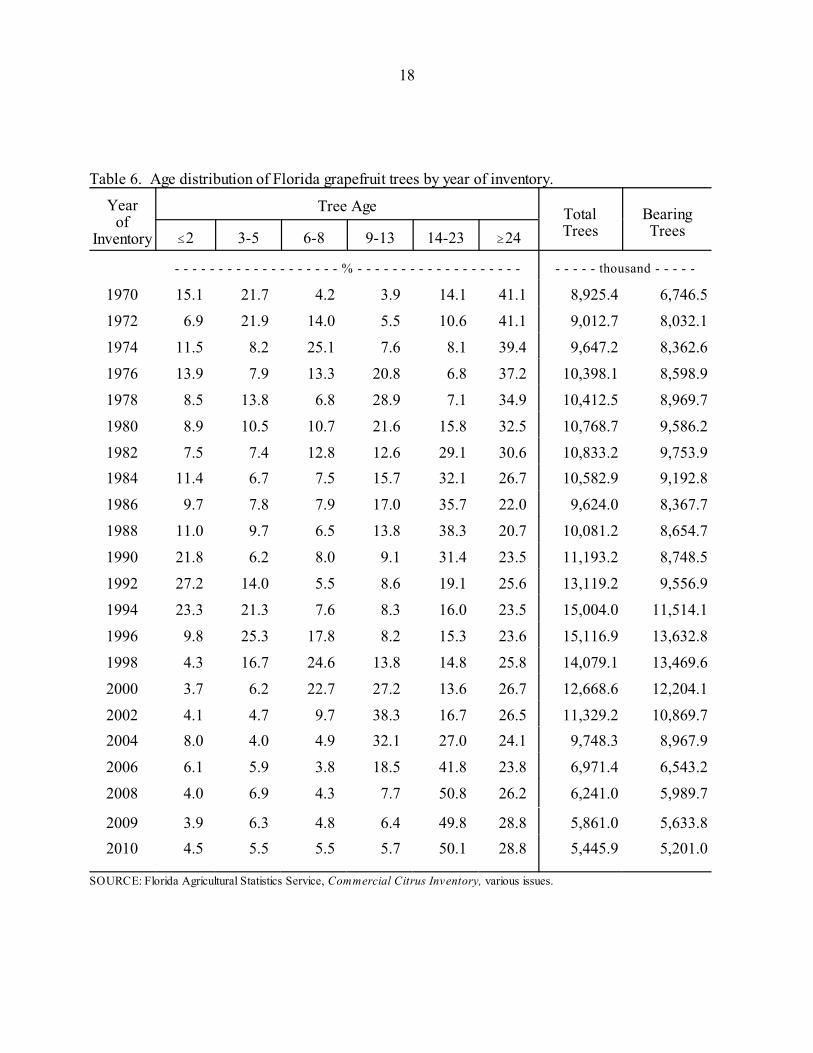
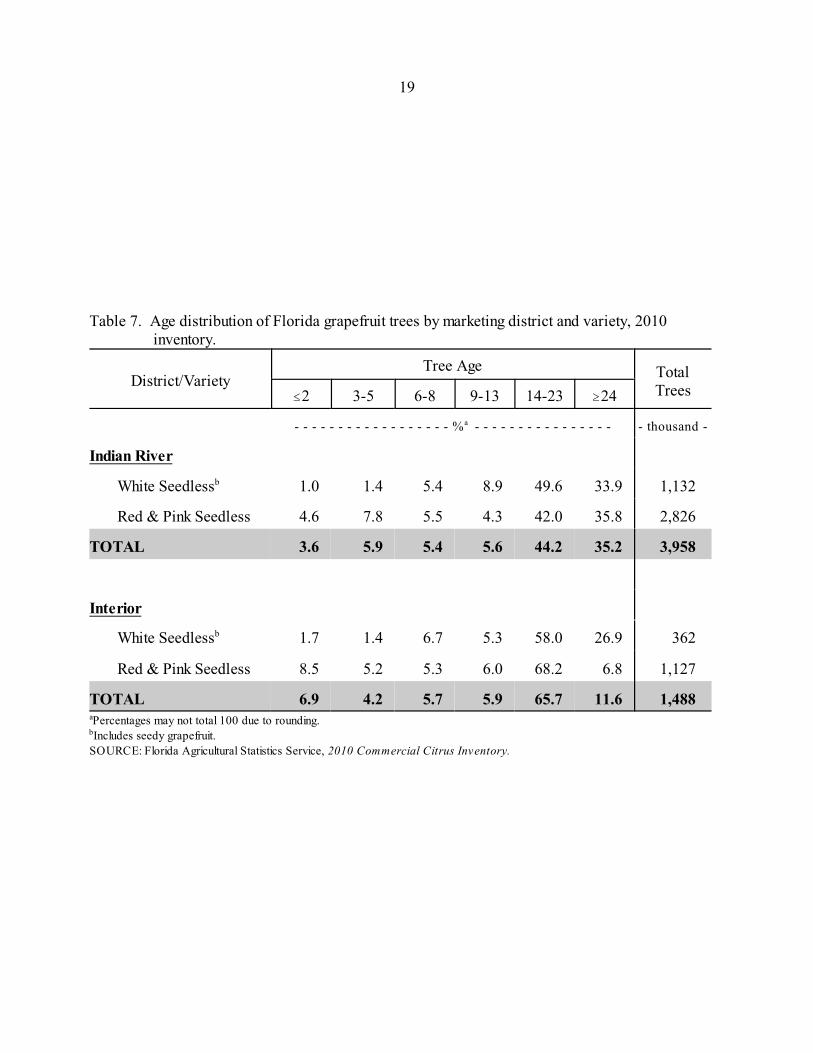
The total number of bearing and nonbearing grapefruit trees decreased 7.1% from 5.9 million
in 2009 to 5.5 million in 2010. The 2010 grapefruit tree population is also relatively mature (Table
6). The age distribution for grapefruit trees by variety and by Indian River versus Interior regions is
shown in Table 7.
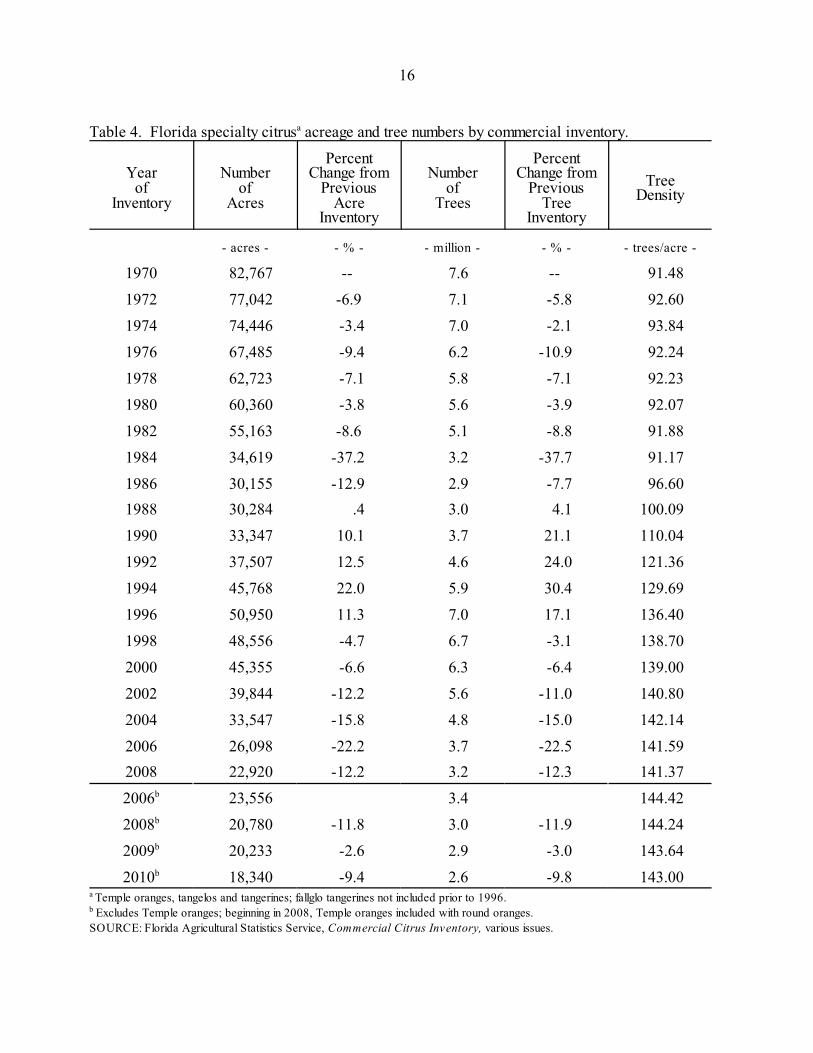
The 2010 inventory indicates that the number of specialty citrus (tangelos and tangerines) acres
and trees decreased by 9.4% and 9.8%, respectively, from 2009 to 2010. Like oranges and grapefruit,
the specialty tree population is relatively mature (Table 8).
Methodology and Assumptions
The production estimates discussed in this report are based on projecting the acreage in 25
tree-age categories for the upcoming ten seasons, by variety. Projections are reported for oranges,
grapefruit, and specialty citrus. Assumed annual acreage loss and planting rates are used to project3
6
citrus acreage from year to year, and average yields per acre by tree age are applied to the projected
acreage to obtain production estimates. Yields by age of tree are not reported for specialty citrus
(tangelos and tangerines), and regression equations relating historical specialty citrus production to
acreage by age were used to project production in this case.
Planting Assumptions
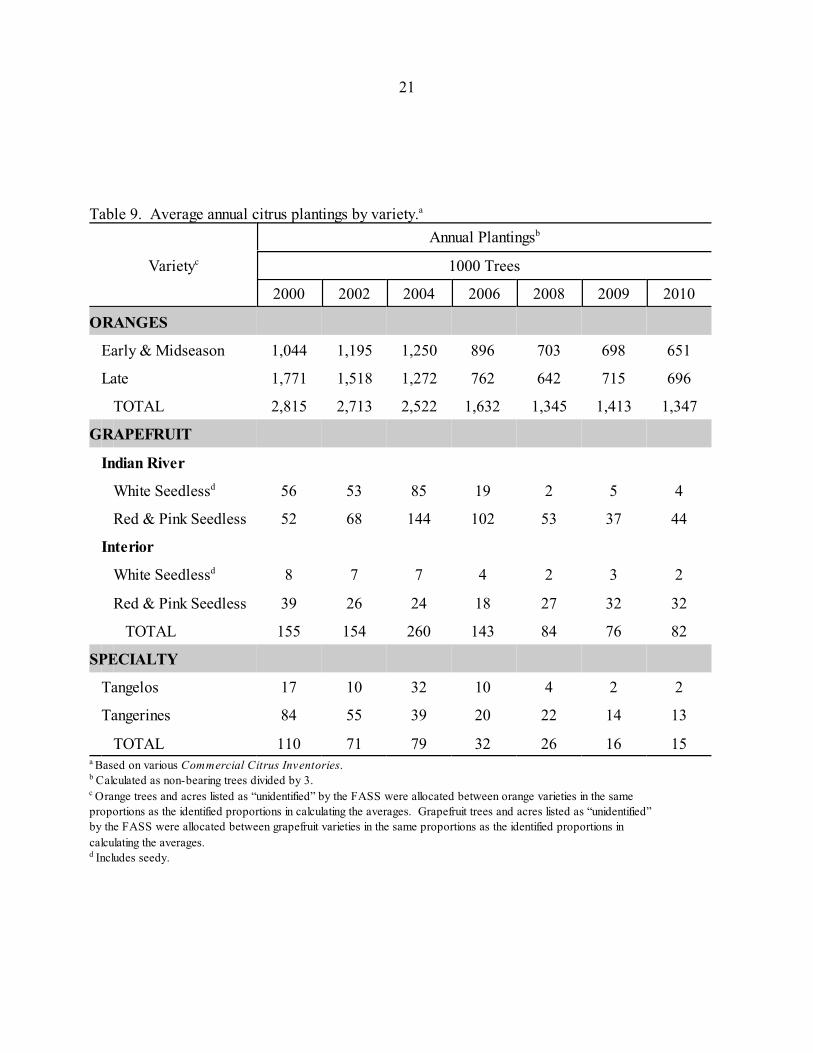
The projections are dependent on assumed future acreage-planting rates. Average planting
levels by variety, based on the commercial citrus inventories, are shown in Table 9. Significant
declines in planting levels have occurred in recent years with the destruction of nursery trees exposed
to citrus canker, re-establishment of the nursery industry in screen houses, and the risk of planting in
an HLB environment. In past reports, citrus prices have been important factors in projecting planting
levels, but, recently, the risk of losing new plantings to HLB appears to have become a primary factor
underlying many grower planting decisions. Thus, the planting assumptions for the scenarios
considered here are not directly linked to prices. Higher prices, though, can be expected with lower
production resulting from HLB (demand constant), supporting the higher planting assumptions made.
Three planting scenarios are considered in this report. The first scenario assumes the planting
level will be half the replacement level (the number of trees lost). This assumption roughly
corresponds to the average planting level in recent years. The second and third scenarios assume
planting levels are higher at three-fourths and 100% of the replacement level, respectively. It is
assumed nurseries will be able to supply the trees required, although the current number of nursery
trees in inventory may not be sufficient to accommodate some of the high-planting scenarios in the
immediate upcoming years. These scenarios, thus, require that nurseries respond relatively quickly
to grower demand for trees.
7
Tree/Acre-Loss Assumptions
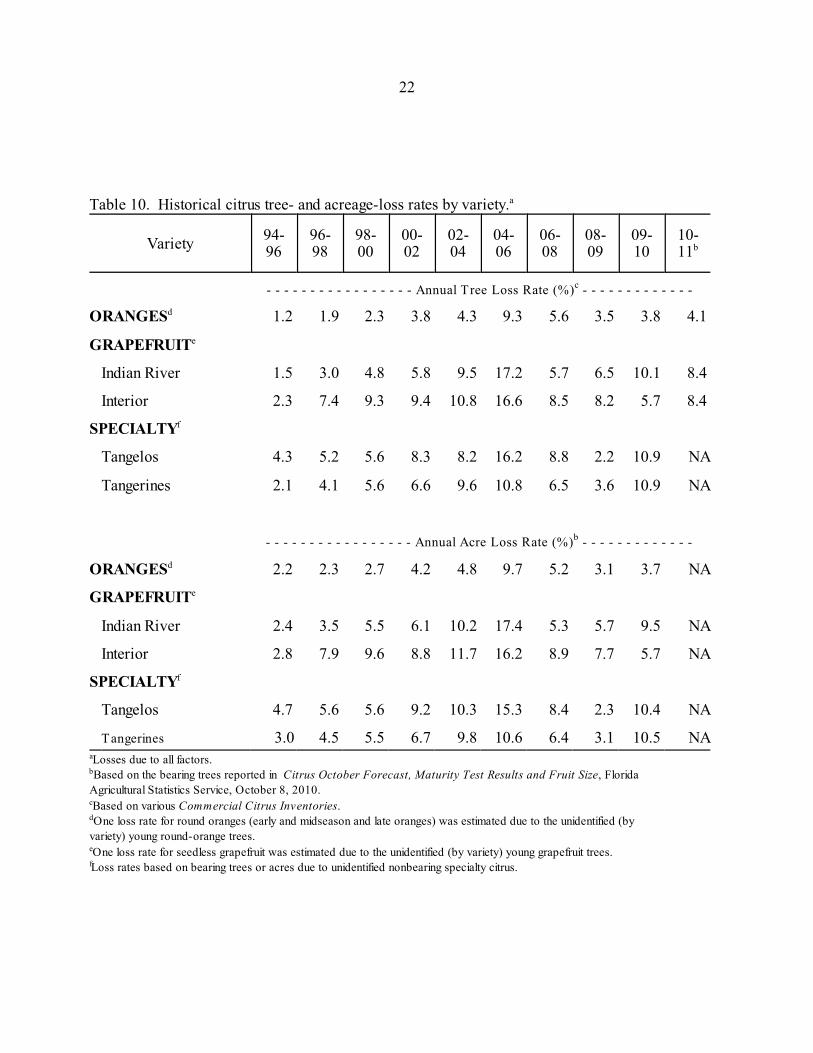
Acreage- and tree-loss rates have declined since the high loss rates that occurred during the
first half of the last decade (Table 10). Major factors underlying the high loss rates included diseases,
the canker eradication program, the hurricanes that struck the citrus-growing regions of Florida during
that period, and alternative land uses and real estate development.
Three orange loss-rate assumptions are considered here: 1) future loss rates are relatively
moderate as occurred in the last few years, 2) loss rates are 50% higher than the recent rates, and 3)
loss rates are double recent rates. The different assumptions are intended to account for loss-rate
uncertainty, given the HLB situation. With relatively wide use of nutritional programs to deal with
HLB, the loss of HLB-positive trees may be relatively low in immediate upcoming years, but at some
point in time the HLB infection rate in groves under such programs may increase significantly making
those groves economically unviable. At that point, trees may be pushed and the groves may be
replanted, provided prices are sufficient to cover costs.
Loss rates are assumed to be lowest for young trees, highest for middle-age trees and more
moderate for older trees as indicated in the footnotes of the tables showing the projections.
Yield Assumptions
The production estimates were made by multiplying the projected number of acres in each
specific age category by the yield or number of boxes per acre for that age category and summing the
results across age categories. Average yields over the 2007-08 through 2009-10 period were assumed
for all projections. These yields were applied to acreage that was not affected by citrus canker. For
acreage with citrus canker, yields were reduced by10.0% for early and midseason oranges, 5.0% for
8
Valencia oranges, and 20.0% for grapefruit. A history of tree yields reported by FASS are shown in
Tables 11 and 12.
Production Estimates
The orange and grapefruit production projections are shown in Tables 13 and 14. The table
footnotes describe assumptions. The low tree loss scenarios suggest production levels may be
moderately declining to somewhat flat over the next ten years. A key assumption is that groves under
nutritional programs will largely be kept in production. The higher loss rate scenarios, provided to
account for the uncertainty of the latter assumption, indicate the possibility of more severe production
declines.
It is difficult to attach probabilities to the different orange and grapefruit production scenarios
in Tables 13 and 14, but the relatively low-acreage-loss scenarios (first set of three scenarios on the
left-hand-side of the tables) may have the highest probability of occurrence to the extent psyllid
populations and HLB can be controlled, planting activity increases and nutritional programs are
effective. Progress in dealing with production problems along with decisions being made by many
growers to invest in new plantings support the more optimistic scenarios.
Projections for specialty citrus, under the assumption of moderate losses and replacement
planting levels, are shown in Table 15. The projection trends for specialty citrus are similar to those
for oranges and grapefruit based on the same assumptions.
9
Conclusions
Citrus greening as well as canker pose major threats to Florida citrus production. Although
it is difficult to predict their impact on production in the next ten years, there are positive signs
suggesting that Florida citrus production can be maintained at a viable level. Psyllid populations are
being better controlled in many areas, and plantings are occurring. Grower coordination through
CHMAs of large-scale spray programs to suppress psyllids is occurring. Based on this report’s
scenarios that attempt to take these developments into account, Florida orange production is projected
to be relatively flat to moderately declining over the next ten years. Further into the future, there is
hope of developing HLB-resistant trees which would be expected to have significant positive impacts
on Florida citrus production levels, and costs and returns.

10
TABLES

12
13
Table 1. Florida citrus acreage and tree numbers by commercial inventory.
Yearof
Inventory
Numberof
Acres
PercentChange from
PreviousAcre
Inventory
Numberof
Trees
PercentChange from
PreviousTree
Inventory
TreeDensity
- thousand - - % - - million - - % - - trees/acre -
1966 858.1 -- 66.4 -- 77.4
1968 931.2 8.5 74.4 12.0 79.9
1970 941.5 1.1 76.7 3.1 81.5
1972 878.0 -6.7 72.1 -6.0 82.1
1974 864.1 -1.6 71.3 -1.1 82.5
1976 852.4 -1.4 70.5 -1.1 82.7
1978 831.2 -2.5 69.1 -2.0 83.1
1980 845.3 1.7 70.7 2.3 83.6
1982 847.9 8.5 71.6 1.3 84.4
1984 761.4 -10.2 66.0 -7.8 86.7
1986 624.5 -18.0 57.5 -12.9 92.1
1988 697.9 11.8 69.3 20.5 99.3
1990 732.8 5.0 78.9 13.9 107.7
1992 791.3 8.0 92.0 16.6 116.3
1994 853.7 7.9 103.7 12.7 121.5
1996 857.7 .5 107.1 3.2 124.9
1998 845.3 -1.4 107.1 NC 126.7
2000 832.3 -1.5 106.7 -.4 128.2
2002 797.3 -4.2 103.2 -3.3 129.4
2004 748.6 -6.1 97.9 -5.1 130.8
2006 621.4 -17.0 81.9 -16.4 131.8
2008 576.6 -7.2 75.4 -8.0 130.7
2009 568.8 -1.3 74.1 -1.7 130.3
2010 554.0 -2.6 72.1 -2.6 130.3
SOURCE: Florida Agricultural Statistics Service, Commercial Citrus Inventory, various issues.
14
Table 2. Florida round-orange acreage and tree numbers by commercial inventory.
Yearof
Inventory
Numberof
Acres
PercentChange from
PreviousAcre
Inventory
Numberof
Trees
PercentChange from
PreviousTree
Inventory
TreeDensity
- thousand - - % - - million - - % - - trees/acre -
1966 695.8 -- 53.8 -- 77.3
1968 713.4 2.5 56.6 5.2 79.3
1970 715.8 .3 57.8 2.1 80.7
1972 659.4 -7.9 53.7 -7.0 81.4
1974 642.4 -2.6 52.5 -2.3 81.7
1976 628.6 -2.1 51.6 -1.8 82.1
1978 616.0 -2.0 50.8 -1.5 82.5
1980 627.2 1.8 52.0 2.2 82.9
1982 636.9 1.5 53.5 2.9 84.0
1984 574.0 -9.9 49.9 -6.8 86.9
1986 466.3 -18.8 43.5 -12.9 93.3
1988 536.7 15.1 54.5 25.5 101.5
1990 564.8 5.2 62.6 14.9 110.8
1992 608.6 7.8 72.8 16.3 119.6
1994 653.4 7.4 81.6 12.1 124.9
1996 656.6 .5 84.2 3.1 128.2
1998 658.4 .3 85.4 1.5 129.8
2000 665.5 1.1 87.2 2.1 131.0
2002 648.8 -2.5 85.8 -1.7 132.2
2004 622.8 -4.0 83.0 -3.2 132.2
2006 529.2 -15.0 70.9 -14.6 133.9
2008 496.5 -11.3 65.8 -7.2 132.5a
2009 492.5 -.8 65.0 -1.2 132.0a
2010 483.4 -1.8 63.8 -1.9 131.9a
Includes Temples oranges; in prior years, Temple oranges included with specialty citrus.a
SOURCE: Florida Agricultural Statistics Service, Commercial Citrus Inventory, various issues.
15
Table 3. Florida grapefruit acreage and tree numbers by commercial inventory.
Yearof
Inventory
Numberof
Acres
PercentChange from
PreviousAcre
Inventory
Numberof
Trees
PercentChange from
PreviousTree
Inventory
TreeDensity
- thousand - - % - - million - - % - - trees/acre -
1966 103.2 -- 7.10 -- 68.8
1968 119.9 16.2 8.50 19.7 70.9
1970 124.1 3.5 8.92 4.9 71.9
1972 124.1 NC 9.01 .9 72.6
1974 130.3 5.0 9.65 7.0 74.1
1976 137.9 5.8 10.40 7.8 75.4
1978 136.3 -1.2 10.41 1.3 76.4
1980 139.9 2.6 10.77 3.4 77.0
1982 139.9 NC 10.83 .6 77.4
1984 134.7 -3.7 10.58 -2.3 78.5
1986 117.8 -12.5 9.62 -9.1 81.7
1988 119.6 1.5 10.08 4.7 84.3
1990 125.3 4.8 11.19 11.0 89.3
1992 135.2 7.9 13.12 17.2 97.0
1994 146.9 8.7 15.00 14.3 102.1
1996 144.4 -1.7 15.12 .8 104.7
1998 132.8 -8.0 14.08 -6.9 106.0
1999 121.3 -8.7 12.96 -7.9 106.9
2000 118.1 -2.6 12.67 -2.3 107.2
2002 105.5 -10.7 11.33 -10.6 107.4
2004 89.0 -15.6 9.75 -14.0 109.5
2006 63.4 -28.8 6.97 -28.5 109.9
2008 56.9 -10.3 6.24 -10.5 109.7
2009 53.9 -5.3 5.86 -6.1 108.8
2010 50.2 -6.8 5.45 -7.1 108.5
SOURCE: Florida Agricultural Statistics Service, Commercial Citrus Inventory, various issues.
16
Table 4. Florida specialty citrus acreage and tree numbers by commercial inventory.a
Yearof
Inventory
Numberof
Acres
PercentChange from
PreviousAcre
Inventory
Numberof
Trees
PercentChange from
PreviousTree
Inventory
TreeDensity
- acres - - % - - million - - % - - trees/acre -
1970 82,767 -- 7.6 -- 91.48
1972 77,042 -6.9 7.1 -5.8 92.60
1974 74,446 -3.4 7.0 -2.1 93.84
1976 67,485 -9.4 6.2 -10.9 92.24
1978 62,723 -7.1 5.8 -7.1 92.23
1980 60,360 -3.8 5.6 -3.9 92.07
1982 55,163 -8.6 5.1 -8.8 91.88
1984 34,619 -37.2 3.2 -37.7 91.17
1986 30,155 -12.9 2.9 -7.7 96.60
1988 30,284 .4 3.0 4.1 100.09
1990 33,347 10.1 3.7 21.1 110.04
1992 37,507 12.5 4.6 24.0 121.36
1994 45,768 22.0 5.9 30.4 129.69
1996 50,950 11.3 7.0 17.1 136.40
1998 48,556 -4.7 6.7 -3.1 138.70
2000 45,355 -6.6 6.3 -6.4 139.00
2002 39,844 -12.2 5.6 -11.0 140.80
2004 33,547 -15.8 4.8 -15.0 142.14
2006 26,098 -22.2 3.7 -22.5 141.59
2008 22,920 -12.2 3.2 -12.3 141.37
2006 23,556 3.4 144.42b
2008 20,780 -11.8 3.0 -11.9 144.24b
2009 20,233 -2.6 2.9 -3.0 143.64b
2010 18,340 -9.4 2.6 -9.8 143.00b
Temple oranges, tangelos and tangerines; fallglo tangerines not included prior to 1996.a
Excludes Temple oranges; beginning in 2008, Temple oranges included with round oranges.b
SOURCE: Florida Agricultural Statistics Service, Commercial Citrus Inventory, various issues.
17
Table 5. Age distribution of Florida round-orange trees by year of inventory.
Yearof
Inventory
Tree Age TotalTrees
BearingTrees#2 3-5 6-8 9-13 14-23 $24
- - - - - - - - - - - - - - - - - - - % - - - - - - - - - - - - - - - - - - - - - - - - - - thousand - - - -
1970 9.1 20.6 17.6 14.8 13.4 24.4 57,801.5 49,404.2
1972 5.5 11.1 20.2 22.0 14.1 27.0 53,731.1 49,786.5
1974 4.0 5.9 16.9 27.8 16.9 28.4 52,521.7 49,466.9
1976 4.0 4.8 7.5 29.7 24.1 29.8 51,595.3 48,373.8
1978 5.2 4.5 4.7 23.4 31.5 30.6 50,843.2 47,454.5
1980 7.2 4.7 3.8 13.0 39.1 32.2 51,977.8 47,366.3
1982 12.0 5.1 3.7 7.2 40.2 31.8 53,504.7 46,078.5
1984 17.5 7.1 4.5 5.8 35.2 29.9 49,884.7 39,777.7
1986 20.0 12.4 6.1 7.1 28.7 25.7 43,461.4 32,708.0
1988 30.7 13.9 7.8 5.7 17.7 24.1 54,536.6 35,537.3
1990 35.1 14.3 10.7 6.7 10.0 23.3 62,613.4 40,666.0
1992 31.9 23.4 9.9 8.4 6.7 19.7 72,826.3 49,577.1
1994 24.4 24.6 16.7 11.0 6.5 16.9 81,614.4 61,707.7
1996 10.5 26.9 24.0 14.7 8.2 15.7 84,155.4 75,286.6
1998 8.0 15.5 26.7 23.0 11.5 15.3 85,430.6 78,586.5
2000 9.7 7.2 21.4 33.7 13.6 14.4 87,200.1 78,721.0
2002 9.5 8.6 9.3 37.0 22.5 13.1 85,751.1 77,595.9
2004 9.1 9.4 8.1 29.0 32.4 12.0 82,987.5 75,391.7
2006 6.9 9.4 10.1 17.1 44.9 11.5 70,849.4 65,954.4
2008 6.1 8.2 10.1 13.3 49.7 12.5 65,775.3 61,740.6a
2009 6.5 7.6 9.3 14.7 48.8 13.1 64,992.7 60,752.9a
2010 6.6 6.7 9.7 14.6 48.6 13.8 63,776.7 59,560.8a
Includes Temple oranges.a
SOURCE: Florida Agricultural Statistics Service, Commercial Citrus Inventory, various issues.
18
Table 6. Age distribution of Florida grapefruit trees by year of inventory.
Yearof
Inventory
Tree Age TotalTrees
BearingTrees#2 3-5 6-8 9-13 14-23 $24
- - - - - - - - - - - - - - - - - - - % - - - - - - - - - - - - - - - - - - - - - - - - thousand - - - - -
1970 15.1 21.7 4.2 3.9 14.1 41.1 8,925.4 6,746.5
1972 6.9 21.9 14.0 5.5 10.6 41.1 9,012.7 8,032.1
1974 11.5 8.2 25.1 7.6 8.1 39.4 9,647.2 8,362.6
1976 13.9 7.9 13.3 20.8 6.8 37.2 10,398.1 8,598.9
1978 8.5 13.8 6.8 28.9 7.1 34.9 10,412.5 8,969.7
1980 8.9 10.5 10.7 21.6 15.8 32.5 10,768.7 9,586.2
1982 7.5 7.4 12.8 12.6 29.1 30.6 10,833.2 9,753.9
1984 11.4 6.7 7.5 15.7 32.1 26.7 10,582.9 9,192.8
1986 9.7 7.8 7.9 17.0 35.7 22.0 9,624.0 8,367.7
1988 11.0 9.7 6.5 13.8 38.3 20.7 10,081.2 8,654.7
1990 21.8 6.2 8.0 9.1 31.4 23.5 11,193.2 8,748.5
1992 27.2 14.0 5.5 8.6 19.1 25.6 13,119.2 9,556.9
1994 23.3 21.3 7.6 8.3 16.0 23.5 15,004.0 11,514.1
1996 9.8 25.3 17.8 8.2 15.3 23.6 15,116.9 13,632.8
1998 4.3 16.7 24.6 13.8 14.8 25.8 14,079.1 13,469.6
2000 3.7 6.2 22.7 27.2 13.6 26.7 12,668.6 12,204.1
2002 4.1 4.7 9.7 38.3 16.7 26.5 11,329.2 10,869.7
2004 8.0 4.0 4.9 32.1 27.0 24.1 9,748.3 8,967.9
2006 6.1 5.9 3.8 18.5 41.8 23.8 6,971.4 6,543.2
2008 4.0 6.9 4.3 7.7 50.8 26.2 6,241.0 5,989.7
2009 3.9 6.3 4.8 6.4 49.8 28.8 5,861.0 5,633.8
2010 4.5 5.5 5.5 5.7 50.1 28.8 5,445.9 5,201.0
SOURCE: Florida Agricultural Statistics Service, Commercial Citrus Inventory, various issues.
19
Table 7. Age distribution of Florida grapefruit trees by marketing district and variety, 2010 inventory.
District/VarietyTree Age Total
Trees#2 3-5 6-8 9-13 14-23 $24
- - - - - - - - - - - - - - - - - - % - - - - - - - - - - - - - - - - - thousand -a
Indian River
White Seedless 1.0 1.4 5.4 8.9 49.6 33.9 1,132b
Red & Pink Seedless 4.6 7.8 5.5 4.3 42.0 35.8 2,826
TOTAL 3.6 5.9 5.4 5.6 44.2 35.2 3,958
Interior
White Seedless 1.7 1.4 6.7 5.3 58.0 26.9 362b
Red & Pink Seedless 8.5 5.2 5.3 6.0 68.2 6.8 1,127
TOTAL 6.9 4.2 5.7 5.9 65.7 11.6 1,488Percentages may not total 100 due to rounding.a
Includes seedy grapefruit.b
SOURCE: Florida Agricultural Statistics Service, 2010 Commercial Citrus Inventory.

20
Table 8. Age distribution of Florida specialty citrus trees by variety, 2010 inventory.
Variety
Tree AgeTotalTrees
#2 3-5 6-8 9-13 14-23 $24
- - - - - - - - - - - - - - - - - - - - - - - - % - - - - - - - - - - - - - - - - - - - - - - - thousand -
Tangelos .9 4.4 6.3 9.6 64.2 14.7 598.2
Tangerines 1.9 3.3 4.1 13.7 69.7 7.3 2,024.4
TOTAL 1.7 3.5 4.6 12.8 68.5 8.9 2,622.6
SOURCE: Florida Agricultural Statistics Service, 2010 Commercial Citrus Inventory.
21
Table 9. Average annual citrus plantings by variety.a
Varietyc
Annual Plantingsb
1000 Trees
2000 2002 2004 2006 2008 2009 2010
ORANGES
Early & Midseason 1,044 1,195 1,250 896 703 698 651
Late 1,771 1,518 1,272 762 642 715 696
TOTAL 2,815 2,713 2,522 1,632 1,345 1,413 1,347
GRAPEFRUIT
Indian River
White Seedless 56 53 85 19 2 5 4d
Red & Pink Seedless 52 68 144 102 53 37 44
Interior
White Seedless 8 7 7 4 2 3 2d
Red & Pink Seedless 39 26 24 18 27 32 32
TOTAL 155 154 260 143 84 76 82
SPECIALTY
Tangelos 17 10 32 10 4 2 2
Tangerines 84 55 39 20 22 14 13
TOTAL 110 71 79 32 26 16 15Based on various Commercial Citrus Inventories.a
Calculated as non-bearing trees divided by 3.b
Orange trees and acres listed as “unidentified” by the FASS were allocated between orange varieties in the samec
proportions as the identified proportions in calculating the averages. Grapefruit trees and acres listed as “unidentified”
by the FASS were allocated between grapefruit varieties in the same proportions as the identified proportions in
calculating the averages.
Includes seedy.d
22
Table 10. Historical citrus tree- and acreage-loss rates by variety.a
Variety94-96
96-98
98-00
00-02
02-04
04-06
06-08
08-09
09-10
10-11b
- - - - - - - - - - - - - - - - - Annual Tree Loss Rate (%) - - - - - - - - - - - - - c
ORANGES 1.2 1.9 2.3 3.8 4.3 9.3 5.6 3.5 3.8 4.1d
GRAPEFRUITe
Indian River 1.5 3.0 4.8 5.8 9.5 17.2 5.7 6.5 10.1 8.4
Interior 2.3 7.4 9.3 9.4 10.8 16.6 8.5 8.2 5.7 8.4
SPECIALTYf
Tangelos 4.3 5.2 5.6 8.3 8.2 16.2 8.8 2.2 10.9 NA
Tangerines 2.1 4.1 5.6 6.6 9.6 10.8 6.5 3.6 10.9 NA
- - - - - - - - - - - - - - - - - Annual Acre Loss Rate (%) - - - - - - - - - - - - - b
ORANGES 2.2 2.3 2.7 4.2 4.8 9.7 5.2 3.1 3.7 NAd
GRAPEFRUITe
Indian River 2.4 3.5 5.5 6.1 10.2 17.4 5.3 5.7 9.5 NA
Interior 2.8 7.9 9.6 8.8 11.7 16.2 8.9 7.7 5.7 NA
SPECIALTYf
Tangelos 4.7 5.6 5.6 9.2 10.3 15.3 8.4 2.3 10.4 NA
Tangerines 3.0 4.5 5.5 6.7 9.8 10.6 6.4 3.1 10.5 NA
Losses due to all factors.a
Based on the bearing trees reported in Citrus October Forecast, Maturity Test Results and Fruit Size, Floridab
Agricultural Statistics Service, October 8, 2010.
Based on various Commercial Citrus Inventories. c
One loss rate for round oranges (early and midseason and late oranges) was estimated due to the unidentified (byd
variety) young round-orange trees.
One loss rate for seedless grapefruit was estimated due to the unidentified (by variety) young grapefruit trees.e
Loss rates based on bearing trees or acres due to unidentified nonbearing specialty citrus.f
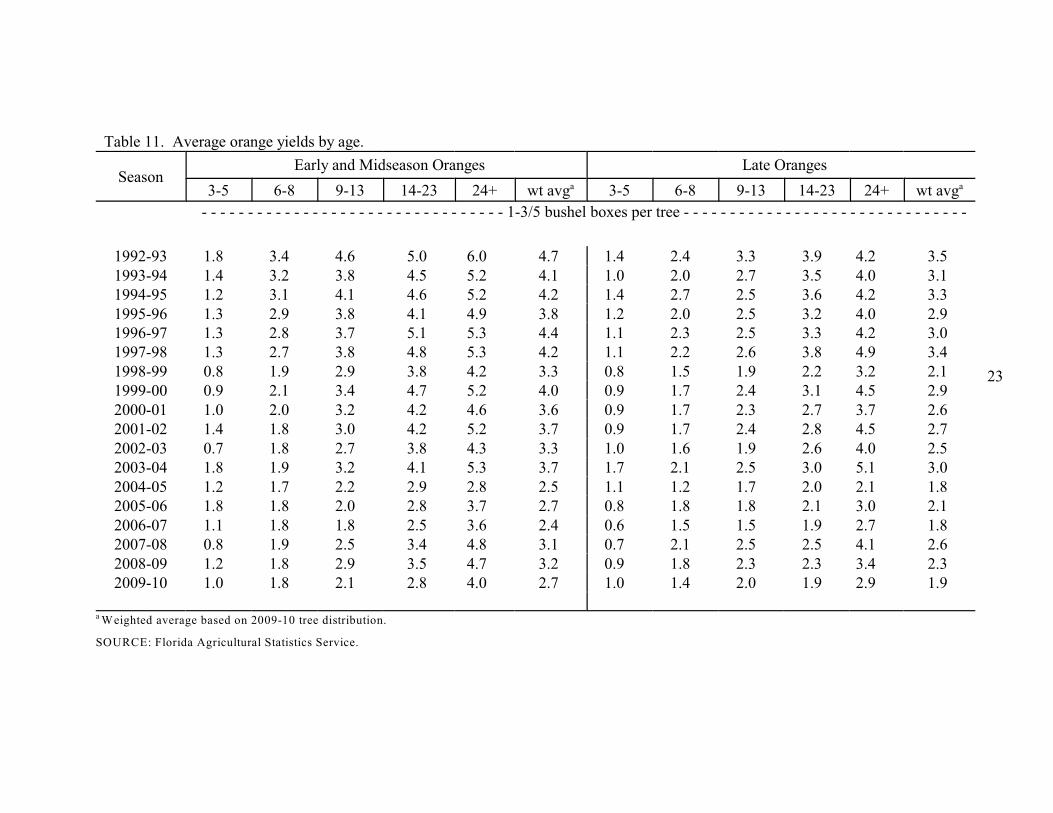
Table 11. Average orange yields by age.
SeasonEarly and Midseason Oranges Late Oranges
3-5 6-8 9-13 14-23 24+ wt avg 3-5 6-8 9-13 14-23 24+ wt avga a
- - - - - - - - - - - - - - - - - - - - - - - - - - - - - - - - - 1-3/5 bushel boxes per tree - - - - - - - - - - - - - - - - - - - - - - - - - - - - - - -
1992-93 1.8 3.4 4.6 5.0 6.0 4.7 1.4 2.4 3.3 3.9 4.2 3.51993-94 1.4 3.2 3.8 4.5 5.2 4.1 1.0 2.0 2.7 3.5 4.0 3.11994-95 1.2 3.1 4.1 4.6 5.2 4.2 1.4 2.7 2.5 3.6 4.2 3.31995-96 1.3 2.9 3.8 4.1 4.9 3.8 1.2 2.0 2.5 3.2 4.0 2.91996-97 1.3 2.8 3.7 5.1 5.3 4.4 1.1 2.3 2.5 3.3 4.2 3.01997-98 1.3 2.7 3.8 4.8 5.3 4.2 1.1 2.2 2.6 3.8 4.9 3.41998-99 0.8 1.9 2.9 3.8 4.2 3.3 0.8 1.5 1.9 2.2 3.2 2.11999-00 0.9 2.1 3.4 4.7 5.2 4.0 0.9 1.7 2.4 3.1 4.5 2.92000-01 1.0 2.0 3.2 4.2 4.6 3.6 0.9 1.7 2.3 2.7 3.7 2.62001-02 1.4 1.8 3.0 4.2 5.2 3.7 0.9 1.7 2.4 2.8 4.5 2.72002-03 0.7 1.8 2.7 3.8 4.3 3.3 1.0 1.6 1.9 2.6 4.0 2.52003-04 1.8 1.9 3.2 4.1 5.3 3.7 1.7 2.1 2.5 3.0 5.1 3.02004-05 1.2 1.7 2.2 2.9 2.8 2.5 1.1 1.2 1.7 2.0 2.1 1.82005-06 1.8 1.8 2.0 2.8 3.7 2.7 0.8 1.8 1.8 2.1 3.0 2.12006-07 1.1 1.8 1.8 2.5 3.6 2.4 0.6 1.5 1.5 1.9 2.7 1.82007-08 0.8 1.9 2.5 3.4 4.8 3.1 0.7 2.1 2.5 2.5 4.1 2.62008-09 1.2 1.8 2.9 3.5 4.7 3.2 0.9 1.8 2.3 2.3 3.4 2.32009-10 1.0 1.8 2.1 2.8 4.0 2.7 1.0 1.4 2.0 1.9 2.9 1.9
Weighted average based on 2009-10 tree distribution.a
SOURCE: Florida Agricultural Statistics Service.
23
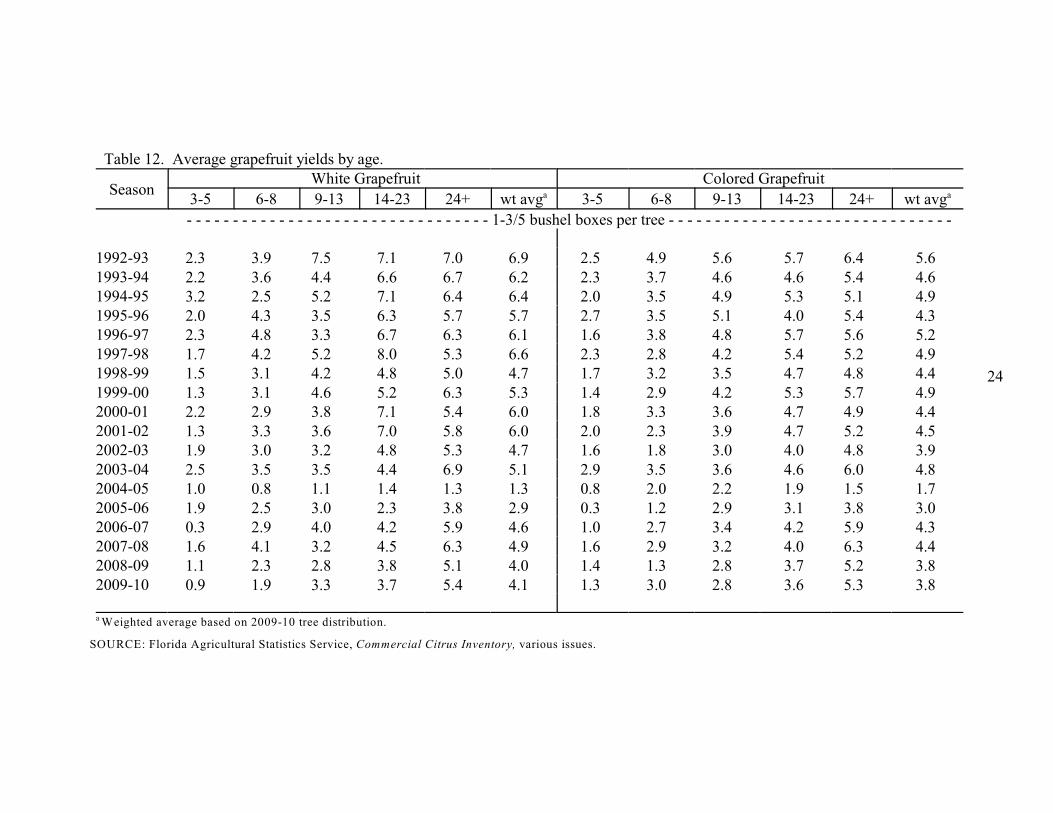
Table 12. Average grapefruit yields by age.
SeasonWhite Grapefruit Colored Grapefruit
3-5 6-8 9-13 14-23 24+ wt avg 3-5 6-8 9-13 14-23 24+ wt avga a
- - - - - - - - - - - - - - - - - - - - - - - - - - - - - - - - - 1-3/5 bushel boxes per tree - - - - - - - - - - - - - - - - - - - - - - - - - - - - - - -
1992-93 2.3 3.9 7.5 7.1 7.0 6.9 2.5 4.9 5.6 5.7 6.4 5.61993-94 2.2 3.6 4.4 6.6 6.7 6.2 2.3 3.7 4.6 4.6 5.4 4.61994-95 3.2 2.5 5.2 7.1 6.4 6.4 2.0 3.5 4.9 5.3 5.1 4.91995-96 2.0 4.3 3.5 6.3 5.7 5.7 2.7 3.5 5.1 4.0 5.4 4.31996-97 2.3 4.8 3.3 6.7 6.3 6.1 1.6 3.8 4.8 5.7 5.6 5.21997-98 1.7 4.2 5.2 8.0 5.3 6.6 2.3 2.8 4.2 5.4 5.2 4.91998-99 1.5 3.1 4.2 4.8 5.0 4.7 1.7 3.2 3.5 4.7 4.8 4.41999-00 1.3 3.1 4.6 5.2 6.3 5.3 1.4 2.9 4.2 5.3 5.7 4.92000-01 2.2 2.9 3.8 7.1 5.4 6.0 1.8 3.3 3.6 4.7 4.9 4.42001-02 1.3 3.3 3.6 7.0 5.8 6.0 2.0 2.3 3.9 4.7 5.2 4.52002-03 1.9 3.0 3.2 4.8 5.3 4.7 1.6 1.8 3.0 4.0 4.8 3.92003-04 2.5 3.5 3.5 4.4 6.9 5.1 2.9 3.5 3.6 4.6 6.0 4.82004-05 1.0 0.8 1.1 1.4 1.3 1.3 0.8 2.0 2.2 1.9 1.5 1.72005-06 1.9 2.5 3.0 2.3 3.8 2.9 0.3 1.2 2.9 3.1 3.8 3.02006-07 0.3 2.9 4.0 4.2 5.9 4.6 1.0 2.7 3.4 4.2 5.9 4.32007-08 1.6 4.1 3.2 4.5 6.3 4.9 1.6 2.9 3.2 4.0 6.3 4.42008-09 1.1 2.3 2.8 3.8 5.1 4.0 1.4 1.3 2.8 3.7 5.2 3.82009-10 0.9 1.9 3.3 3.7 5.4 4.1 1.3 3.0 2.8 3.6 5.3 3.8
Weighted average based on 2009-10 tree distribution.a
SOURCE: Florida Agricultural Statistics Service, Commercial Citrus Inventory, various issues.
24
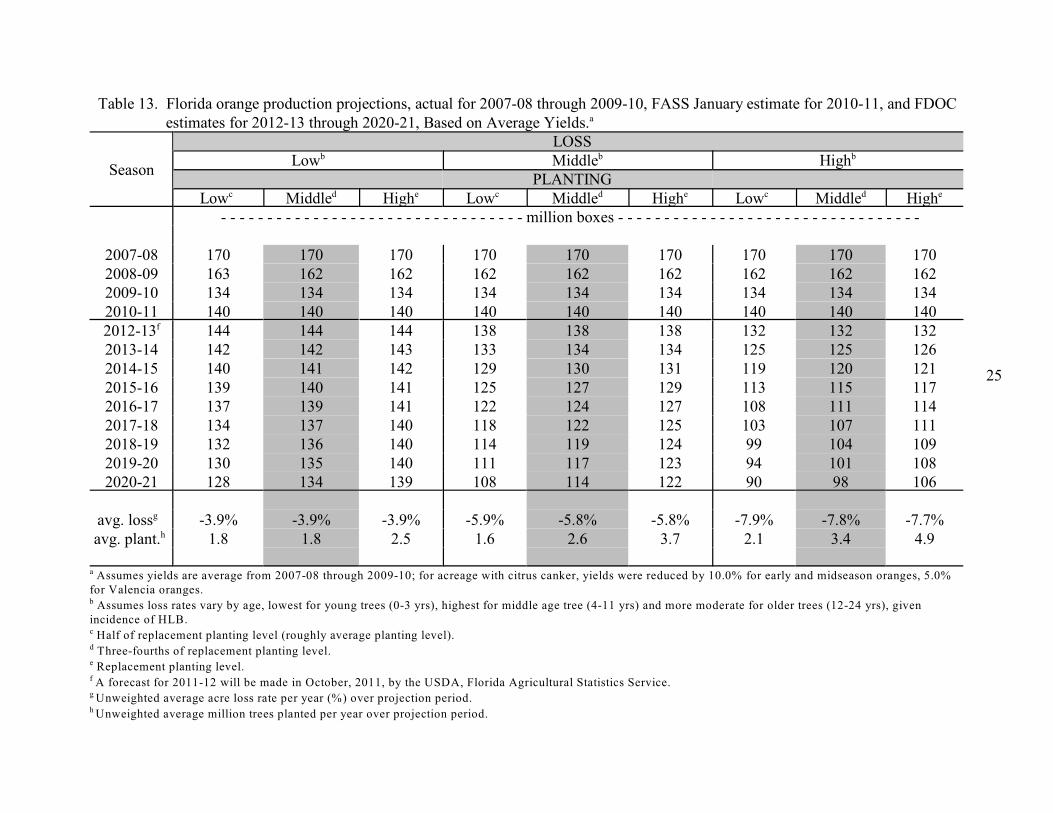
Table 13. Florida orange production projections, actual for 2007-08 through 2009-10, FASS January estimate for 2010-11, and FDOC estimates for 2012-13 through 2020-21, Based on Average Yields.a
Season
LOSSLow Middle Highb b b
PLANTING
Low Middle High Low Middle High Low Middle Highc d e c d e c d e
- - - - - - - - - - - - - - - - - - - - - - - - - - - - - - - - - million boxes - - - - - - - - - - - - - - - - - - - - - - - - - - - - - - - - -
2007-08 170 170 170 170 170 170 170 170 1702008-09 163 162 162 162 162 162 162 162 1622009-10 134 134 134 134 134 134 134 134 1342010-11 140 140 140 140 140 140 140 140 1402012-13 144 144 144 138 138 138 132 132 132f
2013-14 142 142 143 133 134 134 125 125 1262014-15 140 141 142 129 130 131 119 120 1212015-16 139 140 141 125 127 129 113 115 1172016-17 137 139 141 122 124 127 108 111 1142017-18 134 137 140 118 122 125 103 107 1112018-19 132 136 140 114 119 124 99 104 1092019-20 130 135 140 111 117 123 94 101 1082020-21 128 134 139 108 114 122 90 98 106
avg. loss -3.9% -3.9% -3.9% -5.9% -5.8% -5.8% -7.9% -7.8% -7.7%g
avg. plant. 1.8 1.8 2.5 1.6 2.6 3.7 2.1 3.4 4.9h
Assumes yields are average from 2007-08 through 2009-10; for acreage with citrus canker, yields were reduced by 10.0% for early and midseason oranges, 5.0%a
for Valencia oranges.
Assumes loss rates vary by age, lowest for young trees (0-3 yrs), highest for middle age tree (4-11 yrs) and more moderate for older trees (12-24 yrs), givenb
incidence of HLB.
Half of replacement planting level (roughly average planting level). c
Three-fourths of replacement planting level. d
Replacement planting level.e
A forecast for 2011-12 will be made in October, 2011, by the USDA, Florida Agricultural Statistics Service.f
Unweighted average acre loss rate per year (%) over projection period.g
Unweighted average million trees planted per year over projection period.h
25
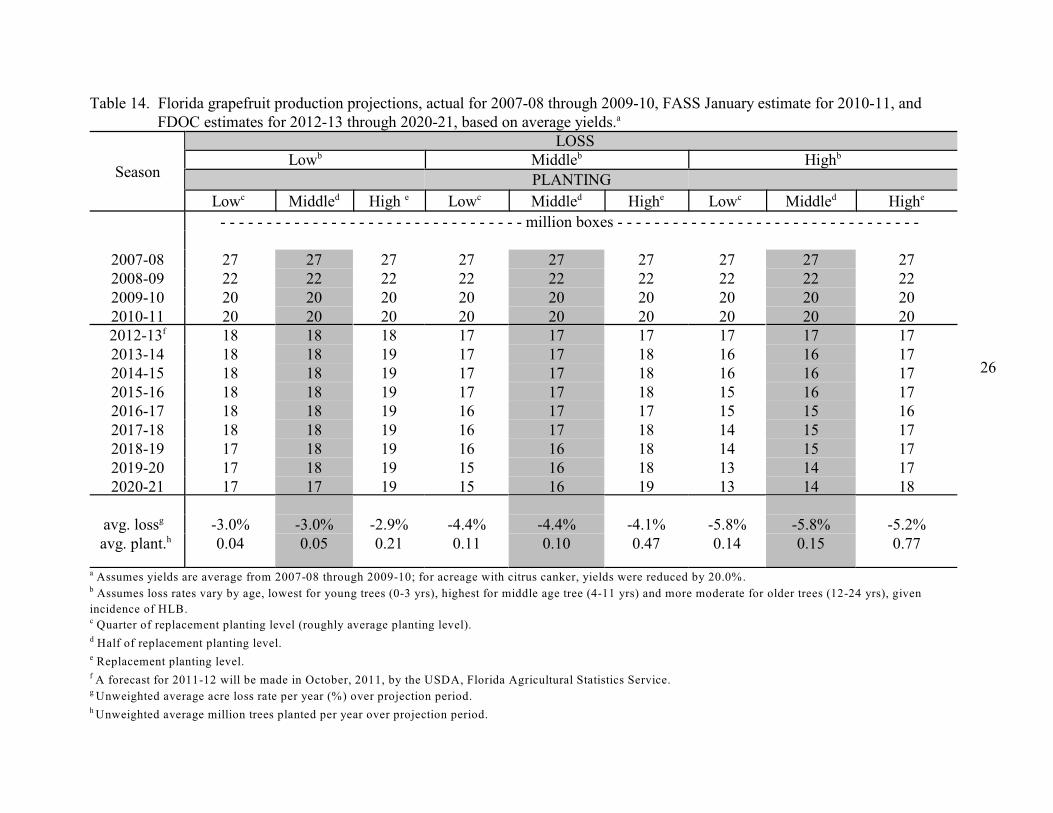
Table 14. Florida grapefruit production projections, actual for 2007-08 through 2009-10, FASS January estimate for 2010-11, and FDOC estimates for 2012-13 through 2020-21, based on average yields.a
Season
LOSSLow Middle Highb b b
PLANTING
Low Middle High Low Middle High Low Middle Highc d e c d e c d e
- - - - - - - - - - - - - - - - - - - - - - - - - - - - - - - - - million boxes - - - - - - - - - - - - - - - - - - - - - - - - - - - - - - - - -
2007-08 27 27 27 27 27 27 27 27 272008-09 22 22 22 22 22 22 22 22 222009-10 20 20 20 20 20 20 20 20 202010-11 20 20 20 20 20 20 20 20 202012-13 18 18 18 17 17 17 17 17 17f
2013-14 18 18 19 17 17 18 16 16 172014-15 18 18 19 17 17 18 16 16 172015-16 18 18 19 17 17 18 15 16 172016-17 18 18 19 16 17 17 15 15 162017-18 18 18 19 16 17 18 14 15 172018-19 17 18 19 16 16 18 14 15 172019-20 17 18 19 15 16 18 13 14 172020-21 17 17 19 15 16 19 13 14 18
avg. loss -3.0% -3.0% -2.9% -4.4% -4.4% -4.1% -5.8% -5.8% -5.2%g
avg. plant. 0.04 0.05 0.21 0.11 0.10 0.47 0.14 0.15 0.77h
Assumes yields are average from 2007-08 through 2009-10; for acreage with citrus canker, yields were reduced by 20.0%.a
Assumes loss rates vary by age, lowest for young trees (0-3 yrs), highest for middle age tree (4-11 yrs) and more moderate for older trees (12-24 yrs), givenb
incidence of HLB.
Quarter of replacement planting level (roughly average planting level). c
Half of replacement planting level. d
Replacement planting level.e
A forecast for 2011-12 will be made in October, 2011, by the USDA, Florida Agricultural Statistics Service.f
Unweighted average acre loss rate per year (%) over projection period.g
Unweighted average million trees planted per year over projection period.h
26
27
Table 15. Florida specialty production projections, actual for 2007-08 through 2009-10, FASS January estimate for 2010-11, and FDOC estimates for 2012-13 through 2020-21.a
Season Tangelos Tangerines TOTAL
- - - - - - - - - - - - - - million boxes - - - - - - - - - - - - - -
2007-08 1.5 5.5 7.0
2008-09 1.2 3.9 5.0
2009-10 .9 4.5 5.4
2010-11 1.1 4.4 5.5
2012-13 1.2 4.1 5.3b
2013-14 1.2 4.0 5.2
2014-15 1.2 3.9 5.1
2015-16 1.2 3.9 5.1
2016-17 1.2 3.9 5.0
2017-18 1.2 3.8 5.0
2018-19 1.1 3.8 5.0
2019-20 1.1 3.8 4.9
2020-21 1.1 3.8 4.9 Assumes the acreage loss rates for each variety is 4% per year and replacement plantings.a
A forecast for 2011-12 will be made in October, 2011, by the USDA, Florida Agricultural Statistics Service.b