flood early warning system develop at garang river ... of large rivers flowing in semarang city is...
TRANSCRIPT
INTERNATIONAL JOURNAL OF GEOMATICS AND GEOSCIENCES Volume 1, No 1, 2010
© Copyright 2010 All rights reserved Integrated Publishing services Research Article ISSN 0976 – 4380
14
Flood Early Warning System Develop at Garang River Semarang using Information Technology base on SMS and Web
Joko Windarto Engineering Faculty, Diponegoro University Semarang – Indonesia
ABSTRACT One of large rivers flowing in Semarang City is Garang River with watershed area about
203 km 2 and having characteristics: high flood discharge and flash flood. The flash flood on January 25 th 1990 caused more than 45 people died and lost 8.5 billion rupiahs. In this research, a flood early warning system made, an automatic rainfall recorder (ARR) was placed in upstream of Garang River and an automatic water level recorder (AWLR) placed in Simongan weir. To receive rainfall and water level data, a computer as server placed in Semarang government office. This functions for sending flood status (prepared/caution/careful) to flood attendants, stake holders. Artificial neural network (ANN) used to predict water level where the input are rainfall in upstream river for 1, 2, 3, 4 or 5 days before and the water level in the downstream for 3 hours before the occasion. The output water level in downstream for next 2 hours. This system integrated with information technology that is SMS (Short Message Services) and Web that the flood early warning can be accessed anywhere as long as communication network is available. The result shows time for sending data of rainfall and water level telemetry system less than 10 minutes, while information system built to give flood early warning information less than 10 minutes. Consequently it fulfill in which the time to receive the information less than time when flood happened in 2 hours. The result of optimum predicting during the ANN training is model 4, 20 neurons; speed training 0.9, momentum 0.3 which input rainfall are four days before the occasion and the water level are 3 hours before having MSE 0.0046. Finally, the results of survey to flood attendants and staffs from government show that 86 % of the respondent absolutely need the flood early warning system.
Key words: Garang River, short message services, artificial neural network, flood early warning.
1. Background
One of the major rivers flowing trought the Semarang City is Kali Garang that have 220 km 2 of wide, characterized by the large flow of floods and the arrival is fast (flash floods); Kali Garang has a twigs pattern, with so many tributaries. Tributary that large enough are Kreo River and Kripik River, where the length of Garang River from upstream to downstream approximately 30 km. (Irianto G, Perez P, Q and Prasetyo, 1999)
Kali Garang located in the western of Semarang City, previously has estuary called Kali Semarang. By the development of the city, the load of Semarang city becomes heavier, while the efforts of normalization is impossible. Therefore in the 19th century, the goverment builted the West Flood Canal from the north Simongan straight ahead to the sea. Western Canal flood is a continuation of Kali Garang which rises in the Mount Ungaran. (Suripin, 2004)
The existence of dense settlements around Kali Garang caused flood, enormous losses both property and lives. On January 25th, 1990 flood occurred which resulted in more than 45

INTERNATIONAL JOURNAL OF GEOMATICS AND GEOSCIENCES Volume 1, No 1, 2010
© Copyright 2010 All rights reserved Integrated Publishing services Research Article ISSN 0976 – 4380
15
people died and property damage was so great. Total losses estimated to reach 8.5 billion rupiah. Areas that experienced the greatest of loss are West and South Semarang district. Pool elevation / flood reached 3 feet for 3 5 hours.
In an effort to reduce flooding, flood control aspect is very important. Generaly, flood control can be divided into two, structural and nonstructural efforts. Structural efforts including dam construction, floodway, river gully improvement, retardation (natural reservoirs). In flood control efforts, other than through structural efforts by build flood water irrigation infrastructure, efforts also should be developed among other nonstructural, that is Planning Zooning and Flood Forecasting and Warning System (FFWS) an early warning activities include flood prediction (estimate ) magnitude and when a flood will occur once public notification which is flood problality. Flood can be anticipated by using the flood early warning systems. (Harmanto Soekistijono and Aris, 2006)
The method used in forecasting flood flow can be separated into two, namely a mathematical model / conceptual and blackbox models. (Anwar S, 2005) Flood flow conceptual forecast is to account all aspects of the hydrological cycle in a watershed. This method has many problems including difficulty of getting data in the field, such as land use, evapotranspirasi, infiltration, percolation, interflow, etc.. Meanwhile, flood prediction system in flood early warning by using rainfall data and flow among other ANN methods or better known as artificial neural networks.
Artificial neural network is a theory designed to modeling how the brain worked on a problem and is often referred to as the adaptive function (Haykin, 1994). One of the artificial neural network application is for forecasting. Propagation algorithm with the architecture through a multilayer perceptron with one hidden layer is a common method used in the forecasting process, such as the Nile flow forecasting in Egypt (Atiya and Shahen, 1999) and the Mae Klong (Phien, 1997), prediction debit Cikapundung with neural networks clone (Margiantoro, 2003). In this study will use artificial neural network to predict the flow time Garang with rainfall input. JST model used is back propagation algorithm
With the information technology development such as SMS and the Web, allowing integration between the model of flood prediction systems and information technology. With this integration, the expected information about the flood warning can be accepted by society as quickly and accurately.
2.Aims of the Research
Generally, this research aims to develop a flood predictive model and flood warning and based Web and SMS, which can give added value that can be beneficial to the society and government in flood disaster management. In detail, the purpose of this study are as follows:
1) Develop a Kali Garang telemetry hydrological SMSbased hardware and software system.
2) Develop a Kali Garang Flood prediction with artificial neural network model software system.
3) Develop early warning information system of Kali Garang Flood based on Web and SMS.

INTERNATIONAL JOURNAL OF GEOMATICS AND GEOSCIENCES Volume 1, No 1, 2010
© Copyright 2010 All rights reserved Integrated Publishing services Research Article ISSN 0976 – 4380
16
4) Integrating hydrology telemetry, predictions of the river water level and flood early warning information system into a system of Flood Forecasting and Warning System (FFWS).
5) Conducting an analysis about perceptions of the flooding officials and the public about the function and effectiveness of flood warning equipment being developed.
2.1 Research Method 2.1.1 Location and Time Research
Research conducted at the end of December 2006 February 2008 includes the data collection, preparation of the survey, field survey and identification, making hardware and software, analysis and writing the report. Research conducted in Electrical Engineering Lab UNDIP and location of the Kali Garang watershed. The instrument used for this study are: automatically rainfall and river water level measurement tool, Modem, Hand Phone, GPS, a set of computer for server, some applications software such as Delphi program.
2.2 Research Stages
Implementation of research conducted in several stages, they are: 1) Preliminary stage, including the literature studies and other information sources, especially
the flood early warning systems 2) Secondary data collection stage, where the necessary data such as hourly rainfall data from
an automatic rainfall station data logger system, that’s the properties of Agroclimate Central's stationed in Gunungpati district, Semarang. Also needed the river water level data taken manually in Bendung Simongan.
3) Secondary Data Analysis Stage, which rainfall data for further will be analizedto get the relationship between rainfall data with water level data. This data is needed to calculate the flood response time.
4) Making stage of the of Rainfall Telemetry and Water Level hardware and software system. This equipment is very useful to obtain primary data of rainfall in the upper course of Kali Garang in real time with SMS systems.
5) Primary data collection stage. This stage is the rainfall primary data gathering and river water level, done in real time with rainfall gauges and automatic water level.
6) Making stage of Flood Prediction with Neural Network software. At this stage will be made a predictive software of flood water level with Neural Network method.
7) Making stage of flood early warning system based on SMS and the Web. In this stage is to perform an integration between water level predictions Kali Garang, weather and telemetry systemlevel and softwarebased flood early warning SMS and the Web into a flood early warning system.
8) The implementation stage of flood warning in real time. In this stage will be tested all hardware and software of flood warning in real time. In this implementation will be examined Kali Garang Flood response time with flood information system responsetime. If the response time of flood information system <time Kali Garang's flood response, the early warning system successfully.

INTERNATIONAL JOURNAL OF GEOMATICS AND GEOSCIENCES Volume 1, No 1, 2010
© Copyright 2010 All rights reserved Integrated Publishing services Research Article ISSN 0976 – 4380
17
9) Socialization stage. In this stage will be sosialize to officer and related departement and the people around Kali Garang about early flood warning system equipment installed in Kali Garang.
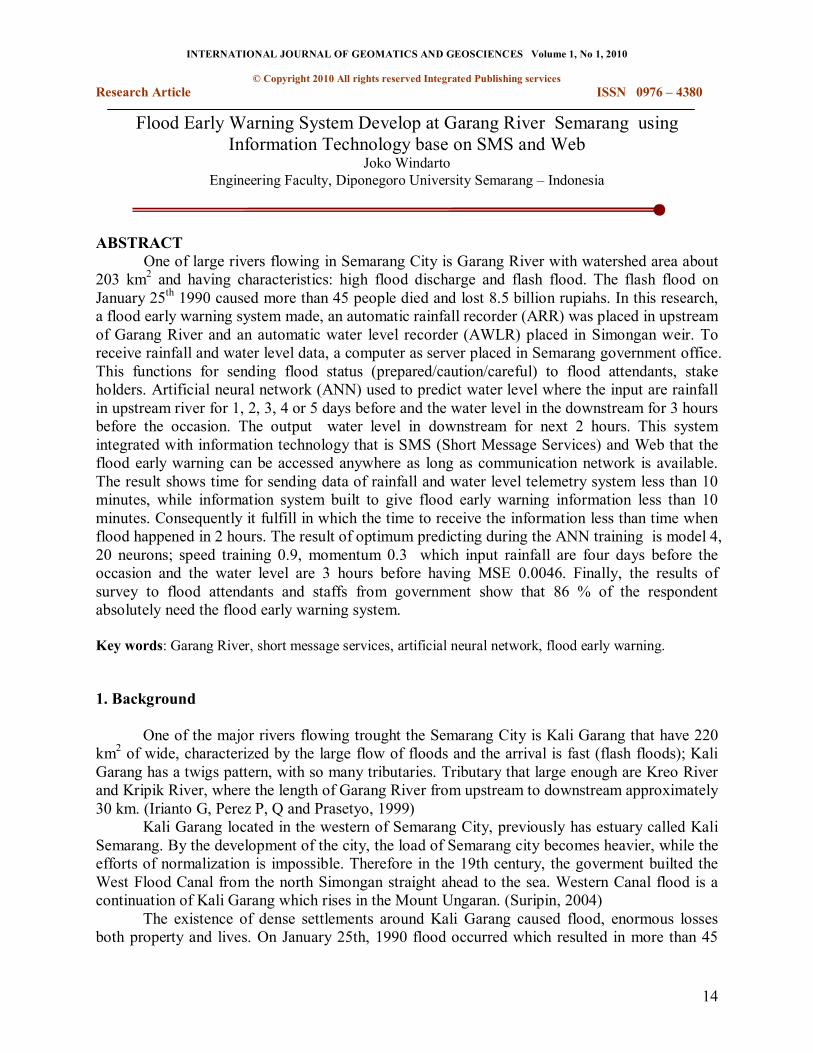
10)Perception Analysis stage of the flood officers and public about the flood early warning system equipment by filling the questionnaire. In this stage conducted questionnaire filling techniques directly to the flood officers and representatives of the society or RW. Figure 1 shows the flow diagram of studies conducted stage and Figure 2 is the builted flood early warning system.
Figure1. Research Stages
INTERNATIONAL JOURNAL OF GEOMATICS AND GEOSCIENCES Volume 1, No 1, 2010
© Copyright 2010 All rights reserved Integrated Publishing services Research Article ISSN 0976 – 4380
18
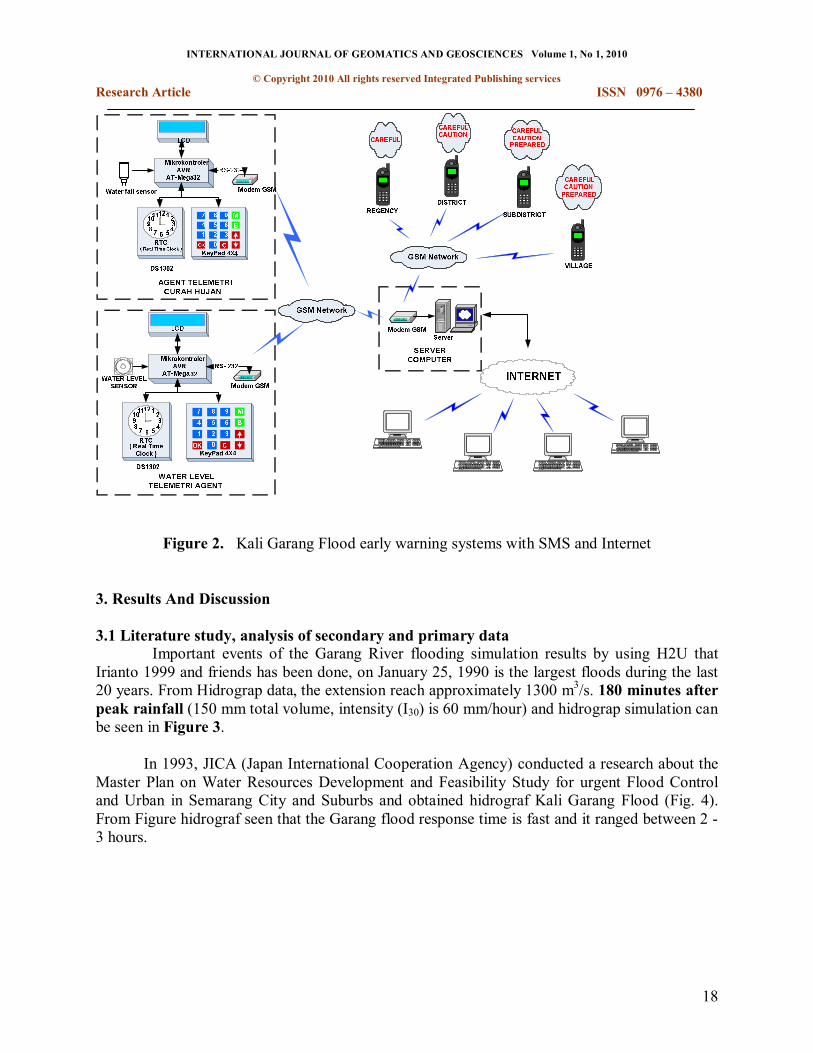
Figure 2. Kali Garang Flood early warning systems with SMS and Internet
3. Results And Discussion
3.1 Literature study, analysis of secondary and primary data Important events of the Garang River flooding simulation results by using H2U that
Irianto 1999 and friends has been done, on January 25, 1990 is the largest floods during the last 20 years. From Hidrograp data, the extension reach approximately 1300 m 3 /s. 180 minutes after peak rainfall (150 mm total volume, intensity (I30) is 60 mm/hour) and hidrograp simulation can be seen in Figure 3.
In 1993, JICA (Japan International Cooperation Agency) conducted a research about the Master Plan on Water Resources Development and Feasibility Study for urgent Flood Control and Urban in Semarang City and Suburbs and obtained hidrograf Kali Garang Flood (Fig. 4). From Figure hidrograf seen that the Garang flood response time is fast and it ranged between 2 3 hours.

INTERNATIONAL JOURNAL OF GEOMATICS AND GEOSCIENCES Volume 1, No 1, 2010
© Copyright 2010 All rights reserved Integrated Publishing services Research Article ISSN 0976 – 4380
19
Figure 3. Hidrograp flood simulation results with H2U by Irianto and friends
source : JICA (1993)
Figure 4. Garang Hidrograf simulation time in 1993 by JICA.
From the research results conducted by Irianto (1999) and JICA (1993) found that Kali Garang Flood response is quick and it ranged between 23 hours.
From the results in realtime recording of water level and rainfall during January to April 2008, obtained that the highest water level recording on January 30, 2008 occurred the height of water level river to 5,36 (alert status) and rainfall during 3 hours is 61mm. The flood graph results in Garang time response as seen in Figure 5 seen that the time when water level rise until the peak is approximately 3 hours. So that it can be said that the Kali Garang Flood response is fast (fastflood). This shows that the flood early warning systems must be able to Kali Garang anticipated flooding as soon as possible.
Time (hours:minutes)
Rain fall / 30m
m (m
m)

INTERNATIONAL JOURNAL OF GEOMATICS AND GEOSCIENCES Volume 1, No 1, 2010
© Copyright 2010 All rights reserved Integrated Publishing services Research Article ISSN 0976 – 4380
20
Figure 5. Recording result in real time about rainfall and water level at Kali Garang
3.2 Testing of Rainfall and Water Level Telemtri System To determine the effectiveness of the SMS system will be analyzed the lag time between
the sending and receiving SMS messages. It is necessary for SMS sending time data from the station or rainfall and water level data when receiving SMS on the computer server. From the results of data processing in the computer server from months January to April 2008 found that under normal conditions, the lag time between sending SMS from existing instruments in the field and the receiver in the computer data that shown less than 5 minutes is 92% average. While the lag time between 5 to 10 minutes is 8% average. Table 24 shows the amount of difference time data between sending of water level data by SMS with receiving time of water level data for less than 5 minutes and between 5 to 10 minutes during the month of January to April 2008.
Table 1 Results of the time difference between sending and receiving SMS for water level telemetry system
MONTH DELAY< 5 MINUTES 5MENIT<DELAY<10 MINUTES January 90% 10% February 91% 9% March 92% 7% April 94% 6% Average 92% 8%
For delivery rainfall data, differences in sending SMS from existing equipment in the field with existing SMS revenue in the computer server at intervals of less than 5 minutes was 92.25% average rating. Meanwhile the gap ranged from 5 minutes to 10 minutes showed 7.75%.
Water Level Kali Garang River
Water Level Gunungpati

INTERNATIONAL JOURNAL OF GEOMATICS AND GEOSCIENCES Volume 1, No 1, 2010
© Copyright 2010 All rights reserved Integrated Publishing services Research Article ISSN 0976 – 4380
21
This shows that the SMS system is still reliable / can be used in telemetry rainfall and water level systems because it is still below 10 minutes. The small lag time between sending and receiving is due to use the same GSM network operators between the agent/field to the server computer. Table 24 shows the amount of difference time data between sending of water level data by SMS with receiving time of water level data for less than 5 minutes and between 5 to 10 minutes during the month of January to April 2008.
Table 2 Results of the time difference between sending and receiving SMS for water level telemetry system
MONTH DELAY< 5 MINUTES 5MENIT<DELAY<10 MINUTES January 90% 10% February 91% 9% March 92% 7% April 94% 6% Average 92% 8%
3.3 Overall System Testing of Rainfall and High Water Front Kali Garang Telemetry
Tests for Garang Flood Early Warning System time is very important undertaken before the telemetry system is suitable for stated use. This telemetry software testing include:
• Are telemetry system function of rainfall and water level able to work well where the functions in software running well such as telemetry data transmission system settings, data processing systems, data storage, etc
• System test for 24 hours for 1 week with no off or continuously to determine the reliability of telemetry system hardware or software
From the results of a pilot rainfall telemetry system and this water level telemetry system has worked well where the function of receiving data from the field to the computer server has been running perfectly. Also performed data validation between the field data with the computer. Examples display of telemetry rainfall and water level software is in Figure 6 and 7.

INTERNATIONAL JOURNAL OF GEOMATICS AND GEOSCIENCES Volume 1, No 1, 2010
© Copyright 2010 All rights reserved Integrated Publishing services Research Article ISSN 0976 – 4380
22
Figure 6. Main display of the telemetry rainfall and water level software
Figure 7. Exampled setting display of data sending from field to computer server
Water Level Kali Garang River
Water Level Kali Garang River
Water Level Gunungpati

INTERNATIONAL JOURNAL OF GEOMATICS AND GEOSCIENCES Volume 1, No 1, 2010
© Copyright 2010 All rights reserved Integrated Publishing services Research Article ISSN 0976 – 4380
23
(a) (b)
(c) (d) (e)
Figure 8. Installation of telemetry equipment rainfall and water level in Kali Garang a) box where the rainfall telemetry equipment and rain sensor placed b) Equipment telemetry (agent) rainfall and UPS c) water level Sesnor d) telemetry (agent) e) Installation of water level sensors in Bendung Simongan
3.4 Testing and Results of Kali Garang Flood Information System From the test results about delay time between sending and receiving SMS in January to
May, the data we’ve get about maksimum delay time is less than 10 minutes. From observing some actual flood events at Kali Garang, a flood information systems with SMS has been going well at that moment where the Kali Garang water level rose, the server computer has been sending SMS about the status of Kali Garang to several flood officers seen in figure 9 below.
Figure 9. Prefiew of text SMS received from the actual flood events

INTERNATIONAL JOURNAL OF GEOMATICS AND GEOSCIENCES Volume 1, No 1, 2010
© Copyright 2010 All rights reserved Integrated Publishing services Research Article ISSN 0976 – 4380
24
3.5 Testing of Water Level Prediction by Artificial Neural Network
JST Testing Result Data needed for the application of artificial neural networks include data for training, data
for testing, data for the prediction, and weighting data. Data for the training and data for test is a data that consist of water level and rainfall data in a certain period.
Data used in training process is water level data and rainfall during the 3 months (JanuaryMarch 2008) with an interval of 30 minutes, so amount of the data is 4320 water level data and 4320 rainfall data.
Training process basically is a search process about the JST weight values based on training data which has been prepared with hope the value of the output value approach the output targets value that has been determined. This training used the momentum values variation (0.3 and 0.5), variations of learning rate value (0.5 and 0.9), and variations of amount hidden neurons (20 and 30). While the desired number of epoch is 500. Example display of running program for model1 with one hidden layer 20 neurons and the inputs are rainfall CH(t) s/d CH(t
24 hours) and the water level TMA(t) s/d TMA(T3 hours) at the training session can be seen in Figure 10.
Figure 10. Display of the training results for model1 with input are rainfall CH(Q) s/d CH(t24 hours) and water level TMA(t) s/d TMA(t3 hours)
While the example graph of water level from training result between prediction and target for practice data (rainfall data in January to March 2008) with 0.9 learning rate and momentum of 0.5 and input data of rainfall 4 days before can be seen in Figure 11.

INTERNATIONAL JOURNAL OF GEOMATICS AND GEOSCIENCES Volume 1, No 1, 2010
© Copyright 2010 All rights reserved Integrated Publishing services Research Article ISSN 0976 – 4380
25
Figure 11. Graphs between targets and predictions during training with learning rate 0.9 and momentum 0.5 and the input data of rainfall 4 days before.
From Figure 11 above shows that the predictions builted by JST can identify the patterns of actual water level/target but there are some areas where the JST can not recognize the low water level pattern. It happened because Bendung Simongan sluice was opened by the operator to disposal mud water around the dam. Indicates that the data changes exstrimly where water level data of Bendung Simongan should be always ranged between 3.6 s/d 3.7 meters and if no rain changed to 3.3 s/d 3.4 meters.
3.6 JST Model Test Results The testing was doing by use previous JST weights training results. JST weights were
derived from the training process with JST configuration with of 5 rainfall data input variations. From the results of the test stage with water level and rainfall data during a certain period (April 18 Until 21 April 2008) obtained the test results as seen in Table 3.
From table 3 obtained that the most optimum input is when we use the model 4, that is the data input of rainfall CH(t) s/d CH(t96 hours). Where the smallest MSE value on 4 models compared with models 1, 2, 3 and 5. From the above table can get the value of the smallest MSE is 0.0046 ie the model 4B with neurons amount is 20, learning rate 0.9 and momentum 0.3.
Tabel 3 JST test result for 5 model
MODEL NEURON LEARNING RATE MOMENTUM MSE TESTING R A 20 0,9 0,5 0,0191 0,88 B 20 0,9 0,3 0,0194 0,88 C 20 0,5 0,5 0,0194 0,87 D 20 0,5 0,3 0,0165 0,87
1
E 30 0,9 0,5 0,0178 0,89
Graphic OutputTarget to 2 Hours Prediction Target Prediction

INTERNATIONAL JOURNAL OF GEOMATICS AND GEOSCIENCES Volume 1, No 1, 2010
© Copyright 2010 All rights reserved Integrated Publishing services Research Article ISSN 0976 – 4380
26
F 30 0,9 0,3 0,0199 0,88 G 30 0,5 0,5 0,0198 0,87 H 30 0,5 0,3 0,0195 0,87 A 20 0,9 0,5 0,0140 0,89 B 20 0,9 0,3 0,0144 0,90 C 20 0,5 0,5 0,0150 0,89 D 20 0,5 0,3 0,0157 0,89 E 30 0,9 0,5 0,0129 0,90 F 30 0,9 0,3 0,0143 0,90 G 30 0,5 0,5 0,0143 0,90
2
H 30 0,5 0,3 0,0146 0,89 A 20 0,9 0,5 0,0095 0,88 B 20 0,9 0,3 0,0086 0,87 C 20 0,5 0,5 0,0085 0,87 D 20 0,5 0,3 0,0068 0,87 E 30 0,9 0,5 0,0097 0,87 F 30 0,9 0,3 0,0091 0,87 G 30 0,5 0,5 0,0085 0,86
3
H 30 0,5 0,3 0,0078 0,86 A 20 0,9 0,5 0,0049 0,89 B 20 0,9 0,3 0,0046 0,89 C 20 0,5 0,5 0,0055 0,87 D 20 0,5 0,3 0,0057 0,87 E 30 0,9 0,5 0,0051 0,88 F 30 0,9 0,3 0,0049 0,89 G 30 0,5 0,5 0,0048 0,88
4
H 30 0,5 0,3 0,0051 0,88 A 20 0,9 0,5 0,0075 0,88 B 20 0,9 0,3 0,0068 0,88 C 20 0,5 0,5 0,0074 0,87 D 20 0,5 0,3 0,0067 0,88 E 30 0,9 0,5 0,0073 0,88 F 30 0,9 0,3 0,0071 0,88 G 30 0,5 0,5 0,0078 0,87
5
H 30 0,5 0,3 0,0069 0,88 Explanation: MSE = Mean Square Error and R = Correlation between target and obesrvation
Generally, JST configuration which gives a small error rate is the configuration with the number of neurons 20, learning rate 0.9 and momentum 0.3. With MSE 0.0046 testing graph with artificial neural network for model 5 with the number of input data 4 days before rainfall. Can be seen in Figure 12
Graphic OutputTarget to 2 Hours Prediction
Target Prediction

INTERNATIONAL JOURNAL OF GEOMATICS AND GEOSCIENCES Volume 1, No 1, 2010
© Copyright 2010 All rights reserved Integrated Publishing services Research Article ISSN 0976 – 4380
27
Figure 12. Graphs of test results between targets and predictions for the data input CH(t) s/d CH(t96 hours); neurons 20, learning rate 0.9 and momentum 0.3
4. Conclusion
The conclusion derived from the results of research on the development of a flood early warning systems Kali Garang Semarang with SMSbased information technology and the Web are as follows: 1. From the results of telemetry system recording rainfall and water level Kali Garang, found
that time Kali Garang Flood response is fast and it ranged between 2 3 hours so that the necessary information early warning system that quickly flooded. From the results of earlier studies peringatna systems Kali Garang Flood obtained a maximum interval of time sending and receiving data of rainfall and water level with the SMS is 10 minutes, while the time interval required delivery time from the flood of information systems to computer server is a maximum of less than 10 minutes so that total early warning information system with SMS flood is 20 minutes so much smaller than the floodtime response time of 23 hours Garang. From the results of this study is an early warning information system of this flood has met the criteria of early flood warning system where flood information system is smaller than the flood response Kali Garang.
2. In this research testing water level predictions Kali Garang with Neural Networks (JST) on five models of the rainfall data input 1, 2, 3, 4 and 5 days earlier and water level to three hours prior to the form of rainfall data per ½ hour to predict the water level to the next two hours. JST test results from the fifth model to the data in April at the time of the flood on 19 s / d 21 April 2008 found that optimum results are four models with input data of rainfall the previous four days. For all models, the smallest MSE obtained results are model number 4B with 20 neurons, 0.9 learning rate and momentum of 0.3 with an error MSE of 0.0046.
3. From the survey results to staff and related agencies flood obtained results that the equipment early flood warning system is very necessary and very helpful in the delivery of information flooding in the Kali Garang. Of 15 respondents isntansi officers and related flooding, obtained results show that 87.6% of respondents answered in desperate need of equipment of this flood warning. While 13.3% answered that need. Representative survey of people around K Garang, that the flood early warning in the conventional (wide band) is still needed. 20 respondents from public representatives, 75% answered still very much wanted and only 5% who answered did not need flood early warning to rafters
4. In the face of floods, the community empowerment is very important. This is because the handling of the disaster is not only government responsibility but also the community. Currently the organization of communitybased disaster management in Kali Garang has not been established. For that need to be established Disaster Management Community Groups (KMPB) Kali Garang considering the number of people who live around Kali Garang and need better preparation in dealing with disasters.
5. References
Anwar S ,2005 . Pengembangan Indikator Sistem Peringatan Dini dan Teknik Prakiraan Debit Banjir Sungai Cimanuk “ , Disertasi , Sekolah Pasca Sarjana IPB .

INTERNATIONAL JOURNAL OF GEOMATICS AND GEOSCIENCES Volume 1, No 1, 2010
© Copyright 2010 All rights reserved Integrated Publishing services Research Article ISSN 0976 – 4380
28
Atiya, AF and Shahen, SI, 1999, A Comparison between Neural Network Forecasting Techniques, IEEE Trans. On Neural Network vol. 10.
Balai Rehabilitasi Lahan dan Konservasi Tanah Wilayah V , 1988 . Pola Rehabilitasi Lahan dan Konservasi Tanah daerah Aliran Sungai Garang , Penerbit Balai RLKT V .
Fausett, Laurene, 1994, Fundamental of Neural Network Architecture; Algorithm and Application, Prentice Hall Englewood Cliffs., USA.
Haykin, Simon, 1994, Neural Network A Comprehensive Foundation, Macmillian College,
Publishing Company Inc., USA.
Irianto G, Perez P, dan Prasetyo T , 1999. Karakteristik dan Analisis Biofisik Wilayah Rawan Kekeringan dan Banjir . Pusat Penelitian Tanah dan Agroklimat , Balai Penelitian dan Pengembangan Pertanian , Bogor.
Margiantoro A , 2003. Prediksi Debit Sungai Cikapundung menggunakan Jaringan Saraf Tiruan . Tesis , Program Magister Teknik Instrumentasi dan Kontrol , ITB .
Soekistijono dan Aris Harmanto, 2006 . Pengendalian Banjir dan Aspek Kelembagaan di DAS Kali Brantas. Makalah Seminar Nasional Bencana Banjir Bandang dan Solusinya oleh Masyarakat Hidrologi Indonesia dalam Rangka Hari Air Sedunia,
Suripin , 2004. Sistem Drainase Perkotaan yang Berkelanjutan . Penerbit Andi , Jogyakarta