fixed income investor review - citigroup.com · consumer portfolio trends citi gl b l c b kciticorp...
TRANSCRIPT
Fixed Income Investor Review
John GerspachChief Financial OfficerEric AboafTreasurer
October 24, 2012

Highlights Quality earnings
– Net income of $0.5B – $3.3B net income, excluding CVA/DVA, loss on MSSB and the tax benefit(1), increased 27%
year-over-year
Continued improvement in credit trends; Well reserved– Net credit losses down 12% YoY; $26B of loan loss reserves, 4.0% of total loans
Disciplined balance sheet management– Loans and deposits growing steadily, contributing to strength in core businesses
Ample liquidity– $404B aggregate liquidity resources, Basel III LCR estimated to be approximately 116%(2),
comfortably above proposed requirement
Strong capital base(3) (3)(4)
(1) Credit valuation adjustments (CVA) on derivatives (excluding monolines), net of hedges, and debt valuation adjustments (DVA) on Citigroup’s fair value option debt was a negative $776 million in the third quarter 2012. As previously announced, Citigroup took a non-cash GAAP charge to net income in the third quarter of $4.7 billion pre-tax ($2.9 billion after-tax) relating to the Morgan Stanley Smith Barney joint venture (MSSB JV), consisting of (i) a pre-tax loss on Citigroup’s sale of the 14% interest in the MSSB JV to Morgan Stanley of $1.4 billion pre-tax ($800 million after-tax) and (ii) an other-than-temporary impairment of the carrying value of Citigroup’s remaining 35% interest in the MSSB JV of $3.3 billion pre-
– Basel I Tier 1 Common of 12.7%(3), estimated Basel III Tier 1 Common of 8.6%(3)(4)
tax ($2.1 billion after-tax). Also in the third quarter 2012, Citigroup had a $582 million tax benefit related to the resolution of certain tax audit items. Please refer to slides 25 and 31.(2) Preliminary, as of September 30, 2012. Citigroup's estimated Basel III Liquidity Coverage Ratio (LCR) is a non-GAAP financial measure. The LCR estimate is calculated in
accordance with the Basel Committee on Banking Supervision "Basel III: International framework for liquidity risk measurement, standards and monitoring." According to the Basel III guidelines, the LCR is to be calculated by dividing the stock of high quality (unencumbered) liquid assets by the estimate of net cash outflows over an acute 30-day stressed time period.
(3) Preliminary, as of September 30, 2012.(4) As of September 30, 2012. Citigroup’s estimated Basel III Tier 1 Common Ratio is a non-GAAP financial measure. For additional information regarding Citigroup’s estimated Basel III
Tier 1 Common Ratio, including the calculation of the ratio, please refer to Slide 35. 1

Summary Income Statement(1)
($MM, except EPS) 3Q'12 2Q'12 3Q'11 %QoQ %YoY
Revenues (ex-CVA / DVA & MI Losses) $19,411 $18,847 $18,893 3% 3%
Operating Expenses 12,220 12,134 12,460 1% (2)%
Net Credit Losses(2) 3,979 3,576 4,514 11% (12)%Net LLR Build / (Release)(2,3) (1,509) (984) (1,422) (53)% (6)%PB&C 225 214 259 5% (13)%
Cost of Credit 2,695 2,806 3,351 (4)% (20)%
EBT (ex-CVA / DVA & MI Loss) 4,496 3,907 3,082 15% 46%
Income Taxes (ex-CVA / DVA, MI Losses, & Tax Item) 1,172 786 543 49% NM
Net Income (ex CVA / DVA MI Losses & Tax Item) $3 268 $3 080 $2 568 6% 27%Net Income (ex-CVA / DVA, MI Losses, & Tax Item) $3,268 $3,080 $2,568 6% 27%
Diluted EPS (ex-CVA / DVA, MI Losses, & Tax Item) $1.06 $1.00 $0.84 6% 26%
EOP Assets ($B) $1,931 $1,916 $1,936 1% (0)%EOP Loans ($B) 658 655 637 1% 3%EOP Deposits ($B) 945 914 851 3% 11%
(1) Results exclude CVA / DVA in all periods, losses on minority investments in 3Q’12 and 2Q’12, and a tax benefit in 3Q’12. Please refer to Slides 25 and 37 for amounts. Adjusted results, as used throughout this presentation, are non-GAAP financial measures. For a reconciliation of the adjusted results to the reported results for Citigroup, please refer to Slide 37.
(2) 3Q’12 includes approximately $635 million of charge-offs related to new OCC guidance regarding the treatment of mortgage loans where the borrower has gone through Chapter 7 bankruptcy. Substantially all of these charge-offs were offset by a reserve release of approximately $600 million.
(3) Includes provision for unfunded lending commitments. Note: Totals may not sum due to rounding. 2
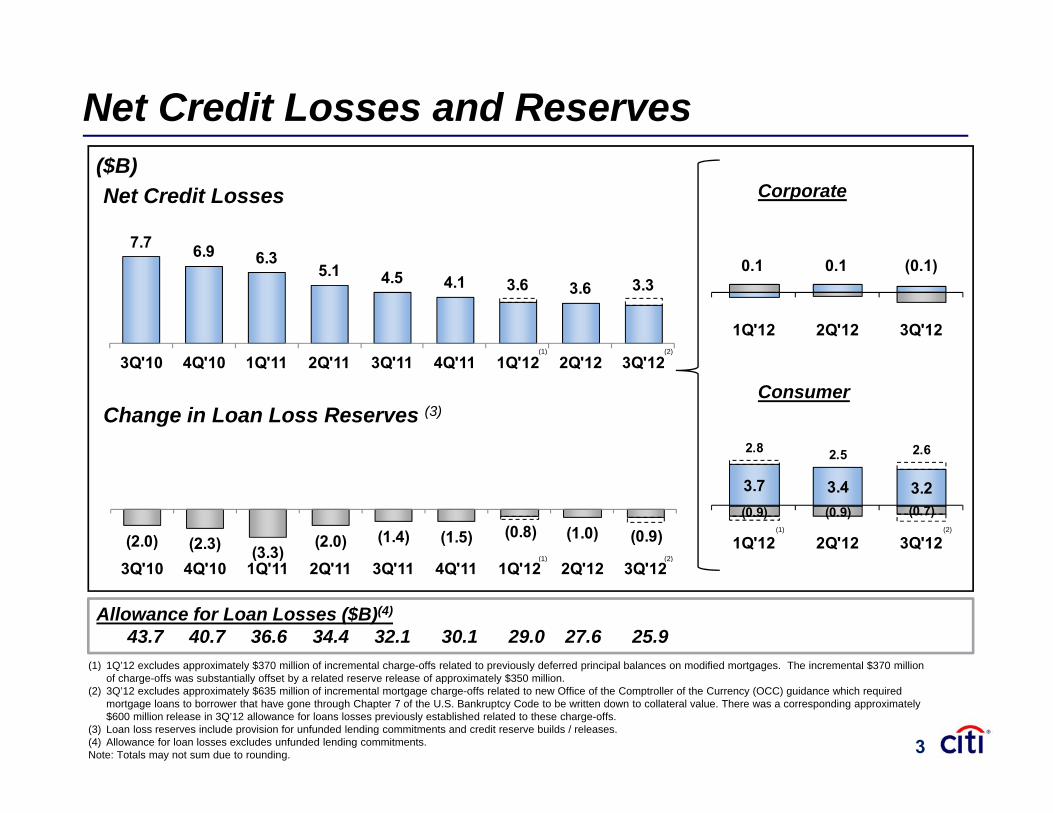
Net Credit Losses and Reserves
1.0
1.5
2.0
2.5
7.7 6 9 6 38.5
10.5
12.5
($B)CorporateNet Credit Losses
(0.5)
0.0
0.5
1Q'12 2Q'12 3Q'12
3.6 3.3
6.9 6.3 5.1 4.5 4.1 3.6
0.5
2.5
4.5
6.5 0.1 0.1 (0.1)
(1) (2)
2.8 2.5 2.6 5.0
7.0
9.0
11.0
6 08.0
10.0 12.0
(1.5) 3Q'10 4Q'10 1Q'11 2Q'11 3Q'11 4Q'11 1Q'12 2Q'12 3Q'12
ConsumerChange in Loan Loss Reserves (3)
3.7 3.4 3.2 (0.9) (0.9) (0.7)
2.5
(3.0)
(1.0)
1.0
3.0
1Q'12 2Q'12 3Q'12(0.8) (0.9)(2.0) (2.3) (3.3)
(2.0) (1.4) (1.5) (1.0)(6 0)(4.0)(2.0)0.0 2.0 4.0 6.0
(2)(1)
(1) (2)
( )(8.0)(6.0) 3Q'10 4Q'10 1Q'11 2Q'11 3Q'11 4Q'11 1Q'12 2Q'12 3Q'12
(1) 1Q’12 l d i t l $370 illi f i t l h ff l t d t i l d f d i i l b l difi d t Th i t l $370 illi
Allowance for Loan Losses ($B)(4)
43.7 40.7 36.6 34.4 32.1 30.1 29.0 27.6 25.9
(2)(1)
(1) 1Q’12 excludes approximately $370 million of incremental charge-offs related to previously deferred principal balances on modified mortgages. The incremental $370 million of charge-offs was substantially offset by a related reserve release of approximately $350 million.
(2) 3Q’12 excludes approximately $635 million of incremental mortgage charge-offs related to new Office of the Comptroller of the Currency (OCC) guidance which required mortgage loans to borrower that have gone through Chapter 7 of the U.S. Bankruptcy Code to be written down to collateral value. There was a corresponding approximately $600 million release in 3Q’12 allowance for loans losses previously established related to these charge-offs.
(3) Loan loss reserves include provision for unfunded lending commitments and credit reserve builds / releases. (4) Allowance for loan losses excludes unfunded lending commitments.Note: Totals may not sum due to rounding. 3
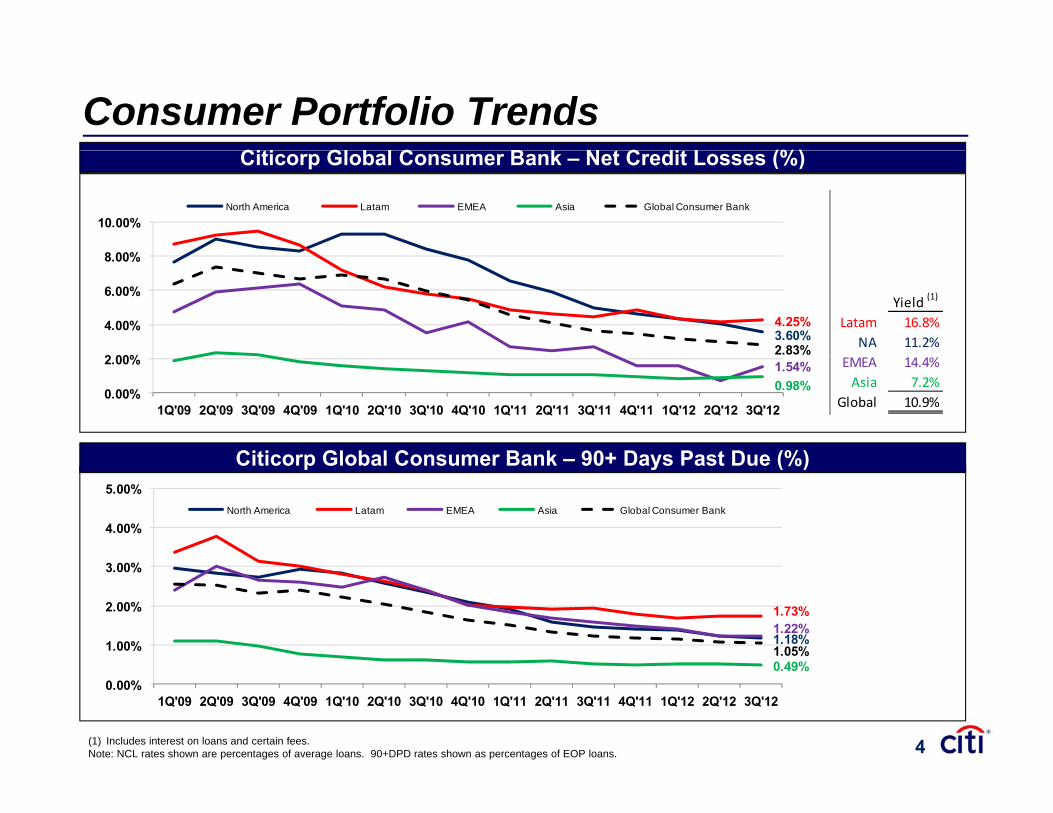
Consumer Portfolio TrendsCiti Gl b l C B k N t C dit L (%)Citicorp Global Consumer Bank – Net Credit Losses (%)
8 00%
10.00%North America Latam EMEA Asia Global Consumer Bank
3.60%4.25%
2.83%2 00%
4.00%
6.00%
8.00%
Yield (1)
Latam 16.8%NA 11.2%
Citicorp Global Consumer Bank 90+ Days Past Due (%)
1.54%0.98%0.00%
2.00%
1Q'09 2Q'09 3Q'09 4Q'09 1Q'10 2Q'10 3Q'10 4Q'10 1Q'11 2Q'11 3Q'11 4Q'11 1Q'12 2Q'12 3Q'12
EMEA 14.4%Asia 7.2%
Global 10.9%
Citicorp Global Consumer Bank – 90+ Days Past Due (%)
4.00%
5.00%North America Latam EMEA Asia Global Consumer Bank
1.18%
1.73%1.22%
0 49%1.05%1.00%
2.00%
3.00%
0.49%0.00%
1Q'09 2Q'09 3Q'09 4Q'09 1Q'10 2Q'10 3Q'10 4Q'10 1Q'11 2Q'11 3Q'11 4Q'11 1Q'12 2Q'12 3Q'12
(1) Includes interest on loans and certain fees.Note: NCL rates shown are percentages of average loans. 90+DPD rates shown as percentages of EOP loans. 4

Citicorp Consumer Credit Trends by Country 3Q'12 90+ DPD Ratio NCL Ratio
Citicorp 3Q'11 2Q'12 3Q'12 3Q'11 2Q'12 3Q'12
Latam 41 7 14 4% 1 8% 1 7% 1 7% 4 4% 4 1% 4 3%
Loans ($B)
% of total Loans
Latam 41.7 14.4% 1.8% 1.7% 1.7% 4.4% 4.1% 4.3%Mexico 27.6 9.6% 1.4% 1.3% 1.5% 3.5% 3.1% 3.4%Brazi l 7.4 2.6% 3.2% 3.0% 2.7% 7.9% 8.5% 8.4%Al l Other (1) 6.7 2.3% 1.8% 1.6% 1.8% 3.4% 3.2% 3.3%
Asia 89.3 30.9% 0.5% 0.5% 0.5% 1.1% 0.9% 1.0%Korea 25 8 8 9% 0 3% 0 4% 0 4% 0 9% 1 0% 1 2%Korea 25.8 8.9% 0.3% 0.4% 0.4% 0.9% 1.0% 1.2%Austra l ia 14.4 5.0% 0.9% 1.0% 0.9% 2.1% 1.7% 1.8%Singapore 11.0 3.8% 0.1% 0.1% 0.1% 0.2% 0.3% 0.3%Hong Kong 8.8 3.0% 0.0% 0.1% 0.1% 0.5% 0.4% 0.4%India 7.3 2.5% 0.7% 0.5% 0.5% 0.9% 0.6% 0.6%Taiwan 6.4 2.2% 0.2% 0.2% 0.2% 0.1% ‐0.1% ‐0.3%M l i 5 4 1 9% 1 4% 1 3% 1 3% 0 9% 0 8% 0 7%Malays ia 5.4 1.9% 1.4% 1.3% 1.3% 0.9% 0.8% 0.7%Japan 2.9 1.0% 0.5% 0.5% 0.6% 1.9% 1.2% 1.5%China 2.7 0.9% 0.0% 0.1% 0.0% 0.0% 0.3% 0.0%Al l Other (1) 4.5 1.6% 1.7% 1.5% 1.4% 4.0% 3.0% 2.7%
EMEA 7.8 2.7% 1.6% 1.3% 1.2% 2.7% 0.7% 1.6%Poland 2 5 0 9% 1 8% 1 5% 1 4% 1 8% 0 1% 1 0%Poland 2.5 0.9% 1.8% 1.5% 1.4% 1.8% ‐0.1% 1.0%Al l Other (1) 5.3 1.8% 1.5% 1.1% 1.1% 3.2% 1.1% 1.8%
Total International 138.9 48.0% 0.9% 0.9% 0.9% 2.1% 1.9% 2.0%
North America 150.3 52.0% 1.5% 1.2% 1.2% 5.0% 4.1% 3.6%
T l GCB 289 1 100 0% 1 2% 1 0% 1 1% 3 6% 3 0% 2 8%
(1) Latam “All Other” includes Argentina, El Salvador, Costa Rica, Panama, Guatemala and several other countries in the region, none of which had 3Q’12 loans greater than $2.0 billion individually. Asia “All Other” includes Thailand, Indonesia, the Philippines, Guam and several other countries in the region, none of which had 3Q’12 loans greater than $2.0 billion individually. EMEA “All Other” includes Russia, Turkey, the U.A.E, Czech, Hungary, Egypt, Romania and several other countries in the region, none of which had 3Q’12 loans greater than $2.0 billion individually.
Total GCB 289.1 100.0% 1.2% 1.0% 1.1% 3.6% 3.0% 2.8%
5
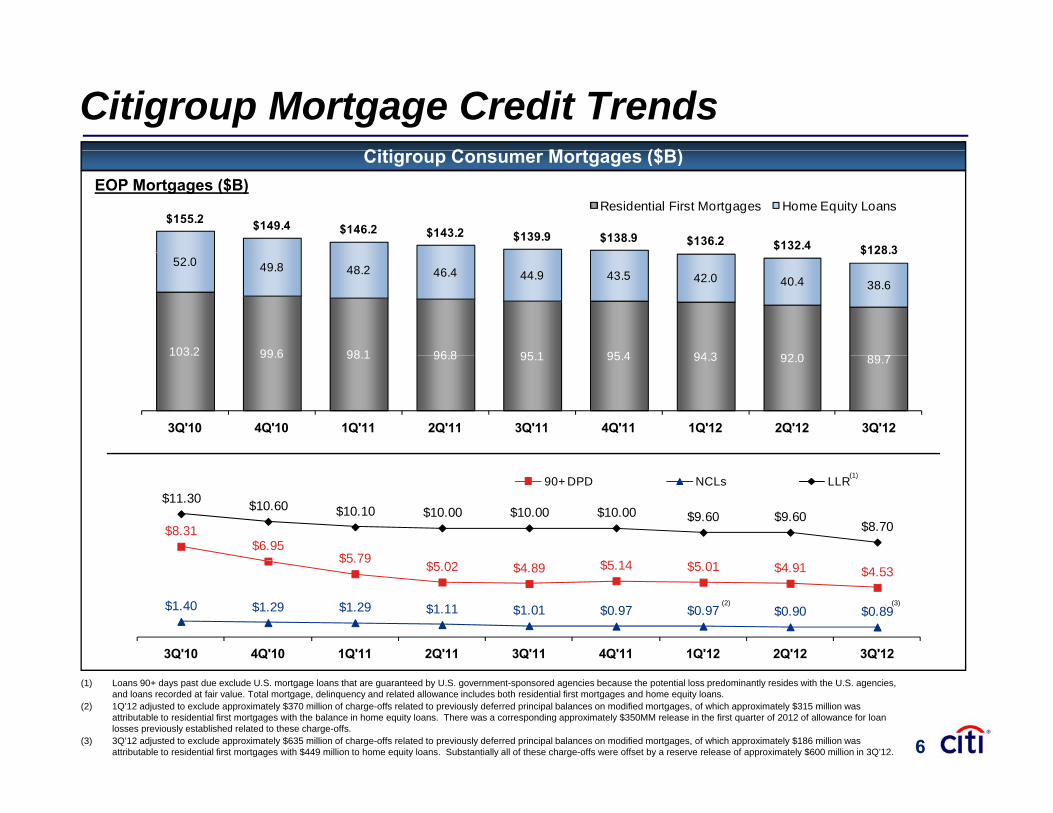
Citigroup Mortgage Credit TrendsCiti C M t ($B)
$155.2 $149.4 $146.2 $143.2 $139.9 $138.9 $136.2 $132.4 $128.3
Residential First Mortgages Home Equity Loans
Citigroup Consumer Mortgages ($B)EOP Mortgages ($B)
103.2 99 6 98 1 96 8 95 1 95 4 94 3 92 0 89 7
52.0 49.8 48.2 46.4 44.9 43.5 42.0 40.4 38.6
$128.3
103.2 99.6 98.1 96.8 95.1 95.4 94.3 92.0 89.7
3Q'10 4Q'10 1Q'11 2Q'11 3Q'11 4Q'11 1Q'12 2Q'12 3Q'12
$8.31$6.95
$5 79 $5 14
$11.30 $10.60 $10.10 $10.00 $10.00 $10.00 $9.60 $9.60$8.70
90+ DPD NCLs LLR(1)
$5.79 $5.02 $4.89 $5.14 $5.01 $4.91 $4.53
$1.40 $1.29 $1.29 $1.11 $1.01 $0.97 $0.97 $0.90 $0.89
3Q'10 4Q'10 1Q'11 2Q'11 3Q'11 4Q'11 1Q'12 2Q'12 3Q'12
(2) (3)
(1) Loans 90+ days past due exclude U.S. mortgage loans that are guaranteed by U.S. government-sponsored agencies because the potential loss predominantly resides with the U.S. agencies, and loans recorded at fair value. Total mortgage, delinquency and related allowance includes both residential first mortgages and home equity loans.
(2) 1Q’12 adjusted to exclude approximately $370 million of charge-offs related to previously deferred principal balances on modified mortgages, of which approximately $315 million was attributable to residential first mortgages with the balance in home equity loans. There was a corresponding approximately $350MM release in the first quarter of 2012 of allowance for loan losses previously established related to these charge-offs.
(3) 3Q’12 adjusted to exclude approximately $635 million of charge-offs related to previously deferred principal balances on modified mortgages, of which approximately $186 million was attributable to residential first mortgages with $449 million to home equity loans. Substantially all of these charge-offs were offset by a reserve release of approximately $600 million in 3Q’12. 6
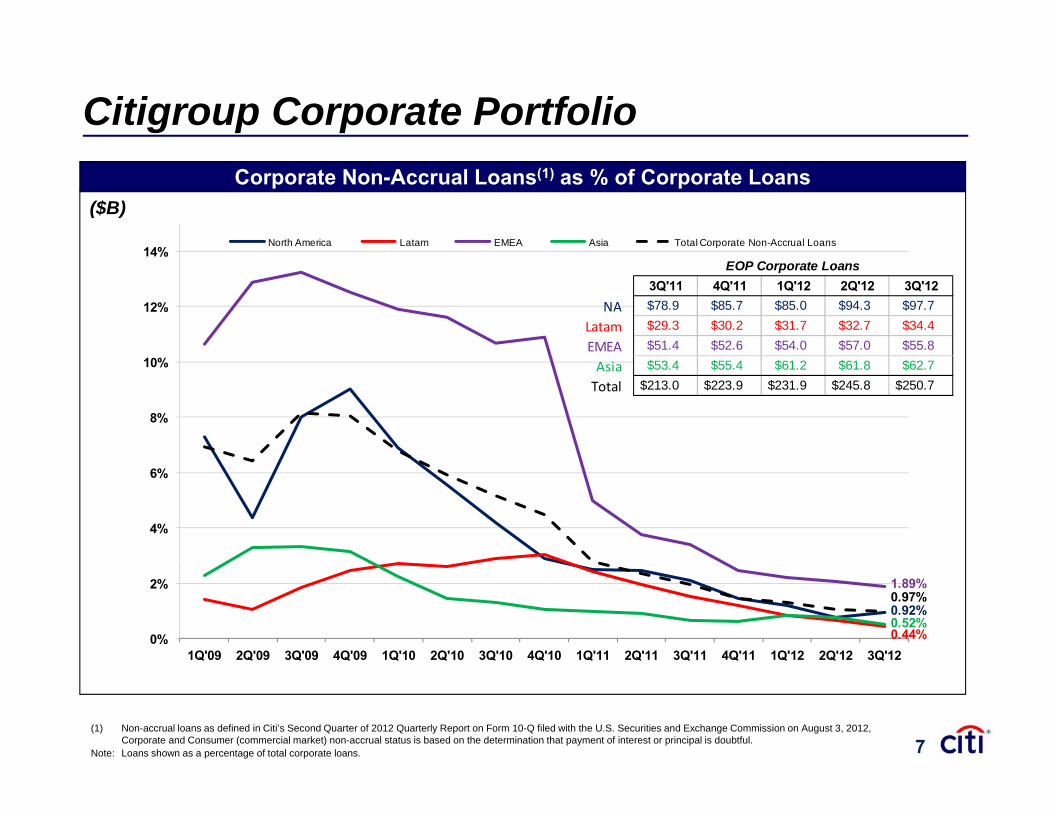
Citigroup Corporate Portfolio
14%North America Latam EMEA Asia Total Corporate Non-Accrual Loans
Corporate Non-Accrual Loans(1) as % of Corporate Loans($B)
12%
14%EOP Corporate Loans
3Q'11 4Q'11 1Q'12 2Q'12 3Q'12NA $78.9 $85.7 $85.0 $94.3 $97.7
Latam $29.3 $30.2 $31.7 $32.7 $34.4
EMEA $51.4 $52.6 $54.0 $57.0 $55.8
8%
10% Asia $53.4 $55.4 $61.2 $61.8 $62.7
Total $213.0 $223.9 $231.9 $245.8 $250.7
4%
6%
0.92%
0.44%
1.89%
0.52%
0.97%
0%
2%
1Q'09 2Q'09 3Q'09 4Q'09 1Q'10 2Q'10 3Q'10 4Q'10 1Q'11 2Q'11 3Q'11 4Q'11 1Q'12 2Q'12 3Q'12
(1) Non-accrual loans as defined in Citi’s Second Quarter of 2012 Quarterly Report on Form 10-Q filed with the U.S. Securities and Exchange Commission on August 3, 2012, Corporate and Consumer (commercial market) non-accrual status is based on the determination that payment of interest or principal is doubtful.
Note: Loans shown as a percentage of total corporate loans. 7
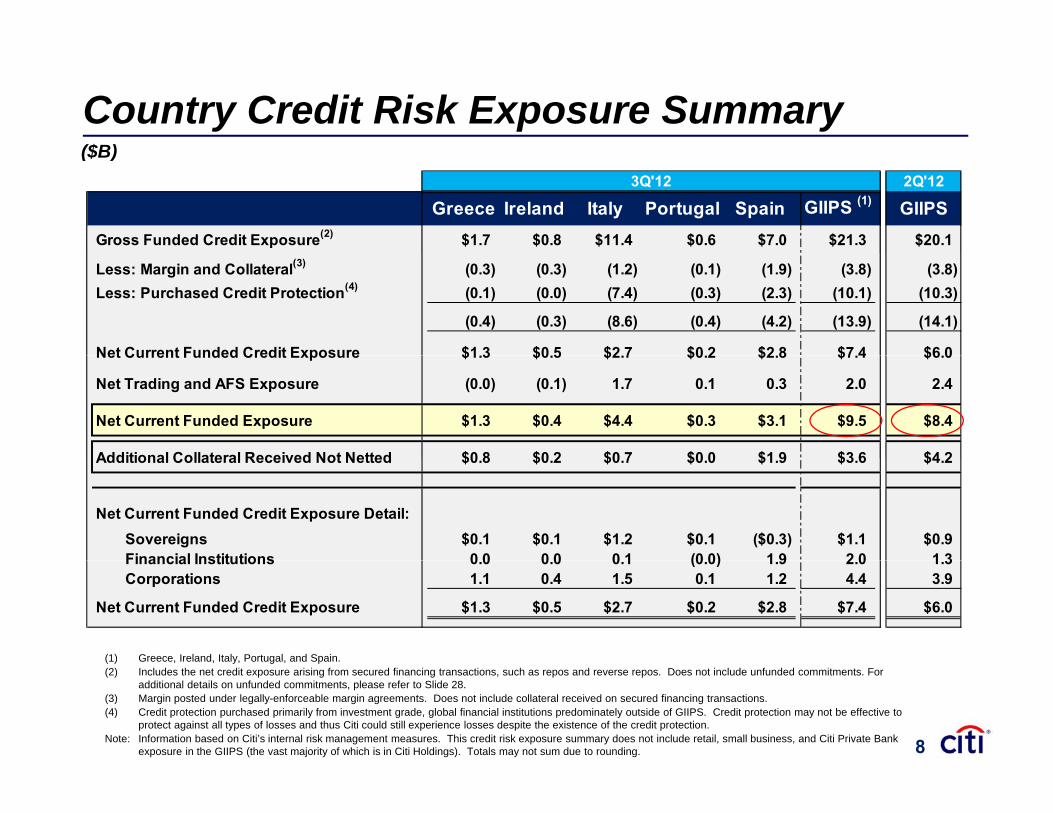
Country Credit Risk Exposure Summary($B)
3Q'12 X 2Q'12
Greece Ireland Italy Portugal Spain GIIPS (1) GIIPSGross Funded Credit Exposure(2) $1.7 $0.8 $11.4 $0.6 $7.0 $21.3 $20.1
($B)
Less: Margin and Collateral(3) (0.3) (0.3) (1.2) (0.1) (1.9) (3.8) (3.8)Less: Purchased Credit Protection(4) (0.1) (0.0) (7.4) (0.3) (2.3) (10.1) (10.3)
(0.4) (0.3) (8.6) (0.4) (4.2) (13.9) (14.1)
Net Current Funded Credit Exposure $1 3 $0 5 $2 7 $0 2 $2 8 $7 4 $6 0Net Current Funded Credit Exposure $1.3 $0.5 $2.7 $0.2 $2.8 $7.4 $6.0
Net Trading and AFS Exposure (0.0) (0.1) 1.7 0.1 0.3 2.0 2.4
Net Current Funded Exposure $1.3 $0.4 $4.4 $0.3 $3.1 $9.5 $8.4
Additional Collateral Received Not Netted $0 8 $0 2 $0 7 $0 0 $1 9 $3 6 $4 2Additional Collateral Received Not Netted $0.8 $0.2 $0.7 $0.0 $1.9 $3.6 $4.2
Net Current Funded Credit Exposure Detail:Sovereigns $0.1 $0.1 $1.2 $0.1 ($0.3) $1.1 $0.9Financial Institutions 0 0 0 0 0 1 (0 0) 1 9 2 0 1 3Financial Institutions 0.0 0.0 0.1 (0.0) 1.9 2.0 1.3Corporations 1.1 0.4 1.5 0.1 1.2 4.4 3.9
Net Current Funded Credit Exposure $1.3 $0.5 $2.7 $0.2 $2.8 $7.4 $6.0
(1) Greece, Ireland, Italy, Portugal, and Spain.( ) y g p(2) Includes the net credit exposure arising from secured financing transactions, such as repos and reverse repos. Does not include unfunded commitments. For
additional details on unfunded commitments, please refer to Slide 28. (3) Margin posted under legally-enforceable margin agreements. Does not include collateral received on secured financing transactions.(4) Credit protection purchased primarily from investment grade, global financial institutions predominately outside of GIIPS. Credit protection may not be effective to
protect against all types of losses and thus Citi could still experience losses despite the existence of the credit protection.Note: Information based on Citi’s internal risk management measures. This credit risk exposure summary does not include retail, small business, and Citi Private Bank
exposure in the GIIPS (the vast majority of which is in Citi Holdings). Totals may not sum due to rounding. 8
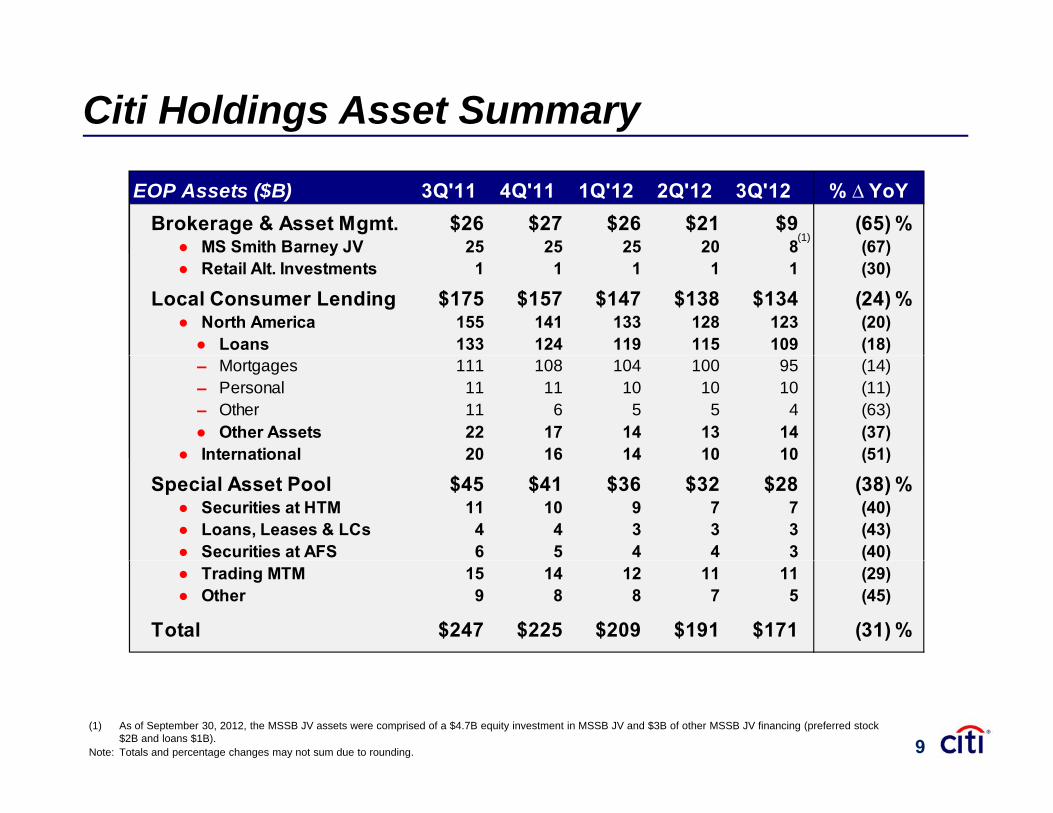
Citi Holdings Asset Summary
EOP Assets ($B) 3Q'11 4Q'11 1Q'12 2Q'12 3Q'12Brokerage & Asset Mgmt. $26 $27 $26 $21 $9 (65) %
● MS Smith Barney JV 25 25 25 20 8 (67)
% ∆ YoY
(1)y ( )● Retail Alt. Investments 1 1 1 1 1 (30)
Local Consumer Lending $175 $157 $147 $138 $134 (24) %● North America 155 141 133 128 123 (20)● Loans 133 124 119 115 109 (18)– Mortgages 111 108 104 100 95 (14)– Personal 11 11 10 10 10 (11)– Other 11 6 5 5 4 (63)● Other Assets 22 17 14 13 14 (37)
● International 20 16 14 10 10 (51)● International 20 16 14 10 10 (51)
Special Asset Pool $45 $41 $36 $32 $28 (38) %● Securities at HTM 11 10 9 7 7 (40)● Loans, Leases & LCs 4 4 3 3 3 (43)● Securities at AFS 6 5 4 4 3 (40)( )● Trading MTM 15 14 12 11 11 (29)● Other 9 8 8 7 5 (45)
Total $247 $225 $209 $191 $171 (31) %
(1) As of September 30, 2012, the MSSB JV assets were comprised of a $4.7B equity investment in MSSB JV and $3B of other MSSB JV financing (preferred stock $2B and loans $1B).
Note: Totals and percentage changes may not sum due to rounding. 9

Balance Sheet TrendsA t (1)
202$1,689 $1,649
$1,735 $1,725 $1,760
Assets (1)
Fed funds sold & securities borrowed
Cash and Deposits w/ BanksInvestments
Trading Account Assets
(EOP $B) 4%
253 263
271 283 275
186 182
207 187 202 Trading Account AssetsLoans, net of reservesOther assets (3)
306 279 297 300 306
286 273
287 270 275
465 490 498 512 522
306 279
(31)%
193 162 175 174 181 52 49 46 38 25
140 127 121 116 111
15 32 30 27 23 21
$247 $225 $209 $191 $171
3Q'11 4Q'11 1Q'12 2Q'12 3Q'12 3Q'11 4Q'11 1Q'12 2Q'12 3Q'12(2) (2)3Q 11 4Q 11 1Q 12 2Q 12 3Q 12 3Q 11 4Q 11 1Q 12 2Q 12 3Q 12
(1) Quarterly segment balance sheet data is disclosed in Citigroup’s Forms 10-Q filed with the U.S. Securities and Exchange Commission. (2) Preliminary. (3) Includes brokerage receivables, goodwill, intangibles, mortgage servicing rights (MSRs) and assets related to discontinued operations held for sale.Note: Totals may not sum due to rounding.
Citicorp & Corp/Other Holdings
10

Loan TrendsCitigroup Loans (1)
($B EOP Loans)
Citi
YoY%YoY%
Ex-FX(4)
$155 141 134 128 122
$637 $647 $648 $655 $658
670
770
Citi Holdings
Citi Holdings(21)%
Citigroup3%
Citicorp
3%
(21)%
150 159 160 167 172
58 60 68 76 76$483 $507 $514 $527 $537
370
470
570
Citicorp Corporate
11%
19%
Citicorp10%
19%
150 156 150 150 150
7 7 7 7 835 37 40 40 4284 87 88 87 89
70
170
270 Citicorp ConsumerCiticorp4%
Int’l Consumer10% 7%
5%
NA C150 156 150 150 150
-30
70
3Q'11 4Q'11 1Q'12 2Q'12 3Q'12GCB Asia
Transaction Services(3)Securities & Banking(2)GCB North America GCB Latin AmericaGCB EMEA
Citi Holdings
NA Consumer1%
(1) Reported loans net of unearned income as disclosed in Citigroup's Third Quarter 2012 Quarterly Financial Data Supplement furnished as an exhibit to Form 8-K filed with the U.S. Securities and Exchange Commission on October 15, 2012. Global Consumer Banking numbers include both credit cards and retail banking.
(2) Corporate loans. (3) Includes trade finance loans. (4) Excluding the impact of foreign exchange translation into constant U.S. dollars for reporting purposes (FX). Expressed at September 30, 2012 exchange rates. Note: Totals may not sum due to rounding. 11

Average Deposits($B)
YoY%Citigroup
Average Rate on Total Deposits (excluding deposit insurance and FDIC assessment)(1)
YoY%Ex-FX(3)
0.90% 0.86% 0.85% 0.86% 0.85% 0.80% 0.76% 0.72% 0.70%
114 115 115 112 111 113 121 12079 77 76 73 70 66 63 63 65$837 $850 $854 $868 $861 $857 $869 $893 $921
Corp/Other
Holdings
Holdings(7)%
7%
(6)%
10%
331 344 346 357 358 362 370 386 406
116 114 115 115 112 111Securities& Banking
Transaction Services Citi
11%
301 306 310 318 316 314 319 318 324Global
Consumer
Services Citicorp8%
301 306 310 318 316 314 3 9 318
3Q'10 4Q'10 1Q'11 2Q'11 3Q'11 4Q'11 1Q'12 2Q'12 3Q'12(2)
Banking
Total Citigroup Deposits (EOP)YoY%
YoY%Ex-FX(3)
(1) Average rate is calculated as annualized interest (excluding deposit insurance and FDIC assessment) divided by average deposits.(2) Preliminary. (3) Excluding the impact of foreign exchange translation into constant U.S. dollars for reporting purposes (FX). Expressed at September 30, 2012 exchange rates. Note: Totals may not sum due to rounding.
11%Total Citigroup Deposits (EOP)
$850 $845 $866 $866 $851 $866 $906 $914 $945 10%
12
5.50%
6.50%
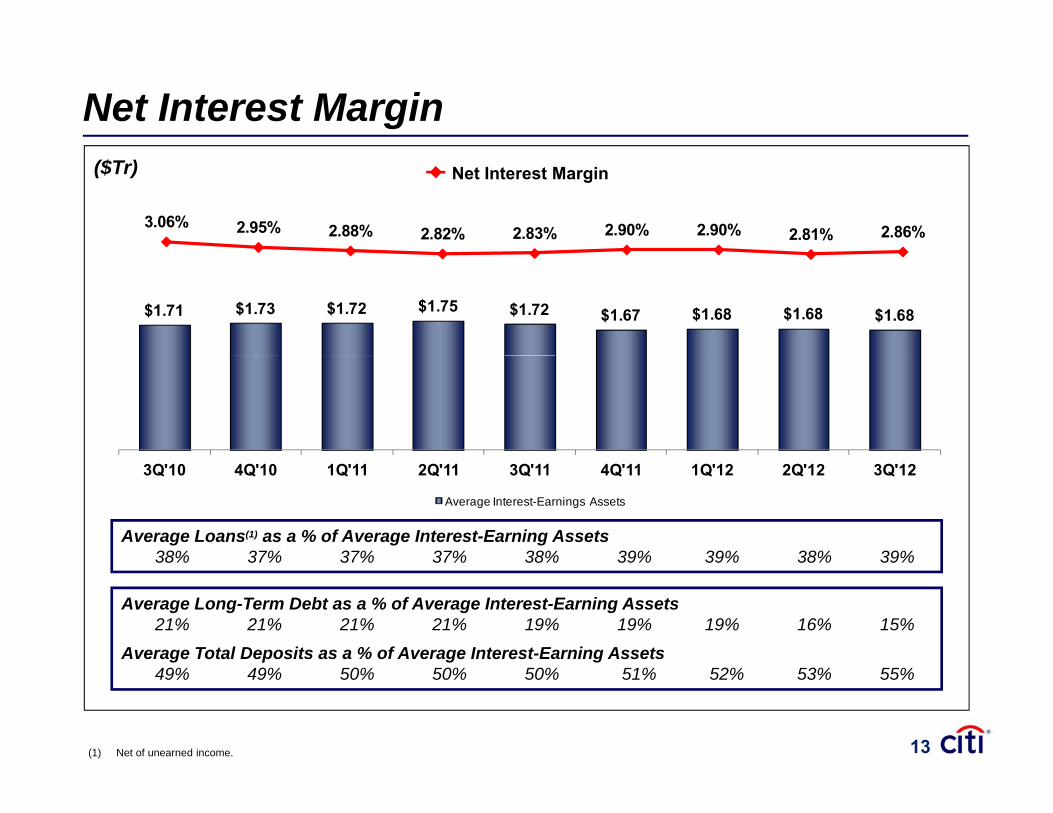
Net Interest Margin
1.80 2.00 3.06% 2.95% 2.88% 2.82% 2.83% 2.90% 2.90% 2.81% 2.86%
3.50%
4.50% ($Tr) Net Interest Margin
$1.71 $1.73 $1.72 $1.75 $1.72 $1.67 $1.68 $1.68 $1.68
0 801.00 1.20 1.40 1.60 2.50%
-0.20 0.40 0.60 0.80
3Q'10 4Q'10 1Q'11 2Q'11 3Q'11 4Q'11 1Q'12 2Q'12 3Q'12
Average Interest-Earnings Assets
Average Loans(1) as a % of Average Interest-Earning Assets38% 37% 37% 37% 38% 39% 39% 38% 39%38% 37% 37% 37% 38% 39% 39% 38% 39%
Average Long-Term Debt as a % of Average Interest-Earning Assets21% 21% 21% 21% 19% 19% 19% 16% 15%
Average Total Deposits as a % of Average Interest-Earning Assets
(1) Net of unearned income.
49% 49% 50% 50% 50% 51% 52% 53% 55%
13

Liquidity & Funding Strategy
Bank Non-Bank
Maintain ample cash and readilymarketable, highly liquid
securities on hand to meet
Maintain ample cash and readilymarketable, highly liquid
securities on hand to meet Liquidity
Buffershort-term funding obligations short-term funding obligations
Largely use cost-effective deposits to fund both
Use modest amount of short-term funding for highly liquiddeposits to fund both
liquid assets and loans
Supplement the funding of bank entities with long-term
term funding for highly liquid assets
Continue to primarily fund non-bank businesses with long-term
Funding Components
gsecured debt and equity
gunsecured debt and equity
14
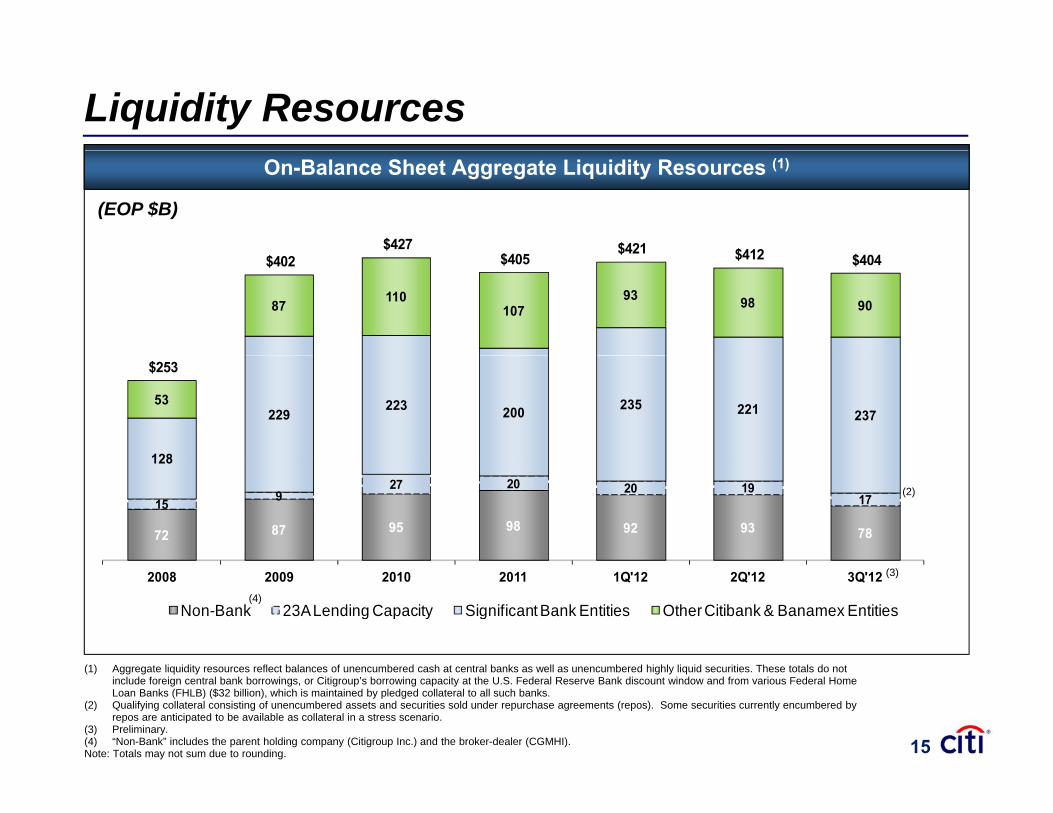
Liquidity Resources
$427 $421 $412
On-Balance Sheet Aggregate Liquidity Resources (1)
(EOP $B)
87 110107
93 98 90
$402 $405 $421 $412 $404
128
229223 200 235 221 237
53
$253
72 87 95 98 92 93 78
15 927 20 20 19
17
128
(2)
2008 2009 2010 2011 1Q'12 2Q'12 3Q'12
Non-Bank 23A Lending Capacity Significant Bank Entities Other Citibank & Banamex Entities
(3)
(4)
(1) Aggregate liquidity resources reflect balances of unencumbered cash at central banks as well as unencumbered highly liquid securities. These totals do not include foreign central bank borrowings, or Citigroup’s borrowing capacity at the U.S. Federal Reserve Bank discount window and from various Federal Home Loan Banks (FHLB) ($32 billion), which is maintained by pledged collateral to all such banks.
(2) Qualifying collateral consisting of unencumbered assets and securities sold under repurchase agreements (repos). Some securities currently encumbered by repos are anticipated to be available as collateral in a stress scenario.
(3) Preliminary. (4) “Non-Bank” includes the parent holding company (Citigroup Inc.) and the broker-dealer (CGMHI).Note: Totals may not sum due to rounding. 15

Liquidity Pool ManagementComposition of Aggregate Liquidity Resources
$412 $404450
(EOP $B)
123139
$ $404
300
350
400
35%Cash
Citi’s liquidity pool is managed centrally to ensure that Citi’s asset / liability profile and liquidity
7167
7773
150
200
250 35%U.S Treasuries/ Agencies
positions are appropriate
Citi has a conservative investment posture with ~35% of its liquidity pool invested in cash,
8 5
133 120
0
50
100
(1)1%
30%
q y pand ~35% in U.S. government securities; remaining foreign government securities are held in local countries and funded with l l d i2Q'12 3Q'12
Foreign Government (2)
(1) local depositsCash on Deposit with Central Banks
U.S. Agency / Government GuaranteedU.S. Treasuries
Foreign Government (2)
(1) Preliminary.(2) Foreign government securities include foreign government agencies, multinationals and foreign government guaranteed securities. Note: Totals may not sum due to rounding.
Investment Grade Corporate/ ABS
16

Basel III Liquidity Coverage Ratio (LCR) Citi’s Basel III LCR is among the highest of all banks – above the proposed minimum ratio of
100%.
Citi’s Basel III LCR Estimates:
~126%~117% ~116%
Citi s Basel III LCR Estimates:
Proposed Basel III LCR
Minimum Requirement100%
4Q’11 Industry Average (2) Stock of High Quality
(Unencumbered) Liquid Assets
N t C h O tfl O A t
q100%
91%
Net Cash Outflows Over an Acute 30-Day Stressed Time Period
1Q'12 2Q'12 3Q'12 (1)
(1) Preliminary.(2) BCBS Industry results of the Quantitative Impact Study from Basel for 102 banks in group 1 (banks with Tier 1 Capital in excess of €3bn, well diversified and
internationally active) as of December 31, 2011.Note: Citigroup’s estimated Basel III Liquidity Coverage Ratio (LCR) is a non-GAAP financial measure. The LCR estimate is calculated in accordance with the Basel
Committee on Banking Supervision "Basel III: International framework for liquidity risk measurement, standards and monitoring." According to the Basel III guidelines, the LCR is to be calculated by dividing the stock of high quality (unencumbered) liquid assets by the estimate of net cash outflows over an acute 30-day stressed time period. 17

Funding ProfileT l Li bili i & E i
1,200 1,200
4747 39 30 42 39 53
35 33 30
$1,183$1,115
$1,1701,200 ($B)
Total Liabilities & Equity
800
1,000
800
1,000
117 83
62 56 55
47 47 47
800
1,000
400
600
162 182 185
34 30 16
51 55 50
$635 $642$573
400
600
850 851 945
400
600
$165 $179 $189200 270 251 210
22 23 20
95 102 91
200 200
-3Q'10 3Q'11 3Q'12
-3Q'10 3Q'11 3Q'12
-3Q'10 3Q'11 3Q'12
Bank (1,3)
DepositsSecured Financing Brokerage Payables (4)Trading Account Liabilities S-T BorrowingsL-T Debt Other Liabilities Total Equity
Non-Bank (2,3) Equity (3)
Discontinued Operations
(1) “Bank” units include Citibank, N.A., Citicorp Trust Bank, and Banamex. (2) “Non-Bank” includes the parent holding company (Citigroup Inc.) and the balances of Citigroup Funding Inc. (CFI), CGMHI (the broker-dealer), Citicorp Treasury and
all other remaining non-bank balances. (3) 3Q’12 data is preliminary. (4) The “Bank” graph includes small amounts of brokerage payables each quarter, which may not be apparent due to the scale of the graph.Note: Totals may not sum due to rounding. 18

Long-Term Debt Outstanding($B)By Product:
25
158 157 152147 142
$334 $324 $311$288 $272
~$240-250
(3)29 29 29 29 2916 16 16 16 1111 11 11 18 1751 49 43 36 34
44 38 35 17 14
25 23 26 25 26 245
3Q'11 4Q'11 1Q'12 2Q'12 3Q'12 4Q'12ESecuritizationsSenior (Fixed & Floating) TLGPStructured Notes (1)
TruPSFHLB Projected Outstandings (2)
Bank vs. Non-Bank:
Subordinated
$334 $324 $311
3Q 11 4Q 11 1Q 12 2Q 12 3Q 12 4Q 12E
Non-Bank
Bank
Projected Outstandings (2)
251 246 239 223 210
83 78 72 65 62
$311 $288 $272~$240-250
Outstandings ( )
(3)
Weighted Average Maturity (years)(4) 6.6 7.1 6.9 7.0 7.0
3Q'11 4Q'11 1Q'12 2Q'12 3Q'12 4Q'12E
(1) Includes long-term (original maturity greater than one year) fixed/floating rate debt obligations that have been selected for fair value accounting and structured notes.(2) Preliminary forecast balances; not actual.(3) Preliminary.(4) Weighted average maturity shown includes Bank and Non-Bank long-term debt with remaining life greater than 1 year. Includes unsecured long-term debt but
excludes trust preferred securities.Note: Totals do not include subordinated capital notes, capital lease obligations and employee deferred awards; in total, there was less than $1 billion of these obligations
outstanding for all periods shown. Totals may not sum due to rounding.19

Maturities & Issuance of Long-Term Debt
~$(78)
70.0
80.0
90.0 Non-TLGP Maturities
($B) TLGP Maturities Projected Issuance Actual Issuance
Buybacks / Tenders / Redemptions
N t LTD
(20.3)
(38.0) $(50.6)
40.0
50.0
60.0
Net LTD Reduction,
$(36)
Net LTD Reduction,
~$(62)
(~17)
(27.1)
(23.4)
12.8
$15.1 ~$16
$(25.1) $(26.4)
10.0
20.0
30.0
TBD TBD(3.3) -IssuanceMaturities
FY 2011 FY 2013 (2) FY 2014 (2)
IssuanceMaturities
FY 2012(1)
IssuanceMaturities IssuanceMaturities
TBD TBD
YTD'12Maturities ($47.0)
(1) Maturities data for YTD’12 and full year 2012 shows expected maturities. Long-term debt issuance data for YTD’12 includes $8.6B for parent holding company
($ )Buybacks/ Tenders /Redemptions (13.5)
Issuance 12.8 Net LTD Reduction ($47.7)
(Citigroup Inc.) and $4.2B of Citigroup Funding Inc. (CFI). Long-term debt YTD’12 issuance shown above does not include (a) $1.1B of certain structured notes (such as equity-linked and credit-linked notes) with early redemption features effective within one year, (b) $1.7B of non-US affiliate issuance, (c) $7.5B of FHLB borrowings.
(2) 2013 and 2014 maturities data reflects expected maturities, and (d) $0.5 billion of securitization issuance.Note: Maturities data is for total Citigroup Inc., excluding (a) securitizations; (b) FHLB expected maturities of $2.7B, $11.8B, and $1.0B in 2012, 2013 and 2014, respectively;
and (c) expected non-U.S. affiliate issuance of $4.8B in 2012, and maturities of $5.5B, $3.7B and $3.9B in 2012, 2013 and 2014, respectively. Expected aggregate annual maturities for total Citigroup Inc., as disclosed in Citigroup’s 2011 Annual Report on Form 10-K filed with the U.S. Securities and Exchange Commission on February 24, 2012, were $83.9B for 2012, $46.3B for 2013, and $38.0B for 2014. Totals may not sum due to rounding. 20

200 0200 0
Capital Structure ComponentsR l C i l Q lif i A ($B)
160.0
180.0
200.0
160.0
180.0
200.0
Tier 2 S b di t d
($B)
Regulatory Capital Qualifying Amounts ($B)
$1.8$10.4
$18.8
120.0
140.0
$0.3 $0.3$15.9 $10.4
$19.3$18.8
120.0
140.0Capital
$31.2B(2)Trust Preferreds
Preferreds
Subordinated Debt
PreferredsTrust Preferreds
Subordinated Debt
Non-Common
Tier 1
$124 260 0
80.0
100.0
$124 4 $124 260 0
80.0
100.0
Common Stockholders’
Tier 1 Capital
$135 8B(4)Tier 1
CommonCommon Stockholders’
Capital $10.7B
$124.2
20.0
40.0
60.0$124.4 $124.2
20.0
40.0
60.0Equity$135.8B( )Common
$124.2B(3)StockholdersEquity
0.03Q'12 Pro Forma
0.02Q'12 3Q'12
(1) Qualifying amounts refers to how much of each indicated security class is included in the calculation of each capital measure under current regulatory guidelines
(5)
(1) Qualifying amounts refers to how much of each indicated security class is included in the calculation of each capital measure under current regulatory guidelines. (2) Tier 2 Capital also includes a portion of the allowance for credit losses of $12.4B not shown on this chart. (3) Qualifying amount of common stockholders’ equity reflects adjustments and is also principally reduced by disallowed deferred tax assets, goodwill, and other
disallowed intangible assets. (4) Tier 1 Capital also includes qualifying noncontrolling interests of $0.9B not shown on this chart. On July 18, 2012 Citigroup redeemed Citigroup Capital XII and
Citigroup Capital XXI pursuant to a regulatory capital event. On August 15, 2012, Citigroup redeemed Citigroup Capital XIX which had become contractually callable.(5) 3Q’12 pro forma includes issuance of $1.5 billion of preferred stock on October 22, 2012.Note: Totals may not sum due to rounding. 21

Key Capital Metrics
16.1% 16.6% 17.0% 17.2% 16.9% 17.0% 17.6% 17.7% 17.1%
12.5% 12.9% 13.3% 13.6% 13.5% 13.5% 14.3% 14.5% 13.9%
10 8%11.3% 11.6% 11.7% 11.8% 12.5% 12.7% 12.7%
10.3% 10.8%
7.2% 7.9% 8.6%
3Q'10 4Q'10 1Q'11 2Q'11 3Q'11 4Q'11 1Q'12 2Q'12 3Q'12
Basel I Total Capital Basel I Tier 1 Capital Basel I Tier 1 Common Basel III Tier 1 Common
(2)
(1)
Basel I Risk-Weighted Assets ($B)
$104 $105 $112 $115 $115 $115 $122 $124 $124
Basel I Tier 1 Common Capital ($B)
$1,004 $978 $992 $993 $984 $973 $974 $978 $975
Basel I Risk Weighted Assets ($B)
(1) Citigroup’s estimated Basel III Tier 1 Common ratio is a non-GAAP financial measure. For additional information regarding Citigroup’s estimated Basel III Tier 1 Common Ratio, including the calculation of the ratio, please refer to Slide 35.
(2) Preliminary. 22

Summary
Strength in core businesses
• Positive operating leverage in core businesses, and for total Citigroupbusinesses
St it l b• Basel I Tier 1 Common ratio of 12.7%(1)
• Year-over-year loan and deposit growth
Strong capital base • Estimated Basel III Tier 1 Common ratio of 8.6%(1)
• Estimated Basel III LCR ofRobust structural liquidity
• Estimated Basel III LCR of approximately 116%(2), comfortably above proposed requirement
Modest issuance needs
• Negative net issuance, and significant reductions in long-term debt in 2012
(1) Preliminary.(2) Preliminary, as of September 30, 2012. Citigroup's estimated Basel III Liquidity Coverage Ratio (LCR) is a non-GAAP financial measure. The LCR estimate is
calculated in accordance with the Basel Committee on Banking Supervision "Basel III: International framework for liquidity risk measurement, standards and monitoring." According to the Basel III guidelines, the LCR is to be calculated by dividing the stock of high quality (unencumbered) liquid assets by the estimate of net cash outflows over an acute 30-day stressed time period. 23

APPENDIX
25. Significant P&L Items 32. Trust Preferreds Outstanding
Table of Contents
26. N.A. Consumer Cards
27. Citigroup – International Consumer Credit
33. Capital (Basel I)
34. Ratings
35 Non GAAP Financial Measures28. Country Credit Risk Exposure
Summary (continued)
29. Balance Sheet Quality
35. Non-GAAP Financial Measures –Reconciliations
36. Non-GAAP Financial Measures --Reconciliations9 a a ce S eet Qua ty
30. Assets
31. Liabilities & Equity
eco c at o s
37. Non-GAAP Financial Measures --Reconciliations
24

Significant P&L Items ($MM except per share)($MM, except per share)
Impact of:Adjusted
CVA / DVA(1) MSSB(2) T It (3)3Q’12 As Reported Results(4)CVA / DVA(1) MSSB(2) Tax Items(3)
Revenue $13,951 $(776) $(4,684) - $19,411
Net Income 468 (485) (2 897) 582 3 268Net Income 468 (485) (2,897) 582 3,268
Diluted EPS $0.15 $(0.16) $(0.94) $0.19 $1.06
(1) Credit valuation adjustment (CVA) on derivatives, net of hedges, and debt valuation adjustment (DVA) on Citigroup's fair value option debt. (2) The $(4.7)B consisted of a pre-tax loss on the sale of the 14% interest in the Morgan Stanley Smith Barney JV (MSSB) and other than temporary impairment on
Citi’s remaining 35% interest in MSSB, recorded in Brokerage and Asset Management within Citi Holdings. (3) Tax benefit in 3Q’12 related to the resolution of certain tax audit items, recorded in Corporate / Other.(4) Adjusted results, as used throughout this presentation, are non-GAAP financial measures. For a reconciliation of the adjusted results to the reported results for
Citigroup as well as each applicable business segment, please refer to Slide 37. 25

$
N.A. Consumer CardsCiti-Branded Cards – Citicorp ($B)
$1.88$1.67
90+ DPD NCLs EOP 3Q’11 2Q’12 3Q’12Loans $75.1 $72.7 $72.2
$1.81$1.60
$1.44
$1.21$1.06
$1.02 $0.98
$0.83
$0.76$1.35
$1.23 $1.10
$0.99 $0.90
$0.84
$0.75$
3Q'10 4Q'10 1Q'11 2Q'11 3Q'11 4Q'11 1Q'12 2Q'12 3Q'12
Citi Retail Services Cards – Citicorp ($B)
$1.45$1.35
$1.11$0 91 $0 90 $0 95
90+ DPD NCLs EOP 3Q’11 2Q’12 3Q’12Loans $37.9 $36.6 $36.6
$0.91 $0.90 $0.95$0.85
$0.72 $0.72$1.18 $1.12
$0.93$0.83
$0.69 $0.68 $0.67 $0.61 $0.53
3Q'10 4Q'10 1Q'11 2Q'11 3Q'11 4Q'11 1Q'12 2Q'12 3Q'12
26

Citigroup – International Consumer Credit
Loans % of Total % of Total ($B) Loans 3Q'12 2Q'12 3Q'12 2Q'12 NCLs
Citicorp
3Q'12 90+DPD Ratio NCL Ratio
Mexico $27.6 19.9% 1.5% 1.3% 3.4% 3.1% 33.4%Korea 25.8 18.6% 0.4% 0.4% 1.2% 1.0% 11.6%Australia 14.4 10.3% 0.9% 1.0% 1.8% 1.7% 9.4%Singapore 11.0 7.9% 0.1% 0.1% 0.3% 0.3% 1.1%Hong Kong 8.8 6.3% 0.1% 0.1% 0.4% 0.4% 1.4%Hong Kong 8.8 6.3% 0.1% 0.1% 0.4% 0.4% 1.4%Brazil 7.4 5.3% 2.7% 3.0% 8.4% 8.5% 22.1%India 7.3 5.3% 0.5% 0.5% 0.6% 0.6% 1.6%Taiwan 6.4 4.6% 0.2% 0.2% (0.3)% (0.1)% (0.6)%Malaysia 5.4 3.9% 1.3% 1.3% 0.7% 0.8% 1.4%Japan 2 9 2 1% 0 6% 0 5% 1 5% 1 2% 1 6%Japan 2.9 2.1% 0.6% 0.5% 1.5% 1.2% 1.6%
84.3% 0.8% 0.8% 1.9% 1.8% 83.0%
Citi HoldingsSpain $2.8 31.8% 4.6% 4.2% 4.8% 5.5% 27.9%UK 2.3 26.1% 4.0% 4.1% 1.1% 0.8% 5.3%Japan 1.5 17.0% 2.4% 2.2% 4.1% 5.7% 13.6%Greece 1.2 13.6% 6.8% 6.7% 18.8% 21.9% 46.5%
88.6% 4.3% 4.1% 5.7% 6.8% 93.2%
Note: Totals may not sum due to rounding. For 3Q’12, Citicorp total end of period international consumer loans were $138.8B and total NCLs were $0.7B; Citi Holdings total end of period loans were $8.8B and total NCLs were $0.1B. Citi Holdings includes international Local Consumer Lending. 27

Country Credit Risk Exposure Summary (continued)($B)($B)
3Q'12 X 2Q'12
Greece Ireland Italy Portugal Spain GIIPS (1) GIIPS (1)
Sovereigns $0.0 $0.0 $0.0 $0.0 $0.0 $0.0 $0.3Financial Institutions 0 0 0 0 0 1 0 0 0 2 $0 3 1 1Financial Institutions 0.0 0.0 0.1 0.0 0.2 $0.3 1.1Corporations, Net of Hedges 0.3 0.6 2.8 0.2 2.4 $6.3 7.7
Net Unfunded Commitments (2) $0.4 $0.6 $3.0 $0.2 $2.5 $6.6 $9.1
(1) Greece, Ireland, Italy, Portugal, and Spain.(2) Unfunded commitments net of approximately $700 million of purchased credit protection as of September 30, 2012.Note: Information based on Citi’s internal risk management measures. Totals may not sum due to rounding. 28
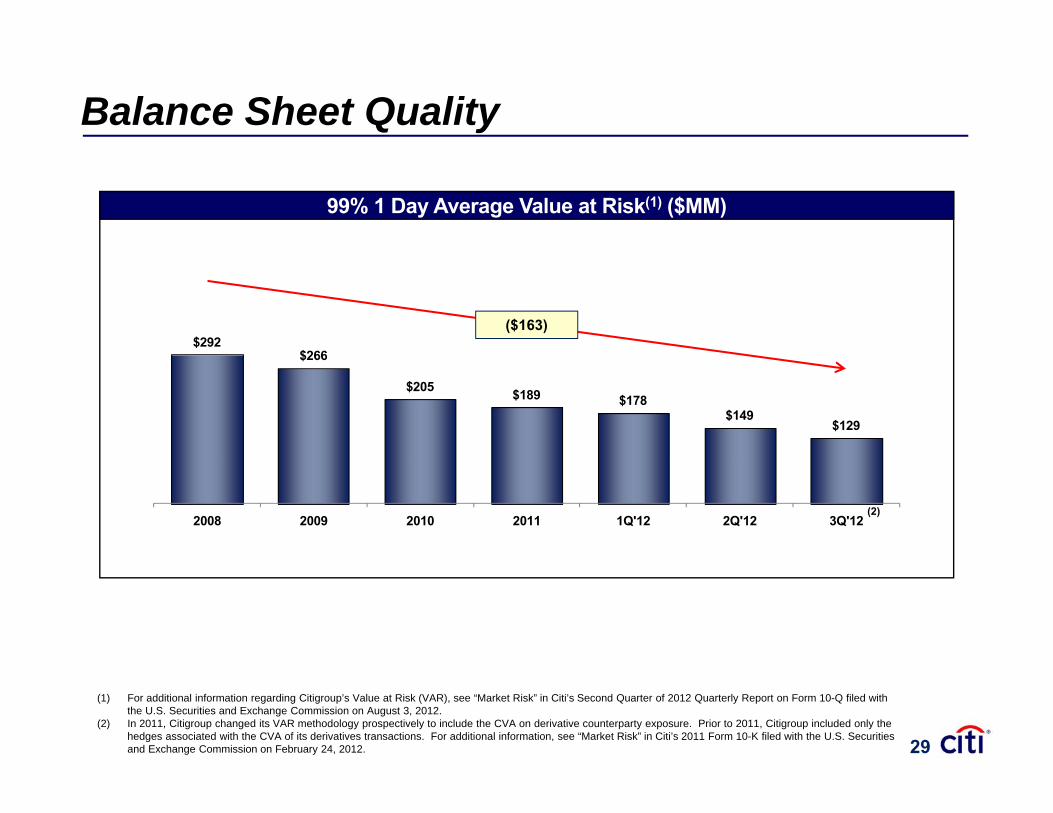
Balance Sheet Quality
c99% 1 Day Average Value at Risk(1) ($MM)
$292$266
($163)
$266
$205 $189 $178$149
$129
2008 2009 2010 2011 1Q'12 2Q'12 3Q'12(2)
(1) For additional information regarding Citigroup’s Value at Risk (VAR), see “Market Risk” in Citi’s Second Quarter of 2012 Quarterly Report on Form 10-Q filed with the U.S. Securities and Exchange Commission on August 3, 2012.
(2) In 2011, Citigroup changed its VAR methodology prospectively to include the CVA on derivative counterparty exposure. Prior to 2011, Citigroup included only the hedges associated with the CVA of its derivatives transactions. For additional information, see “Market Risk” in Citi’s 2011 Form 10-K filed with the U.S. Securities and Exchange Commission on February 24, 2012. 29

Assets(EOP $B)
176190 191 184 188
184 210 189 204
$1,983$1,914 $1,948 $1,957 $1,936
$1,874$1,944 $1,916 $1,931
2100
37 41
240247 261 284 291 276 289 273 278
340318 327 310 287
293 297 306 295
184
1600
337 317 323 322 321 292 307 310 315
3731 41 41 38 28 39 35 31
600
1100
31177 168 167 169 174 151 150 144 144
34 34 34 34 32 32 32 32 32
611 608 601 613 605 617 619 627 633
100
600
(1)
Other Assets (2)
Loans, net
Goodwill & Intangible AssetsInvestments
Fed Funds Sold & Secured Lending
Trading Account AssetsBrokerage Receivables
Cash and Deposits with Banks
Discontinued Operations
31
-400
3Q'10 4Q'10 1Q'11 2Q'11 3Q'11 4Q'11 1Q'12 2Q'12 3Q'12
(1) Preliminary. (2) Other assets includes mortgage servicing rights (MSRs).Note: Totals may not sum due to rounding.
Goodwill & Intangible Assets Fed Funds Sold & Secured Lending Discontinued Operations
30

Liabilities & Equity(EOP $B)
$1,983$1,914 $1,948 $1,957 $1,936 $1,874
$1,944 $1,916 $1,931
850 845 866 866 851866 906 914 945
87 79 79 73 66 54 56
142 129 146 152 149 126 136 129 130
192 190 188 204 224 198 226 215 224
165 166 173 179 179 180 184 186 189160 125 119 130 133 126 126 126 123
387 381 377 352 334 324 311 288 272
79 79 73 66 54 56 59 49 130
(1)
DepositsTrading Account LiabilitiesLong-Term Debt
Short-Term Borrowings Other Liabilities (2)
Total Equity
165 166 173 179 179 180 184 186 189
3Q'10 4Q'10 1Q'11 2Q'11 3Q'11 4Q'11 1Q'12 2Q'12 3Q'12
(1) Preliminary.(2) Other liabilities also includes brokerage payables and liabilities related to discontinued operations held for sale. Note: Totals may not sum due to rounding.
Fed Funds Purchased & Secured FinancingTrading Account LiabilitiesShort Term Borrowings Other Liabilities
31
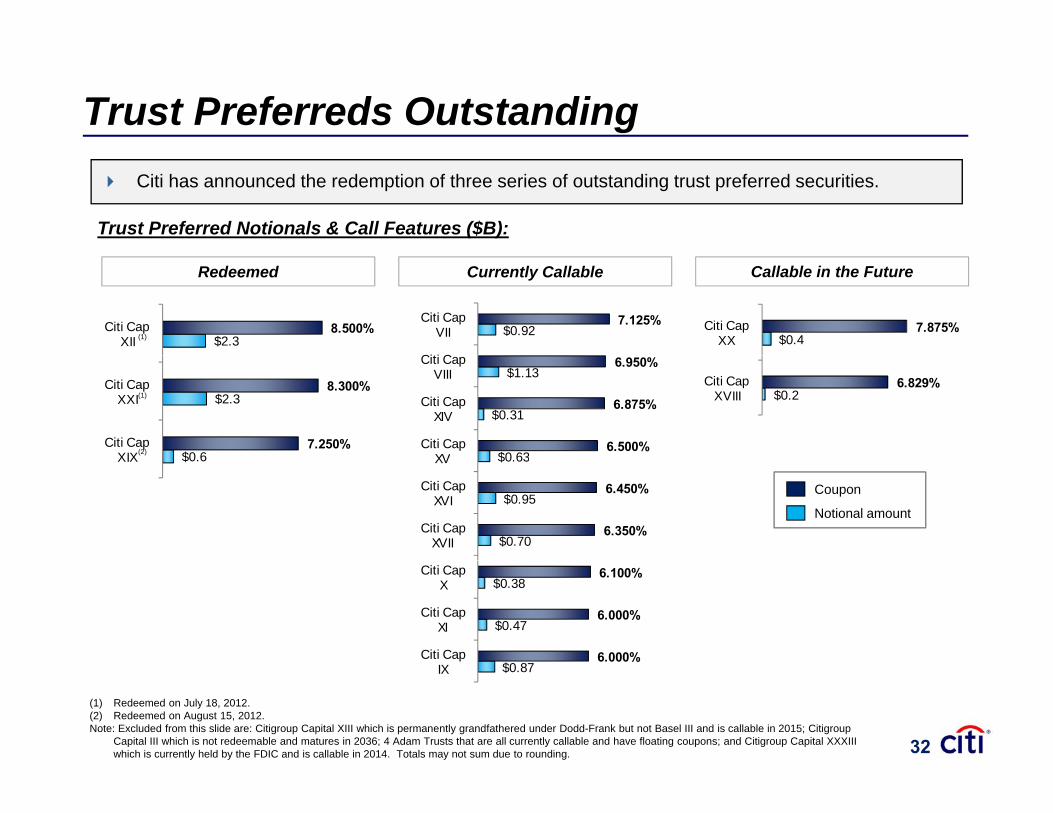
Trust Preferreds Outstanding Citi has announced the redemption of three series of outstanding trust preferred securities.
Trust Preferred Notionals & Call Features ($B):
$2.38.500% Citi Cap
XII
Currently Callable Callable in the FutureRedeemed
(1) $0.47.875% Citi Cap
XX7.125%
$0.92
Citi C
Citi Cap VII
$0 6
$2.3
7.250%
8.300%
Citi Cap XIX
Citi Cap XXI(1)
(2)
$0.26.829%
- 5.000
Citi Cap XVIII
6.500%
6.875%
6.950%
$0 63
$0.31
$1.13
Citi Cap XV
Citi Cap XIV
Citi Cap VIII
$0.6
- 5.000
XIX
Coupon
Notional amount6.350%
6.450%
$0.70
$0.95
$0.63
Citi Cap XVII
Citi Cap XVI
XV
6.000%
6.000%
6.100%
$0 87
$0.47
$0.38
Citi Cap
Citi Cap XI
Citi Cap X
(1) Redeemed on July 18, 2012. (2) Redeemed on August 15, 2012.Note: Excluded from this slide are: Citigroup Capital XIII which is permanently grandfathered under Dodd-Frank but not Basel III and is callable in 2015; Citigroup
Capital III which is not redeemable and matures in 2036; 4 Adam Trusts that are all currently callable and have floating coupons; and Citigroup Capital XXXIII which is currently held by the FDIC and is callable in 2014. Totals may not sum due to rounding.
$0.87
- 5.00
IX
32
T ibl C E it (1) B l I Ti 1 C
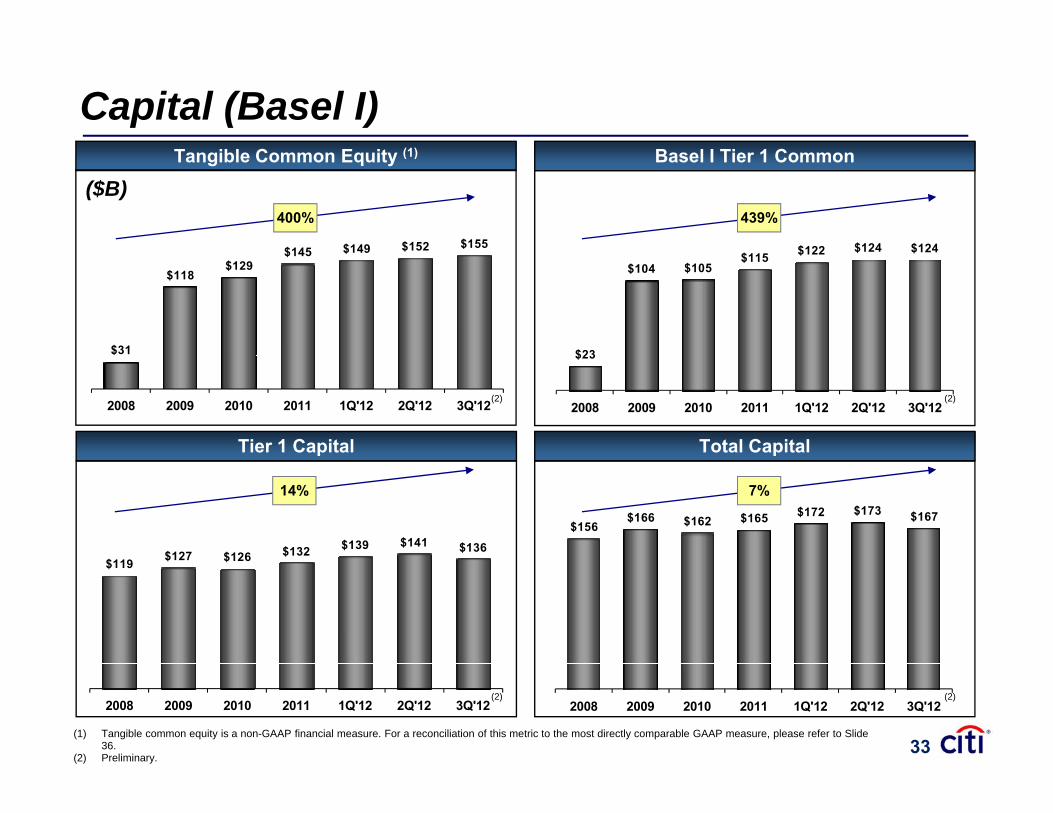
Capital (Basel I)
$ $122 $124 $124$140.0
$160.0
$180.0
$200.0
$145 $149 $152 $155$160 0$180.0$200.0
Tangible Common Equity (1) Basel I Tier 1 Common
($B)400% 439%
$23
$104 $105$115 $122 $ $
$40.0
$60.0
$80.0
$100.0
$120.0
$31
$118$129
$145 $
$40 0$60.0$80.0
$100.0$120.0$140.0$160.0
$23
$0.0
$20.0
2008 2009 2010 2011 1Q'12 2Q'12 3Q'12$0.0
$20.0$40.0
2008 2009 2010 2011 1Q'12 2Q'12 3Q'12
Tier 1 Capital Total Capital
(2) (2)
$156$166 $162 $165 $172 $173 $167
$140.0$160.0$180.0$200.0
$119 $127 $126 $132 $139 $141 $136$140.0$160.0$180.0$200.0 14% 7%
$40.0$60.0$80.0
$100.0$120.0
$119 $ $126
$40.0$60.0$80.0
$100.0$120.0$
$0.0$20.0
2008 2009 2010 2011 1Q'12 2Q'12 3Q'12$0.0
$20.0
2008 2009 2010 2011 1Q'12 2Q'12 3Q'12
(1) Tangible common equity is a non-GAAP financial measure. For a reconciliation of this metric to the most directly comparable GAAP measure, please refer to Slide 36.
(2) Preliminary.
(2) (2)
33

Ratings
*
*
Ratings Summary Rating Outlook Rating Outlook Rating OutlookCitigroup Inc.
Senior Debt A Stable A- Negative Baa2 Negative
Commercial Paper F1 A-2 P-2 Negative
Moody'sS&PFitch
* CGML / CGMI l d h t t ti A / A 1
Commercial Paper F1 A-2 P-2 Negative
Citibank, N.A.Long-Term Obligations A Stable A Negative A3 Negative
Short-Term Obligations F1 A-1 P-2 Negative
– Fitch: On October 16, 2012, Fitch noted the change in Citi’s senior management as an unexpected, but credit-neutral, event that will likely have no material impact on the bank's credit profile or ratings in the near term. On October 10, 2012, Fitchaffirmed the long- and short-term ratings of ‘A/F1' and the Viability Rating of ‘a-’ for Citigroup Inc. and Citibank, N.A.. The Rating Outlook is Stable. This rating action was taken in conjunction with Fitch’s periodic review on the 13 Global Trading and Universal Banks (GTUBs). Fitch noted that the positive rating drivers for Citi included improved liquidity, funding,
* CGML / CGMI long- and short-term ratings are A / A-1.
and Universal Banks (GTUBs). Fitch noted that the positive rating drivers for Citi included improved liquidity, funding, capitalization and more streamlined businesses, all partly driven by regulation.
– Standard & Poor’s: On October 16, 2012, S&P noted that Citi’s ratings remain unchanged despite senior management changes. On November 29, 2011, following a review of Citigroup Inc. under S&P’s revised bank criteria (published Nov. 9, 2011), the issuer credit rating was lowered on Citigroup to ‘A-/A-2’ from ‘A/A-1’, and Citibank, N.A. to ‘A/A-1’ from ‘A+/A-1’. Per S&P, the ratings reflected Citi’s strong business position, adequate capital and earnings, moderate risk position, average f di d d t li idit S&P t Citi Gl b l M k t I d Citi Gl b l M k t Li it d t ‘A/A 1’funding and adequate liquidity. S&P rates Citigroup Global Markets Inc. and Citigroup Global Markets Limited at ‘A/A-1’.
– Moody’s: On October 16, 2012, Moody’s affirmed the long- and short-term ratings of Citigroup Inc. and Citibank, N.A., but changed Citibank’s outlook from stable to negative following senior management changes. On June 21, 2012, Moody’s announced the outcomes of its review of 15 banks and securities firms with global capital markets operations, including Citi.Moody’s downgraded Citi’s long-term ratings by 2 notches. Citigroup Inc. was downgraded from ‘A3/P-2’ to ‘Baa2/P-2’, and Citibank N A was downgraded from ‘A1/P-1’ to ‘A3/P-2’ Moody’s action was based on their industry-wide re-evaluation ofCitibank, N.A. was downgraded from A1/P 1 to A3/P 2 . Moody s action was based on their industry wide re evaluation of risks surrounding the investment banking operating model, and was part of a reset of ratings for more than 100 banks, globally.
34

Non-GAAP Financial Measures – Reconciliations(In millions of dollars) 9/30/2012(1) 6/30/2012 3/31/2012
Citigroup's Common Stockholders' Equity $186,465 $183,599 $ 181,508
Add: Qualifying Minority Interests 161 150 163Regulatory Capital Adjustments
Less:Accumulated net unrealized losses on cash flow hedges, net of tax (2,503) (2,689) (2,600)
Cumulative change in fair value of financial liabilities attributableto the change in own creditworthiness, net of tax 998 1,649 1,422
Intangible AssetsIntangible AssetsGoodwill(2) 27,248 29,108 30,697
Identifiable intangible assets other than mortgageservicing assets (MSAs) 5,983 6,156 6,413
Defined benefit pension plan net assets 752 910 873
Deferred tax assets (DTAs) arising from net operating losses andDeferred tax assets (DTAs) arising from net operating losses andforeign tax credit carry forwards 23,000 21,800 22,130
Excess over 10% / 15% limitations for other DTAs, certain common equity investments, and MSAs(3) 24,719 27,951 31,190
Total Basel III Tier 1 Common Capital(4) $106,429 $98,864 $91,546
Note:(1) Preliminary.(2) Includes goodwill embedded in the valuation of significant common stock investments in unconsolidated financial institutions.
Basel III Risk-Weighted Assets (RWA)(5) $1,238,889 $1,250,233 $1,271,701
Basel III Tier 1 Common Capital Ratio(4) 8.6% 7.9% 7.2%
35
( ) g g(3) Aside from MSAs, reflects DTAs arising from temporary differences and significant common stock investments in unconsolidated financial institutions.(4) Calculated based on the U.S. regulators proposed rules relating to Basel III (NPR). Citigroup's estimated Basel III Tier 1 Common Capital and Tier 1 Common Capital
Ratio are based on its current interpretation, expectations, and understanding of the respective Basel III requirements and are necessarily subject to final regulatory clarity and rulemaking, model calibration, and other implementation guidance in the U.S.
(5) The estimated Basel III risk-weighted assets have been calculated based on the proposed "advanced approaches" for determining risk-weighted assets under the NPR, as well as the final U.S. market risk capital rules (Basel II.5). 35
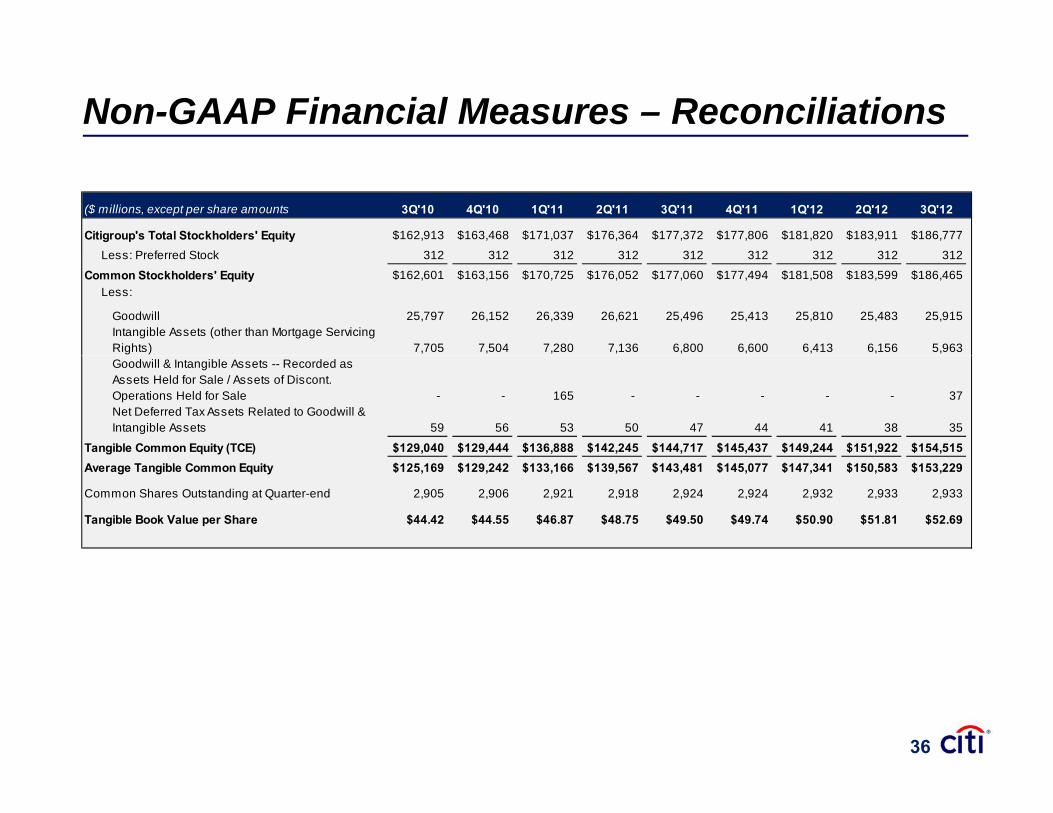
Non-GAAP Financial Measures – Reconciliations
($ millions, except per share amounts 3Q'10 4Q'10 1Q'11 2Q'11 3Q'11 4Q'11 1Q'12 2Q'12 3Q'12
Citigroup's Total Stockholders' Equity $162,913 $163,468 $171,037 $176,364 $177,372 $177,806 $181,820 $183,911 $186,777
Less: Preferred Stock 312 312 312 312 312 312 312 312 312Less: Preferred Stock 312 312 312 312 312 312 312 312 312
Common Stockholders' Equity $162,601 $163,156 $170,725 $176,052 $177,060 $177,494 $181,508 $183,599 $186,465Less:
Goodwill 25,797 26,152 26,339 26,621 25,496 25,413 25,810 25,483 25,915Intangible Assets (other than Mortgage Servicing Rights) 7,705 7,504 7,280 7,136 6,800 6,600 6,413 6,156 5,963Goodwill & Intangible Assets -- Recorded as Assets Held for Sale / Assets of Discont. Operations Held for Sale - - 165 - - - - - 37Net Deferred Tax Assets Related to Goodwill & Intangible Assets 59 56 53 50 47 44 41 38 35
Tangible Common Equity (TCE) $129,040 $129,444 $136,888 $142,245 $144,717 $145,437 $149,244 $151,922 $154,515Average Tangible Common Equity $125,169 $129,242 $133,166 $139,567 $143,481 $145,077 $147,341 $150,583 $153,229
Common Shares Outstanding at Quarter-end 2,905 2,906 2,921 2,918 2,924 2,924 2,932 2,933 2,933
Tangible Book Value per Share $44.42 $44.55 $46.87 $48.75 $49.50 $49.74 $50.90 $51.81 $52.69
36

Non-GAAP Financial Measures – Reconciliations($MM)
Citigroup 3Q'12 2Q'12 3Q'11 Citi Holdings 3Q'12 2Q'12 3Q'11Reported Revenues (GAAP) 13,951$ 18,642$ 20,831$ Reported Revenues (GAAP) (3,690)$ 924$ 1,127$ Impact of: Impact of:
CVA/DVA (776) 219 1,938 CVA/DVA 23 21 50 MSSB (4,684) - - MSSB (4,684) - -Akbank - (424) - Adjusted Revenues 971$ 903$ 1 077$
($MM)
Akbank - (424) - Adjusted Revenues 971$ 903$ 1,077$ Adjusted Revenues 19,411$ 18,847$ 18,893$
Reported Net Income (GAAP) (3,562)$ (920)$ (1,228)$ Reported Net Income (GAAP) 468$ 2,946$ 3,771$ Impact of: Impact of: CVA / DVA 14 13 31
CVA / DVA (485) 140 1,203 MSSB (2,897) - -MSSB (2,897) - - Adjusted Net Income (679)$ (933)$ (1,259)$ Akbank - (274) -Tax Item 582 - - Corporate / Other 3Q'12 2Q'12 3Q'11
Adjusted Net Income 3,268$ 3,080$ 2,568$ Reported Revenues (GAAP) 33$ (265)$ 300$ Impact of:
Citicorp 3Q'12 2Q'12 3Q'11 Akbank - (424) -Reported Revenues (GAAP) 17,608$ 17,983$ 19,404$ Adjusted Revenues 33$ 159$ 300$ Impact of:p
CVA/DVA (799) 198 1,888 Reported Net Income (GAAP) (94)$ (437)$ (32)$ Adjusted Revenues 18,407$ 17,785$ 17,516$ Impact of:
Akbank - (274) -Reported Net Income (GAAP) 4,124$ 4,303$ 5,031$ Tax Item 582 - -Impact of: Adjusted Net Income (676)$ (163)$ (32)$
CVA/DVA (499) 127 1,172 Adj t d N t I 4 623$ 4 176$ 3 859$ S iti & B ki 3Q'12 2Q'12 3Q'11Adjusted Net Income 4,623$ 4,176$ 3,859$ Securities & Banking 3Q'12 2Q'12 3Q'11
Reported Revenues (GAAP) 4,770$ 5,405$ 6,725$ Impact of:
CVA/DVA (799) 198 1,888 Adjusted Revenues 5,569$ 5,207$ 4,837$
Reported Net Income (GAAP) 1,120$ 1,402$ 2,142$ Impact of:
CVA/DVA (499) 127 1,172 Adjusted Net Income 1,619$ 1,275$ 970$
37
Certain statements in this document are “forward-looking statements” within the meaning of
the rules and regulations of the U.S. Securities and Exchange Commission. These
statements are based on management’s current expectations and are subject to uncertainty
and changes in circumstances. These statements are not guarantees of future results or
occurrences. Actual results and capital and other financial condition may differ materially
from those included in these statements due to a variety of factors, including the
precautionary statements included in this document and those contained in Citigroup’s filings p y g p g
with the U.S. Securities and Exchange Commission, including without limitation the “Risk
Factors” section of Citigroup’s 2011 Form 10-K. Any forward-looking statements made by or
on behalf of Citigroup speak only as to the date they are made, and Citi does not undertake
to update forward-looking statements to reflect the impact of circumstances or events that
arise after the date the forward-looking statements were made.arise after the date the forward looking statements were made.