five year financial forecast may 2012 cleveland municipal school district the primary goal of the...
TRANSCRIPT
1
FIVE YEAR FINANCIAL FORECASTMAY 2012
Cleveland Municipal School District
The primary goal of the Cleveland Municipal School District is to become a premier school district in the United States of
America.
2
Five Year Forecast - Contents
Major AssumptionsGeneral Fund RevenuesGeneral Fund ExpendituresFive Year Forecast Summary
3
Cleveland Municipal School District
Major Assumptions

4
Major Assumptions
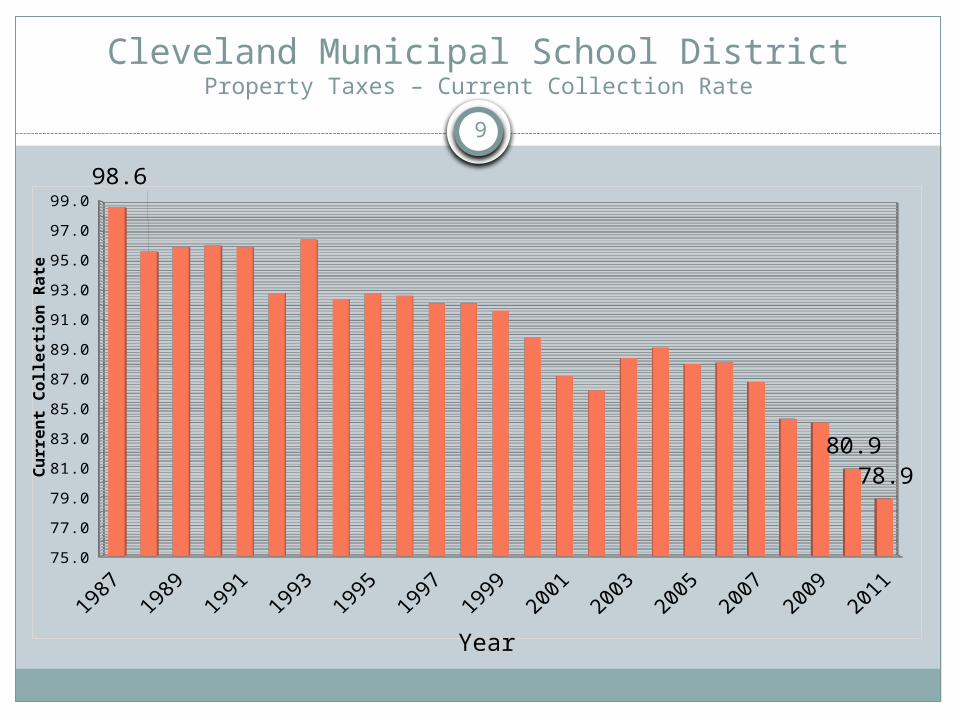
Revenue: Forecast assumes that the property tax current collection rate will
remain at 78.87%. In 2012 Cuyahoga County will complete the six year reappraisal of
all property. The impact on the district should be minimal. Forecast uses the bridge formula to determine state funding in all
years. Forecast assumes the Average Daily Membership for K-12 to be:
FY12 – 40,758FY13 – 38,854FY 14 – 37,548FY15 – 36,300FY 16 – 35,448
Forecast assumes that Charter School ADM will increase 1,100 students each year.
Forecast assumes no new levy revenue.

5
Major Assumptions continued
Expenditures: Forecast assumes a total of 2,591 classroom teachers in FY13 (2,316
are budgeted within the General Fund). Forecast assumes April layoffs are permanent. Forecast budgets 50 less employees each year in FY14-16. Healthcare rates are forecasted to increase 7.7% in FY13 and 9.7%
in FY14-16. Forecast assumes all union agreements as currently defined. Charter School Pass-Through increases $8.4 million each year. Forecast assumes costs and savings from Employee Separation Plan. One-time or temporary budget closure recommendations were
limited to less than 25%.

6
Cleveland Municipal School District
General Fund Revenues

7
Cleveland Municipal School DistrictFY 2011-2012
Local Taxes; 22.4%
State; 64.7%
Education Jobs; 2.7%
Property Tax Allo-
cation, 6.1%
Other; 4.1%
Where the Money Comes From
8
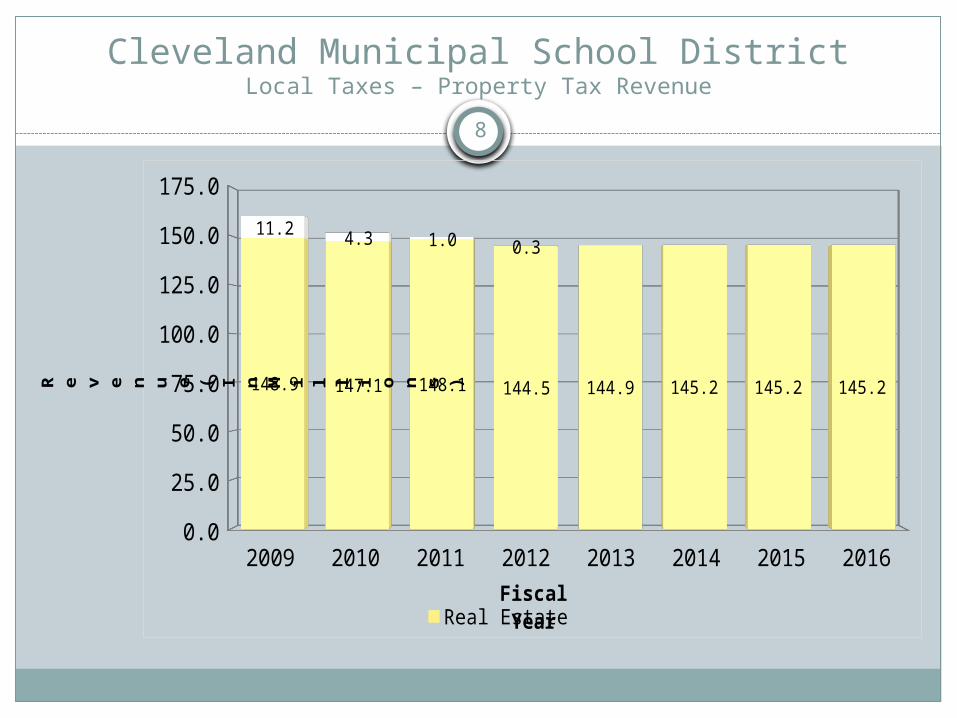
Cleveland Municipal School DistrictLocal Taxes – Property Tax Revenue
2009 2010 2011 2012 2013 2014 2015 20160.0
25.0
50.0
75.0
100.0
125.0
150.0
175.0
148.9 147.1 148.1 144.5 144.9 145.2 145.2 145.2
11.2 4.3 1.0 0.3
Real Estate Personal TangibleFiscal Year
R e v e n u e ( I n M i l l i o n s )
9
Cleveland Municipal School DistrictProperty Taxes – Current Collection Rate
75.0
77.0
79.0
81.0
83.0
85.0
87.0
89.0
91.0
93.0
95.0
97.0
99.098.6
80.978.9
Cu
rren
t C
oll
ecti
on
Rate
Year
10
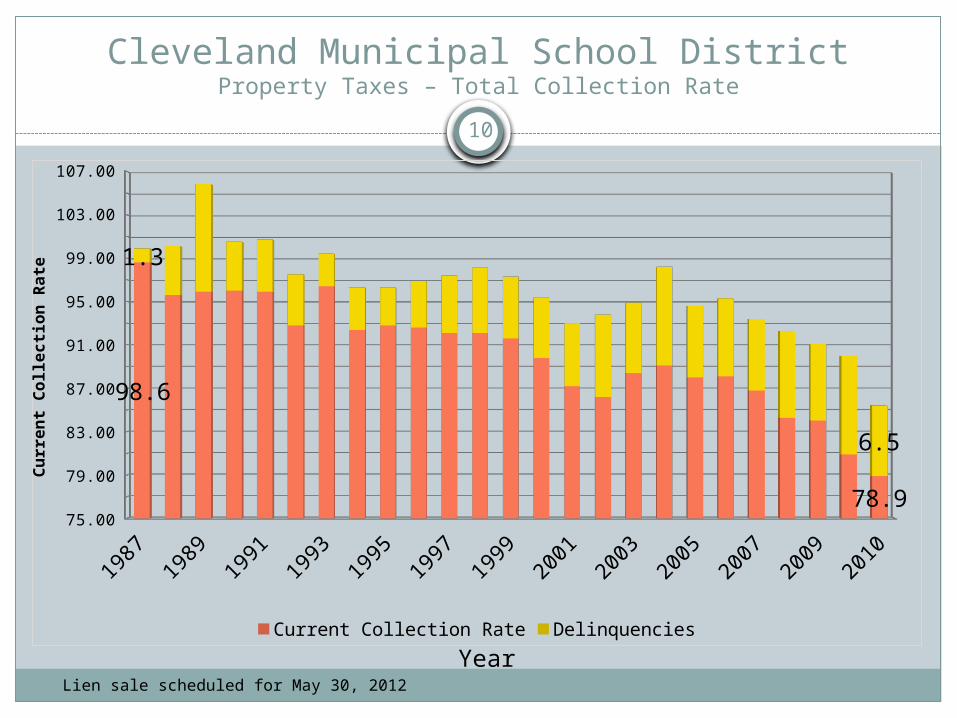
Cleveland Municipal School DistrictProperty Taxes – Total Collection Rate
1987
1989
1991
1993
1995
1997
1999
2001
2003
2005
2007
2009
2010
75.0077.0079.0081.0083.0085.0087.0089.0091.0093.0095.0097.0099.00
101.00103.00105.00107.00
98.6
78.9
1.3
6.5
Current Collection Rate Delinquencies
Cu
rren
t C
oll
ecti
on
Rate
YearLien sale scheduled for May 30, 2012

11
Cleveland Municipal School DistrictState Foundation Revenue
2009 2010 2011 2012 2013 2014 2015 2016$400
$405
$410
$415
$420
$425
$430
$435
$440
437.2
411.3404.5
417.8413.9 412.4 411.4 413.1
27.334.1
State Foundation Fiscal Stabilization Fund
Reve
nu
e (
In M
illi
on
s)
Fiscal Year

12
Cleveland Municipal School DistrictState Foundation Revenue – Excluding Charter School Portion
2009 2010 2011 2012 2013 2014 2015 2016$250
$260
$270
$280
$290
$300
$310
$320
$330
$340
$350
341.2
313.0298.5 301.0
288.7278.8
269.4 262.7
27.3
34.1
State Foundation Fiscal Stabilization Fund
Reve
nu
e (
In M
illi
on
s)
Fiscal Year

13
Cleveland Municipal School DistrictEducation Jobs
2009 2010 2011 2012 2013 2014 2015 2016$0
$5
$10
$15
$20
17.7
Education Jobs
R e v e n u e ( I n M i l l i o n s )
Fiscal Year
14
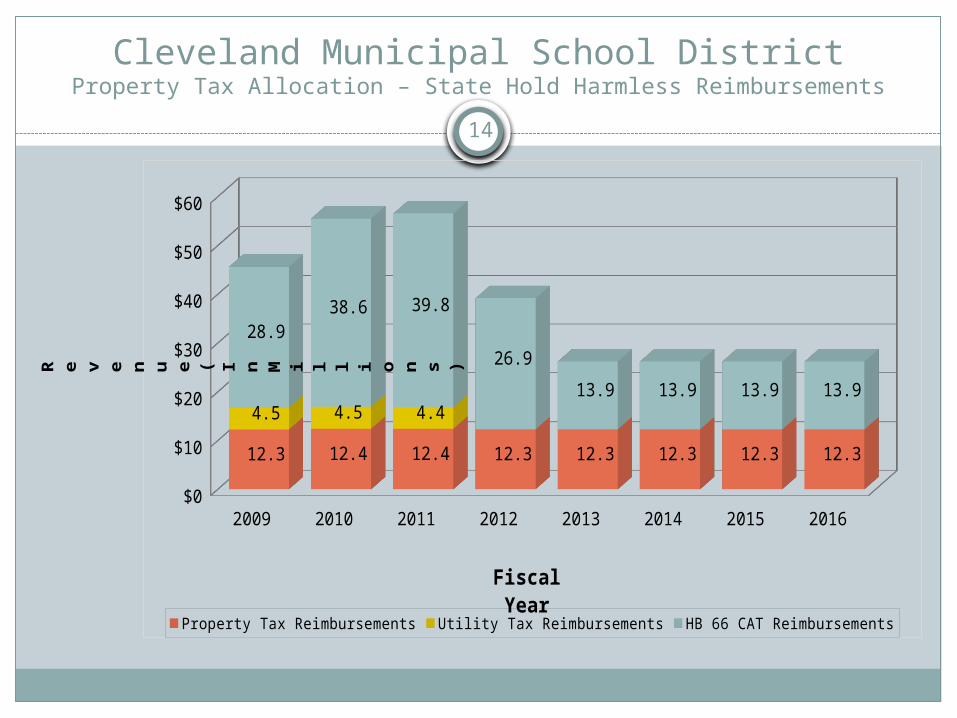
Cleveland Municipal School DistrictProperty Tax Allocation – State Hold Harmless Reimbursements
2009 2010 2011 2012 2013 2014 2015 2016$0
$10
$20
$30
$40
$50
$60
12.3 12.4 12.4 12.3 12.3 12.3 12.3 12.3
4.5 4.5 4.4
28.938.6 39.8
26.9
13.9 13.9 13.9 13.9
Property Tax Reimbursements Utility Tax Reimbursements HB 66 CAT Reimbursements
R e v e n u e ( I n M i l l i o n s )
Fiscal Year
15
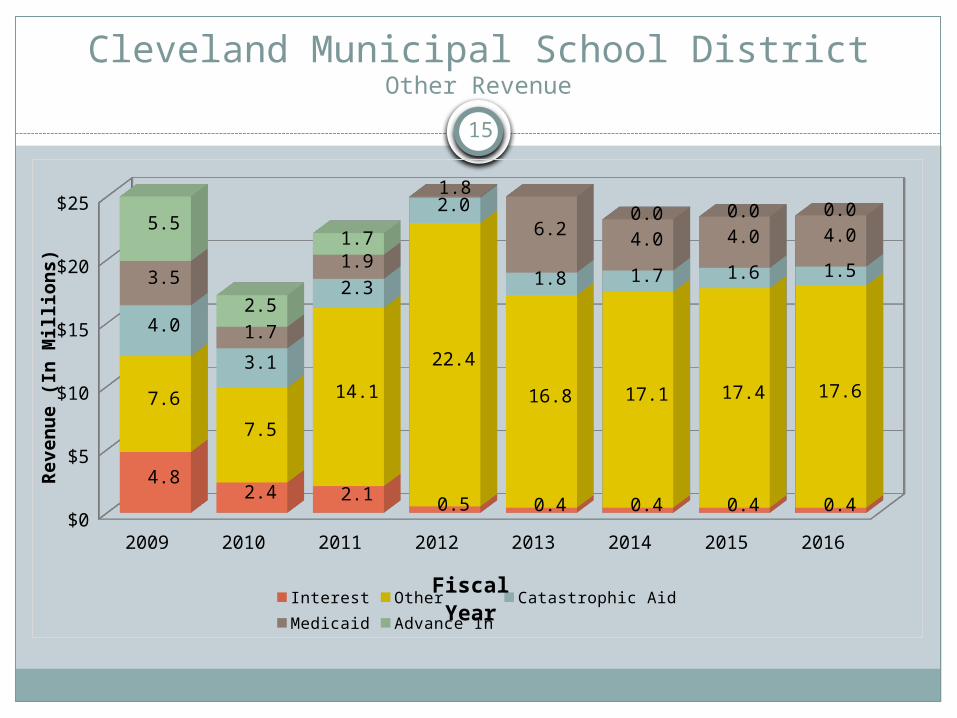
Cleveland Municipal School DistrictOther Revenue
2009 2010 2011 2012 2013 2014 2015 2016$0
$5
$10
$15
$20
$25
4.82.4 2.1 0.5 0.4 0.4 0.4 0.4
7.6
7.5
14.1
22.4
16.8 17.1 17.4 17.6
4.0
3.1
2.3
2.0
1.8 1.7 1.6 1.53.5
1.7
1.9
1.8
6.2 4.0 4.0 4.05.5
2.5
1.70.0 0.0 0.0
Interest Other Catastrophic Aid Medicaid Advance In
Fiscal Year
Reve
nu
e (
In M
illi
on
s)

16
Cleveland Municipal School DistrictTotal Revenue – Excluding Charter School Portion
2009 2010 2011 2012 2013 2014 2015 2016$0
$100
$200
$300
$400
$500
$600
160.0 151.4 149.1 144.8 144.9 145.2 145.2 145.2
341.2 340.3 332.6 301.0 288.7 278.8 269.4 262.7
45.6 55.5 56.639.2
26.2 26.2 26.2 26.2
19.9 14.7 20.426.6
25.2 23.2 23.4 23.5
5.5 2.5 1.73.5
1
17.7
Property Tax State Foundation Ed JobsState Reimbursement Other Advance In
Reve
nu
e (
In M
illi
on
s)
Fiscal Year

17
Cleveland Municipal School District
General Fund Expenditures

18
Cleveland Municipal School DistrictWhere the Money Goes
Salaries & Bene-fits; 429109425;
65.4%
Charter School Pass-Through; 116800000;
17.8%
All Other; 109888855;
16.8%
FY 2011-2012

19
Cleveland Municipal School DistrictSalaries
2009 2010 2011 2012 2013 2014 2015 2016$250
$270
$290
$310
$330
$350
$370
360.2 359.3
312.7 309.0
286.9 286.2 287.0 287.9
Salaries
Fiscal Year
E x p e n d i t u r e s ( I n M i l l i o n s )
20
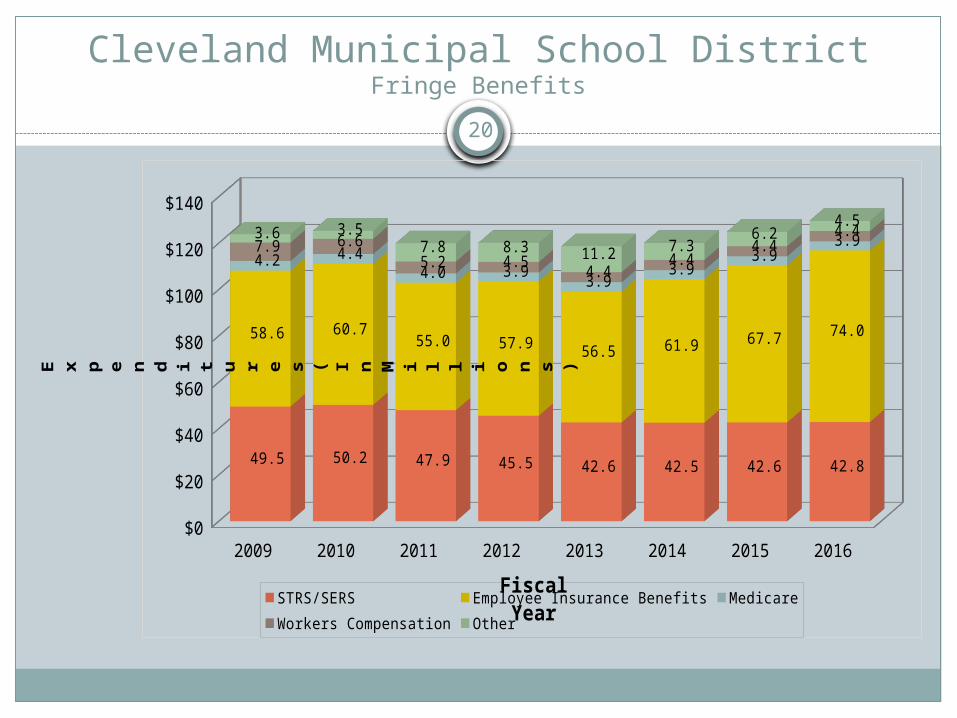
Cleveland Municipal School DistrictFringe Benefits
2009 2010 2011 2012 2013 2014 2015 2016$0
$20
$40
$60
$80
$100
$120
$140
49.5 50.2 47.9 45.5 42.6 42.5 42.6 42.8
58.6 60.755.0 57.9 56.5 61.9 67.7 74.0
4.2 4.44.0 3.9
3.93.9
3.93.97.9 6.6
5.2 4.54.4
4.44.4
4.43.6 3.57.8 8.3 11.2 7.3
6.24.5
STRS/SERS Employee Insurance Benefits MedicareWorkers Compensation Other
Fiscal Year
E x p e n d i t u r e s ( I n M i l l i o n s )

21
Cleveland Municipal School DistrictPurchased Services
2009 2010 2011 2012 2013 2014 2015 2016$0
$50
$100
$150
$200
$250
13.5 15.1 14.2 12.8 12.8 13.0 13.2 13.49.2 9.3 7.8 10.9 10.9 11.0 11.2 11.4
70.1 63.4 56.5 61.3 69.4 70.2 70.9 71.6
96.0 98.3 106.0116.8
125.2 133.6 142.0 150.4
Utilities Student Transportation (Contract)Other Purchased Services Charter School Pass-Through
Fiscal Year
Exp
en
dit
ure
s (I
n
Mil
lion
s)
22
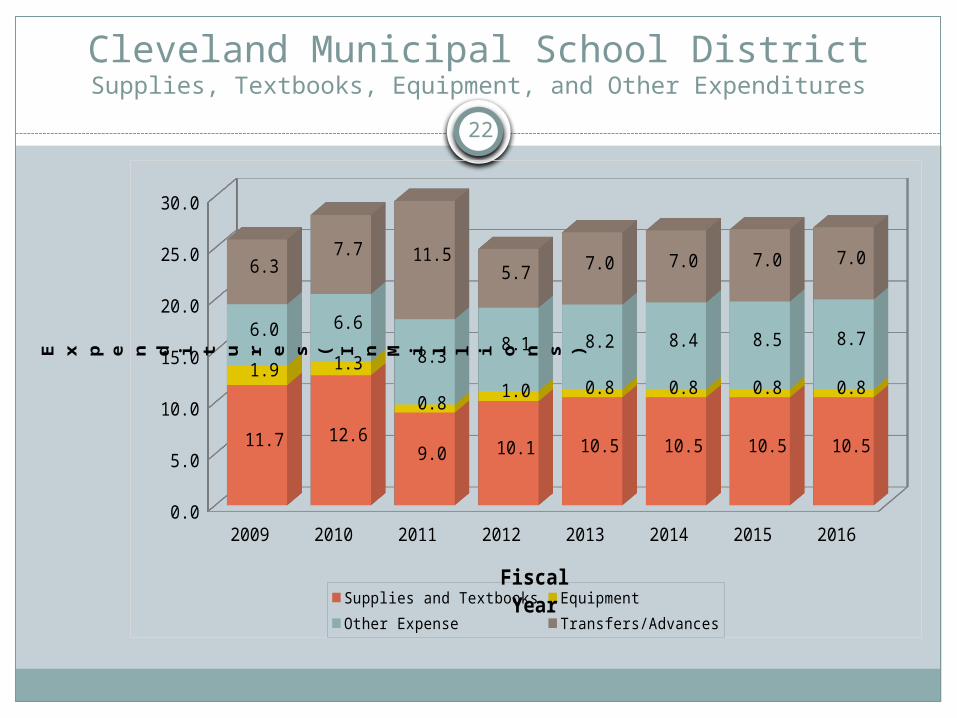
Cleveland Municipal School DistrictSupplies, Textbooks, Equipment, and Other Expenditures
2009 2010 2011 2012 2013 2014 2015 20160.0
5.0
10.0
15.0
20.0
25.0
30.0
11.7 12.69.0 10.1 10.5 10.5 10.5 10.5
1.9 1.3
0.81.0 0.8 0.8 0.8 0.8
6.0 6.6
8.38.1 8.2 8.4 8.5 8.7
6.37.7 11.5
5.7 7.0 7.0 7.0 7.0
Supplies and Textbooks Equipment Other Expense Transfers/Advances
E x p e n d i t u r e s ( I n M i l l i o n s )
Fiscal Year

23
Cleveland Municipal School DistrictTotal Expenditures– Excluding Charter School Portion
2009 2010 2011 2012 2013 2014 2015 20160.0
100.0
200.0
300.0
400.0
500.0
600.0
700.0
360.2 359.3 312.7 309.0 286.9 286.2 287.0 287.9
123.8 125.3119.8 120.1 118.6 120.0 124.8 129.6
92.7 87.878.4 85.0 93.1 94.2 95.3 96.4
11.7 12.6
9.0 10.1 10.6 10.6 10.6 10.6
Wages Benefits Purchased Services Supplies and MaterialsCapital Outlay Other Transfers/Advances
E x p e n d i t u r e s ( I n M i l l i o n s )
Fiscal Year

24
Cleveland Municipal School District
Five-Year Forecast Summary

25
Cleveland Municipal Public SchoolsOctober 2011 Five-Year Forecast
(in millions of dollars)
Beginning Cash Balance $82.0 $50.4 $13.0 $33.0 $7.1 ($59.0) ($144.7) ($246.1)
Total Revenues 668.2 662.7 666.4 643.4 611.1 608.3 610.2 613.3
Total Expenses 699.8 700.1 646.4 669.3 677.2 694.0 711.6 729.8
Revenue over Expenses (31.6) (37.4) 20.0 (25.9) (66.1) (85.7) (101.4) (116.5)
Ending Cash Balance 50.4 13.0 33.0 7.1 (59.0) (144.7) (246.1) (362.6)
Encumbrances/Reserves 7.0 6.5 8.2 7.0 7.0 7.0 7.0 7.0
Unencumbered Balance $43.4 $6.5 $24.8 $0.1 ($66.0) ($151.7) ($253.1) ($369.6)
FY 2016FY 2014 FY 2015 FY 2009 FY 2010 FY 2011 FY 2012 FY 2013

26
Revenue Update FY12
General Property Tax Revenue Adjustment (3,599,362)
Personal Property Tax Revenue Adjustment 48,852
State Foundation Revenue Adjustment 1,387,568
Education Jobs New Revenue 461,441
Homestead Tax Revenue Adjustment (155,000)
Other Revenue
IRS Rebate New Revenue 4,542,408
E-Rate New Revenue 3,000,000
TIF Receipts/Misc Revenue Adjustment 461,890
Total Change 6,147,797

27
Expenditure Update FY12
Salaries
Wages Labor Negotiations/ Budget Adjustment
(3,011,431)
Benefits
STRS/SERS Labor Negotiations/Budget Adj
(3,600,000)
Health Care Labor Negotiations (725,000)
Unemployment Compensation Labor Negotiations/Budget Adj
(2,275,000)
Workers Compensation Budget Adjustment 1,200,000
Separation Pay Budget Adjustment 580,000
Purchased Services
Charter School Tuition Budget Adjustment 2,400,000
Other Purchased Services - (Utilities, Tuition paid to other Districts, Professional Services)
Operational Efficiencies/ Budget Adjustment
(3,975,000)
Supplies and Materials Operational Efficiencies (650,000)
Subsidy to Food Service Budget Adjustment (2,000,000)
Advances-Out Operational Efficiencies (1,500000)
Total Change (13,556,431)

28
Cleveland Municipal Public SchoolsOctober 2011 Five-Year Forecast Adjusted
(in millions of dollars)
Beginning Cash Balance $82.0 $50.4 $13.0 $33.0 $26.8 ($39.3) ($125.0) ($226.4)
Total Revenues 668.2 662.7 666.4 643.4 611.1 608.3 610.2 613.3 changes on slide 25 6.1 Total Expenses 699.8 700.1 646.4 669.3 677.2 694.0 711.6 729.8
changes on slide 26 (13.6)Revenue over Expenses (31.6) (37.4) 20.0 (6.2) (66.1) ($85.7) ($101.4) ($116.5)
Ending Cash Balance 50.4 13.0 33.0 26.8 (39.3) ($125.0) ($226.4) ($342.9)
Encumbrances/Reserves 7.0 6.5 8.2 7.0 7.0 7.0 7.0 7.0
Unencumbered Balance $43.4 $6.5 $24.8 $19.8 ($46.3) ($132.0) ($233.4) ($349.9)
FY 2016FY 2014 FY 2015 FY 2009 FY 2010 FY 2011 FY 2012 FY 2013
29
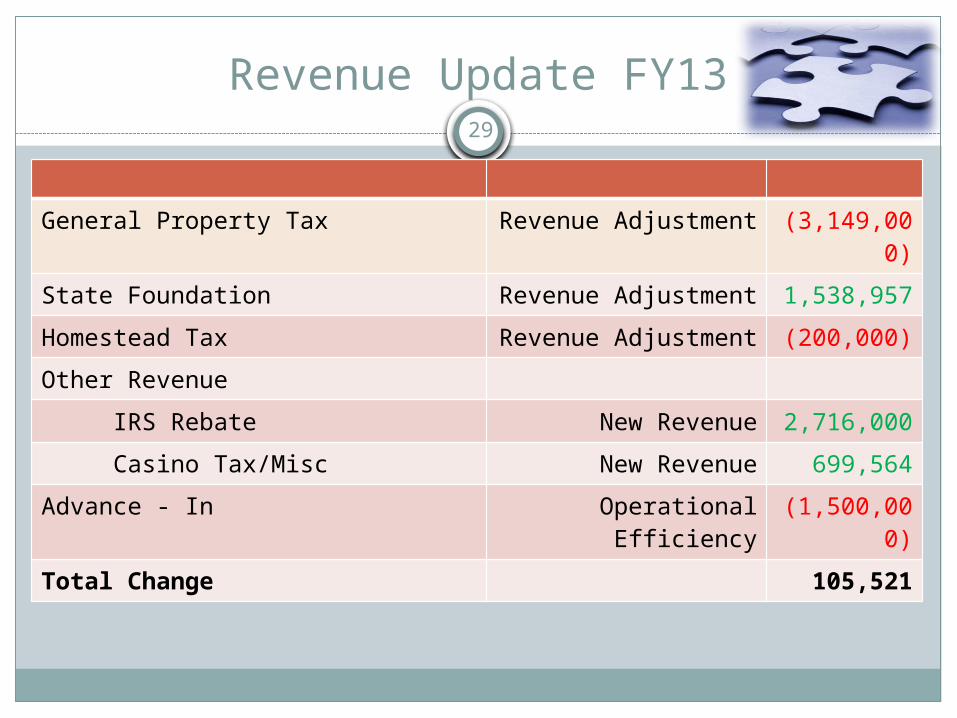
Revenue Update FY13
General Property Tax Revenue Adjustment (3,149,000)
State Foundation Revenue Adjustment 1,538,957
Homestead Tax Revenue Adjustment (200,000)
Other Revenue
IRS Rebate New Revenue 2,716,000
Casino Tax/Misc New Revenue 699,564
Advance - In Operational Efficiency
(1,500,000)
Total Change 105,521
30
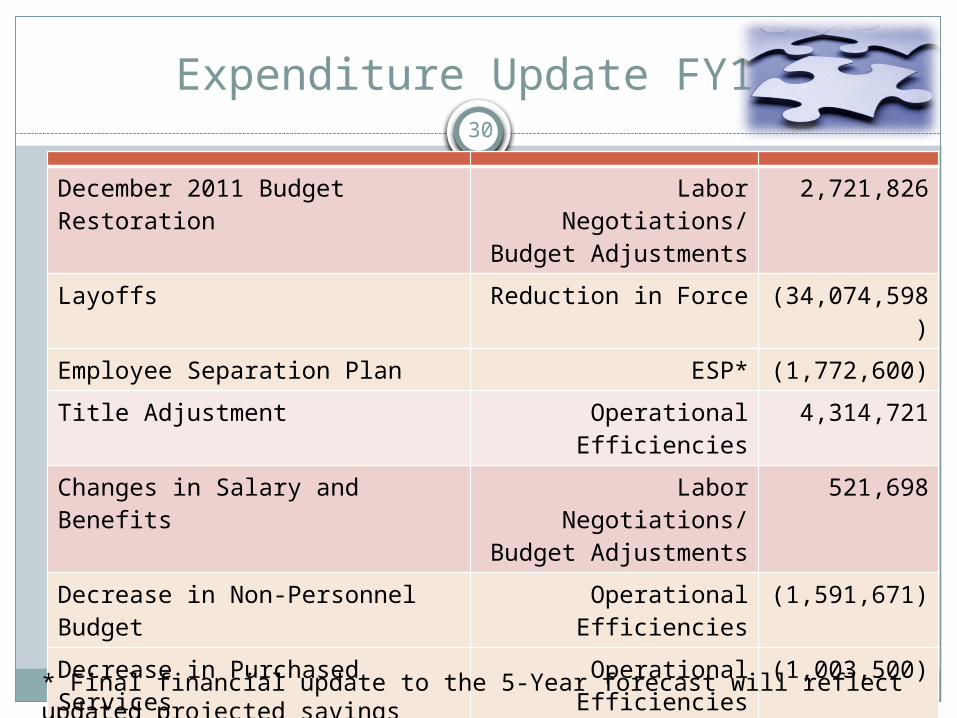
Expenditure Update FY13
December 2011 Budget Restoration
Labor Negotiations/ Budget Adjustments
2,721,826
Layoffs Reduction in Force (34,074,598)
Employee Separation Plan ESP* (1,772,600)
Title Adjustment Operational Efficiencies
4,314,721
Changes in Salary and Benefits Labor Negotiations/ Budget Adjustments
521,698
Decrease in Non-Personnel Budget
Operational Efficiencies
(1,591,671)
Decrease in Purchased Services Operational Efficiencies
(1,003,500)
Increase in Charter School Payment
Budget Adjustments 2,400,000
Decrease in Transfers and Advances
Budget Adjustments (1,976,000)
Strategic Investment Operational Efficiencies
3,600,000
Total Change (26,860,124)
* Final financial update to the 5-Year forecast will reflect updated projected savings
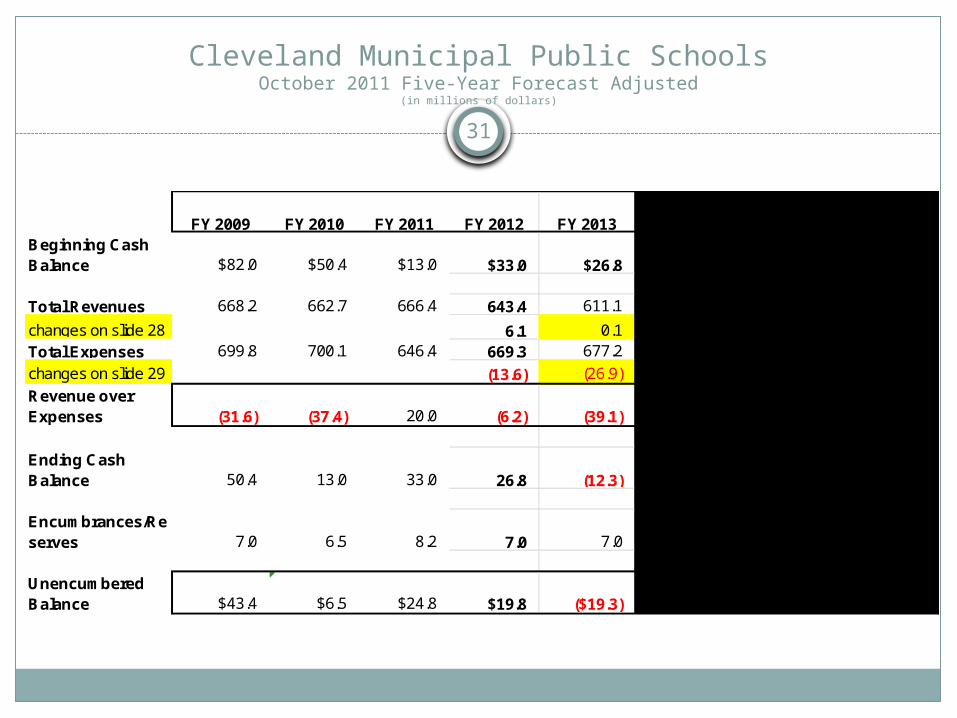
31
Cleveland Municipal Public SchoolsOctober 2011 Five-Year Forecast Adjusted
(in millions of dollars)
Beginning Cash Balance $82.0 $50.4 $13.0 $33.0 $26.8 ($12.3) ($98.0) ($199.4)
Total Revenues 668.2 662.7 666.4 643.4 611.1 608.3 610.2 613.3
changes on slide 28 6.1 0.1 Total Expenses 699.8 700.1 646.4 669.3 677.2 694.0 711.6 729.8
changes on slide 29 (13.6) (26.9)
Revenue over Expenses (31.6) (37.4) 20.0 (6.2) (39.1) ($85.7) ($101.4) ($116.5)
Ending Cash Balance 50.4 13.0 33.0 26.8 (12.3) ($98.0) ($199.4) ($315.9)
Encumbrances/Reserves 7.0 6.5 8.2 7.0 7.0 7.0 7.0 7.0
Unencumbered Balance $43.4 $6.5 $24.8 $19.8 ($19.3) ($105.0) ($206.4) ($322.9)
FY 2016FY 2014 FY 2015 FY 2009 FY 2010 FY 2011 FY 2012 FY 2013

32
Cleveland Municipal Public SchoolsMay 2012 Five-Year Forecast
(in millions of dollars)
Beginning Cash Balance $82.0 $50.4 $13.0 $33.0 $26.8 ($12.3) ($65.9) ($135.7)
Total Revenues 668.2 662.7 666.4 649.6 611.2 607.1 606.1 608.1
Total Expenses 699.8 700.1 646.4 655.8 650.3 660.7 675.9 691.3
Revenue over Expenses (31.6) (37.4) 20.0 (6.2) (39.1) (53.6) (69.8) (83.2)
Ending Cash Balance 50.4 13.0 33.0 26.8 (12.3) (65.9) (135.7) (218.9)
Encumbrances/Reserves 7.0 6.5 8.2 7.0 7.0 7.0 7.0 7.0
Unencumbered Balance $43.4 $6.5 $24.8 $19.8 ($19.3) ($72.9) ($142.7) ($225.9)
FY 2016FY 2014 FY 2015 FY 2009 FY 2010 FY 2011 FY 2012 FY 2013

33
Cleveland Municipal Public SchoolsMay 2012 Five-Year Forecast
(in millions of dollars)
Beginning Cash Balance $82.0 $50.4 $13.0 $33.0 $26.8 ($12.3) ($65.9) ($135.7)
Total Revenues 668.2 662.7 666.4 649.6 611.2 607.1 606.1 608.1
Total Expenses 699.8 700.1 646.4 655.8 650.3 660.7 675.9 691.3
Revenue over Expenses (31.6) (37.4) 20.0 (6.2) (39.1) (53.6) (69.8) (83.2)
Ending Cash Balance 50.4 13.0 33.0 26.8 (12.3) (65.9) (135.7) (218.9)
Encumbrances/Reserves 7.0 6.5 8.2 7.0 7.0 7.0 7.0 7.0
Unencumbered Balance $43.4 $6.5 $24.8 $19.8 ($19.3) ($72.9) ($142.7) ($225.9)
Permanent Change to Budget - $19.3 million $0.0 ($34.3) ($84.8) ($148.7)
FY 2016FY 2014 FY 2015 FY 2009 FY 2010 FY 2011 FY 2012 FY 2013

34
Cleveland Municipal School DistrictMay 2012 Five-Year Forecast Summary
Property Taxes Current economic conditions continue to have a significant impact
on tax collection rates
State Foundation Revenue Projections are based on the Bridge formula.
Education Jobs (Ed Jobs) A federal program to save or create education jobs for the FY 11
and/or FY 12 school years. This is one-time money that is being utilized in FY 12.

35
Cleveland Municipal School DistrictMay 2012 Five-Year Forecast Summary -Continued
Salaries and Benefits Forecast assumes 2,591 total classroom teachers in FY13. (2,316 in
the General Fund) Forecast budgets 50 less employees each year in FY14-16. Forecast assumes all union agreements as currently defined. Healthcare rates are forecasted to increase 7.7% in FY13 and 9.7%
in FY14-16.Charter School Tuition Charter school tuition is projected to increase $8.4 million per year
over the forecast period.Financial Summary A balanced budget is currently forecasted through June 30,
2012. A $19.3 million deficit is currently forecasted through June
30, 2013.

Fiscal Caution, Watch and Emergency
36
Fiscal Caution Fiscal Watch Fiscal Emergency
Lower bond ratingsState controlHigher Class Sizes

Fiscal Caution, Watch and Emergency
37
Fiscal Caution Fiscal Watch Fiscal Emergency
Fiscal Caution – may be declared when:• No acceptable plan in place to avoid the potential current year
deficit.• Failure to submit a sufficient plan to address potential future year
deficit.• Auditor of State certifies a deficit between 2% and 8% of prior year
general fund revenue and elects not to place District in Watch or Emergency.
Fiscal Watch - May be declared, if all are met:• Operating deficit for current FY certified by Auditor of State
exceeds 2% but does not exceed 8%.• Voters have not approved a levy that would raise sufficient
funds in next succeeding year.• Auditor of State determines there is no reasonable cause for deficit
or that declaration is necessary to prevent further decline.
Fiscal Caution, Watch and Emergency
38
Fiscal Caution Fiscal Watch Fiscal Emergency
Fiscal Emergency– A fiscal emergency is the last resort and most severe stage of a school district’s financial solvency problems. Following a declaration by the Auditor of State, a commission is created that may assume all or part of the powers of the board of education. The commission develops a financial plan to alleviate the school district's financial crisis.

39
Cleveland Municipal School DistrictDefinitions
CAT Tax – Commercial Activity Tax: The commercial activity tax (CAT) is an annual tax imposed on the privilege of doing business in Ohio, measured by gross receipts from business activities in Ohio. Businesses with Ohio taxable gross receipts of $150,000 or more per calendar year must register for the CAT, file all applicable returns, and make all corresponding payments.
Ed Jobs – The Education Jobs Fund: This fund was included as part of federal legislation passed on Aug 10, 2010. The program provides $10 billion for states to save or create education jobs. Ohio is estimated to receive $361 million from the program. The district is estimated to receive $17.7 million. Funds can be used in FY 11 or FY 12.
State Hold Harmless Reimbursements: The provision under which the State of Ohio agreed to reimburse the Cleveland Municipal School District for any loss associated with a change in law.

40
QUESTIONS
T H E P R I M A R Y G O A L O F T H E C L E V E L A N D M U N I C I PA L S C H O O L D I S T R I C T I S T O B E C O M E A P R E M I E R S C H O O L D I S T R I C T I N T H E U N I T E D S T A T E S O F
A M E R I C A .
Cleveland Municipal School District
Five-Year Financial Forecast – May 2012