five steps to a stronger child welfare workforce
TRANSCRIPT

Five Steps to a Stronger Child Welfare WorkforceHIRING AND RETAINING THE RIGHT PEOPLE ON THE FRONTLINE

\ 4 \
ABOUT THE ANNIE E. CASEY FOUNDATIONThe Annie E. Casey Foundation is a private philanthropy that creates a brighter future for the nation’s children by developing solutions to strengthen families, build paths to economic opportunity and transform struggling communities into safer and healthier places to live, work and grow.
For more information, visit www.aecf.org.
© 2018 The Annie E. Casey Foundation, Baltimore, Maryland
Introduction: Hiring and Retaining the Right People
Step 1: Partner with HR
Step 2: Get Strategic — Build Your Leadership Capacity and Use Your WIT
Step 3: Create a Competency-Based Culture
Step 4: Develop Data and Build a Dashboard
Step 5: Build a Positive Work Environment
Conclusion
Appendices
A Building a Workforce Innovation Team
B Building Competency Models
C In the Weeds with Data and Dashboards
D Tools for Building a Positive Work Environment
Endnotes
Table of Contents1
3
6
9
11
13
17
18
21
26
35
46

\ 6 \

\ 1 \
IntroductionHIRING AND RETAINING THE RIGHT PEOPLE
As a child welfare agency leader, you have experienced it firsthand: For all your best efforts to implement innovations in your agency, improvement isn’t possible without a stable, committed workforce. So how can you hire and retain the right people — especially during moments of organizational stress and turmoil, when you need them most?
The five-step process described in this paper comes from On the Frontline, the Annie E. Casey Foundation’s three-year effort to measurably improve the leading edge of the child welfare workforce: its child protection staff, including investigations caseworkers and supervisors.
When Casey’s On the Frontline work began, the Foundation and its partners invested significant time and energy in research and experimentation aimed at strengthening agency personnel. We wanted to drive down turnover and vacancy rates, help caseworkers make better decisions (we’ll publish more on that soon) and use data to track our results. Our goal was to identify the workplace activities most likely to improve organizations. The steps described in this paper were articulated, tested and evaluated in partnership with the two forward-thinking agencies that took part in On the Frontline, Ohio’s Cuyahoga County Division of Children and Family Services and Colorado’s Jefferson County Division of Children, Youth and Families.1 The steps can be used in state systems, with the obvious difference that your success in hiring and retaining the right people in state agencies will depend on your ability to work across larger organizations and, often, state civil service agencies.
Use this paper for two purposes:
• To inspire and begin building a vision. The main section briefly defines each step, illustrates the implementation process and shares our two partners’ experiences.
• To implement. The paper and its appendices contain nuts-and-bolts advice for staff charged with strengthening your workforce, including links to tools and resources you can adjust for your agency.
The good news is that workforce improvements are possible. They are also cost effective, since the cost for each worker leaving an agency has been estimated at $54,000, or 70 percent to 200 percent of an employee’s salary.2,3 I hope this paper, with its straightforward steps, examples and links to tools, provides an easy-to-use road map for your agency.
Tracey FeildDirector, Child Welfare Strategy GroupThe Annie E. Casey Foundation
SUMMER 2018
\ 2 \
I2
3
4
5
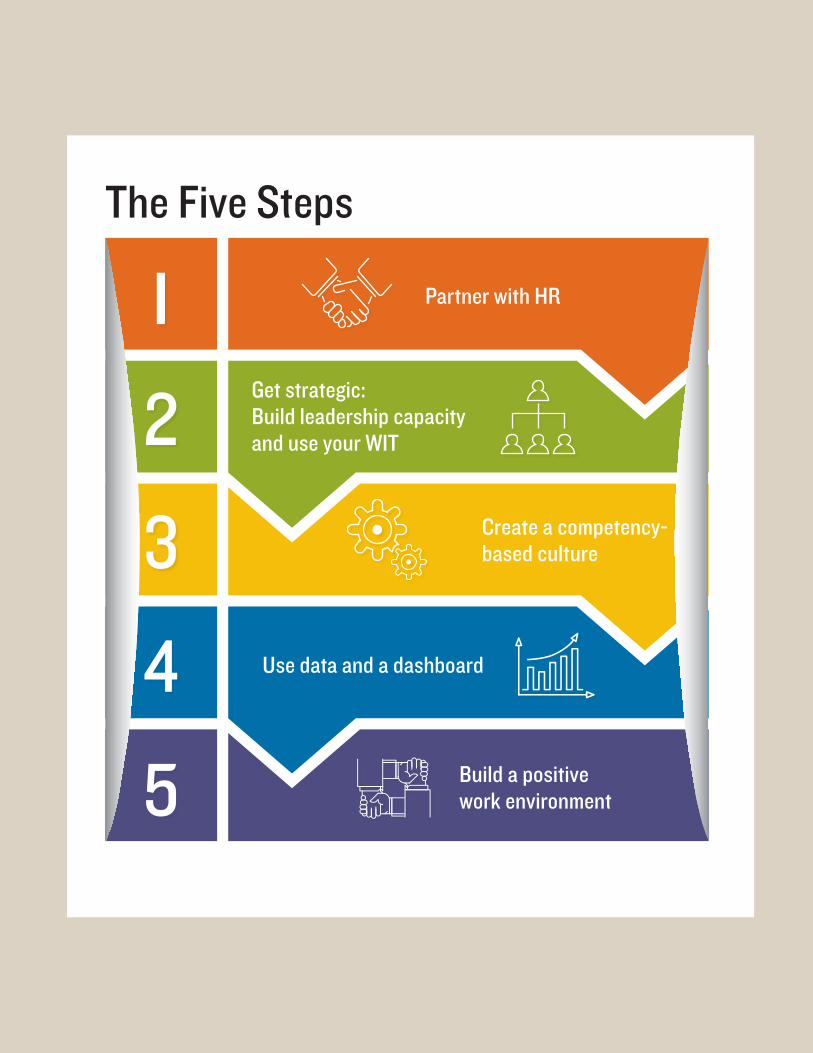
Partner with HR
Get strategic: Build leadership capacity and use your WIT
Create a competency-based culture
Use data and a dashboard
Build a positive work environment
The Five Steps

\ 3 \
Step IPARTNER WITH HR
Many child welfare agencies work with human resources (HR) staff who report not to the child welfare director but to the county, state or municipal jurisdiction that services multiple departments or agencies. That can be a real barrier to efforts to improve an agency’s workforce, because you may have to compete with many other departments and priorities. But as Casey’s On the Frontline efforts demonstrated,4 collaboration with HR is not only possible, it is critical to your success in building the competent, flexible, available workforce you need to serve a community’s children and families.
When HR believes it has a stake in achieving child safety, well-being and permanency, it acts differently. Collaborating with HR can spur a real change — a transformation, in fact. When everyone is communicating and planning together, you will be more successful in recruiting and hiring applicants with the right skills, providing meaningful performance feedback, ensuring robust coaching and professional development and reducing turnover.
This need not be daunting work. In fact, knowing that leaders care enough to examine how employees are chosen, supported and feeling can boost morale. Developing parallel supervisory and HR values and processes is appreciated, too.
How to build effective partnerships with HR:
• Be strategic, optimistic and persistent. If HR doesn’t report to you, you will need to secure allies higher in the chain of command who will ensure HR is responsive and collegial. Make sure to do that, retaining a sense of optimism about your prospects. Push the envelope with HR. Be your own best workforce champion — the first step is yours.
• Meet regularly. The child welfare director or deputy should have an ongoing relationship with the HR manager. The goal is to develop an understanding of each other’s role and expectations and enlist HR’s support in key areas, such as improving recruitment and selection and streamlining hiring.
• Encourage proximity. Do what you can to ensure that HR staff members who support child welfare are housed within the agency, ideally near the executive or management offices. This encourages informal, day-to-day interactions and increases HR’s understanding of and support for child welfare goals. If co-location isn’t possible, set up regular check-in times with your HR contacts. If HR is understaffed, consider having your agency fund a position to support child welfare exclusively, while still reporting to HR.
• Enable co-ownership. Include HR in your management team and strategic planning meetings. If you choose to have a Workforce Innovation Team (WIT) — and we recommend you do — encourage top HR staff to play a leadership role; it will provide a pathway to better understanding your agency’s challenges and goals (see Step 2 and Appendix A for more details on WITs, their membership, mission and operation).
• Make data your mutual language. You and your HR partner need to have frequent conversations to understand your workforce data, have clear and common definitions and understand when agency and HR policies and practices need updating for better results.
USE YOUR WIT
A Workforce Innovation Team (WIT) is a cross-function workgroup charged by the child welfare leader with assessing workforce issues, identifying and tracking related data and proposing (and sometimes implementing) changes in agency policy and practice, with a goal of improving employee hiring, retention, skills and satisfaction. Some WITs are standing workgroups; others sunset once responsibilities for workforce improvements are delegated to other staff members or work units for implementation. One key ingredient of a WIT: active representation of human resources staff members, preferably including top HR leaders.

\ 4 \
Implementation Timeline
1 INITIATE DIALOGUE• Determine how to engage with HR.
• Meet with HR leaders to forge a vital, ongoing partnership.
• Identify and agree on mutual expectations.
2 EDUCATE AND PARTNER• Help HR understand the importance of achieving
child protection outcomes.
• Map workforce processes to identify slowdowns and areas for improvement.
• Clarify roles (who does what when).
• Explore the relationship between workforce and program outcomes.
• Invite HR to co-chair or participate in your workforce innovation team.
3 IDENTIFY DATA NEEDS• Illustrate why workforce data are critical to better
agency outcomes.
• Commit to disaggregate data by race, ethnicity, age, gender, tenure and position.
• Plan to further explore data needs and solutions.
4 MONITOR/ADJUST• Meet regularly with HR leadership and
continue WIT partnership.
• Regularly monitor HR data and discuss with HR as appropriate.
• Hold HR accountable for meeting program workforce needs.
• Keep relationships, approaches and processes up to date. Organizations are dynamic systems. If you and your HR partner begin to see increased turnover, unfilled vacancies or falling performance, it may be a sign that recruitment strategies that motivated one generation do not motivate today’s. You and your HR partner must stay flexible and be prepared to experiment and adjust as necessary. To ensure a healthy supply of good workers, it’s important your approach is firmly in the 21st century and goes well beyond recruiting at job fairs. You’ll want to be constantly analyzing the job market landscape and pipeline, looking for opportunities.
ON THE FRONTLINE: HOW TWO COUNTIES ALIGNED HR AND AGENCY PROCESSES
Early in their workforce improvement efforts, Jefferson and Cuyahoga counties worked hard to involve their HR partners. “We didn’t really have a tradition of meeting regularly with HR. We used to go for long periods of time without seeing one another,” says Natalie Mall, associate director of Jefferson County’s child welfare organization.
“Without a huge amount of effort, we now collaborate regularly and it makes a real difference when hiring-related issues come up. Learning together about the stresses and challenges of child welfare jobs has created an understanding of how important it is to have vacancies filled quickly and with well qualified individuals.”
“Using our WIT workgroup to build a strong partnership allowed the county HR department and managers in the Division of Children and Family Services to build a strong relationship and hire a full complement of quality child welfare workers,” says Michael Brown, Cuyahoga’s human resources manager.
Among the lessons learned by the two counties:
• There are multiple effective approaches to partnership. Whether your agency is state- or county- administered, or you use a short- or long-term WIT to drive your workforce improvement efforts, there are a variety of ways to succeed to strengthen your workforce.

\ 5 \
• Business process mapping 5 helps. An early collaborative task involved mapping each agency’s hiring process, with a goal of reducing or eliminating unnecessary delays in hiring and training. Both counties called a meeting of everyone with ownership of at least one piece of the hiring process, identified inefficiencies and eliminated several steps that were there “because they always had been.” They also agreed on who would conduct specific tasks, such as reference checks, to make sure people who could make the best use of information gathered had access to it.
• Small instances of collaboration can spark unexpected benefits. One example: In Jefferson County, not only was the HR specialist a regular WIT participant, but she also produced five short training videos to help hiring teams refresh their behavioral interviewing skills.

\ 6 \
Step 2GET STRATEGIC: BUILD YOUR LEADERSHIP CAPACITY AND USE YOUR WIT
A clear lesson from On the Frontline is that agencies do better when they are strategic and flexible in their approach to hiring and retaining the right people. Being strategic simply means thinking ahead, moving purposefully toward your long-range goals, sequencing change effectively and realizing that every aspect of an agency’s interactions with current or future staff can improve or erode workforce outcomes. Being flexible means recognizing when it’s time to try new workforce approaches to get better results.
Of course, being strategic and flexible are key leaderships skills. As a child welfare manager, you will decide how best to highlight workforce issues in your improvement agenda.
First, make sure you have the commitment, vision, drive and sanction from top leadership (those who control the agency’s budget and policies) to substantively improve your workforce.
Then, engage a WIT6 to identify and analyze data needed to understand the connection between workforce issues, the work environment and indicators such as turnover and retention. A WIT can research and propose workforce goals and strategies and, eventually, plan, test, sequence and implement solutions.
If you are a leader who prefers not to use standing workgroups to drive organizational change, a short-term, goal-focused WIT may be just the solution for your agency. But consider the benefits of an ongoing WIT. It can provide you with staff members who are knowledgeable and experienced when you need them—people able to solve immediate problems while they also help you keep an eye on the agency’s long-term needs. Also, it is unlikely your need to address workforce issues will recede over time, given the pace of organizational change, technological innovation and the demand for agencies to be responsive to legislative, community and other influences.
How to build a successful WIT:
• Seek breadth and depth. Make sure to include among WIT members people who represent the skills and experience needed to accomplish your goals. Choose staff from a variety of functions, levels and experience within the agency and, sometimes, beyond. As a baseline, your WIT needs to include agency and HR leaders, supervisors, line staff and data specialists. Include people well versed in current HR approaches on your WIT. A larger team may be required during implementation efforts while a smaller team can handle ongoing data review and oversight once improvements are seen. If your WIT is short on up-to-date HR knowledge, consider bringing on an HR consultant. Is your workforce unionized? If so, you will need to determine how best to handle union-related issues.
• Ensure that the WIT is closely aligned with your agency’s vision and leadership. Agency leaders need to participate in or track progress of the WIT, communicating changes in agency priorities so the team can modify its workplan or change direction as needed.
• Create a strategic, multi-step plan. Set priorities with an eye toward which improvements can create quick wins and which may take longer to see results. Focus tightly on the variables shown to affect workers’ intent to stay on the job and workforce strategies that will get the results you need.7
• Establish key partnerships. If you reduce the time to fill staff positions, will you have training available when you need it? Make sure to include training providers as partners; you can’t get new workers up to speed and able to carry a full workload if they haven’t been properly trained.

\ 7 \
• Track a variety of indicators. How long until you see measurable changes in your workforce data? It may take time for the numbers to improve — but if you are showing real commitment to change and finding ways to measure how your workforce is perceiving your efforts, you’ll see morale benefits pretty quickly. Recommended data elements are shown in appendix C.
• Communicate! Your workforce change efforts will require a communications plan to reach various audiences, because driving organizational change requires constant, clear and consistent messaging that motivates everyone involved to work differently.
Implementation Timeline
1 ORGANIZE• Select WIT lead (or co-leads)
and team members.
• Develop WIT’s mission statement and reporting responsibilities.
• Set meeting schedule (biweekly or monthly).
2 ASK QUESTIONS AND HYPOTHESIZE
• Use workforce data to identify major workforce gaps, challenges and opportunities, including those related to race and ethnicity.
• Identify gap-closing strategies and preliminary goals.
• Conduct SWOT analysis (a review of strengths, weaknesses, opportunities and threats).
• Develop cost models, review benchmarks and set goals (for details, see Step 4, Use data and a dashboard).
3 PLAN STRATEGICALLY• Develop a multi-year plan and obtain
manager buy in.
• Collaborate with your training partner to ensure worker training is available as needed.
• Develop a communications plan.
4 IMPLEMENT• Implement short- and long-term
work plans to close gaps in your workforce approaches.
• Assign team members to lead specific strategies, using subcommittees as appropriate.
• Communicate progress.
5 MONITOR AND ADJUST• Meet regularly to monitor workplan
progress.
• Ensure that leaders, managers and those affected by plans understand what’s required.
• Continually review data for different workforce subgroups.
• Adjust strategies, workplan and team composition as needed for equity and results.

\ 8 \
ON THE FRONTLINE: WORKFORCE INDICATORS ARE ON THE RISE
Focusing leadership attention on workforce issues and building effective WITs brought a mix of short- and long-term benefits to the two On the Frontline counties. “Through our work with On the Frontline, we went from always feeling understaffed to today, when we are finally fully staffed. That makes a huge difference in our daily lives, not only in terms of doing right by kids and families but also toward improving morale. People in our frontline jobs want to do well. They feel better able to do well when they have needed resources, such as sufficient numbers of capable colleagues,” says Sherrin Ashcroft, former program manager for Jefferson County’s Division of Children, Youth and Families. “One real asset of our workforce planning group was the sense of teamwork and mutual respect it encouraged,” says Cynthia Weiskittel, director of Cuyahoga County’s Division of Children and Family Services. “We did what we could, not only to get the job done, but also to celebrate the milestones. I mean, when you surpass a milestone, why not celebrate with cake?”
Among the two counties’ results:
• Reduced time-to-fill rates. Jefferson County decreased the number of days it took to fill key positions from 72 days in 2014 to 27 days in 2017. Cuyahoga dropped the number of days from more than 200 in 2015 to 77 in 2017. By comparison, the American Public Health Association has estimated the average time to fill a vacant child welfare position at 49 to 91 days.8 (The two counties count “time to fill” differently. While their results can’t be directly compared, each experienced a large reduction.)
• Reduced vacancy rates. For several years, Cuyahoga County averaged more than 40 vacancies at any given time, representing about 8 percent of its authorized caseworker positions. As part of the On the Frontline work, its Workforce Innovation Team (WIT) set a new goal: zero vacancies by 2016. In fact, both sites saw few vacancies for most of 2016 and 2017. Their plans involved:
– Having HR provide their WIT with monthly updates on the status of recruitment, new hires, vacancies and so on.
– Providing suggestions and encouragement to HR. The WIT took a leadership role in recognizing and celebrating when interim goals were reached.
– Interacting regularly with HR. Cooperation between HR and child welfare staff blossomed in part because HR is located with the child welfare division and has almost daily interaction with the agency director and deputies.
• Improved the new employee selection process. Both Cuyahoga and Jefferson counties focused on continuously improving their new-employee selection process. They introduced competency-based behavioral interviewing9 in 2015 and continued to tweak the process through monthly discussions in their WITs.
• Some unintended but welcome consequences. Jefferson County found that two changes — adding behavioral-based interviewing and using cross-unit hiring panels to make hiring recommendations instead of continuing the practice of direct supervisors hiring their own staff — created an additional benefit: staff hired were more diverse in terms of race, age and gender. “Our focus was to hire staff with the right skills. But we got more than that — we got broader diversity among candidates chosen. We do not know if other agencies will have the same experience, but we’ll be interested to see if they do,” says Casey consultant Stacey Gerber, former deputy commissioner of Connecticut’s Department of Children and Families. Gerber advised Cuyahoga and Jefferson counties as part of the On the Frontline work. “Nationwide, the clear majority of new caseworkers hired by child welfare agencies are young white females. It’s great to see a wider mix of people — different ages and especially men, who are traditionally underrepresented in systems.”

\ 9 \
Step 3CREATE A COMPETENCY-BASED CULTURE
It happens all the time — you hire employees with great schooling and experience, only to see them burn out and leave the agency prematurely. You begin to wonder: Was it the employee? The supervisor? The agency? What could have kept these promising employees thriving, productive and on the job? Answering these questions is especially urgent when caseloads soar, practice falls short or budget cuts loom.
In the HR field, there is an understanding that to do specific jobs well requires employees with certain definable skills, called core competencies. Today’s most effective hiring approaches involve identifying and describing the core competencies for each job classification and using those competencies for everything from selecting and orienting to encouraging and managing the performance of employees (see this depicted in the competency wheel in appendix B). Competency models 10 can also enhance an agency’s diversity and inclusion results by collecting data that describe the workforce and tracking changes that result from new workforce approaches. 11 Done right, developing competency models, then acting on and encouraging them, weaves the fabric or culture of an agency.
In jurisdictions where the Casey Foundation has worked, agencies have seen the most rapid improvements in their workforce results when they identify and use core competencies in hiring. We recommend you start by addressing key classifications — the child protection specialist and frontline supervisor — at a minimum.
How to build sample competency models and a competency culture:
• Think about what’s required for each position. Creating a competency culture generally starts with building competency models that identify key skills for
certain job classifications. Use the competency library12 and narrow and adjust the list of competencies to 10-12 that fit the position you are defining.
• Determine the right process. It wouldn’t take much time to choose relevant competencies yourself or delegate the choice to one or two others. But that won’t bring your managers and workers along and focus them on building a competency culture. Instead of simply instituting competency models, consider using your WIT or a WIT subcommittee to develop them or oversee their development. Having employees, supervisors and managers participate can lead to a sense of investment and ownership that can be critical to implementation and sustainability and keep workers motivated and on the job.13
• Think carefully about the timing, sequencing and reach of your efforts. To become a competency-based culture requires changes in every aspect of an agency. Can you take all of this on at once? Think carefully about the best time and place to introduce improvements. What can get good results early and spark greater appreciation of the approach? Some agencies begin by introducing competency models in their hiring processes. Others start by integrating the new models into performance management systems.
• Communicate about your goals. How can everyone in your agency understand this new culture unless they have heard regularly about early and longer-range benefits and results? A communications plan is central to spreading your competency culture agency wide. Develop a plan and timeline to spread the word. “Communication is a big piece of this work,” says Jefferson County’s Mall. “When staff know they are being heard and that work groups are creating solutions, it enhances the work environment.”

\ 10 \
Implementation Timeline1 DEVELOP COMPETENCY MODELS• Learn more about competency models.
• Determine which positions require competency models.
• Determine who will develop models (a WIT, a WIT subcommittee or a consultant to the WIT).
• Get leadership input and approval to finalize models.
• Determine how models will affect all six competency wheel processes (see appendix B).
2 COMMUNICATE• Reach all levels and units with repeated
messages about the benefits of change.
3 INTEGRATE MODELS AGENCY-WIDE• Develop competency-based hiring approaches and
develop related forms and behavioral interviewing questions.
• Develop and train on new performance management approaches, update performance objectives and annual evaluation forms and processes.
• Develop, train and promote competency-based training and professional development.
• Identify other processes into which competencies should be integrated.
4 MONITOR/ADJUST• Monitor the success of new strategies
(use focus groups, surveys and insights from workforce data).
• Revise strategies, policies and procedures as needed.
ON THE FRONTLINE: STEPS TOWARD REIMAGINING CULTURE BRING IMPROVEMENT
Cuyahoga and Jefferson counties began the shift toward competency cultures by developing position-specific competency models. These models are straightforward lists, in behavioral terms, of the knowledge, skills and characteristics a person needs to perform a particular job. The key, the counties found, was to identify traits that are difficult or impossible to train — those abilities a person needs to possess upon entering the organization.
Both counties started with lists of 30 key competencies (see appendix B for details); each used focus groups (one for caseworkers, one for supervisors) to discuss and rank the competencies. Each county’s WIT then analyzed all data and proposed a competency model with 10-12 competencies to agency leaders for approval.
To begin integrating the competency models into their HR processes, both counties focused on employee selection. Both used a subcommittee appointed by their WIT to develop hiring policies that use competency-based behavioral interviewing. The subcommittees developed behavioral interview questions and selection forms and arranged to have daylong training sessions for all supervisors and managers. Although both counties continue to refine their processes, feedback indicates that supervisors and managers believe they are making better selection decisions and seeing a stronger and more diverse crop of hires.
“Building a competency-based culture sounds like a public relations stunt. But doing this work is energizing,” says Bryan Moates, co-chair of Jefferson County’s WIT. “When you see everyone around you focus on results, and on doing their very best, and when the people you hire are more likely to be great and to stay — well, that’s a valuable difference.”
\ 11 \
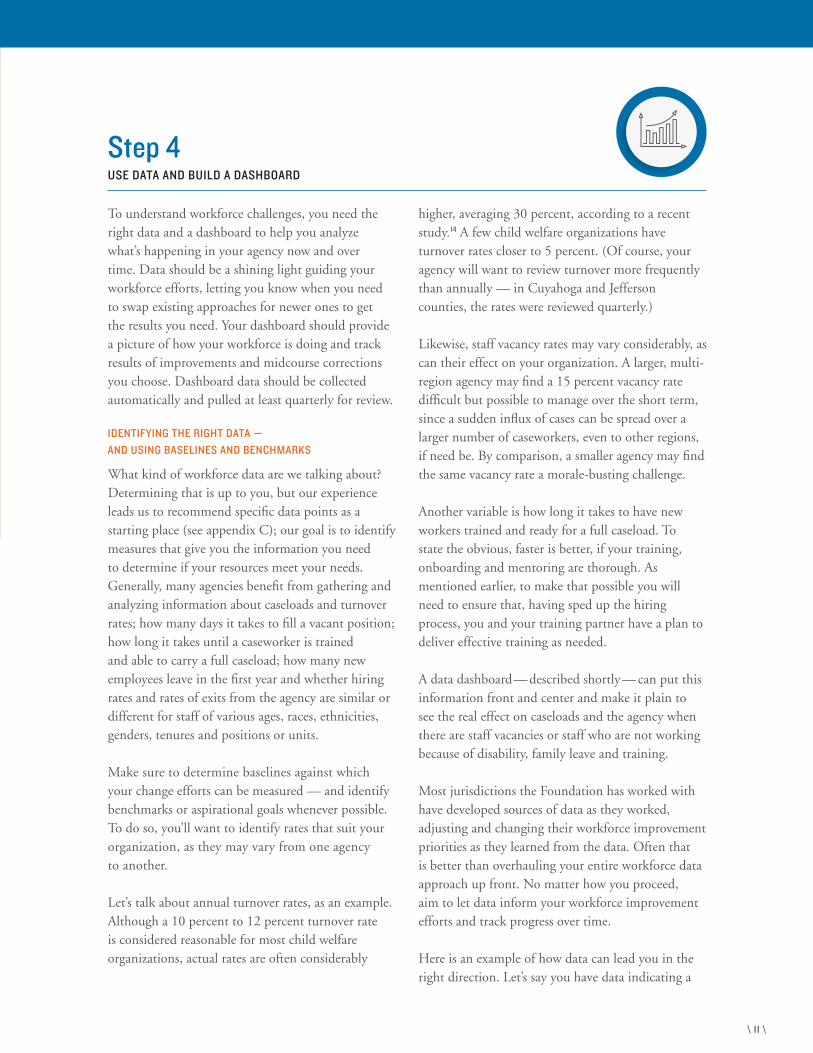
Step 4USE DATA AND BUILD A DASHBOARD
To understand workforce challenges, you need the right data and a dashboard to help you analyze what’s happening in your agency now and over time. Data should be a shining light guiding your workforce efforts, letting you know when you need to swap existing approaches for newer ones to get the results you need. Your dashboard should provide a picture of how your workforce is doing and track results of improvements and midcourse corrections you choose. Dashboard data should be collected automatically and pulled at least quarterly for review.
IDENTIFYING THE RIGHT DATA — AND USING BASELINES AND BENCHMARKS
What kind of workforce data are we talking about? Determining that is up to you, but our experience leads us to recommend specific data points as a starting place (see appendix C); our goal is to identify measures that give you the information you need to determine if your resources meet your needs. Generally, many agencies benefit from gathering and analyzing information about caseloads and turnover rates; how many days it takes to fill a vacant position; how long it takes until a caseworker is trained and able to carry a full caseload; how many new employees leave in the first year and whether hiring rates and rates of exits from the agency are similar or different for staff of various ages, races, ethnicities, genders, tenures and positions or units.
Make sure to determine baselines against which your change efforts can be measured — and identify benchmarks or aspirational goals whenever possible. To do so, you’ll want to identify rates that suit your organization, as they may vary from one agency to another.
Let’s talk about annual turnover rates, as an example. Although a 10 percent to 12 percent turnover rate is considered reasonable for most child welfare organizations, actual rates are often considerably
higher, averaging 30 percent, according to a recent study. 14 A few child welfare organizations have turnover rates closer to 5 percent. (Of course, your agency will want to review turnover more frequently than annually — in Cuyahoga and Jefferson counties, the rates were reviewed quarterly.)
Likewise, staff vacancy rates may vary considerably, as can their effect on your organization. A larger, multi-region agency may find a 15 percent vacancy rate difficult but possible to manage over the short term, since a sudden influx of cases can be spread over a larger number of caseworkers, even to other regions, if need be. By comparison, a smaller agency may find the same vacancy rate a morale-busting challenge.
Another variable is how long it takes to have new workers trained and ready for a full caseload. To state the obvious, faster is better, if your training, onboarding and mentoring are thorough. As mentioned earlier, to make that possible you will need to ensure that, having sped up the hiring process, you and your training partner have a plan to deliver effective training as needed.
A data dashboard—described shortly— can put this information front and center and make it plain to see the real effect on caseloads and the agency when there are staff vacancies or staff who are not working because of disability, family leave and training.
Most jurisdictions the Foundation has worked with have developed sources of data as they worked, adjusting and changing their workforce improvement priorities as they learned from the data. Often that is better than overhauling your entire workforce data approach up front. No matter how you proceed, aim to let data inform your workforce improvement efforts and track progress over time.
Here is an example of how data can lead you in the right direction. Let’s say you have data indicating a

\ 12 \
30 percent turnover rate. That’s a critical problem. But what’s the best approach to fix it?
Often, other data can lead you toward a solution. For example, if you know that workers new to their jobs are driving your turnover rate, you can narrow your improvement efforts to that one segment of your workforce.
Likewise, do you have a significantly higher number of workers in one demographic group leaving the agency in their first year of service? With that information in hand, you can look closely at your agency culture, systems and outcomes to see if improvements can be made to encourage them to continue as vital members of your team (see Step 5 for more detail). Your team will want to hire, retain and provide leadership opportunities for staff of all races, ethnicities, ages and more, as diversity can be a key driver of better organizational outcomes.
You will want to look broadly at how workers experience your agency, from when they are recruited to how and when they are trained and assigned a job to how, when and why they are promoted or leave the agency. As you work, remember that too often workforce data systems are designed to demonstrate compliance rather than provide information that helps you hire and keep the right people. Your task is to identify the detailed information needed to drive workforce improvement efforts.
How and where you collect data is another consideration. In Jefferson County, the agency decided to match SACWIS 15 and HR data in a new system to avoid creating another separate data stream. By comparison, Cuyahoga set up an ACCESS database it uses alongside its county HR information system. The database designer, an HR specialist with the county, reviews all HR forms, such as personnel action paperwork, to capture in ACCESS any details that are not part of the HR information system.
DATA ON COSTAny discussion of data collection is incomplete without identifying the need to pinpoint the costs of your current and future workforce approaches. 16 While one estimate lists the cost of replacing a worker at about $54,000, you will want to figure out the replacement cost for your own agency. The method you use will vary, depending on local conditions. A state agency that has caps on worker caseloads, for example, needs to calculate the cost of hiring staff in order to stay within caseload limits. Once you develop baseline costs, you will want to track the effect of your new approach. Use Casey’s turnover calculator.17
BUILDING A DASHBOARD You will also want to build a dashboard to display data so leaders, managers, staff and others can understand it. That sounds like a tall order, but it is both manageable and helpful.
Good workforce data will aid agency efforts to identify problems and build an effective, strategic plan to address them. A well-designed data dashboard — which can be a simple Excel or ACCESS spreadsheet, if you are a small agency — will help your data come alive, highlight progress and illustrate the benefits of collaboration across organizational boundaries.
How to identify and use data and develop a dashboard:
• See recommended dashboard elements and methods for computing indicators in appendix C.
• Identify who has and who needs data — and bring these key partners together. Think broadly. The obvious targets are program, HR and information/business technology staff. But other people might also be helpful, such as those who work for human services or city/county/state systems that focus on evaluation, innovation, monitoring, auditing, diversity and inclusion, federal reporting, budget, etc. Focus on identifying which data points will substantively help your workforce improvement efforts. Rather than simply reviewing turnover by job classifications, for example, you’ll want the ability to review turnover by program type (looking separately at
\ 13 \
investigations, ongoing and foster care units, for example). You will also want data on worker tenure, being careful to track turnover rates for employees in their first year of agency employment. Also, don’t just look at open positions: collect data on vacancies by classification and program type.
• Communicate about data’s benefits. When you bring data informants together, help all participants understand how their collaboration can help their organization and kids and families. Identify point people who can serve on the WIT and/or be responsible for collaborating with stakeholders to develop data strategies and design reports. Also, as you identify key data to collect, make sure you have data points that will help you explain workforce pressures and successes to key community decision makers, such as officials responsible for your agency’s budget.
• Address race and ethnicity. What’s the racial and ethnic makeup of your workforce, your community and the kids and families you serve? Make sure you have the ability to disaggregate all workforce data so you can identify whether you need strategies to encourage people of different races or ethnicities to apply, stay on the job and get promoted.
• Make your dashboard as easy to use and understand as possible. Test the dashboard with those who need to use it. Can they understand the data as presented?
• Stay the course. Collecting, analyzing and improving data analysis is an important ongoing responsibility for any child welfare agency. There will always be a need to track your progress, articulate and glean insights into new goals and deepen your analysis of what is and isn’t working. Plus, you may be able to use this information in future budget negotiations with elected officials.
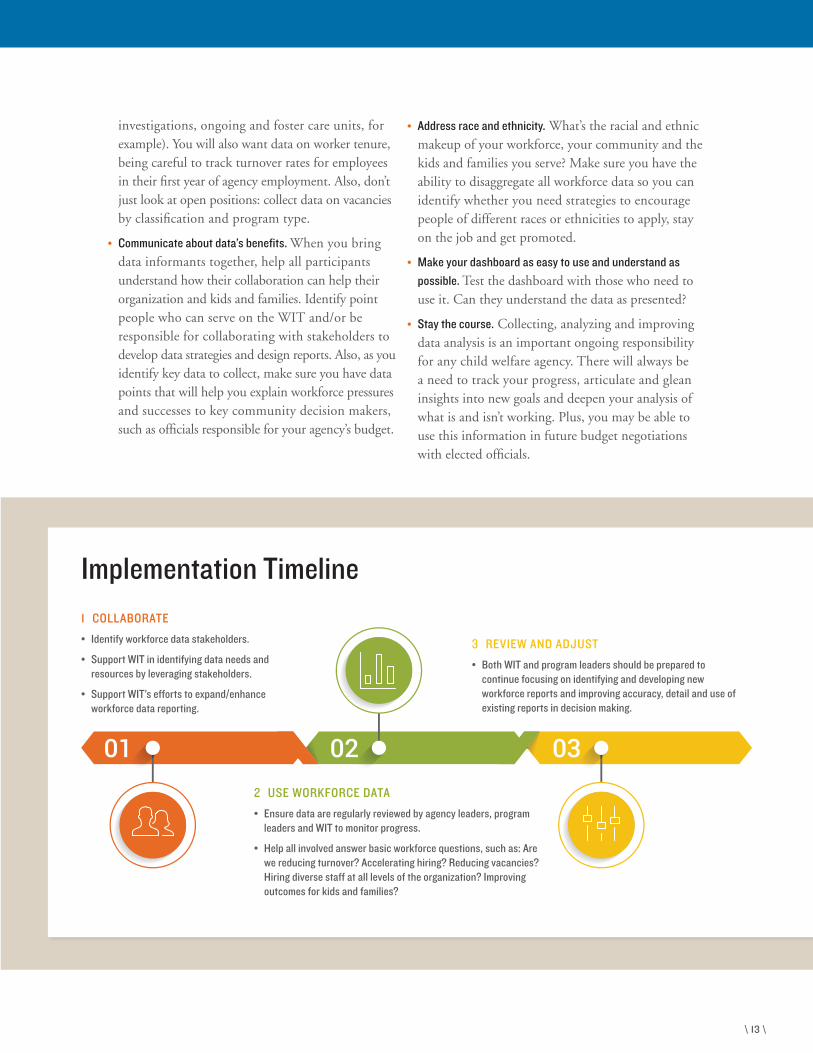
Implementation Timeline1 COLLABORATE• Identify workforce data stakeholders.
• Support WIT in identifying data needs and resources by leveraging stakeholders.
• Support WIT’s efforts to expand/enhance workforce data reporting.
2 USE WORKFORCE DATA• Ensure data are regularly reviewed by agency leaders, program
leaders and WIT to monitor progress.
• Help all involved answer basic workforce questions, such as: Are we reducing turnover? Accelerating hiring? Reducing vacancies? Hiring diverse staff at all levels of the organization? Improving outcomes for kids and families?
3 REVIEW AND ADJUST• Both WIT and program leaders should be prepared to
continue focusing on identifying and developing new workforce reports and improving accuracy, detail and use of existing reports in decision making.

\ 14 \
ON THE FRONTLINE: DATA DRIVE BETTER RESULTS
Identifying the right data to collect, introducing surveys and building dashboards have spurred real success for Casey’s partner jurisdictions. With useful workforce data in hand, they have been able to hire and keep the right people for their jobs.
From the start, Jefferson County decided it needed a window on workers’ morale and best thinking. Its leaders fielded staff surveys three years in a row, implementing improvements in response. For example, when workers noted concerns about consistency and flexibility in scheduling, the agency launched an organizational health committee to work on those issues. The committee is also looking at workforce culture and what can be done to address secondary trauma and build resilience. It piloted Resilience Alliance, a program designed to mitigate secondary trauma symptoms experienced by child welfare staff, and secondary trauma’s impact on unit and agency functioning.18 “Use your staff as resources for improving staff retention,” says Mary Berg, former Jefferson County child welfare director, who now serves as executive executive director of the county’s Department of Human Services. “When you listen to their ideas and respond thoughtfully, the agency can really benefit.”
Jefferson County also designed useful workforce reports by tapping into the skills of a senior analyst who interfaces with its SACWIS system to connect data from that system to HR data, which is sometimes manually entered. The result: quarterly reports that show turnover rates in the intake and ongoing units and provide information on the average time to fill vacancies, the percentage of available staff in intake, and so on.
Cuyahoga County leaders were determined to address a stubborn 10 percent vacancy rate that had plagued them for years. They blamed their inability to shrink that number on a number of issues, such as a protracted hiring process and a lack of urgency in filling positions.
But after their WIT began to track monthly data on vacancies, new hires and numbers of applicants, they saw a different underlying problem. They simply didn’t have enough job applicants. They learned that although they may have had 200 applications per posting — which seems like plenty — the applicant pool inevitably dropped to 30 candidates for 40 positions by the time interviews rolled around.
Why? Because, on average, about 60 initial applicants were screened out as unqualified and 45 didn’t take the required merit system test. Another 35 didn’t score high enough on the test and 30 or so dropped out for various reasons.
Of the 30 candidates the county interviewed, they rejected 10 — making it difficult to fill the vacancies. By the time new staff were hired and trained, the agency was back up to 40 vacancies.
To break this cycle, the agency:
• intensified recruitment efforts and increased the frequency of the posting/interviewing cycle.
• made significant changes to the hiring process. The approach included:
– having authorization to fund “anticipatory vacancies,” which provides permission to recruit before a position is vacant;
– appointing monthly hiring panels, for which hiring supervisors were hiring for the agency, not for their own units’ vacancies; and
– streamlining the hiring process by clarifying roles between the agency and HR and decreasing paperwork.
Within a year, the vacancy rate dropped to 1 percent to 2 percent, where it has remained. “To make this sea change and have it stick has not only diminished some of the daily stresses for frontline workers but it has also been instrumental in reducing our backlog to zero,” says Cuyahoga’s Tammy Chapman Wagner, deputy director for intake, who worked closely with Michael Brown, her county’s HR manager.

\ 15 \
Step 5BUILD A POSITIVE ENVIRONMENT
One aspect of Casey’s On The Frontline work that took longer to articulate was the need to build a positive environment for workers — one that helps them cope with the stresses of their very difficult jobs.
This work began with annual worker satisfaction surveys and a request for supervisors to do regular retention interviews. A retention interview is a brief job satisfaction discussion a supervisor has with a current staff member. (See a sample in appendix D). The goal is to learn more about why people stay or leave. In Jefferson County, annual worker satisfaction survey and retention interviews helped identify candidates who were choosing not to continue in the application process or employees who might leave the organization. Then the county was able to design approaches to encourage good employees to stay.
At some point, Jefferson County staff noted a persistent issue that the initiative’s efforts had not completely addressed: The need to address workers’ emotional lives on the job.
A review of literature on the subject showed that four factors proved to have higher effects on turnover: stress, emotional exhaustion, job satisfaction and the perception of organizational commitment to employees. 19 As researchers noted, “organizations can help to address future worker turnover by creating a more favorable work environment for their workers… [and] be more than simply places of employment, but places that focus on the overall health and well-being of their workers.”20
As a result, in addition to using annual surveys of worker satisfaction, frequent retention interviews and (independent, when possible) exit interviews, Jefferson County convened an organizational health team that developed an organizational care plan that offered training on secondary traumatic stress.
On the Frontline has learned there are several key factors to building a positive work environment:
• Use annual surveys to elicit key information. You know now that you need to collect demographic information on your workforce. But what about data on your workers’ opinions and beliefs about their jobs, your organization and its culture? Do staff members believe agency policies are effective? Are their supervision and professional development needs being met? These are critical pieces of the puzzle. If you worry that a survey of your workers will expose negativity, think about it this way: it can also provide a floor on which you can build. If you seek to understand negative feedback without taking it personally, you can address key issues proactively and make your organization a more satisfying workplace before staff members resign.
• Consider focus groups and retention interviews to illuminate employee morale. Along with annual staff satisfaction surveys, consider holding periodic focus groups to explore employee morale and underscore the organization’s overall commitment to employee wellness. Also, have supervisors do brief retention interviews with individual staff members every six to 12 months.
• Help workers address the trauma and emotional challenges of their difficult agency jobs. In your surveys, focus groups and retention interviews, ask what would help employees better handle stress and demonstrate organizational commitment — and find ways to address stated needs. Consider using the Resilience Alliance model21 or another approach.
• Identify differences and similarities in opinions and needs among subgroups of workers, such as new hires, young people, people of color or workers who speak another language. To aid in this process, Jefferson County made sure to include worker race, ethnicity and gender in its data gathering.

\ 16 \
Implementation Timeline
1 RESEARCH AND PLAN• Choose — or have your WIT suggest —
tools for gathering worker input.
2 INVOLVE AND TEST • Develop field survey, focus group and/or interview
tools.
• Analyze results.
• Plan improvements to address identified needs.
3 IMPLEMENT• Move forward on plans to build a positive
environment.
• Consider organizing an organizational health workgroup.
• Sequence improvements, gathering feedback as you work.
4 EVALUATE AND ADJUST• Review feedback alongside other
workforce data.
• Add and adjust positive work environment approaches as needed.
ON THE FRONTLINE: IMPROVING MORALE AND RESULTS FOR KIDS, FAMILIES AND WORKERS
An early lesson learned from On the Frontline was the degree to which worker morale was tied to workers’ opinions about organizational health. Just organizing a WIT and talking about its aspirations improved morale, Gerber says. It takes time to move workforce indicators such as vacancy rates, she notes. But employees “recognize when the agency makes genuine efforts to improve,” she says. “It may be that today’s reality is the agency has high caseloads and is struggling to fill caseworker positions. But when an agency communicates about its improvement plans, and when employees see you make smart, targeted moves to improve, you can see upticks in morale in employee interviews and surveys, before new caseworkers are even hired or trained. It’s like employees are saying, ‘Phew — relief is coming!’”
In Jefferson County, efforts to build out an organizational health approach continue. More recently, the agency is implementing a plan to promote a two-pronged vision of their work, an agency vision (Children Thrive in Families) and an
employee vision (Workers Thrive in Jefferson County so Children Thrive in Families). The plan addresses seven organizational health levers, from emotional management and social learning to nonviolence and open communication and more. Each lever includes three lists (Working Well; Worries; Possible Next Steps).
“I am so proud of the team doing this work,” says Alysse Nemecek, a Jefferson County program manager. “It has made measurable differences in our office culture. A lot of what’s been done so far may seem like small steps, but employees are really focused on helping improve how we work together and support one another, whether by considering how onboarding can be enhanced or identifying avenues for employee appreciation and growth. It doesn’t always make a difficult job easier — but it can help staff feel supported by the agency and their colleagues.”

\ 17 \
ConclusionStrengthening the child welfare workforce is a perennial concern among child welfare leaders and staff members, especially those at the agency’s front door. While more research is always needed, work piloted in Casey’s On the Frontline partnership shows promising results when agencies take five steps toward hiring and retaining the right people in their agencies.
APPENDICES
1. Building a Workforce Innovation Team
2. Competency Model Q&A
3. In the Weeds with Data and Dashboards
4. Tools for Building a Positive Environment
FOR MORE INFORMATION For more detailed information, see the appendices that follow and become familiar with these additional resources:
• The National Child Welfare Workforce Institute (NCWWI) website (http://ncwwi.org/index.php/myncwwi-home), which includes a child welfare workforce development framework and toolkit, plus a variety of other materials, including Inventory of Innovations: Workforce Development (https://capacity.childwelfare.gov/states/focus-areas/workforce/innovations-series/?utm_source=march&utm_campaign=innovationsseries&utm_medium=cwigelert&utm_content=innovationsseriespage).
• The Casey Family Programs publication, Healthy Organizations Information Packet: How Does Turnover Affect Outcomes and What Can Be Done to Address Retention? (https://www.casey.org/turnover-costs-and-retention-strategies/)

\ 18 \
Appendix ABUILDING A WORKFORCE INNOVATION TEAM
To begin to assess your agency’s key workforce challenges, your WIT will need to identify big-picture challenges as well as perennial agency issues. The former may include the need to overcome bureaucratic roadblocks, such as antiquated performance evaluation systems and limited resources for training and development. The latter may include addressing disciplinary and performance issues and coping with high caseloads, weak supervision, low morale, mediocre performers and high turnover.
A successful WIT follows a general plan, assessing workforce challenges overall, then setting priorities with an eye toward identifying improvements that can create quick wins and those that are necessary but may take longer to show results. Your WIT will work best if it:
• takes a team approach, encouraging participation from multiple levels, functions and disciplines.
• involves 10-15 participants. This is large enough to generate ideas and discussion but small enough to be manageable. Participants usually include:
– an executive sponsor (usually a deputy or someone from the executive/management team) who attends regularly, supports the team effort, helps obtain needed resources and ensures WIT efforts align with the agency’s strategic plan, vision and values. Sometimes this person is the WIT chair or co-chair.
– HR. This could be the HR manager (who may co-chair the team) or an HR analyst assigned to your agency. Larger departments may want to involve two or three HR staffers (perhaps a recruiter, a data specialist and/or a professional development specialist).
– a chair or co-chair who is at least a first-line services supervisor. This person’s charge should focus on higher-level tasks, such as keeping the WIT focused on results, plus logistical tasks, such as keeping everyone informed about the team’s progress, setting agendas, running meetings and doing between-meeting planning.
– a workforce data person. He or she can be from HR, but if HR doesn’t track workforce data in sufficient detail, you will need someone else on the team to develop data reports.
– line-organization representatives from different program specialties within child welfare. For example, you might include two caseworkers, two frontline supervisors and two section managers.
– a program training person — especially someone involved with developing new worker training.
\ 19 \
Some critical WIT tasks:
• Discuss overall workforce goals.
• Identify data that will help the team prioritize and assess progress.
• Identify the agency’s major workforce challenges (such as turnover, time to fill, supervision, etc.).
• Gather input from peers outside the WIT.
• Set overarching goals, such as “reducing turnover,” then identify gap-closing strategies. To succeed, the WIT will need cross functional input and be (or become well versed) in current HR approaches. If you are short on up-to-date HR knowledge, you may need to bring on an HR consultant.
• Develop and track implementation of a communications plan that reaches out to various audiences.
• Develop a long-range workplan.
WORKPLAN TIPSRemember, this work takes time to show results — make sure everyone understands change is not expected overnight. You need a team and a workplan focused on long-term goals. We recommend laying out a carefully sequenced three-year workplan. Your first priorities should be those actions that can create a big difference quickly, provide a necessary foundation for later actions and demonstrate agency commitment to positive change. Use subcommittees as needed to get work done; have WIT members chair or co-chair subcommittees.
The plan might look something like this:
YEAR ONE
• Map and streamline the hiring process.
• Identify workforce data priorities; identify how to get needed data; assign responsibility to collect and analyze data.
• Develop competency models.
• Identify key themes for a meaningful satisfaction survey.
• Administer first employee satisfaction survey.
• Develop and implement recruitment plan.
• Identify major reasons for turnover.
• Develop a hiring/new worker training plan.
• Develop process for anticipatory hiring.
• Plan how and when to communicate about the agency’s workforce efforts.

\ 20 \
YEAR TWO
• Develop and execute a plan to communicate about the benefits of the competency model and a competency culture.
• Develop competency-based behavioral interviewing questions, develop hiring forms and processes, train hiring managers, implement system.
• Develop supervision model.
• Develop and implement onboarding policies.
• Administer second job satisfaction survey.
• Identify and implement retention strategies.
• Develop realistic job preview.
• Consider developing transition units or other protocols to transition new caseworkers from training to everyday work.
• Administer competency survey, analyze findings, develop strategies.
• Develop measurable goals.
YEAR THREE
• Develop or enhance performance management system based on competency model and objectives.
• Administer third satisfaction survey.
• Administer second competency survey, analyze findings, develop strategies.
• Evaluate effectiveness of previously-introduced gap closing strategies and introduce improvements.
• Monitor vacancy rates continually and plan to address them as needed.
• Conduct succession planning.22

\ 21 \
Appendix BBUILDING COMPETENCY MODELS
This appendix includes three sections:
• Competency Model Q&A
• Background on competency models developed by On the Frontline agencies
• Sample competency model

\ 22 \
Competency Model Q&A
Q: Why are competency models so important to strengthening and supporting an agency’s frontline workforce?
A: Bringing people in the door who have the competencies necessary for successful performance helps you get the results you need and retain key staff. To strengthen your workforce, make sure that your agency also:
• promotes employees who have the competencies necessary for supervision;
• provides performance feedback on the competencies essential to achieving the desired results in each job, which is key to strengthening the workforce at all levels;
• offers staff at all levels training and development opportunities in the competencies essential for successful performance; and
• gives employees at all levels exposure to and support in developing higher level competencies needed for promotion and succession planning.
Q: What do competency models actually look like?
A: Competency models include:
• position titles plus a list of required competencies, with brief definitions; and
• key benchmarks for each competency (benchmarks are observable actions and behaviors that employees demonstrate).
Q: How can a competency model be used most effectively in an agency?
A: Make the competency model the foundation of your organization’s HR programs; embed it in all processes and procedures. Make sure that employees selected based on their competencies are given feedback on how they are performing on those competencies once they’ve been hired. They and others within the organization also need developmental opportunities to strengthen their proficiency in key competencies. Having all HR practices align around the model brings understanding, consistency and direction to an HR system.
Also, implementation science, which studies what’s effective in bringing about organizational change, teaches that without embedding new practices throughout an agency, the practices won’t take. The competency wheel graphic illustrates that competency thinking must be embedded throughout all HR processes.
GLOSSARY
Competencies: The knowledge, skills and behavioral attributes required to achieve the desired results in a position. Competencies are generally divided into four categories: teamwork, decision making, communications and adaptivity.
Competency model: A specific set of approximately a dozen competencies unique to successful performance in a particular job or classification.
Competency culture: An agency has a competency culture once core competencies for positions or classifications have been identified and integrated into all HR practices and are the basis for recruitment and selection, performance management and professional development.

\ 23 \
Q: Should competency models be implemented organization-wide all at once?
A: Think about the best way to introduce competency models in your agency. Typically, organizations take it slow, because change is hard.
Many agencies introduce competency models beginning with their new employee selection or performance evaluation process. Others start with recruitment and selection, because even merit systems that require them to use lists of “eligible applicants” allow agencies the flexibility to determine their interviewing and scoring protocol.
When turnover is high, use competency-based behavioral interviewing to improve your hiring process and bring in stronger performers.23
Another option is to introduce competency models into the performance management system first, as this system affects all employees, not just new hires. A potential downside is that you may not be able to adjust the performance management approach. Don’t give up; workarounds may be possible. The Foundation has worked with agencies that have designed performance evaluation “sub-systems” to support and enhance their HR-led system. In our view, good performance management systems are year-round performance feedback systems that culminate in an annual review and provide feedback in three areas:
1. the employee’s ability to meet performance objectives;
2. employee proficiency in specific competencies; and
3. linking professional development to growing employee competencies.24
1 Employee Recruitment
2 Employee Selection
3 Performance Management5 Employee Retention
4 Professional Development
6 Succession Planning
COMPETENCIES
THE WORKFORCE COMPETENCY MODEL

\ 24 \
Q: Why does an agency need a communications plan to describe its move toward a competency culture?
A: Changing how your agency works is harder to accomplish than you might think. Organizational change requires that you identify change champions and communicate, communicate, communicate with all audiences whose work is affected by the changes you are planning — which is to say, everyone in the organization.
Communicate:
• as soon as possible once the models are finalized. Many staff will have been involved in the process. They can champion the results and help peers see the benefits.
• to let everyone know certain skills and behaviors are valued by the organization, are key to successful job performance and will influence most aspects of how the agency does its work.
• to all levels of the organization. Everyone from frontline staff to executive leaders should become familiar with the models to understand what is expected, valued and rewarded.
• frequently and effectively. Remind staff continuously that these competencies are important. Get their attention — make your outreach brief and positive.
Q: What are some of the best ways to communicate about a competency culture?
A: Most organizations start with an “all-staff ” memo or email describing what the competencies are, how they were developed and how they’ll be used. Consider using other electronic communications as well as posters, buttons, screen savers and other creative ways to get your message out.
Cuyahoga County used several creative approaches to showcase its new competency models, including:
• featuring a “competency of the week” in new worker training.
• printing competency titles on coffee mugs, water bottles and desk accessories.
• periodically featuring a short article on a specific competency in its “News You Can Use” publication.
• featuring specific competencies in “bathroom reader” flyers inside bathroom stalls. Flyers defined the competency and featured a quote from an employee championing the importance of the competency.
\ 25 \
Background on competency models developed by On the Frontline agencies
To begin developing competency models of their own, both Cuyahoga and Jefferson counties first reviewed a list of competencies,25 a 34-item list of desired employee characteristics. After the counties went through a review and discussion process, they found they had made mostly similar and a couple divergent choices for the two positions they sought to describe (caseworker and supervisor). Which competencies make sense for your jurisdiction’s workforce? Have your WIT review the competency library to decide.

\ 26 \
Appendix CIN THE WEEDS WITH DATA AND DASHBOARDS
This appendix includes:
• Steps to Create a Workforce Dashboard (plus Two Sample Dashboards and a Presentation)
• Dashboard Q&A: How to use, read and benefit from the dashboard
\ 27 \
Steps to Create a Workforce Dashboard (Plus Two Sample Dashboards and a Presentation)
Dashboard data should be collected automatically and reviewed quarterly. To create a workforce dashboard for your agency:
1. Compute who is available to carry a full caseload. To do this, identify the number of filled positions for all caseworkers and for the subset of caseworkers responsible for investigations. For each category, subtract from the number of filled positions:
a. vacant positions;
b. workers currently in new worker training and
c. workers currently on leaves of absence.
2. Compute caseworker retention rates. Again, look at all caseworkers and the subset of caseworkers in investigations. For each, calculate a turnover rate by dividing the number of departures by the average number of positions filled in the previous fiscal year.
3. Review how experienced your staff members are. How will you want to track how many and what percentage of all caseworkers are new vs. more experienced? We suggest dividing them into four subcategories: Those who have been with the agency for less than a year, between one and two years, between two and five years and five or more years.
4. Enrich your dashboard(s) over time. Consider using multiple, simple workforce dashboards to track key data. For example, create a demographic dashboard. Being able to review demographic information will help you identify and address weak spots, especially in retention rates, quickly, as Figure 2 demonstrates. Figure 3 illustrates how charts can help others understand your data quickly.

\ 28 \
Data No. % No. % No. % No. % No. % No. % No. %
Authorized Caseworkers (Total Positions)
34 42 69 42 49 49 285
Filled Positions 29 85.3% 35 83.3% 59 85.5% 35 83.3% 42 85.7% 44 89.8% 244 85.6%
Vacant Positions 5 7 10 7 7 5 41 14.4%
New Worker Training 2 4 5 2 3 4 20 7.0%
Leaves of Absences 1 1 0 0 1 2 5 2.0%
Available Caseworkers* 26 76.5% 30 71.4% 54 78.3% 33 78.6% 38 77.6% 38 77.5% 219 76.8%
Authorized Caseworkers - Investigations
5 5 69 6 6 5 96
Filled Positions 3 60.0% 4 80.0% 59 85.5% 4 66.6% 5 83.3% 3 60.0% 78
Vacant Positions 2 1 10 2 1 2 18 18.8%
New Worker Training 1 2 5 1 2 1 12
Leaves of Absences 0 1 0 0 0 0 1
Available Caseworkers* 2 40.0% 1 20.0% 54 78.3% 3 50.0% 3 50.0% 2 40.0% 65 67.7%
Caseworker Departures 5 7 10 7 7 5 41
Total CW Turnover Rate**
17.2% 20.0% 16.9% 20.0% 16.6% 11.3% 16.8%
Investigations Caseworker Departures
3 2 6 3 3 2 19
Investigations Turnover Rate 75.0% 40.0% 10.2% 50.0% 40.0% 66.0% 24.4%
Caseworkers under 1 year 5 9 15 6 7 6 48 19.7%
Caseworkers 1-2 years 8 17 13 13 11 11 73 30.0%
Caseworkers 2-5 years 5 8 16 8 9 7 53 21.7%
Caseworkers 5 years and more
8 9 18 10 12 13 70 28.7%
STAFFING - INVESTIGATIONS CASEWORKERS
RETENTION - ALL CASEWORKERS
RETENTION - INVESTIGATIONS
CASEWORKER EXPERIENCE - ALL CASEWORKERS
STAFFING - ALL CASEWORKERS
DISTRICT 1 DISTRICT 1 DISTRICT 1 DISTRICT 1 DISTRICT 1 DISTRICT 1 AGENCY TOTAL
FIGURE 1: SAMPLE AGENCY DASHBOARD (COMPARING ACROSS REGIONS)DATE: 12.31.20XX
*Filled Positions minus those in New Worker Training and Leave of Absence**Caseworker turnover rate is calculated by number of departures divided by average number of positions filled during 20XX

\ 29 \
2017 2016 2015 2014 2017 2016 2015 20142017
TOTAL ACTIVE
2016 TOTAL ACTIVE
2015 TOTAL ACTIVE
2014 TOTAL ACTIVE
White 78.22% 78.24% 81.00% 80.92% 176 169 162 140 225 216 200 173
Black or African American
4.00% 3.70% 2.50% 2.31% 9 8 5 4 225 216 200 173
Hispanic or Latino 9.33% 9.26% 8.00% 9.83% 21 20 16 17 225 216 200 173
Asian or Pacific Islander
1.33% 1.85% 2.00% 1.73% 3 4 4 3 225 216 200 173
American Indian/Alaskan Native
0.44% 0.46% 2.00% 0.00% 1 1 4 0 225 216 200 173
Two or More Races
1.78% 1.39% 2.00% 1.73% 4 3 4 3 225 216 200 173
Other 0.44% 0.46% 0.50% 0.58% 1 1 1 1 225 216 200 173
Unknown 4.44% 4.63% 4.00% 2.89% 10 10 8 5 225 216 200 173
FIGURE 2: SAMPLE OF DEMOGRAPHIC WORKFORCE DASHBOARD CURRENT AGENCY WORKFORCE (BY RACE AND ETHNICITY)
NEW RECRUITS BY GENDER
YEAR JOB TITLE FEMALE MALE NO ANSWER FEMALE MALE NO
ANSWER TOTAL
2015 Caseworker (Intake OR Permanency) 73% 26% 1% 66 23 1 90
2016 Caseworker (Intake OR Permanency) 74% 24% 2% 447 144 10 601
GENDER % GENDER

\ 30 \
NEW RECRUITS BY RACE AND ETHNICITY
YEAR JOB TITLE AMERICAN INDIAN
ASIAN PACIFIC
ISLANDERBLACK HISPANIC
TWO OR MORE RACES
WHITE NO ANSWER
2015 Caseworker (Intake OR Permanency) 0% 1% 8% 17% 2% 64% 8%
2016 Caseworker (Intake OR Permanency) 1% 3% 9% 15% 6% 62% 4%
ETHNICITY %
YEAR JOB TITLE AMERICAN INDIAN
ASIAN PACIFIC
ISLANDERBLACK HISPANIC
TWO OR MORE RACES
WHITE NO ANSWER TOTAL
2015 Caseworker (Intake OR Permanency) 0 1 7 15 2 58 7 90
2016 Caseworker (Intake OR Permanency) 8 19 52 88 36 374 24 601
ETHNICITY
FULL
COU
NT
AGE
MIN
AGE
MAX
AVER
AGE
AGE
MED
IAN
AGE
SD
AGE
18 -
25
AGE
26 -
35
AGE
36 -
45
AGE
46 -
55
AGE
56 -
65
AGE
66 +
FEM
ALE
COUN
T
%
MAL
E CO
UNT
%
SSW3 487 22 73 40 41 10.51485402 40 120 187 96 38 6 410 84.19% 77 15.81%
Social Service Supervisor
94 30 66 45 45 7.019639 0 7 48 31 7 1 78 82.98% 16 17.02%
Sr. Social Service Supervisor
18 39 64 50 50 8.112968 0 0 7 7 4 0 12 66.67% 6 33.33%
STAFF AT DIFFERENT LEVELS BY AGE, GENDER, RACE AND ETHNICITY
DCFS AGE/ SEX DEMOGRAPHICS
AFRI
CAN
AMER
ICAN
%
ASIA
N/ P
ACIF
IC
ISLA
NDER
%
WHI
TE
%
LATI
NO/ H
ISPA
NIC
%
NATI
VE A
MER
ICAN
/ IN
DIGE
NOUS
%
TWO
OR M
ORE
RACE
S
%
OTHE
R
%
CHOS
E TO
NOT
ID
ENTI
FY
%
SSW3 259 53.18% 1 0.21% 130 26.69% 14 2.87% 1 0.21% 12 2.46% 31 6.37% 39 8.01%
Social Service Supervisor
48 51.06% 0 0.00% 36 38.30% 3 3.19% 0 0.00% 0 0.00% 0 0.00% 7 7.45%
Sr. Social Service Supervisor
8 44.44% 0 0.00% 10 55.56% 0 0.00% 0 0.00% 0 0.00% 0 0.00% 0 0.00%
DCFS RACE DEMOGRAPHICS

\ 31 \
FIGURE 3: USE CHARTS TO ILLUSTRATE YOUR WORKFORCE DATA
1
Available Staff = Filled Positions minus Staff in New Worker Training and on FMLA divided by Authorized Positions. These are based on hours per day in each category over the quarter.
% of Intake Staff Available
70%
75%
80%
85%
90%
95%
100%
Q3 Q4 Q1 Q2 Q3 Q4 Q1 Q2
82.30%
90.00%
2015 2016 2017
2
Caseworker and Lead Caseworker Vacancy Rate in Intake. Vacant positions divided by allocated (authorized) positions. Excludes part time, after hours and pre-vacancy.
Intake Vacancy Rate
0%
5%
10%
15%
20%
Q1 Q2 Q3 Q4 Q1 Q2 Q3 Q4 Q1 Q2 Q3 Q4 Q1 Q2
9.60%
2.90%
2015 2016 20172015

\ 32 \
4
Intake Caseworker and Lead Caseworker Turnover excludes part time, after hours and pre-vacancy. Only includes external turnover. Percentage is determined by number of people who left during the quarter divided by the average number of employees on board.
Intake Worker Turnover Rate
0%
5%
10%
15%
20%
25%
30%
Q1 Q2 Q3 Q4 Q1 Q2 Q3 Q4 Q1 Q2 Q3 Q4 Q1 Q2
4.00%
7.00%
2015 2016 20172015
5
All Caseworker and Lead Caseworker Turnover excludes part time, after hours and pre-vacancy. Only includes external turnover. Percentage is determined by number of people who left during the quarter divided by the average number of employees on board.
All Caseworker Turnover Rate
0%
5%
10%
15%
20%
Q1 Q2 Q3 Q4 Q1 Q2 Q3 Q4 Q1 Q2 Q3 Q4 Q1 Q2
9.00%
5.00%
2015 2016 20172015
3
All Caseworker and Lead Caseworker Vacancy Rate. Vacant positions divided by allocated (authorized) positions. Excludes part time, after hours and pre-vacancy.
All Caseworker Vacancy Rate
0%
5%
10%
15%
Q1 Q2 Q3 Q4 Q1 Q2 Q3 Q4 Q1 Q2 Q3 Q4 Q1 Q2
6.12%
2.10%
2015 2016 20172015

\ 33 \
Dashboard Q&A
Q: What are the benefits of a dashboard?
A: Having data and tracking change over time helps you understand what resources you have to do your job. As you see improvements or problems in staffing-related data, you can address them as early as possible.
Q: What information does the dashboard provide about hiring and retention?
A: A dashboard may help you identify patterns over time, such as frequent drops in your worker census at the end of the school year or at the beginning of winter holiday season. With that information in hand, you can work to stop worker exits or start hiring sooner (or both).
Q: Why break the dashboard into categories, keeping data on different regions, for example, and by different job class or role?
A: The goal is to identify and address any outliers. Workforce problems may be agency wide and require a systemic solution. On the other hand, they could also be quite narrow, requiring a more targeted response. As an example, let’s say you find that one region has twice the average turnover of other regions. You can do some research to find out why, then work to stop the bleeding. Maybe infrequent or poor supervision in one region is fueling exits — or perhaps there is a higher level of dissatisfaction among all entry-level caseworkers throughout the agency. Each would spark a different solution. Also, once you’ve made a change with the intention of solving a problem, you will want to keep checking movement in the dashboard to see if your changes are working or not. Sometimes they work — and sometimes you need to go back to the drawing board!
Q: Should dashboard information be kept confidential?
A: No. Sharing dashboard information can benefit you. When your agency is preparing its budget, for example, it helps to have information that describes why you need a certain number of caseworkers. Or, for that matter, the budgetary impact of legislative policies. If your jurisdiction is required to keep caseloads within a certain range, for example, you can use information from your dashboard to explain how a recent surge in entries puts pressure on your hiring, your budget and child and family outcomes. You might also be able to use data on the number of available staff vs. the number of approved positions to demonstrate why additional positions may be needed to achieve certain caseload levels.

\ 34 \
Q: Why so many options — an overall dashboard, additional dashboards with demographic and other information, plus charts. Are all of these necessary?
A: We believe the overall dashboard is critical. But there can be benefits to adding more dashboards, plus charts. Each option gives you a different way to tell the story of your workplace and your ability to marshal the resources you need to do your job. Depending on the size of your jurisdiction, your political environment and your organizational culture, you can decide what mix of data works best.

\ 35 \
Appendix DTOOLS FOR BUILDING A POSITIVE WORK ENVIRONMENT
This appendix includes:
• Sample annual staff satisfaction survey
• Sample employee retention interview questions

\ 36 \
Sample annual staff satisfaction survey
Thank you for filling out this anonymous survey to help us improve our organizational culture, retain team members and gauge organizational secondary trauma.
• No identifying information will be associated with the responses.
• It should take you about five minutes to respond.
Thank you for your candid responses. We appreciate your contribution to this effort, value your input and thank you for your time.
Survey questions are divided into eight categories:
• Demographic information
• General job satisfaction
• Supervision and performance
• Organizational culture
DEMOGRAPHIC INFORMATION
1. What is your job title?
Associate director/program manager
Supervisor
Lead caseworker
Caseworker
Associate caseworker
Support staff/visitation facilitator
2. In what program area do you work?
Intake
Permanency
Specialized services
Support staff
Adult protection
3. How long have you worked at the agency?
0-6 months
6-12 months
1-2 years
2-3 years
3-5 years
• Training and professionalism
• Workplace safety
• Hiring
• Keeping staff on the job

\ 37 \
5-10 years
10-15 years
15-20 years
20-25 years
More than 25 years
4. How long have you worked in the social services field?
0-6 months
6-12 months
1-2 years
2-3 years
3-5 years
5-10 years
10-15 years
15-20 years
20-25 years
More than 25 years
5. What is your age?
18-29
30-39
40-49
50-59
60+
Prefer not to answer
6. I am satisfied with my job.
Strongly agree
Agree
Neither agree nor disagree
Disagree
Strongly disagree
Prefer not to answer

\ 38 \
7. I am satisfied with my pay.
Strongly agree
Agree
Neither agree nor disagree
Disagree
Strongly disagree
Prefer not to answer 8. I am satisfied with the benefits offered to me.
Strongly agree
Agree
Neither agree nor disagree
Disagree
Strongly disagree
Prefer not to answer
9. I have the proper equipment and supplies to do my job well.
Strongly agree
Agree
Neither agree nor disagree
Disagree
Strongly disagree
Prefer not to answer
10. My co-workers help me get the job done.
Strongly agree
Agree
Neither agree nor disagree
Disagree
Strongly disagree
Prefer not to answer
11. I can usually manage my workload in a 40-hour work week.
Strongly agree
Agree
Neither agree nor disagree

\ 39 \
Disagree
Strongly disagree
Prefer not to answer
12. I feel that I am making a positive impact in a family’s life.
Strongly agree
Agree
Neither agree nor disagree
Disagree
Strongly disagree
Prefer not to answer
13. Please add any comments or suggestions you may have about general job satisfaction.
SUPERVISION AND PERFORMANCE MANAGEMENT
14. Please rate your agreement with the following statements, from “strongly agree” to “strongly disagree.”
STRONGLY AGREE AGREE NEITHER AGREE
OR DISAGREE DISAGREE STRONGLY DISAGREE
My direct supervisor sets clear job performance expectations.
My direct supervisor provides useful coaching and feedback on my work.
My direct supervisor assigns work fairly to all employees.

\ 40 \
15. Please add any comments or suggestions you may have about our organizational culture (the inner workings, values and behaviors within our workplace), especially related to how our organizational culture affects your ability to be resilient, manage stress and guard against secondary trauma (the emotional duress of seeing or hearing about the firsthand trauma experiences of others).
STRONGLY AGREE AGREE NEITHER AGREE
OR DISAGREE DISAGREE STRONGLY DISAGREE
I participate in group supervision weekly.
My direct supervisor facilitates group supervision well.
Group supervision is beneficial to my work and professional development.
If I get direction from another supervisor, the direction is similar to what I would receive from my direct supervisor.
The supervisors in my section have consistent expectations.
My job description accurately reflects the duties I perform.
I have adequate opportunities to provide input on my performance plan, goals and evaluation.
My last performance review recognized my achievements and helped me identify areas where I need to improve.
My direct supervisor holds everyone accountable to the same performance and conduct standards.
My direct supervisor maintains high standards of performance in his or her own work.
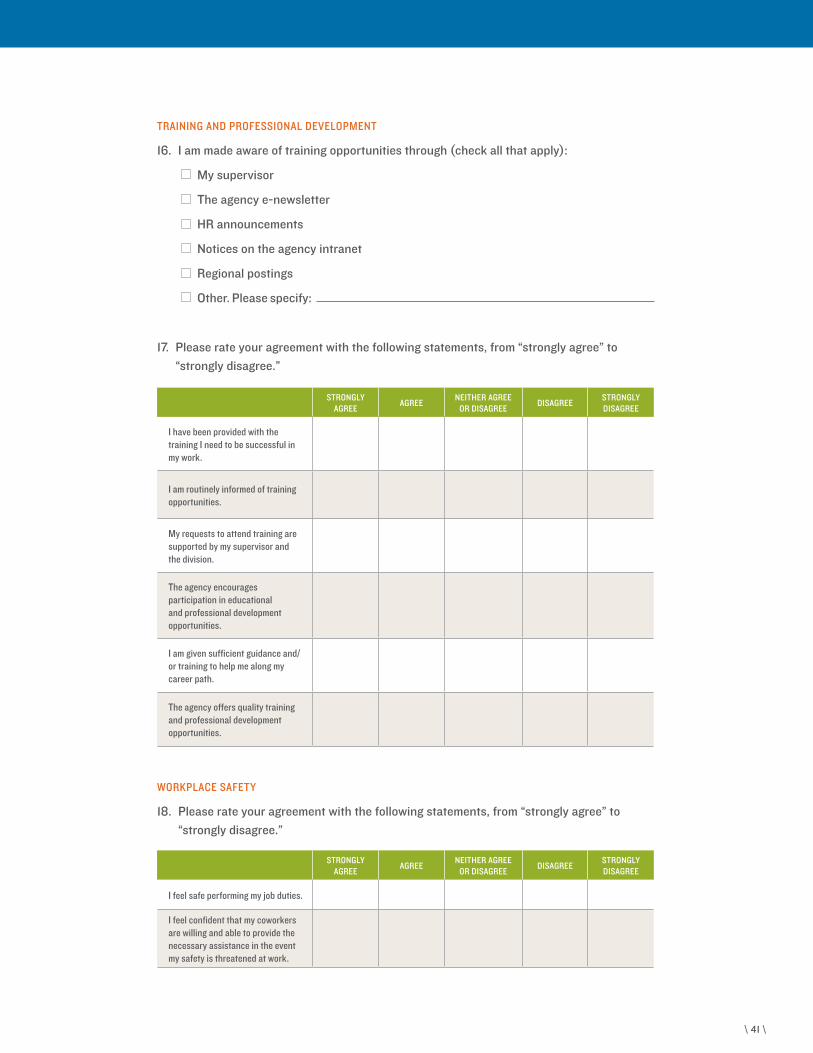
\ 41 \
TRAINING AND PROFESSIONAL DEVELOPMENT
16. I am made aware of training opportunities through (check all that apply):
My supervisor
The agency e-newsletter
HR announcements
Notices on the agency intranet
Regional postings
Other. Please specify:
17. Please rate your agreement with the following statements, from “strongly agree” to “strongly disagree.”
WORKPLACE SAFETY
18. Please rate your agreement with the following statements, from “strongly agree” to “strongly disagree.”
STRONGLY AGREE AGREE NEITHER AGREE
OR DISAGREE DISAGREE STRONGLY DISAGREE
I have been provided with the training I need to be successful in my work.
I am routinely informed of training opportunities.
My requests to attend training are supported by my supervisor and the division.
The agency encourages participation in educational and professional development opportunities.
I am given sufficient guidance and/or training to help me along my career path.
The agency offers quality training and professional development opportunities.
STRONGLY AGREE AGREE NEITHER AGREE
OR DISAGREE DISAGREE STRONGLY DISAGREE
I feel safe performing my job duties.
I feel confident that my coworkers are willing and able to provide the necessary assistance in the event my safety is threatened at work.

\ 42 \
HIRING PRACTICES
19. Please rate your agreement with the following statements, from “strongly agree” to “strongly disagree.”
20. Please add any comments and suggestions you may have about safety and hiring practices:
STRONGLY AGREE AGREE NEITHER AGREE
OR DISAGREE DISAGREE STRONGLY DISAGREE
I have concerns about my personal safety in the community connected to my work.
Adequate measures are in place to ensure the safety and security of employees and clients in my workplace.
The safety training I receive at work is adequate and effective.
The agency is responsive to staff concerns about safety.
STRONGLY AGREE AGREE NEITHER AGREE
OR DISAGREE DISAGREE STRONGLY DISAGREE
The hiring and orientation process is streamlined and provides the initial information to be ready for the job.
I believe I am a “good fit” for the type of work I do here at the agency.
I think the agency does a good job attracting, recruiting and hiring qualified people.

\ 43 \
KEEPING STAFF ON THE JOB (RETENTION)
21. Please rate your agreement with the following statements, from “strongly agree” to “strongly disagree.”
22. Please add any comments and suggestions you may have about retention issues:
23. Please feel free to make any additional comments about your employment with the agency:
STRONGLY AGREE AGREE NEITHER AGREE
OR DISAGREE DISAGREE STRONGLY DISAGREE
I feel a strong sense of job security.
The agency works to retain qualified staff.
I will seek employment outside the agency within the next year.
I would recommend the agency as an employer to friends or family.
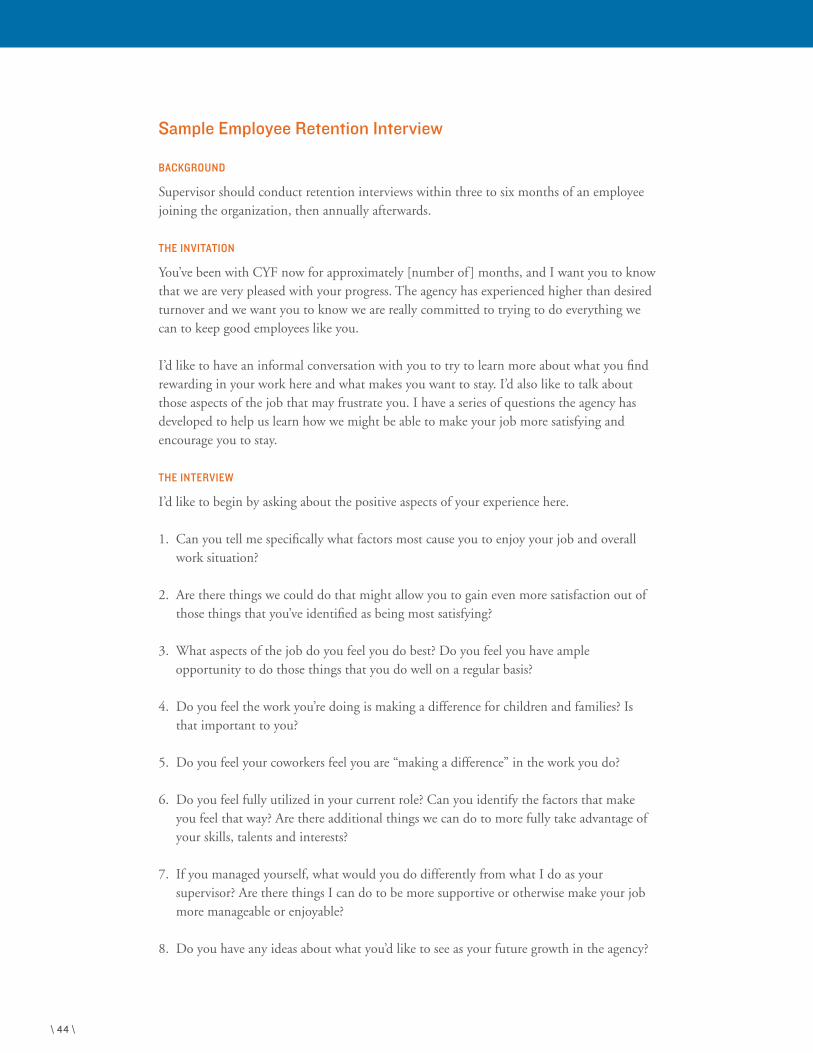
\ 44 \
Sample Employee Retention Interview
BACKGROUND
Supervisor should conduct retention interviews within three to six months of an employee joining the organization, then annually afterwards.
THE INVITATION
You’ve been with CYF now for approximately [number of ] months, and I want you to know that we are very pleased with your progress. The agency has experienced higher than desired turnover and we want you to know we are really committed to trying to do everything we can to keep good employees like you.
I’d like to have an informal conversation with you to try to learn more about what you find rewarding in your work here and what makes you want to stay. I’d also like to talk about those aspects of the job that may frustrate you. I have a series of questions the agency has developed to help us learn how we might be able to make your job more satisfying and encourage you to stay.
THE INTERVIEW
I’d like to begin by asking about the positive aspects of your experience here.
1. Can you tell me specifically what factors most cause you to enjoy your job and overall work situation?
2. Are there things we could do that might allow you to gain even more satisfaction out of those things that you’ve identified as being most satisfying?
3. What aspects of the job do you feel you do best? Do you feel you have ample opportunity to do those things that you do well on a regular basis?
4. Do you feel the work you’re doing is making a difference for children and families? Is that important to you?
5. Do you feel your coworkers feel you are “making a difference” in the work you do?
6. Do you feel fully utilized in your current role? Can you identify the factors that make you feel that way? Are there additional things we can do to more fully take advantage of your skills, talents and interests?
7. If you managed yourself, what would you do differently from what I do as your supervisor? Are there things I can do to be more supportive or otherwise make your job more manageable or enjoyable?
8. Do you have any ideas about what you’d like to see as your future growth in the agency?

\ 45 \
9. Do you feel you have been appropriately and adequately recognized and acknowledged for your work at the agency thus far? Is there anything more I can do to better acknowledge your good work?
10. If you were to ever begin to consider leaving the agency, can you help me understand what kind of “triggers” or negative factors might cause you to consider leaving? Please include both job and agency trigger factors.
11. Thinking back over the time you have been here, can you think of any times where you have been frustrated or anxious about your current role? Can you identify for me one or more of those frustration factors? Can you help me understand what eventually happened to lower that frustration level?
12. If you’ve had conversations with other employees who are considering leaving or who have left the agency, did any of the reasons they provided cause you to at least partially nod in agreement? If so, can you list those factors and tell me why they seemed to you to be at least partially justifiable as a reason for leaving?
13. Are there any other things that might cause you to consider leaving the agency?
14. Do you have any additional thoughts or ideas that you’d like to share at this point?
\ 46 \
1 While this paper looks narrowly at child protection staff, its lessons apply to all public agencies looking to get and keep the right people.
2 National Child Welfare Workforce Institute. (n.d.). Why the workforce matters. Retrieved from http://ncwwi.org/files/Why_the_Workforce_Matters.pdf
3 CPS HR Consulting. (2006). The turnover toolkit: A guide to understanding and reducing employee turnover: Tool 1 — Calculating the cost of employee turnover (Excerpted chapter). Retrieved from www.aecf.org/m/workforcedocs/cpshr-calculatingthecostofemployeeturnover-2006.pdf
4 On the Frontline was the Annie E. Casey Foundation’s three-year effort to measurably improve the leading edge of the child welfare workforce, developed in partnership with Ohio’s Cuyahoga County Division of Children and Family Services and Colorado’s Jefferson County Division of Children, Youth and Families.
5 Business-process mapping presents as a visual display the results of various activities that identify how work is really done within an organization versus how it is supposed to be done (by policy) or is thought to be done (by workers), with an eye toward improving key organizational results.
6 This paper uses the WIT name generically — different counties’ teams may have different names or charges.
7 Casey Family Programs. (2017). Healthy organizations information packet: How does turnover affect outcomes and what can be done to address retention? Retrieved from www.casey.org/turnover-costs-and-retention-strategies
8 Cyphers, G., Light, A., Gertz, L. L., McGowan, N., Vandergrift, K. F., & Plummer, M. (2005). Report from the 2004 Child Welfare Workforce Survey: State agency findings. Washington, DC: American Public Human Services Association
9 CPS HR Consulting. (n.d.). Competency-based behavioral interviews: Frequently asked questions. Retrieved from www.aecf.org/m/workforcedocs/cpshr-behavioralinterviewing-faqs-2010.pdf
10 For a variety of materials on and tools for a building competency-based culture, see the following from CPS HR Consulting: Overview: The integrated competency model. Retrieved from www.aecf.org/m/workforcedocs/cpshr-integratedcompetencymodel.pdf; Identifying competencies for the jobs in your organization. Retrieved from www.aecf.org/m/workforcedocs/cpshr-identifyingcompetenciesforthejobs-2007.docx; Key components for an effective job description. Retrieved from www.aecf.org/m/workforcedocs/cpshr-keycomponentsforeffectivejobdescription-2007.docx; Demand analysis: Competency assessment. Retrieved from www.aecf.org/m/workforcedocs/cpshr-demandanalysiscompetencyassessment-2007.docx; Guidelines: Identifying competencies. Retrieved from www.aecf.org/m/workforcedocs/cpshr-guidelinesidentifycompetencies-2007.docx; Validate competencies. Retrieved from www.aecf.org/m/workforcedocs/cpshr-validatecompetencies-2007.docx
11 Several authors have described how competency models can move hiring practices away from biased decision making at the individual and organizational levels. One example from the business world can be found in this blog from HRSG (retrieved from https://resources.hrsg.ca/blog/using-competencies-to-enhance-workplace-diversity). The University of California’s competency model
provides another example (learn more at https://www.ucop.edu/human-resources/_files/uc-core-competency-model.pdf ).
12 CPS HR Consulting. (n.d.). Competency library guidelines. Retrieved from www.aecf.org/m/workforcedocs/cpshr-competencylibraryguidelines.pdf
13 Kim, H. & Kao, D. (2014). A meta-analysis of turnover intention predictors among US child welfare workers. Children and Youth Services Review, 47, 214–223
14 Casey Family Programs (2017).
15 SACWIS is the acronym for the Statewide Automated Child Welfare Information System used by many states and jurisdictions.
16 For more tools, see the turnover tool referenced in endnote 3 and the following from CPS HR Consulting: Designing and analyzing turnover data reports. Retrieved from www.aecf.org/m/workforcedocs/cpshr-designingandanalyzingturnover.pdf; Sample turnover reports. Retrieved from www.aecf.org/m/workforcedocs/cps-sampleturnoverreports-2007.xlsx
17 CPS HR Consulting. (2006).
18 For more information, see http://www.cebc4cw.org/program/resilience-alliance/detailed
19 Kim, H. & Kao, D. (2014).
20 Kim, H. & Kao, D. (2014).
21 This model is designed to address secondary trauma systems. For more information, see www.cebc4cw.org/program/resilience-alliance/detailed
22 For more information on succession planning, see the following tools from CPS HR Consulting: Competency-based succession planning. Retrieved from www.aecf.org/m/workforcedocs/cpshr-competencybasedsuccessionplanning-2007.docx; Succession planning templates. Retrieved from www.aecf.org/m/workforcedocs/cpshr-successionplanningtemplates-2007.docx; Acceleration pool nomination form. Retrieved from www.aecf.org/m/workforcedocs/cpshr-accelerationpoolnominationform-2007.docx; Acceleration pool applicant profile. Retrieved from www.aecf.org/m/workforcedocs/cpshr-accelerationpoolapplicantprofile-2007.docx
23 As an example, see two tools from CPS HR Consulting: Competency-based employee selection. Retrieved from www.aecf.org/m/workforcedocs/cpshr-competencybasedemployeeselection-2007.docx; Sample training workbook for behavioral-based interviewing. Retrieved from at www.aecf.org/m/workforcedocs/cpshr-trainingworkbookbehavioralbasedinterviewing.pdf
24 For more information, see these tools from CPS HR Consulting: Competency-based performance management. Retrieved from www.aecf.org/m/workforcedocs/cpshr-competencybasedperformancemanagement-2007.docx; Performance evaluation: Competency proficiency. Retrieved from www.aecf.org/m/workforcedocs/cpshr-performanceevaluation-2007.docx; Performance assessment and development form. Retrieved from www.aecf.org/m/workforcedocs/cpshr-assessmentanddevelopmentform.docx
25 CPS HR Consulting. (n.d.). Competency library guidelines.
Endnotes

\ 47 \

701 ST. PAUL STREET BALTIMORE, MD 21202 410.547.6600 WWW.AECF.ORG