fisheries and aquaculture - food and agriculture
TRANSCRIPT
FISHERIES AND AQUACULTURE
GOVERNMENT OF THE REPUBLIC OF THE UNION OF MYANMAR
Formulation and Operationalization of National Action
Plan for Poverty Alleviation and Rural Development through
Agriculture (NAPA)
Working Paper - 4
Yangon, June 2016
5.
Ministry of Agriculture,
Livestock and Irrigation
7.
MYANMAR: National Action Plan for Agriculture (NAPA)
Working Paper 4: Fisheries and Aquaculture
i
TABLE OF CONTENTS
ACRONYMS 3
1. INTRODUCTION 4
2. BACKGROUND 5
2.1. Strategic value of the Myanmar fisheries industry 5
3. SPECIFIC AREAS/ASPECTS OF THEMATIC AREA UNDER REVIEW 7
3.1. Marine capture fisheries 7
3.2. Inland capture fisheries 17
3.3. Leasable fisheries 22
3.4 Aquaculture 30
4. DETAILED DISCUSSIONS ON EACH CULTURE SYSTEM 30
4.1. Freshwater aquaculture 30
4.2. Brackishwater aquaculture 36
4.3. Postharvest processing 38
5. INSTITUTIONAL ENVIRONMENT 42
5.1. Management institutions 42
5.2. Human resource development 42
5.3. Policy 42
6. KEY OPPORTUNITIES AND CONSTRAINTS TO SECTOR DEVELOPMENT 44
6.1. Marine fisheries 44
6.2. Inland fisheries 44
6.3. Leasable fisheries 45
6.4. Aquaculture 45
6.5. Departmental emphasis on management 47
6.6. Institutional fragmentation 48
6.7. Human resource development infrastructure is poor 49
6.8. Extension training 50
6.9. Fisheries academies 50
6.10. Academia 50
7. KEY OPPORTUNITIES FOR SECTOR DEVELOPMENT 52
MYANMAR: National Action Plan for Agriculture (NAPA)
Working Paper 4: Fisheries and Aquaculture
ii
7.1. Empowerment of fishing communities in marine protected areas (mpas) 52
7.2. Reduction of postharvest spoilage 52
7.3. Expansion of pond culture 52
7.4. Expansion of freshwater cage culture 53
7.5. Development of rice field aquaculture 53
7.6. Expansion of crab farming 54
7.7. Expansion of seaweed farming 54
7.8. Development of cage culture for the live fish trade 54
7.9. Development and expansion of the fish-based processing subsector 55
8. POVERTY AND INCLUSIVENESS 56
8.1. Background to rural poverty in Myanmar 56
8.2. Poverty in the fisheries sector 56
9. RECOMMENDED AREAS OF INTERVENTION 57
9.1. Formulation of a national agriculture and food policy 57
9.2. Establishment of a tertiary-level institution for fisheries 57
9.3. Establishment of a fisheries and aquaculture academy 58
9.4. Establishment of fisheries extension and vocational training institutes 58
9.5. Establishment of a fisheries and aquaculture reseach institute 58
9.6. Restructuring seed production infrastructure for the aquaculture industry 58
9.7. Restructuring the functions of freshwater hatcheries 58
9.8. Establishment of marine finfish hatcheries 59
9.9. Establishment of a network of aquaculture technology centres 59
9.10. Establishment of processing industry development within the Department Of
Fisheries 59
9.11. Promotion of aquaculture optimization initatives 59
9.12. Provide greater access to financial capital for the sector 59
ANNEX 1: Bibliography
ANNEX 2: List of freshwater fish in Myanmar 58
ANNEX 3: Export trends for fisheries products in Myanmar 69
MYANMAR: National Action Plan for Agriculture (NAPA)
Working Paper 4: Small-scale fisheries and aquaculture capture, production and management
3
ACRONYMS
ADB Asian Development Bank
ASEAN Association of Southeast Asian Nations
CBM Central Bank of Myanmar
CSO Central Statistics Office
DAP Department of Agriculture Planning
DAR Department of Agricultural Research
DOA Department of Agriculture
DOF Department of Fisheries
DRD Department of Rural Development
EEZ Exclusive Economic Zone
ESCAP Economic and Social Commission for the Asia Pacific Region
FAO Food and Agriculture Organization of the United Nations
FD Forest Department
GDP Gross Domestic Product
MLFRD Ministry of Fisheries, Livestock and Rural Development
MOC Ministry of Cooperatives
MOECF Ministry of Environmental Conservation and Forestry
MPA Marine Protected Area
MSY Maximum Sustainable Yield
NGO Non-government Organization
NAPA National Action Plan for Agriculture
NSPARD National Strategy on Poverty Alleviation and Rural Development
MYANMAR: National Action Plan for Agriculture (NAPA)
Working Paper 4: Small-scale fisheries and aquaculture capture, production and management
4
1. INTRODUCTION
The following report is the outcome of a study of Myanmar’s fisheries and
aquaculture sectors under the country’s National Action Plan for Agriculture (NAPA),
which is directed at supporting the implementation of strategies and programmes to
alleviate rural poverty. The Livelihoods and Food Security Trust Fund (LIFT), a
multidonor agency programme supporting poverty reduction in Myanmar, is funding
the project.
The study involved a four-week field survey that covered the subsectors of fisheries
and aquaculture industries in the country. These included:
Capture fisheries
Inland capture fisheries;
Marine capture fisheries;
Capture-based aquaculture; and
Leasable fisheries.
Aquaculture
Marine aquaculture;
Brackishwater aquaculture; and
Freshwater aquaculture.
MYANMAR: National Action Plan for Agriculture (NAPA)
Working Paper 4: Small-scale fisheries and aquaculture capture, production and management
5
2. BACKGROUND
2.1. Strategic value of the Myanma fisheries industry
The fisheries sector is vitally important for socio-economic development in Myanmar.
Both commercial and traditional fishing as well as aquaculture are significant,
providing food, income and employment for the local populations. Generally,
fisheries in Myanmar can be classified into three categories, i.e. marine (inshore and
offshore), inland (leasable and open fisheries) and aquaculture.
The strategic values of the fisheries sector to the country are manifold. Among the
most obvious of these are:
Source of protein: Fish is a near mandatory accompaniment to rice in the average
Myanma meal, representing a staple protein much as rice is regarded as a staple
cereal. Per capita consumption of fish is estimated at 56 kg/year (Mine 2014), one of
the highest in the world. In contrast, per capita consumption of fish in Indonesia is
33.8 kg/year,1 in Malaysia is 54 kg/year
2 and in Japan, 58.6 kg/year.
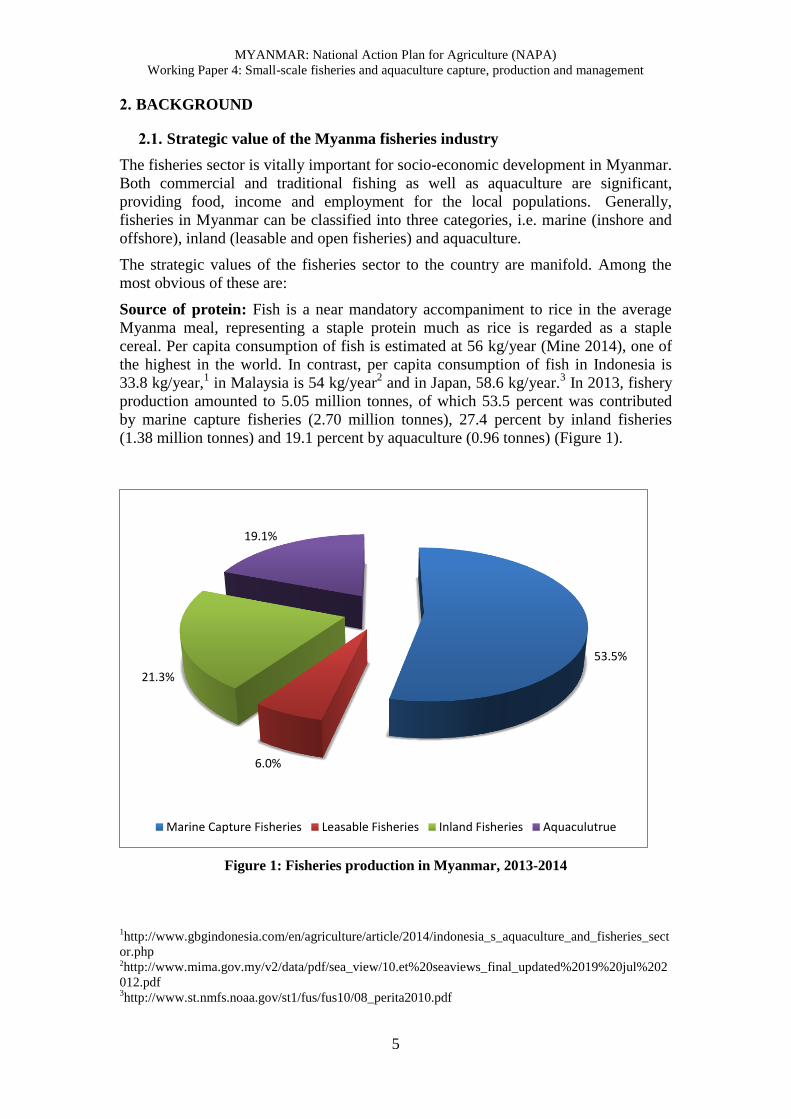
3 In 2013, fishery
production amounted to 5.05 million tonnes, of which 53.5 percent was contributed
by marine capture fisheries (2.70 million tonnes), 27.4 percent by inland fisheries
(1.38 million tonnes) and 19.1 percent by aquaculture (0.96 tonnes) (Figure 1).
Figure 1: Fisheries production in Myanmar, 2013-2014
1http://www.gbgindonesia.com/en/agriculture/article/2014/indonesia_s_aquaculture_and_fisheries_sect
or.php 2http://www.mima.gov.my/v2/data/pdf/sea_view/10.et%20seaviews_final_updated%2019%20jul%202
012.pdf 3http://www.st.nmfs.noaa.gov/st1/fus/fus10/08_perita2010.pdf
53.5%
6.0%
21.3%
19.1%
Marine Capture Fisheries Leasable Fisheries Inland Fisheries Aquaculutrue
MYANMAR: National Action Plan for Agriculture (NAPA)
Working Paper 4: Small-scale fisheries and aquaculture capture, production and management
6
Source: Department of Fisheries (2014).
Employment: The sector provided livelihoods to nearly 1 268 000 fishers and 216
284 fish farmers. This excludes the large numbers employed in related trading,
transportation and processing industries.
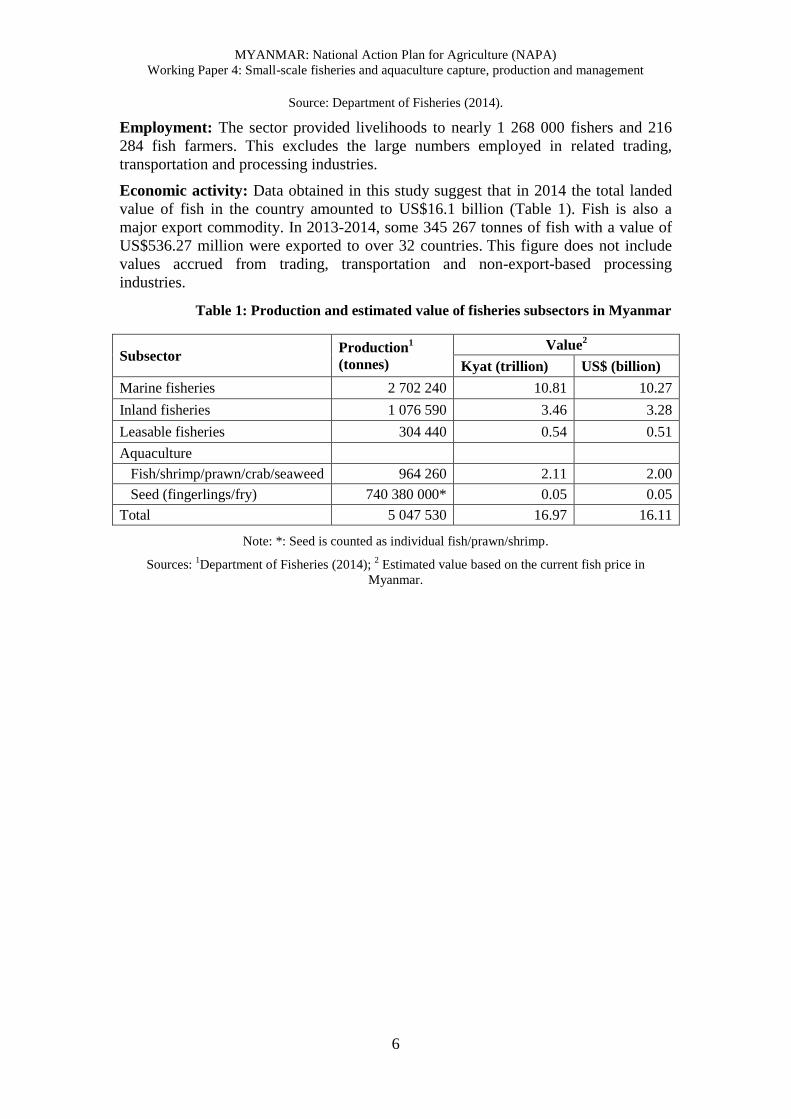
Economic activity: Data obtained in this study suggest that in 2014 the total landed
value of fish in the country amounted to US$16.1 billion (Table 1). Fish is also a
major export commodity. In 2013-2014, some 345 267 tonnes of fish with a value of
US$536.27 million were exported to over 32 countries. This figure does not include
values accrued from trading, transportation and non-export-based processing
industries.
Table 1: Production and estimated value of fisheries subsectors in Myanmar
Subsector Production
1
(tonnes)
Value2
Kyat (trillion) US$ (billion)
Marine fisheries 2 702 240 10.81 10.27
Inland fisheries 1 076 590 3.46 3.28
Leasable fisheries 304 440 0.54 0.51
Aquaculture
Fish/shrimp/prawn/crab/seaweed 964 260 2.11 2.00
Seed (fingerlings/fry) 740 380 000* 0.05 0.05
Total 5 047 530 16.97 16.11
Note: *: Seed is counted as individual fish/prawn/shrimp.
Sources: 1Department of Fisheries (2014);
2 Estimated value based on the current fish price in
Myanmar.
MYANMAR: National Action Plan for Agriculture (NAPA)
Working Paper 4: Small-scale fisheries and aquaculture capture, production and management
7
3. SPECIFIC AREAS/ASPECTS OF THEMATIC AREA UNDER REVIEW
3.1. Marine capture fisheries
Myanmar has a total coastline of more than 3 000 km, stretching 2 090 km from north
to south and 925 km from east to west. The country shares maritime boundaries with
Bangladesh and India in the Bay of Bengal and India and Thailand in the Andaman
Sea.
Myanmar’s coastline can be divided into three coastal regions, i.e. the Rakhine
Coastal Region (about 740 km), the Ayeyarwaddy and Gulf of Mottama Region
(about 460 km) and the Tanintharyi Coastal Region (about 1 200 km). There are many
estuaries and islands along these coastal regions.
Myanma marine fishery activities are divided into inshore and offshore fisheries. The
inshore fisheries zone covers the area from the shoreline up to 10 nautical miles (0-
18.52 km), while offshore fisheries operate beyond the outer limits of the inshore
fisheries zone up to the Exclusive Economic Zone (EEZ) 10-200 nautical miles
(18.52-370.40 km).
Fisher population
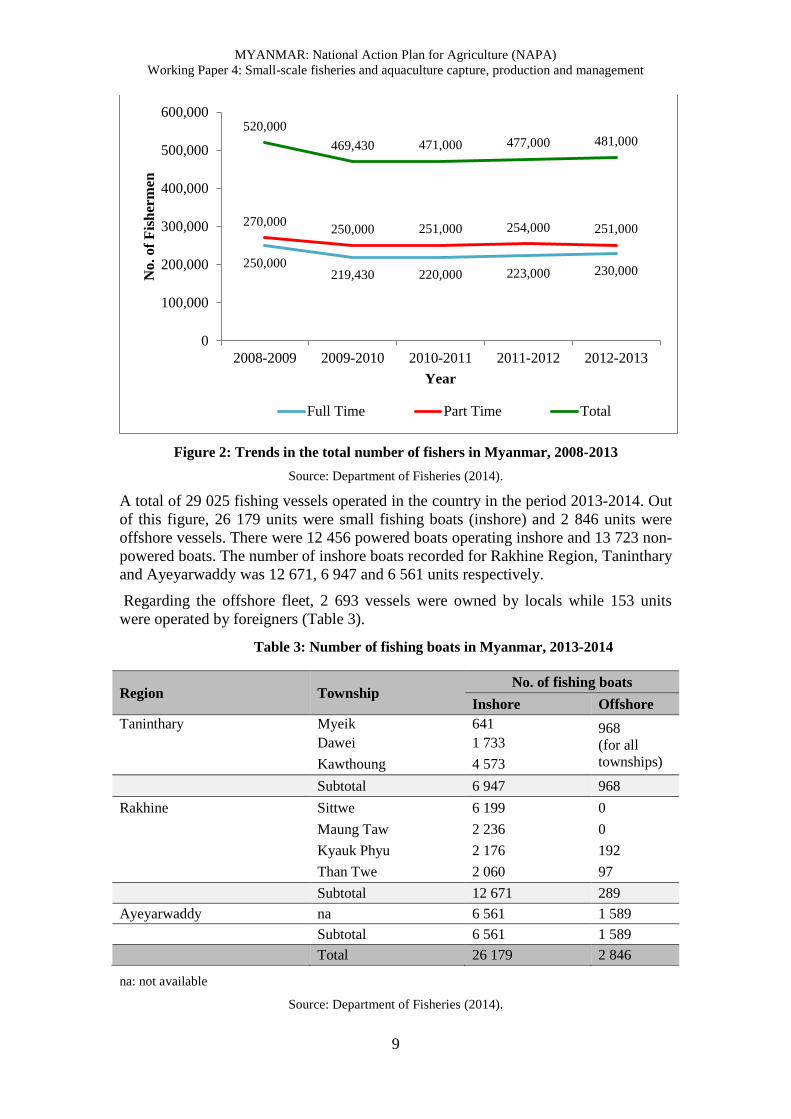
In 2012-2013, there were 481 000 registered fishers in the country, of which 52.2
percent were part-timers (251 000) and 47.8 percent were full-time fishers (230 000).
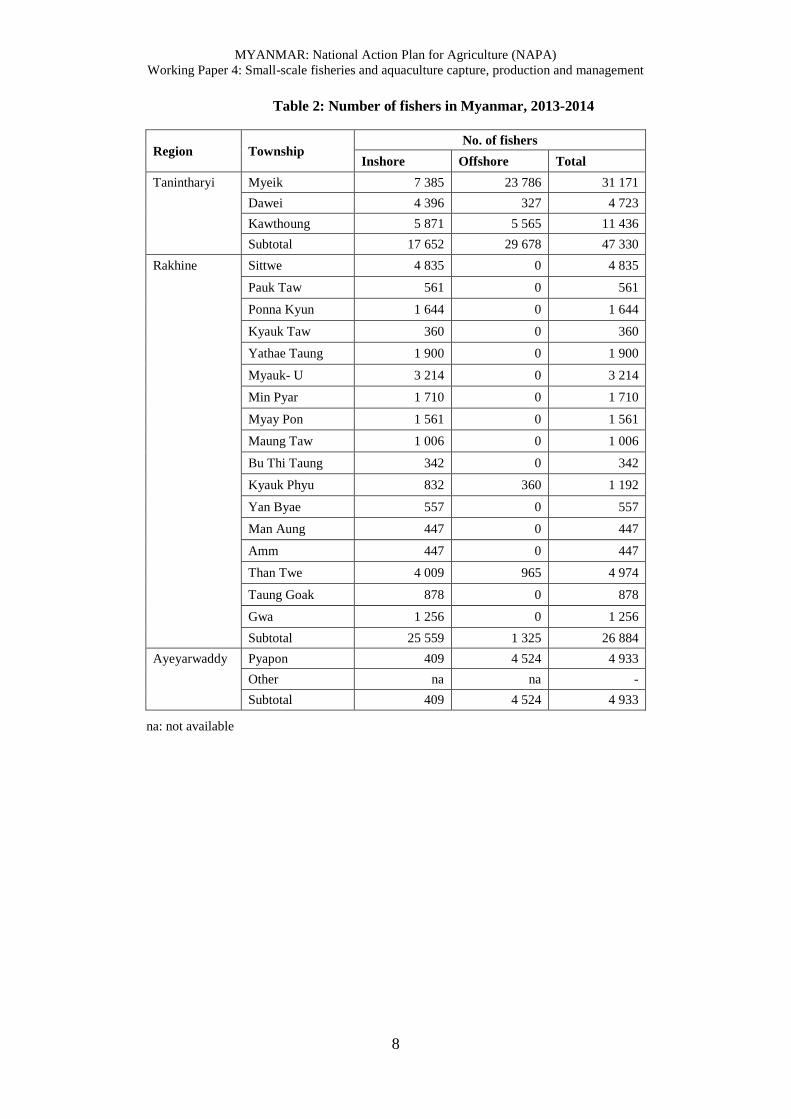
In 2013-2014, Tanintharyi Region alone had 47 330 fishers, largely dominated by
those operating offshore (29 678).
The highest number of fishers in this district was in Myeik Township (31 171),
followed by Kawthoung Township (11 436) and Dawei Township (4 723). In the
same year, in the Rakhine Region, a total of 26 884 fishers were registered, of which
25 559 were operating inshore and 1 325 offshore. Inshore fishers were recorded in all
township areas (342-4 835), while offshore fishers were only recorded at Kyauk Phyu
(360) and Than Twe (965) townships.
Overall, the highest number of fishers came from Than Twe Township (4 974),
followed by Sittwe (4 835) and Myauk-u (3 214).
In Ayeyarwaddy Region, data were only available for Pyapon Township. There were
409 and 4 524 inshore and offshore fishers, respectively, recorded from this township.
Based on available statistical data, the number of fishers was stable from 2009-2010
to 2012-2013 for full and part-timers, ranging from 219 430-230 000 and 250 000-254
000 respectively. However, in 2008-2009, the number of fishers was slightly higher,
at 250 000 full-time and 270 000 part-time.
MYANMAR: National Action Plan for Agriculture (NAPA)
Working Paper 4: Small-scale fisheries and aquaculture capture, production and management
8
Table 2: Number of fishers in Myanmar, 2013-2014
Region Township No. of fishers
Inshore Offshore Total
Tanintharyi Myeik 7 385 23 786 31 171
Dawei 4 396 327 4 723
Kawthoung 5 871 5 565 11 436
Subtotal 17 652 29 678 47 330
Rakhine Sittwe 4 835 0 4 835
Pauk Taw 561 0 561
Ponna Kyun 1 644 0 1 644
Kyauk Taw 360 0 360
Yathae Taung 1 900 0 1 900
Myauk- U 3 214 0 3 214
Min Pyar 1 710 0 1 710
Myay Pon 1 561 0 1 561
Maung Taw 1 006 0 1 006
Bu Thi Taung 342 0 342
Kyauk Phyu 832 360 1 192
Yan Byae 557 0 557
Man Aung 447 0 447
Amm 447 0 447
Than Twe 4 009 965 4 974
Taung Goak 878 0 878
Gwa 1 256 0 1 256
Subtotal 25 559 1 325 26 884
Ayeyarwaddy Pyapon 409 4 524 4 933
Other na na -
Subtotal 409 4 524 4 933
na: not available
MYANMAR: National Action Plan for Agriculture (NAPA)
Working Paper 4: Small-scale fisheries and aquaculture capture, production and management
9
Figure 2: Trends in the total number of fishers in Myanmar, 2008-2013
Source: Department of Fisheries (2014).
A total of 29 025 fishing vessels operated in the country in the period 2013-2014. Out
of this figure, 26 179 units were small fishing boats (inshore) and 2 846 units were
offshore vessels. There were 12 456 powered boats operating inshore and 13 723 non-
powered boats. The number of inshore boats recorded for Rakhine Region, Taninthary
and Ayeyarwaddy was 12 671, 6 947 and 6 561 units respectively.
Regarding the offshore fleet, 2 693 vessels were owned by locals while 153 units
were operated by foreigners (Table 3).
Table 3: Number of fishing boats in Myanmar, 2013-2014
Region Township No. of fishing boats
Inshore Offshore
Taninthary Myeik 641 968
(for all
townships)
Dawei 1 733
Kawthoung 4 573
Subtotal 6 947 968
Rakhine Sittwe 6 199 0
Maung Taw 2 236 0
Kyauk Phyu 2 176 192
Than Twe 2 060 97
Subtotal 12 671 289
Ayeyarwaddy na 6 561 1 589
Subtotal 6 561 1 589
Total 26 179 2 846
na: not available
Source: Department of Fisheries (2014).
250,000 219,430 220,000 223,000 230,000
270,000 250,000 251,000 254,000 251,000
520,000
469,430 471,000 477,000 481,000
0
100,000
200,000
300,000
400,000
500,000
600,000
2008-2009 2009-2010 2010-2011 2011-2012 2012-2013
No
. o
f F
ish
erm
en
Year
Full Time Part Time Total
MYANMAR: National Action Plan for Agriculture (NAPA)
Working Paper 4: Small-scale fisheries and aquaculture capture, production and management
10
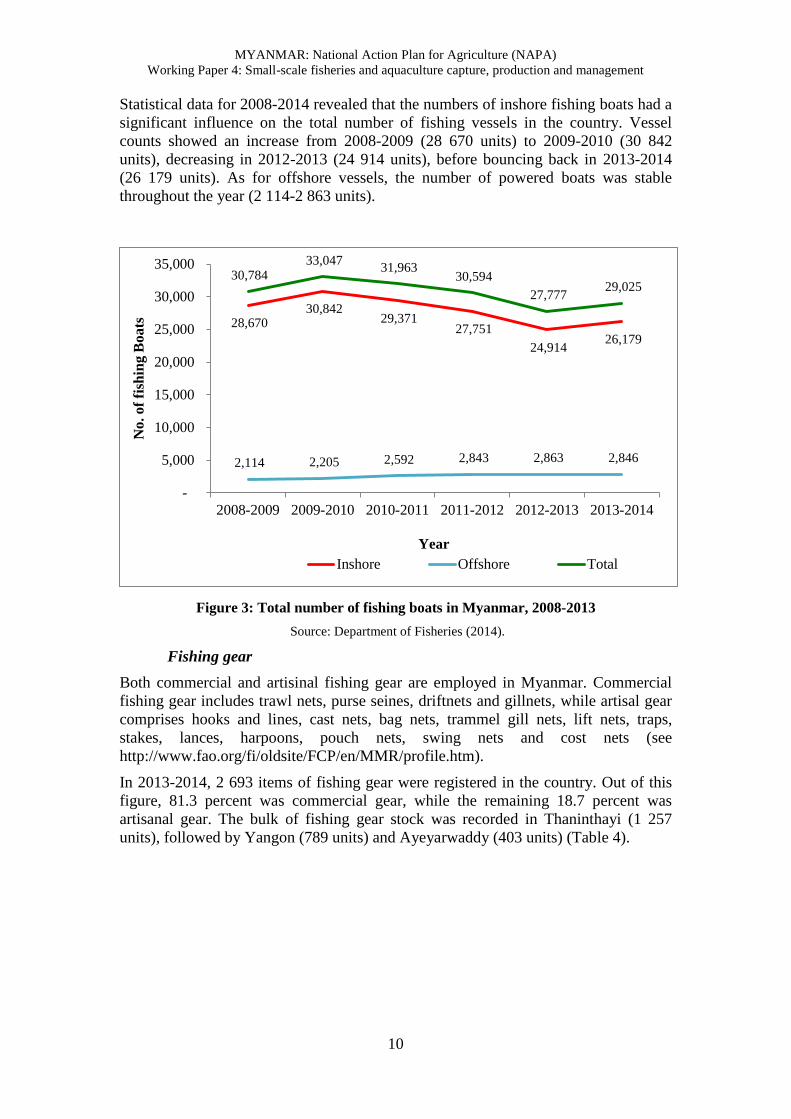
Statistical data for 2008-2014 revealed that the numbers of inshore fishing boats had a
significant influence on the total number of fishing vessels in the country. Vessel
counts showed an increase from 2008-2009 (28 670 units) to 2009-2010 (30 842
units), decreasing in 2012-2013 (24 914 units), before bouncing back in 2013-2014
(26 179 units). As for offshore vessels, the number of powered boats was stable
throughout the year (2 114-2 863 units).
Figure 3: Total number of fishing boats in Myanmar, 2008-2013
Source: Department of Fisheries (2014).
Fishing gear
Both commercial and artisinal fishing gear are employed in Myanmar. Commercial
fishing gear includes trawl nets, purse seines, driftnets and gillnets, while artisal gear
comprises hooks and lines, cast nets, bag nets, trammel gill nets, lift nets, traps,
stakes, lances, harpoons, pouch nets, swing nets and cost nets (see
http://www.fao.org/fi/oldsite/FCP/en/MMR/profile.htm).
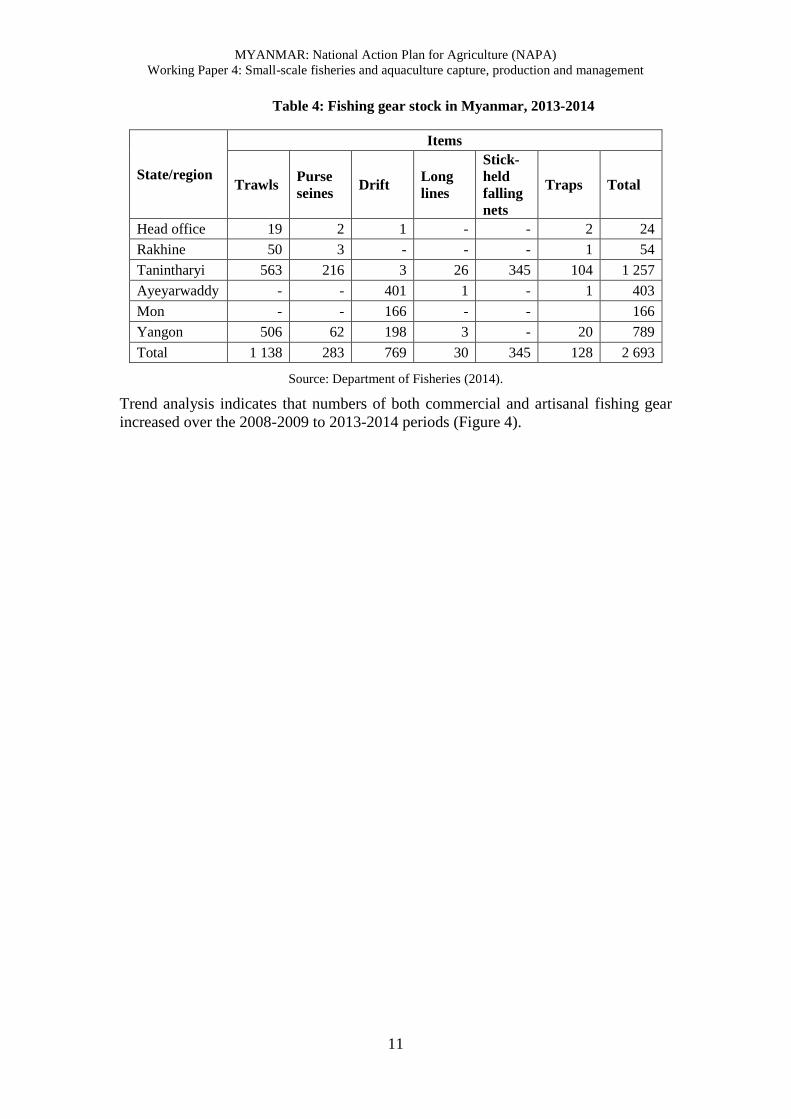
In 2013-2014, 2 693 items of fishing gear were registered in the country. Out of this
figure, 81.3 percent was commercial gear, while the remaining 18.7 percent was
artisanal gear. The bulk of fishing gear stock was recorded in Thaninthayi (1 257
units), followed by Yangon (789 units) and Ayeyarwaddy (403 units) (Table 4).
28,670 30,842
29,371 27,751
24,914 26,179
2,114 2,205 2,592 2,843 2,863 2,846
30,784 33,047
31,963 30,594
27,777 29,025
-
5,000
10,000
15,000
20,000
25,000
30,000
35,000
2008-2009 2009-2010 2010-2011 2011-2012 2012-2013 2013-2014
No
. o
f fi
shin
g B
oa
ts
Year
Inshore Offshore Total
MYANMAR: National Action Plan for Agriculture (NAPA)
Working Paper 4: Small-scale fisheries and aquaculture capture, production and management
11
Table 4: Fishing gear stock in Myanmar, 2013-2014
State/region
Items
Trawls Purse
seines Drift
Long
lines
Stick-
held
falling
nets
Traps Total
Head office 19 2 1 - - 2 24
Rakhine 50 3 - - - 1 54
Tanintharyi 563 216 3 26 345 104 1 257
Ayeyarwaddy - - 401 1 - 1 403
Mon - - 166 - -
166
Yangon 506 62 198 3 - 20 789
Total 1 138 283 769 30 345 128 2 693
Source: Department of Fisheries (2014).
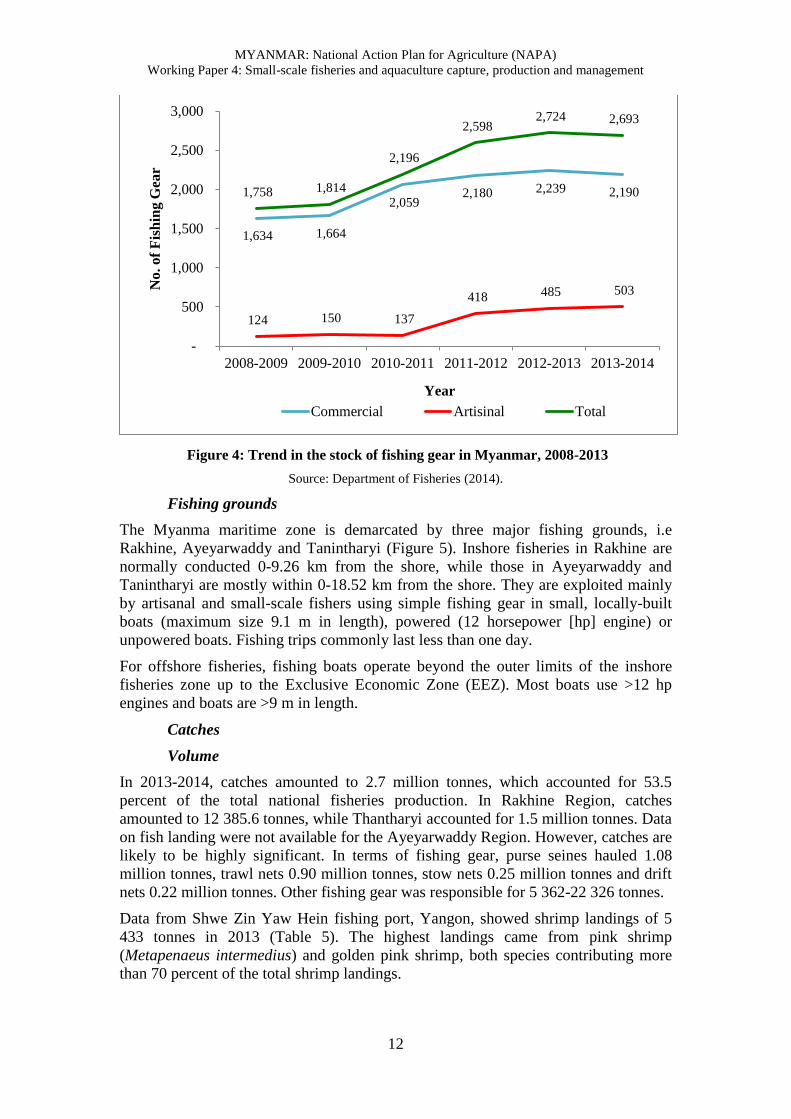
Trend analysis indicates that numbers of both commercial and artisanal fishing gear
increased over the 2008-2009 to 2013-2014 periods (Figure 4).
MYANMAR: National Action Plan for Agriculture (NAPA)
Working Paper 4: Small-scale fisheries and aquaculture capture, production and management
12
Figure 4: Trend in the stock of fishing gear in Myanmar, 2008-2013
Source: Department of Fisheries (2014).
Fishing grounds
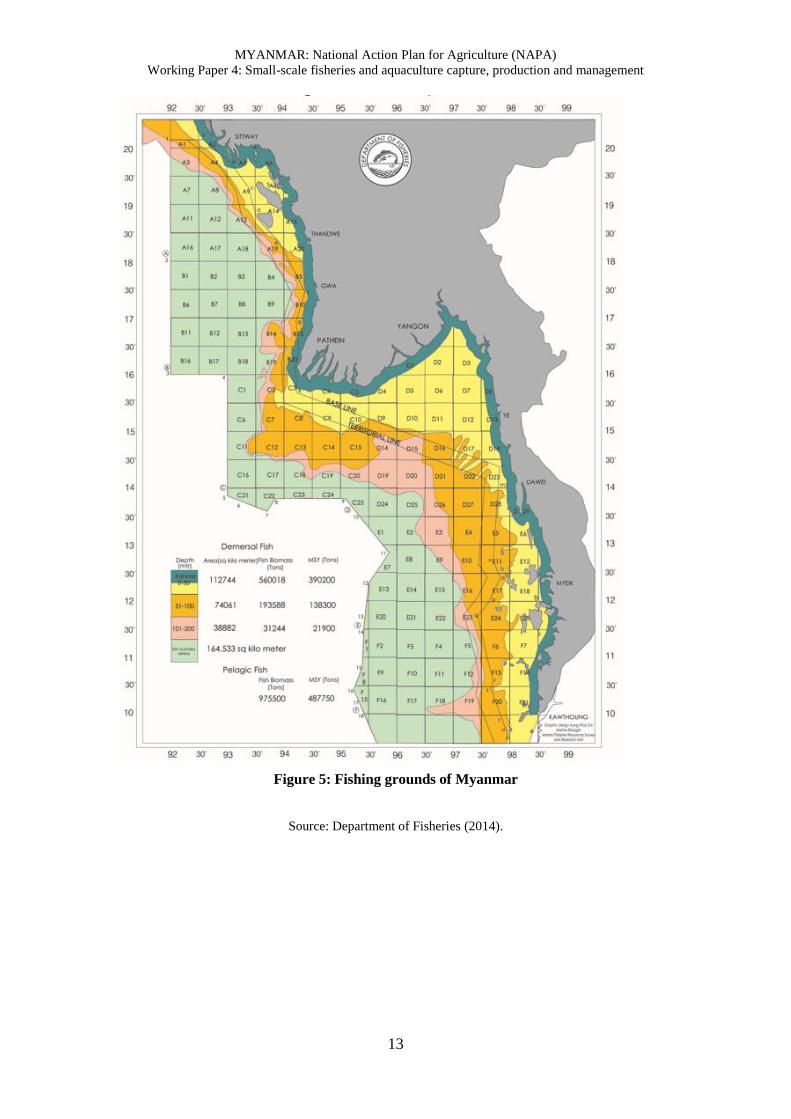
The Myanma maritime zone is demarcated by three major fishing grounds, i.e
Rakhine, Ayeyarwaddy and Tanintharyi (Figure 5). Inshore fisheries in Rakhine are
normally conducted 0-9.26 km from the shore, while those in Ayeyarwaddy and
Tanintharyi are mostly within 0-18.52 km from the shore. They are exploited mainly
by artisanal and small-scale fishers using simple fishing gear in small, locally-built
boats (maximum size 9.1 m in length), powered (12 horsepower [hp] engine) or
unpowered boats. Fishing trips commonly last less than one day.
For offshore fisheries, fishing boats operate beyond the outer limits of the inshore
fisheries zone up to the Exclusive Economic Zone (EEZ). Most boats use >12 hp
engines and boats are >9 m in length.
Catches
Volume
In 2013-2014, catches amounted to 2.7 million tonnes, which accounted for 53.5
percent of the total national fisheries production. In Rakhine Region, catches
amounted to 12 385.6 tonnes, while Thantharyi accounted for 1.5 million tonnes. Data
on fish landing were not available for the Ayeyarwaddy Region. However, catches are
likely to be highly significant. In terms of fishing gear, purse seines hauled 1.08
million tonnes, trawl nets 0.90 million tonnes, stow nets 0.25 million tonnes and drift
nets 0.22 million tonnes. Other fishing gear was responsible for 5 362-22 326 tonnes.
Data from Shwe Zin Yaw Hein fishing port, Yangon, showed shrimp landings of 5
433 tonnes in 2013 (Table 5). The highest landings came from pink shrimp
(Metapenaeus intermedius) and golden pink shrimp, both species contributing more
than 70 percent of the total shrimp landings.
1,634 1,664
2,059 2,180 2,239 2,190
124 150 137
418 485 503
1,758 1,814
2,196
2,598 2,724 2,693
-
500
1,000
1,500
2,000
2,500
3,000
2008-2009 2009-2010 2010-2011 2011-2012 2012-2013 2013-2014
No
. o
f F
ish
ing
Gea
r
Year
Commercial Artisinal Total
MYANMAR: National Action Plan for Agriculture (NAPA)
Working Paper 4: Small-scale fisheries and aquaculture capture, production and management
13
Figure 5: Fishing grounds of Myanmar
Source: Department of Fisheries (2014).
MYANMAR: National Action Plan for Agriculture (NAPA)
Working Paper 4: Small-scale fisheries and aquaculture capture, production and management
14
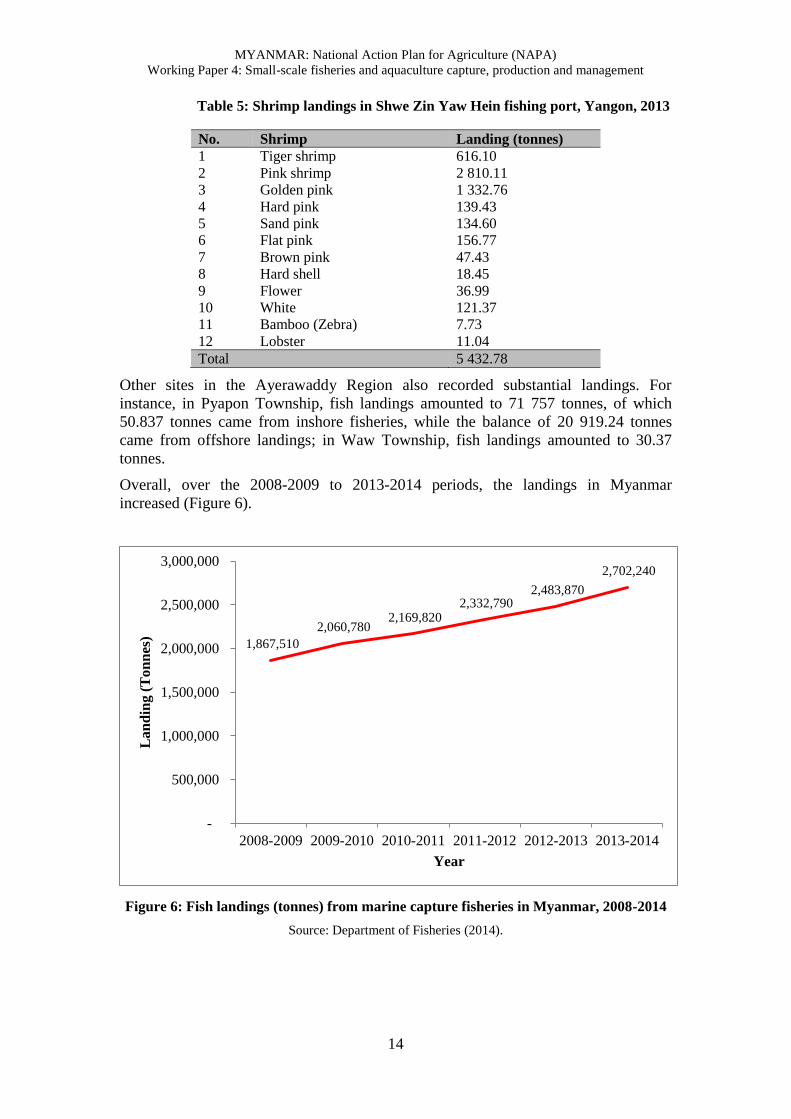
Table 5: Shrimp landings in Shwe Zin Yaw Hein fishing port, Yangon, 2013
No. Shrimp Landing (tonnes)
1 Tiger shrimp 616.10
2 Pink shrimp 2 810.11
3 Golden pink 1 332.76
4 Hard pink 139.43
5 Sand pink 134.60
6 Flat pink 156.77
7 Brown pink 47.43
8 Hard shell 18.45
9 Flower 36.99
10 White 121.37
11 Bamboo (Zebra) 7.73
12 Lobster 11.04
Total 5 432.78
Other sites in the Ayerawaddy Region also recorded substantial landings. For
instance, in Pyapon Township, fish landings amounted to 71 757 tonnes, of which
50.837 tonnes came from inshore fisheries, while the balance of 20 919.24 tonnes
came from offshore landings; in Waw Township, fish landings amounted to 30.37
tonnes.
Overall, over the 2008-2009 to 2013-2014 periods, the landings in Myanmar
increased (Figure 6).
Figure 6: Fish landings (tonnes) from marine capture fisheries in Myanmar, 2008-2014
Source: Department of Fisheries (2014).
1,867,510
2,060,780 2,169,820
2,332,790 2,483,870
2,702,240
-
500,000
1,000,000
1,500,000
2,000,000
2,500,000
3,000,000
2008-2009 2009-2010 2010-2011 2011-2012 2012-2013 2013-2014
La
nd
ing
(T
on
nes
)
Year
MYANMAR: National Action Plan for Agriculture (NAPA)
Working Paper 4: Small-scale fisheries and aquaculture capture, production and management
15
Catch profile
Over 87 species of fish are caught in Myanma waters (Table 6). The major demersal
fish caught include snapper (Lutjanus spp.), threadfin (Nemipterus spp.) and croaker
(Otolithes spp., Panna microdon, Pennahia spp.), while pelagic fish comprise trevally
(Alectis indicus, Alepes spp., Carangoides spp., Caranx spp., Selaroides spp.), scad
(Decapterus spp.), Queen fish (Scomberoides commersonianus) and Hilsa shad
(Tenualosa ilisha).
As for crustaceans, the major shrimp species caught are pink shrimp (Metapenaus
intermedius), bird shrimp (Metapenaus lysianassa) and banana shrimp (Penaeus
indicus/P. merguensis).
Catch rates
Catch rates were assessed only among inshore fishers. No offshore fishers were
interviewed during this study.
Interviews undertaken in Maw Wun Chong village in Kyauk Tan Township indicated
that an average of 24.6-32.8 kg/day of fish landed with maximum landing amounting
to 49.2 kg/day. Over 2 500 fishers operated from this village. Given that fishing is
undertaken for 10 days a month from August to April (nine months), the annual fish
landing in this village is estimated at more than 3 000 tonnes. Fishing is prohibited in
May to July.
Another interview undertaken in Tae Chaung village (Bengali-based fishing village)
indicated that fish landings ranged from 65.6-196.8 kg/boat. More than 200 fishing
vessels operated from this village. The highest landings occurred during December to
January. Most fishing was undertaken in the offshore area (22.22 km from the
shoreline).
The universal opinion was that nearshore resources were declining rapidly with some
opinions indicating catch rates declining by up to 50 percent over the last five years.
Although higher prices for the landed commodities have cushioned the impact of
lower catches, the fishers complained of having to spend more time at sea to sustain
incomes.
Prices
The fish prices of fish depend on their size and the area (Table 7). For example, in
Yangon, Silver promfret (Pampus argenteus) sold at US$6.29/kg for 0.05-0.1 kg/fish,
US$9.19-10.45/kg for 0.1-0.2 kg/fish, US$12.723-15.30/kg for 0.2-0.3 kg/fish,
US$15.87-21.38 for 0.3-0.4 kg/fish and US$19.48-27.55/kg for fish with size
exceeding 0.4 kg/fish. In Pyapon, the same fish sold at lower prices, ranging from
US$2.90-16.22/kg.
Catch value
Myanmar’s annual fisheries statistics do not provide figures for catch value or a
species breakdown of the catch. This is a serious shortcoming and prevents an
accurate assessment of the contribution of the industry to the national economy.
An assessment of the total value of marine fish landings was made based on the prices
collected during the study. This estimation eliminated high-value commodities such
as lobster, grouper and shrimp, which would account for only a fraction of the catch
volume and focused on bread-and-butter species such as pomfret (Pampus spp.),
MYANMAR: National Action Plan for Agriculture (NAPA)
Working Paper 4: Small-scale fisheries and aquaculture capture, production and management
16
Indian threadfin (Polynemus indicus) and mackerel, which account for the bulk of the
landings.
The price for the latter group of fish ranged from US$1.09-6.49/kg. Assuming an
average price of US$3.80/kg, the gross value of the Myanma marine fish catch would
amount to at least US$10.27 billion (or 10.81 trillion kyat). This figure is complicated
by two conflicting value concerns i.e. the value of high-value fish had not been
factored in and secondly, the value of trawler by-catch, though low-priced, was also
considered. However, on the balance of probabilities, the actual figure is not expected
to be too far from the estimate.
Handling and postharvest
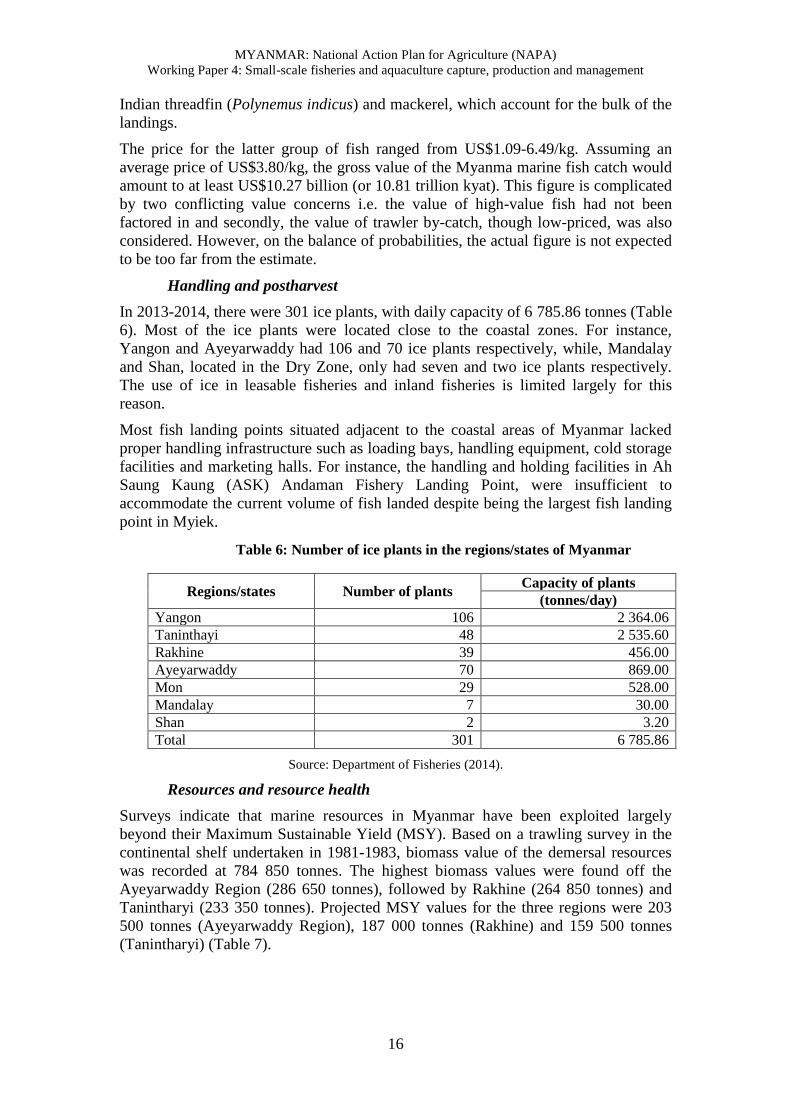
In 2013-2014, there were 301 ice plants, with daily capacity of 6 785.86 tonnes (Table
6). Most of the ice plants were located close to the coastal zones. For instance,
Yangon and Ayeyarwaddy had 106 and 70 ice plants respectively, while, Mandalay
and Shan, located in the Dry Zone, only had seven and two ice plants respectively.
The use of ice in leasable fisheries and inland fisheries is limited largely for this
reason.
Most fish landing points situated adjacent to the coastal areas of Myanmar lacked
proper handling infrastructure such as loading bays, handling equipment, cold storage
facilities and marketing halls. For instance, the handling and holding facilities in Ah
Saung Kaung (ASK) Andaman Fishery Landing Point, were insufficient to
accommodate the current volume of fish landed despite being the largest fish landing
point in Myiek.
Table 6: Number of ice plants in the regions/states of Myanmar
Regions/states Number of plants Capacity of plants
(tonnes/day)
Yangon 106 2 364.06
Taninthayi 48 2 535.60
Rakhine 39 456.00
Ayeyarwaddy 70 869.00
Mon 29 528.00
Mandalay 7 30.00
Shan 2 3.20
Total 301 6 785.86
Source: Department of Fisheries (2014).
Resources and resource health
Surveys indicate that marine resources in Myanmar have been exploited largely
beyond their Maximum Sustainable Yield (MSY). Based on a trawling survey in the
continental shelf undertaken in 1981-1983, biomass value of the demersal resources
was recorded at 784 850 tonnes. The highest biomass values were found off the
Ayeyarwaddy Region (286 650 tonnes), followed by Rakhine (264 850 tonnes) and
Tanintharyi (233 350 tonnes). Projected MSY values for the three regions were 203
500 tonnes (Ayeyarwaddy Region), 187 000 tonnes (Rakhine) and 159 500 tonnes
(Tanintharyi) (Table 7).

MYANMAR: National Action Plan for Agriculture (NAPA)
Working Paper 4: Small-scale fisheries and aquaculture capture, production and management
17
However, a later study by Tun (2014, unpublished) reported the value of biomass for
demersals had dropped 64.3 percent to 280 000 tonnes (mean length of 20 cm) in
2013. In response, the Ministry of Livestock and Fisheries instituted several measures
stipulating 5.1 cm mesh in the cod end for fish trawls and 3.8 cm for shrimp trawls.
Table 7: Biomass and MSY values for demersal resources in the
regions/states of Myanmar, 1981-1983
Region Biomass (tonnes) MSY (tonnes)
Rakhine 264 850 187 000
Ayeyarwaddy 286 650 203 500
Tanintharyi 233 350 159 500
Total 784 850 550 000
Source: Survey in the continental shelf (1981-1983).
Pelagic resources have not fared much better. Based on acoustic survey by the R.V.
Fridtgof Nansen carried out in September to November 1979 and March to April
1980, biomass values were estimated to be 975 000 tonnes. Ayeyarwaddy Region had
the highest biomass value (505 000 tonnes), followed by Tanintharyi (295 000 tonnes)
and Rakhine (175 000 tonnes). In the same survey, MSY values in the three regions
were 252 500 tonnes (Ayeyarwaddy Region), 147 500 tonnes (Tanintharyi) and 87
500 tonnes (Rakhine).
The subsequent study in 2013 by Tun (2014, unpublished), however, reported the
value of biomass for pelagics to be 324 000 tonnes (Table 8). As with demersal
resources, the biomass value had decreased by 66.8 percent.
Table 8: Biomass and MSY values for pelagic resources in the regions/states
of Myanmar
Region Biomass (tonnes) MSY (tonnes)
1979-19801 2013
2 1979-1980
1 2013
2
Rakhine 175 000 97 000 87 500 na
Ayeyarwaddy 505 000 156 000 252 500 na
Tanintharyi 295 000 71 000 147 500 na
Total 975 000 324 000 487 500 na
1 Result of acoustic survey by the R.V. Fridtgof Nansen (September-November 1979 and March-April
1980); 2 Tun (2014, unpublished).
na: not available
3.2. Inland capture fisheries
Inland fisheries in Myanmar are associated with riverine and estuarine waterbodies,
such as natural lakes, reservoirs, river systems, streams and ponds. These waterbodies
collectively cover an area about 8.1 million ha, of which 1.3 million ha are permanent
and the others are seasonally-inundated floodplains. Inland fisheries play an important
role in supplying freshwater as well as brackishwater fish in the country.
Fishing population
In 2012-2013, inland fisheries supported approximately 787 000 fishers, of which
61.9 percent were full-time (487 000) and 38.1 percent were part-time (300 000). The
numbers of fishers included those operating within leasable as well as open waters.
MYANMAR: National Action Plan for Agriculture (NAPA)
Working Paper 4: Small-scale fisheries and aquaculture capture, production and management
18
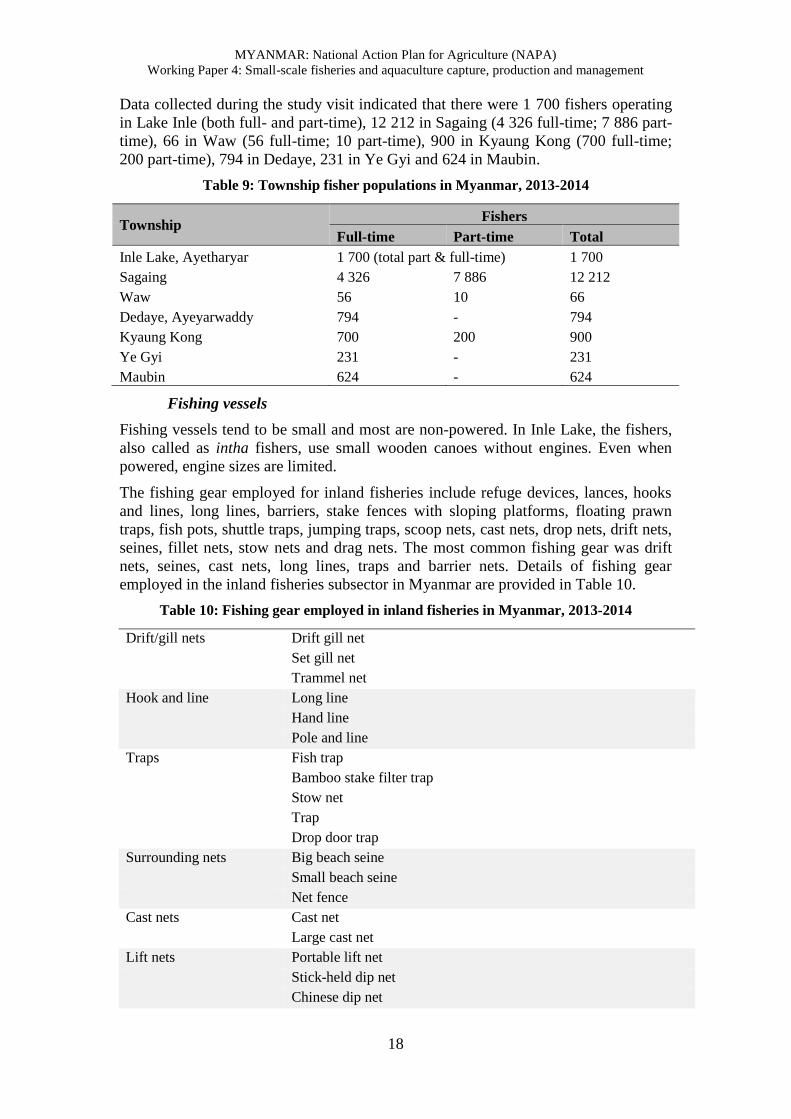
Data collected during the study visit indicated that there were 1 700 fishers operating
in Lake Inle (both full- and part-time), 12 212 in Sagaing (4 326 full-time; 7 886 part-
time), 66 in Waw (56 full-time; 10 part-time), 900 in Kyaung Kong (700 full-time;
200 part-time), 794 in Dedaye, 231 in Ye Gyi and 624 in Maubin.
Table 9: Township fisher populations in Myanmar, 2013-2014
Township Fishers
Full-time Part-time Total
Inle Lake, Ayetharyar 1 700 (total part & full-time) 1 700
Sagaing 4 326 7 886 12 212
Waw 56 10 66
Dedaye, Ayeyarwaddy 794 - 794
Kyaung Kong 700 200 900
Ye Gyi 231 - 231
Maubin 624 - 624
Fishing vessels
Fishing vessels tend to be small and most are non-powered. In Inle Lake, the fishers,
also called as intha fishers, use small wooden canoes without engines. Even when
powered, engine sizes are limited.
The fishing gear employed for inland fisheries include refuge devices, lances, hooks
and lines, long lines, barriers, stake fences with sloping platforms, floating prawn
traps, fish pots, shuttle traps, jumping traps, scoop nets, cast nets, drop nets, drift nets,
seines, fillet nets, stow nets and drag nets. The most common fishing gear was drift
nets, seines, cast nets, long lines, traps and barrier nets. Details of fishing gear
employed in the inland fisheries subsector in Myanmar are provided in Table 10.
Table 10: Fishing gear employed in inland fisheries in Myanmar, 2013-2014
Drift/gill nets Drift gill net
Set gill net
Trammel net
Hook and line Long line
Hand line
Pole and line
Traps Fish trap
Bamboo stake filter trap
Stow net
Trap
Drop door trap
Surrounding nets Big beach seine
Small beach seine
Net fence
Cast nets Cast net
Large cast net
Lift nets Portable lift net
Stick-held dip net
Chinese dip net
MYANMAR: National Action Plan for Agriculture (NAPA)
Working Paper 4: Small-scale fisheries and aquaculture capture, production and management
19
Push nets Push net
Push net with bag
Miscellaneous Inle basket
Eel clamp
Plunge basket or cover pot
Bush-bundle basket
Small bag net
Beam trawl
Multipronged burbles spear
Source: http://map.seafdec.org/Monograph/Monograph_myanmar/marine.php
Fishing grounds
Fishing activities are carried out on rivers, stream, lakes and floodplains. Inle Lake is
one of the most important fishing grounds for the inland fisheries sector. As the
second largest lake in Myanmar, it covers a total area of approximately 6 220 ha with
a catchment area of 16 300 ha.
In the Ayeyarwarddy Region, the main fishing activities are undertaken on the main
Ayeyarwaddy River. Others are carried out on the Pathein, Ywe, Phyamala, Bogale,
Thande, Yangon, Chindwin, Sittang, Bilin, Gyaing, Thanlyin, Salween, Dakhe, Nga
Won, Min Ma Naing Choung and Kyone Le Mu Choung Rivers. Tributaries and
waterbodies also support inland fishery activities.
Fish landings
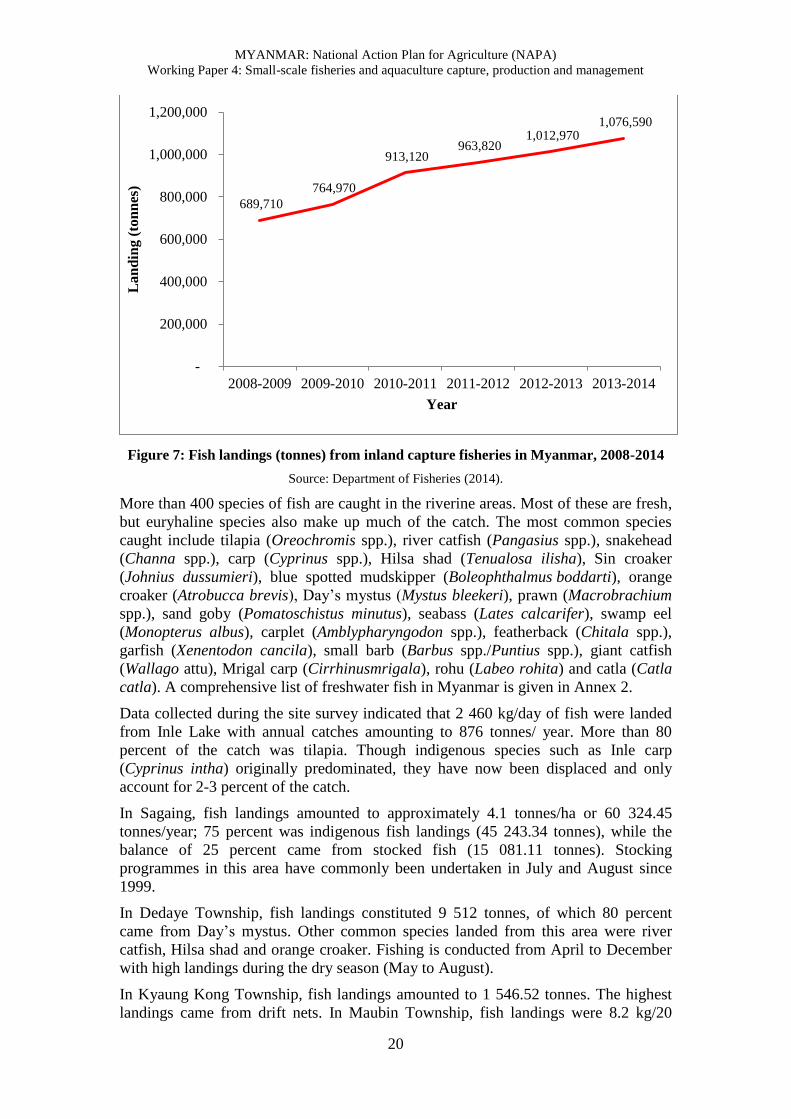
In 2013-2014, the haul of the inland capture fishery sector amounted to 1.08 million
tonnes. Data collected during the site survey indicated that high fish landings were
recorded at Sagaing, Dedaye, Maubin and Kyaung Kong (Table 11). As for Inle Lake
and Waw, landings were less than 1 000 tonnes. More than 60 percent of the landings
was indigenous fish.
Table 11: Fish landings in selected areas of Myanmar
Area Landings (tonnes)
Inle Lake, Ayetharyar 876.00
Sagaing 60 324.45
Waw 30.37
Dedaye, Ayeyarwaddy 9 512.00
Kyaung Kong 1 546.52
Maubin 1 985.00
MYANMAR: National Action Plan for Agriculture (NAPA)
Working Paper 4: Small-scale fisheries and aquaculture capture, production and management
20
Figure 7: Fish landings (tonnes) from inland capture fisheries in Myanmar, 2008-2014
Source: Department of Fisheries (2014).
More than 400 species of fish are caught in the riverine areas. Most of these are fresh,
but euryhaline species also make up much of the catch. The most common species
caught include tilapia (Oreochromis spp.), river catfish (Pangasius spp.), snakehead
(Channa spp.), carp (Cyprinus spp.), Hilsa shad (Tenualosa ilisha), Sin croaker
(Johnius dussumieri), blue spotted mudskipper (Boleophthalmus boddarti), orange
croaker (Atrobucca brevis), Day’s mystus (Mystus bleekeri), prawn (Macrobrachium
spp.), sand goby (Pomatoschistus minutus), seabass (Lates calcarifer), swamp eel
(Monopterus albus), carplet (Amblypharyngodon spp.), featherback (Chitala spp.),
garfish (Xenentodon cancila), small barb (Barbus spp./Puntius spp.), giant catfish
(Wallago attu), Mrigal carp (Cirrhinusmrigala), rohu (Labeo rohita) and catla (Catla
catla). A comprehensive list of freshwater fish in Myanmar is given in Annex 2.
Data collected during the site survey indicated that 2 460 kg/day of fish were landed
from Inle Lake with annual catches amounting to 876 tonnes/ year. More than 80
percent of the catch was tilapia. Though indigenous species such as Inle carp
(Cyprinus intha) originally predominated, they have now been displaced and only
account for 2-3 percent of the catch.
In Sagaing, fish landings amounted to approximately 4.1 tonnes/ha or 60 324.45
tonnes/year; 75 percent was indigenous fish landings (45 243.34 tonnes), while the
balance of 25 percent came from stocked fish (15 081.11 tonnes). Stocking
programmes in this area have commonly been undertaken in July and August since
1999.
In Dedaye Township, fish landings constituted 9 512 tonnes, of which 80 percent
came from Day’s mystus. Other common species landed from this area were river
catfish, Hilsa shad and orange croaker. Fishing is conducted from April to December
with high landings during the dry season (May to August).
In Kyaung Kong Township, fish landings amounted to 1 546.52 tonnes. The highest
landings came from drift nets. In Maubin Township, fish landings were 8.2 kg/20
689,710
764,970
913,120 963,820
1,012,970 1,076,590
-
200,000
400,000
600,000
800,000
1,000,000
1,200,000
2008-2009 2009-2010 2010-2011 2011-2012 2012-2013 2013-2014
La
nd
ing
(to
nn
es)
Year
MYANMAR: National Action Plan for Agriculture (NAPA)
Working Paper 4: Small-scale fisheries and aquaculture capture, production and management
21
days. During the rainy season, fish landings were approximately 49.2 kg/month.
Overall, total fish landings in Maubin were recorded at 1 985 tonnes, off which 50
percent was river catfish and 30 percent Hilsa shad.
In Waw Township, fish landings from inland capture fisheries accounted for 30.37
tonnes. The most significant catch was Hilsa shad (11.25 tonnes), followed by Sin
croaker (9.02 tonnes) and shrimp (Penaeus spp.) (5.33 tonnes).
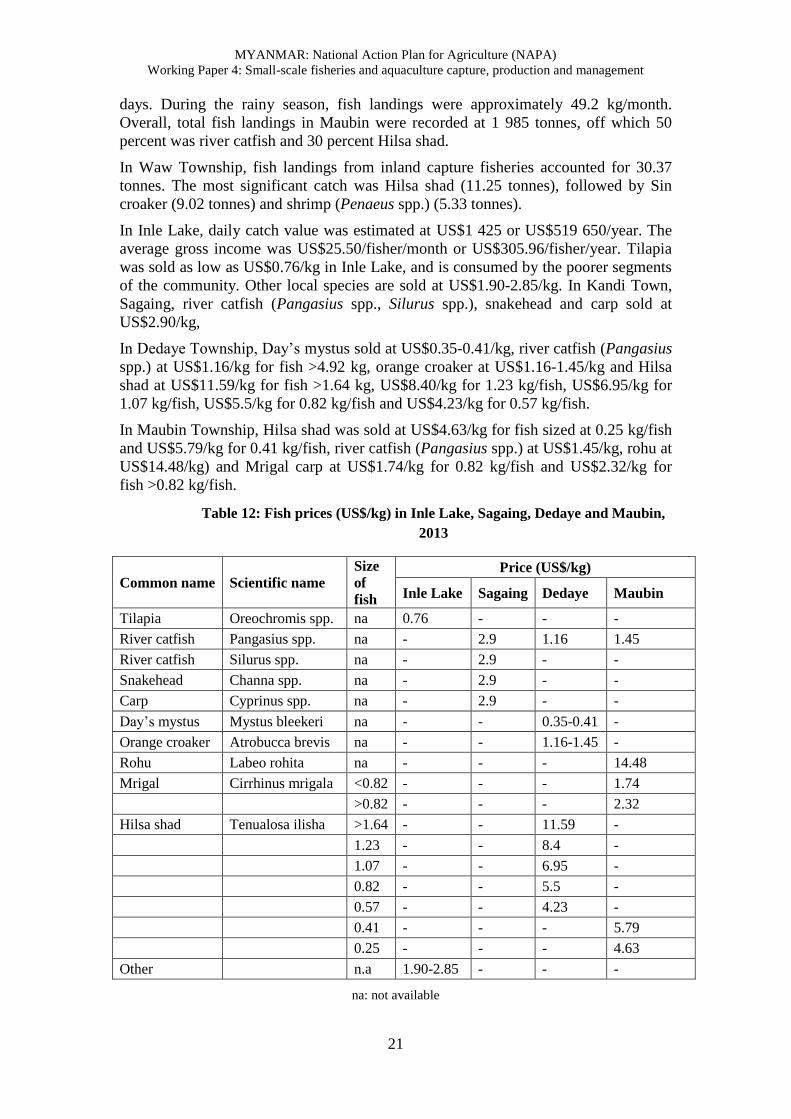
In Inle Lake, daily catch value was estimated at US$1 425 or US$519 650/year. The
average gross income was US$25.50/fisher/month or US$305.96/fisher/year. Tilapia
was sold as low as US$0.76/kg in Inle Lake, and is consumed by the poorer segments
of the community. Other local species are sold at US$1.90-2.85/kg. In Kandi Town,
Sagaing, river catfish (Pangasius spp., Silurus spp.), snakehead and carp sold at
US$2.90/kg,
In Dedaye Township, Day’s mystus sold at US$0.35-0.41/kg, river catfish (Pangasius
spp.) at US$1.16/kg for fish >4.92 kg, orange croaker at US$1.16-1.45/kg and Hilsa
shad at US$11.59/kg for fish >1.64 kg, US$8.40/kg for 1.23 kg/fish, US$6.95/kg for
1.07 kg/fish, US$5.5/kg for 0.82 kg/fish and US$4.23/kg for 0.57 kg/fish.
In Maubin Township, Hilsa shad was sold at US$4.63/kg for fish sized at 0.25 kg/fish
and US$5.79/kg for 0.41 kg/fish, river catfish (Pangasius spp.) at US$1.45/kg, rohu at
US$14.48/kg) and Mrigal carp at US$1.74/kg for 0.82 kg/fish and US$2.32/kg for
fish >0.82 kg/fish.
Table 12: Fish prices (US$/kg) in Inle Lake, Sagaing, Dedaye and Maubin,
2013
Common name Scientific name
Size
of
fish
Price (US$/kg)
Inle Lake Sagaing Dedaye Maubin
Tilapia Oreochromis spp. na 0.76 - - -
River catfish Pangasius spp. na - 2.9 1.16 1.45
River catfish Silurus spp. na - 2.9 - -
Snakehead Channa spp. na - 2.9 - -
Carp Cyprinus spp. na - 2.9 - -
Day’s mystus Mystus bleekeri na - - 0.35-0.41 -
Orange croaker Atrobucca brevis na - - 1.16-1.45 -
Rohu Labeo rohita na - - - 14.48
Mrigal Cirrhinus mrigala <0.82 - - - 1.74
>0.82 - - - 2.32
Hilsa shad Tenualosa ilisha >1.64 - - 11.59 -
1.23 - - 8.4 -
1.07 - - 6.95 -
0.82 - - 5.5 -
0.57 - - 4.23 -
0.41 - - - 5.79
0.25 - - - 4.63
Other n.a 1.90-2.85 - - -
na: not available
MYANMAR: National Action Plan for Agriculture (NAPA)
Working Paper 4: Small-scale fisheries and aquaculture capture, production and management
22
As mentioned earlier, Myanmar’s annual fisheries statistics do not provide figures for
catch value or a species breakdown of the catch. This is a serious shortcoming and
prevents an accurate assessment of the contribution of the industry to the national
economy.
An assessment of the total value of the inland open fish landings was made based on
the prices collected during the study:
High-value commodities such Hilsa shad greater than 1 kg/fish and rohu
which would account for only a fraction of catch volume were discounted.
There was a focus on bread-and-butter species such as tilapia, river catfish
(Pangasius spp.), carp, Mrigal carp and Hilsa shad < 1 kg/fish which would
account for the bulk of the catch.
The price for the latter group of fish ranged from US$0.76-5.79/kg. Assuming
an average price of US$3.05/kg, the gross value of the Myanma marine fish
catch would amount to at least US$3.28 billion (or 3.46 trillion kyat). This
figure is an underestimation given the value of higher priced fish that has not
been factored in. However, on the balance of probabilities, the actual figure is
not expected to be too far from this estimate.
Handling and postharvest treatment of fish is relatively primitive. Ice is
available, and utilized, in landing points close to towns. However, more
distant landing facilities do not have access to ice and preservation of catch
quality is problematic. The use of ice on-board is also limited because the
small vessels used for fishing lack insulated holds or storage areas for holding
ice.
No comprehensive assessment of inland fisheries resources has apparently been
undertaken thus far. However, data obtained during the study suggest the following:
As reported by all inland fishers interviewed, there have been major declines
in catch over the last five years. The declines have varied from 40-70 percent,
with the main drop being in the Hilsa shad catch.
Target species in the sites visited has shifted from Hilsa to Pangasids. Though
the catch volume does not appear to have suffered considerably, the values
have markedly declined. Hilsa shad is a higher value species, commanding
prices of up to US$12/kg compared to US$1.16/kg for pangasid catfish.
There has been an overall drop in incomes as a result. Fishers in Kyaung Kong
had to seek additional employment outside their villages to supplement their
incomes − not necessary five years ago.
3.3. Leasable fisheries
Leasable fisheries are leased through a bidding process and the winning bidder is
granted the right to harvest the fishery resources in demarcated ‘inns’ commonly from
September to April. The character of the waterbodies given out for lease is highly
variable. Most are confined waters, but some open waters are offered as well. Auction
prices have increased 10 percent over the last few years. When production goes down,
funds are provided to improve habitat and for stock enhancement.
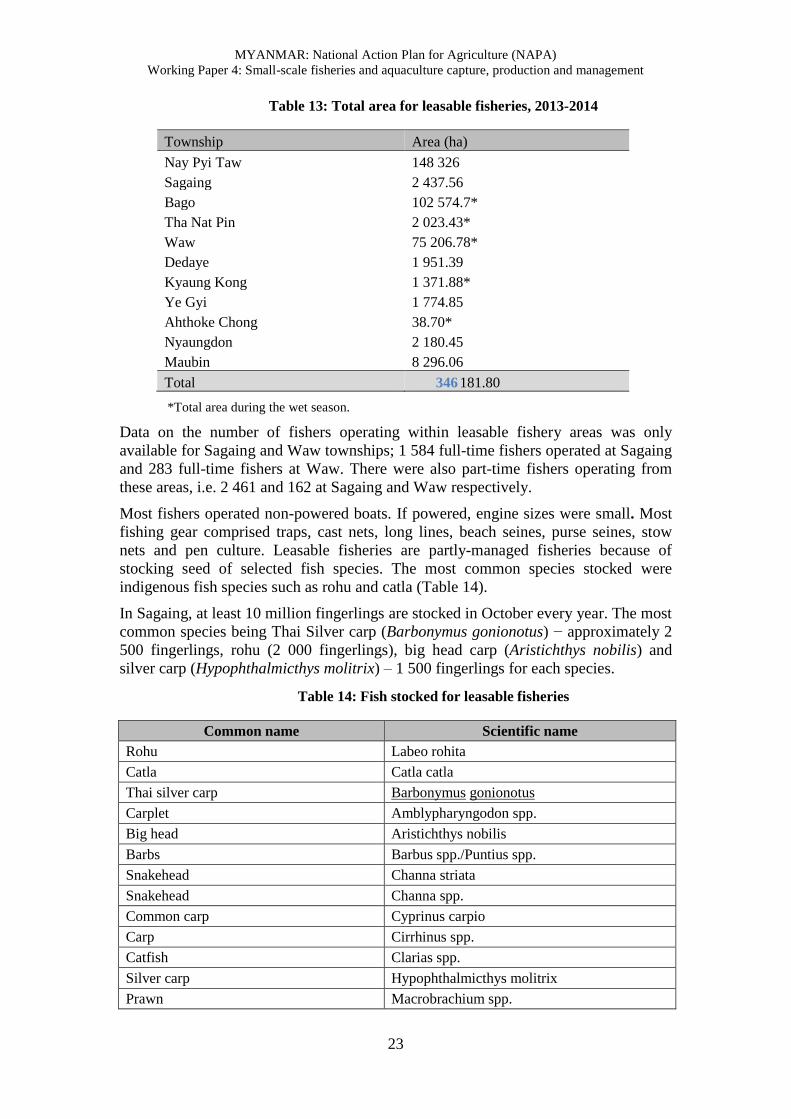
In 2013-2014, a total 3 290 leasable fisheries were recorded. Data collected during the
site visit logged more than 446 182 ha of leasable concessions at Nay Pyi Taw,
Sagaing, Bago, Tha Nat Pin, Waw, Dadaye, Kyaung Kong, Ye Gyi, Anthoke Chong,
Nyaungdon and Maubin (Table 13).
MYANMAR: National Action Plan for Agriculture (NAPA)
Working Paper 4: Small-scale fisheries and aquaculture capture, production and management
23
Table 13: Total area for leasable fisheries, 2013-2014
Township Area (ha)
Nay Pyi Taw 148 326
Sagaing 2 437.56
Bago 102 574.7*
Tha Nat Pin 2 023.43*
Waw 75 206.78*
Dedaye 1 951.39
Kyaung Kong 1 371.88*
Ye Gyi 1 774.85
Ahthoke Chong 38.70*
Nyaungdon 2 180.45
Maubin 8 296.06
Total 346 181.80
*Total area during the wet season.
Data on the number of fishers operating within leasable fishery areas was only
available for Sagaing and Waw townships; 1 584 full-time fishers operated at Sagaing
and 283 full-time fishers at Waw. There were also part-time fishers operating from
these areas, i.e. 2 461 and 162 at Sagaing and Waw respectively.
Most fishers operated non-powered boats. If powered, engine sizes were small. Most
fishing gear comprised traps, cast nets, long lines, beach seines, purse seines, stow
nets and pen culture. Leasable fisheries are partly-managed fisheries because of
stocking seed of selected fish species. The most common species stocked were
indigenous fish species such as rohu and catla (Table 14).
In Sagaing, at least 10 million fingerlings are stocked in October every year. The most
common species being Thai Silver carp (Barbonymus gonionotus) − approximately 2
500 fingerlings, rohu (2 000 fingerlings), big head carp (Aristichthys nobilis) and
silver carp (Hypophthalmicthys molitrix) – 1 500 fingerlings for each species.
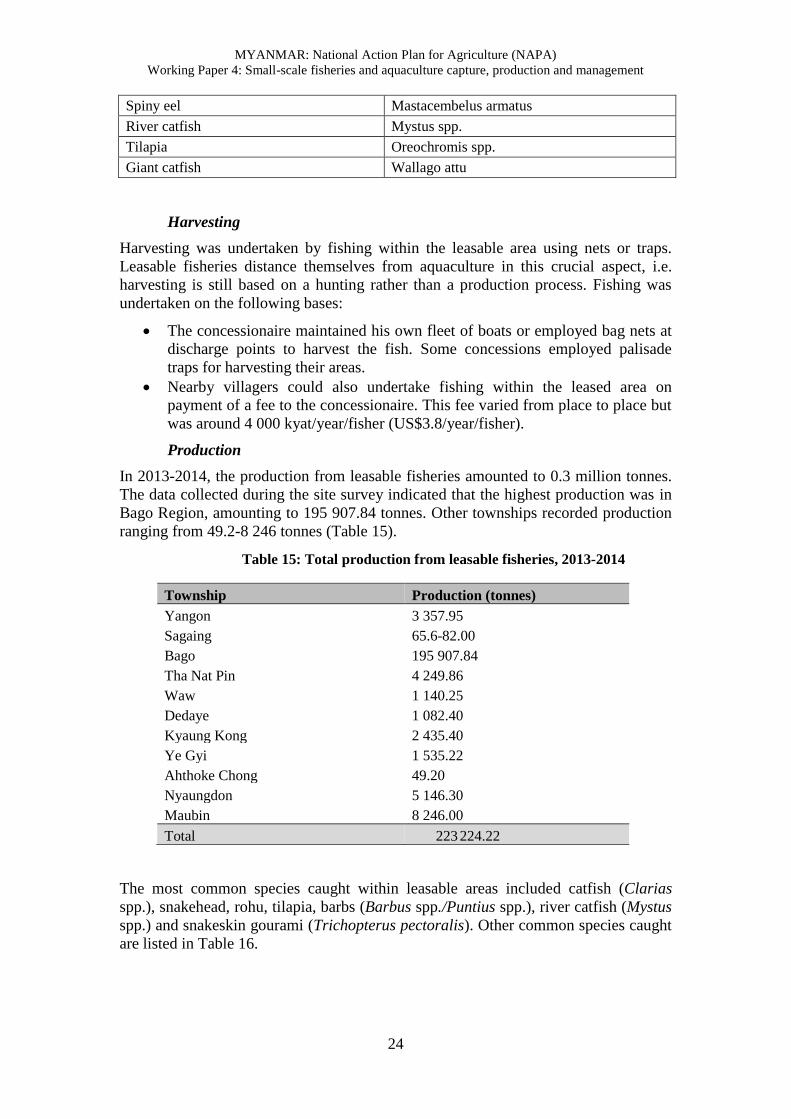
Table 14: Fish stocked for leasable fisheries
Common name Scientific name
Rohu Labeo rohita
Catla Catla catla
Thai silver carp Barbonymus gonionotus
Carplet Amblypharyngodon spp.
Big head Aristichthys nobilis
Barbs Barbus spp./Puntius spp.
Snakehead Channa striata
Snakehead Channa spp.
Common carp Cyprinus carpio
Carp Cirrhinus spp.
Catfish Clarias spp.
Silver carp Hypophthalmicthys molitrix
Prawn Macrobrachium spp.
MYANMAR: National Action Plan for Agriculture (NAPA)
Working Paper 4: Small-scale fisheries and aquaculture capture, production and management
24
Spiny eel Mastacembelus armatus
River catfish Mystus spp.
Tilapia Oreochromis spp.
Giant catfish Wallago attu
Harvesting
Harvesting was undertaken by fishing within the leasable area using nets or traps.
Leasable fisheries distance themselves from aquaculture in this crucial aspect, i.e.
harvesting is still based on a hunting rather than a production process. Fishing was
undertaken on the following bases:
The concessionaire maintained his own fleet of boats or employed bag nets at
discharge points to harvest the fish. Some concessions employed palisade
traps for harvesting their areas.
Nearby villagers could also undertake fishing within the leased area on
payment of a fee to the concessionaire. This fee varied from place to place but
was around 4 000 kyat/year/fisher (US$3.8/year/fisher).
Production
In 2013-2014, the production from leasable fisheries amounted to 0.3 million tonnes.
The data collected during the site survey indicated that the highest production was in
Bago Region, amounting to 195 907.84 tonnes. Other townships recorded production
ranging from 49.2-8 246 tonnes (Table 15).
Table 15: Total production from leasable fisheries, 2013-2014
Township Production (tonnes)
Yangon 3 357.95
Sagaing 65.6-82.00
Bago 195 907.84
Tha Nat Pin 4 249.86
Waw 1 140.25
Dedaye 1 082.40
Kyaung Kong 2 435.40
Ye Gyi 1 535.22
Ahthoke Chong 49.20
Nyaungdon 5 146.30
Maubin 8 246.00
Total 223 224.22
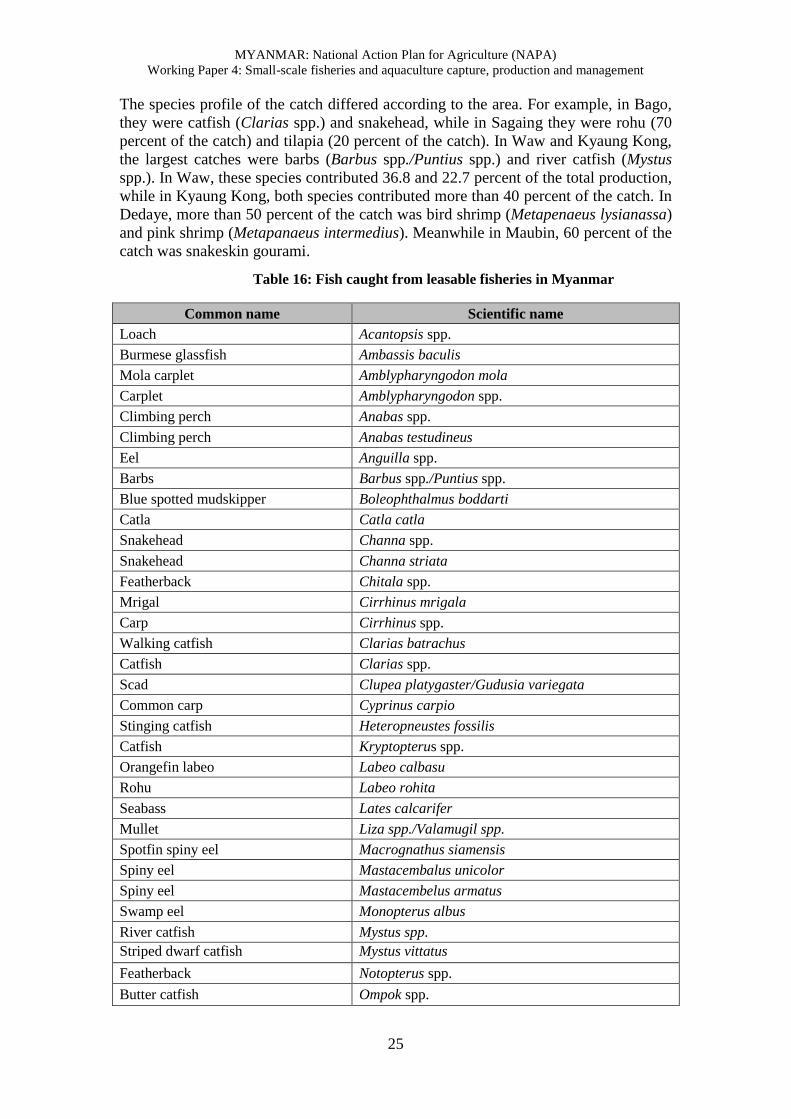
The most common species caught within leasable areas included catfish (Clarias
spp.), snakehead, rohu, tilapia, barbs (Barbus spp./Puntius spp.), river catfish (Mystus
spp.) and snakeskin gourami (Trichopterus pectoralis). Other common species caught
are listed in Table 16.
MYANMAR: National Action Plan for Agriculture (NAPA)
Working Paper 4: Small-scale fisheries and aquaculture capture, production and management
25
The species profile of the catch differed according to the area. For example, in Bago,
they were catfish (Clarias spp.) and snakehead, while in Sagaing they were rohu (70
percent of the catch) and tilapia (20 percent of the catch). In Waw and Kyaung Kong,
the largest catches were barbs (Barbus spp./Puntius spp.) and river catfish (Mystus
spp.). In Waw, these species contributed 36.8 and 22.7 percent of the total production,
while in Kyaung Kong, both species contributed more than 40 percent of the catch. In
Dedaye, more than 50 percent of the catch was bird shrimp (Metapenaeus lysianassa)
and pink shrimp (Metapanaeus intermedius). Meanwhile in Maubin, 60 percent of the
catch was snakeskin gourami.
Table 16: Fish caught from leasable fisheries in Myanmar
Common name Scientific name
Loach Acantopsis spp.
Burmese glassfish Ambassis baculis
Mola carplet Amblypharyngodon mola
Carplet Amblypharyngodon spp.
Climbing perch Anabas spp.
Climbing perch Anabas testudineus
Eel Anguilla spp.
Barbs Barbus spp./Puntius spp.
Blue spotted mudskipper Boleophthalmus boddarti
Catla Catla catla
Snakehead Channa spp.
Snakehead Channa striata
Featherback Chitala spp.
Mrigal Cirrhinus mrigala
Carp Cirrhinus spp.
Walking catfish Clarias batrachus
Catfish Clarias spp.
Scad Clupea platygaster/Gudusia variegata
Common carp Cyprinus carpio
Stinging catfish Heteropneustes fossilis
Catfish Kryptopterus spp.
Orangefin labeo Labeo calbasu
Rohu Labeo rohita
Seabass Lates calcarifer
Mullet Liza spp./Valamugil spp.
Spotfin spiny eel Macrognathus siamensis
Spiny eel Mastacembalus unicolor
Spiny eel Mastacembelus armatus
Swamp eel Monopterus albus
River catfish Mystus spp.
Striped dwarf catfish Mystus vittatus
Featherback Notopterus spp.
Butter catfish Ompok spp.
MYANMAR: National Action Plan for Agriculture (NAPA)
Working Paper 4: Small-scale fisheries and aquaculture capture, production and management
26
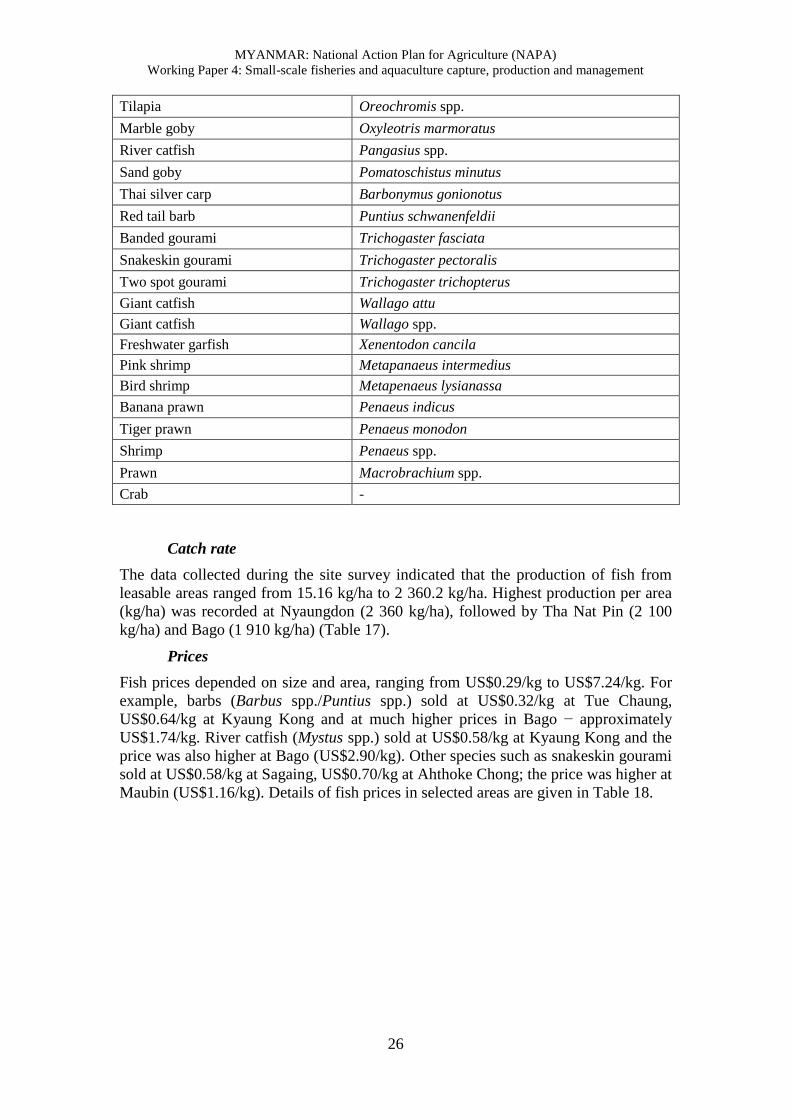
Tilapia Oreochromis spp.
Marble goby Oxyleotris marmoratus
River catfish Pangasius spp.
Sand goby Pomatoschistus minutus
Thai silver carp Barbonymus gonionotus
Red tail barb Puntius schwanenfeldii
Banded gourami Trichogaster fasciata
Snakeskin gourami Trichogaster pectoralis
Two spot gourami Trichogaster trichopterus
Giant catfish Wallago attu
Giant catfish Wallago spp.
Freshwater garfish Xenentodon cancila
Pink shrimp Metapanaeus intermedius
Bird shrimp Metapenaeus lysianassa
Banana prawn Penaeus indicus
Tiger prawn Penaeus monodon
Shrimp Penaeus spp.
Prawn Macrobrachium spp.
Crab -
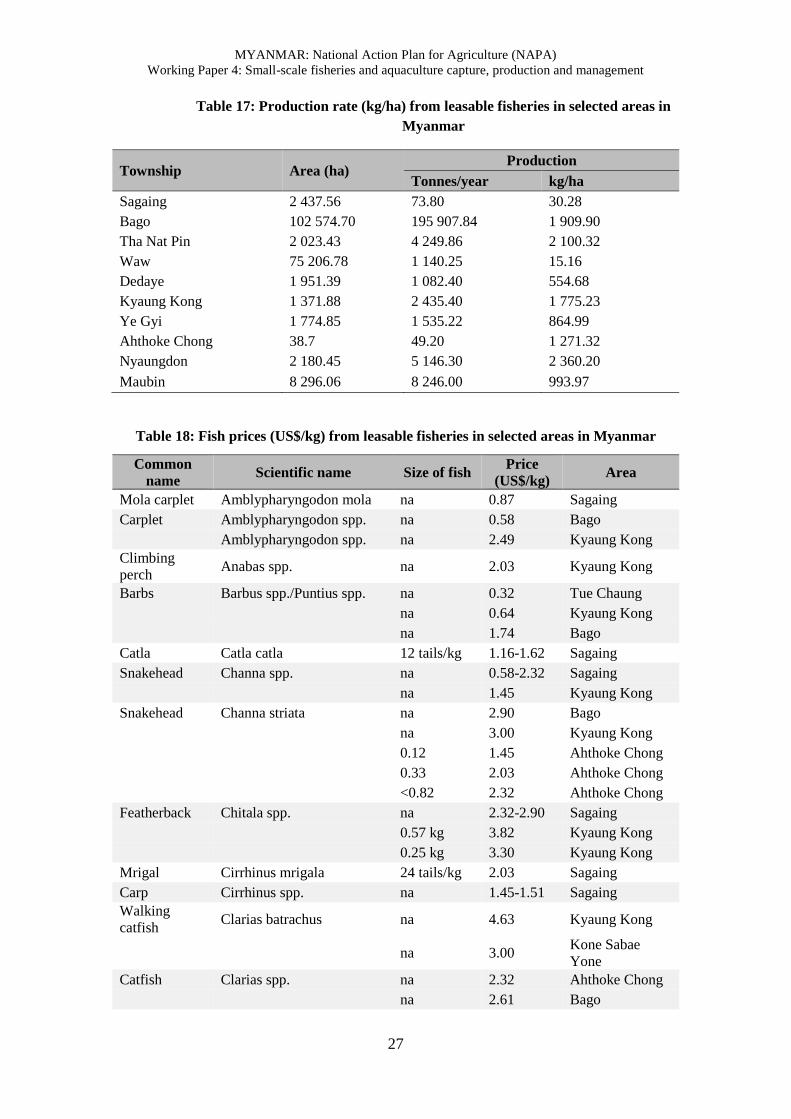
Catch rate
The data collected during the site survey indicated that the production of fish from
leasable areas ranged from 15.16 kg/ha to 2 360.2 kg/ha. Highest production per area
(kg/ha) was recorded at Nyaungdon (2 360 kg/ha), followed by Tha Nat Pin (2 100
kg/ha) and Bago (1 910 kg/ha) (Table 17).
Prices
Fish prices depended on size and area, ranging from US$0.29/kg to US$7.24/kg. For
example, barbs (Barbus spp./Puntius spp.) sold at US$0.32/kg at Tue Chaung,
US$0.64/kg at Kyaung Kong and at much higher prices in Bago − approximately
US$1.74/kg. River catfish (Mystus spp.) sold at US$0.58/kg at Kyaung Kong and the
price was also higher at Bago (US$2.90/kg). Other species such as snakeskin gourami
sold at US$0.58/kg at Sagaing, US$0.70/kg at Ahthoke Chong; the price was higher at
Maubin (US$1.16/kg). Details of fish prices in selected areas are given in Table 18.
MYANMAR: National Action Plan for Agriculture (NAPA)
Working Paper 4: Small-scale fisheries and aquaculture capture, production and management
27
Table 17: Production rate (kg/ha) from leasable fisheries in selected areas in
Myanmar
Township Area (ha) Production
Tonnes/year kg/ha
Sagaing 2 437.56 73.80 30.28
Bago 102 574.70 195 907.84 1 909.90
Tha Nat Pin 2 023.43 4 249.86 2 100.32
Waw 75 206.78 1 140.25 15.16
Dedaye 1 951.39 1 082.40 554.68
Kyaung Kong 1 371.88 2 435.40 1 775.23
Ye Gyi 1 774.85 1 535.22 864.99
Ahthoke Chong 38.7 49.20 1 271.32
Nyaungdon 2 180.45 5 146.30 2 360.20
Maubin 8 296.06 8 246.00 993.97
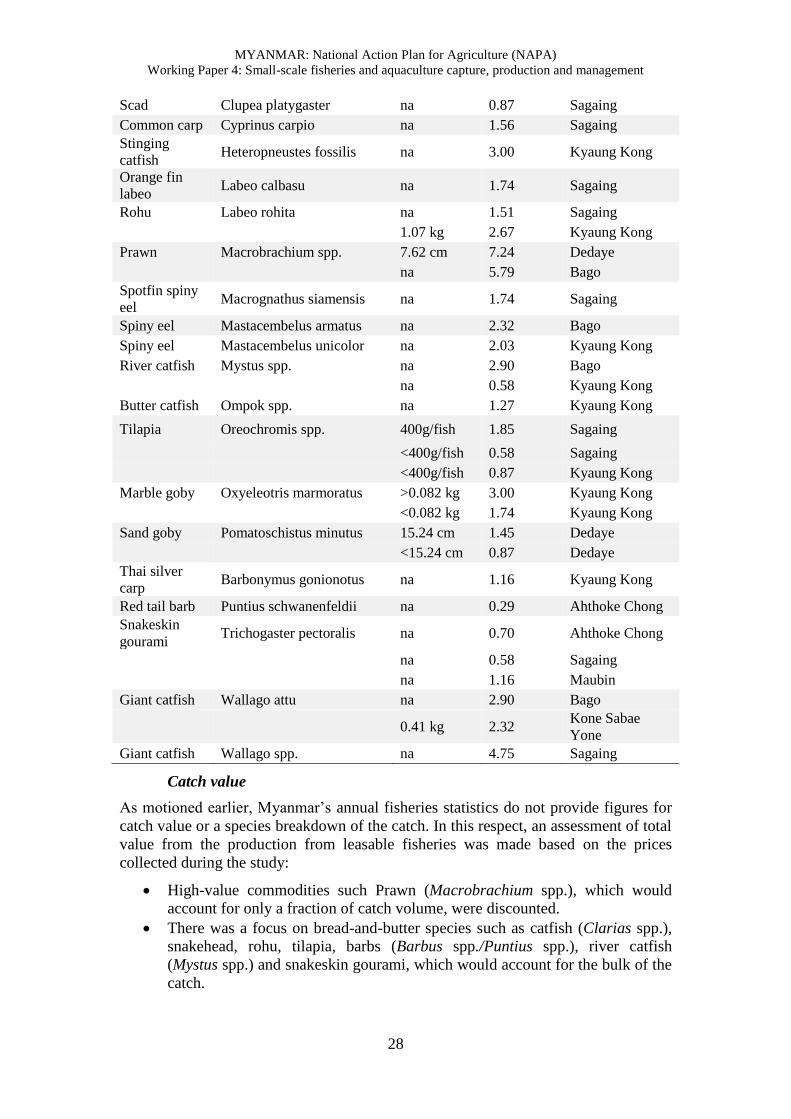
Table 18: Fish prices (US$/kg) from leasable fisheries in selected areas in Myanmar
Common
name Scientific name Size of fish
Price
(US$/kg) Area
Mola carplet Amblypharyngodon mola na 0.87 Sagaing
Carplet Amblypharyngodon spp. na 0.58 Bago
Amblypharyngodon spp. na 2.49 Kyaung Kong
Climbing
perch Anabas spp. na 2.03 Kyaung Kong
Barbs Barbus spp./Puntius spp. na 0.32 Tue Chaung
na 0.64 Kyaung Kong
na 1.74 Bago
Catla Catla catla 12 tails/kg 1.16-1.62 Sagaing
Snakehead Channa spp. na 0.58-2.32 Sagaing
na 1.45 Kyaung Kong
Snakehead Channa striata na 2.90 Bago
na 3.00 Kyaung Kong
0.12 1.45 Ahthoke Chong
0.33 2.03 Ahthoke Chong
<0.82 2.32 Ahthoke Chong
Featherback Chitala spp. na 2.32-2.90 Sagaing
0.57 kg 3.82 Kyaung Kong
0.25 kg 3.30 Kyaung Kong
Mrigal Cirrhinus mrigala 24 tails/kg 2.03 Sagaing
Carp Cirrhinus spp. na 1.45-1.51 Sagaing
Walking
catfish Clarias batrachus na 4.63 Kyaung Kong
na 3.00 Kone Sabae
Yone
Catfish Clarias spp. na 2.32 Ahthoke Chong
na 2.61 Bago
MYANMAR: National Action Plan for Agriculture (NAPA)
Working Paper 4: Small-scale fisheries and aquaculture capture, production and management
28
Scad Clupea platygaster na 0.87 Sagaing
Common carp Cyprinus carpio na 1.56 Sagaing
Stinging
catfish Heteropneustes fossilis na 3.00 Kyaung Kong
Orange fin
labeo Labeo calbasu na 1.74 Sagaing
Rohu Labeo rohita na 1.51 Sagaing
1.07 kg 2.67 Kyaung Kong
Prawn Macrobrachium spp. 7.62 cm 7.24 Dedaye
na 5.79 Bago
Spotfin spiny
eel Macrognathus siamensis na 1.74 Sagaing
Spiny eel Mastacembelus armatus na 2.32 Bago
Spiny eel Mastacembelus unicolor na 2.03 Kyaung Kong
River catfish Mystus spp. na 2.90 Bago
na 0.58 Kyaung Kong
Butter catfish Ompok spp. na 1.27 Kyaung Kong
Tilapia Oreochromis spp. 400g/fish 1.85 Sagaing
<400g/fish 0.58 Sagaing
<400g/fish 0.87 Kyaung Kong
Marble goby Oxyeleotris marmoratus >0.082 kg 3.00 Kyaung Kong
<0.082 kg 1.74 Kyaung Kong
Sand goby Pomatoschistus minutus 15.24 cm 1.45 Dedaye
<15.24 cm 0.87 Dedaye
Thai silver
carp Barbonymus gonionotus na 1.16 Kyaung Kong
Red tail barb Puntius schwanenfeldii na 0.29 Ahthoke Chong
Snakeskin
gourami Trichogaster pectoralis na 0.70 Ahthoke Chong
na 0.58 Sagaing
na 1.16 Maubin
Giant catfish Wallago attu na 2.90 Bago
0.41 kg 2.32 Kone Sabae
Yone
Giant catfish Wallago spp. na 4.75 Sagaing
Catch value
As motioned earlier, Myanmar’s annual fisheries statistics do not provide figures for
catch value or a species breakdown of the catch. In this respect, an assessment of total
value from the production from leasable fisheries was made based on the prices
collected during the study:
High-value commodities such Prawn (Macrobrachium spp.), which would
account for only a fraction of catch volume, were discounted.
There was a focus on bread-and-butter species such as catfish (Clarias spp.),
snakehead, rohu, tilapia, barbs (Barbus spp./Puntius spp.), river catfish
(Mystus spp.) and snakeskin gourami, which would account for the bulk of the
catch.
MYANMAR: National Action Plan for Agriculture (NAPA)
Working Paper 4: Small-scale fisheries and aquaculture capture, production and management
29
The price for the latter group of fish ranged from US$0.32-3.00/kg. Assuming
an average price of US$1.68/kg, gross value from the leasable fisheries would
amount to at least US$0.51 billion (or 0.54 trillion kyat). This figure is
complicated by conflicting value concerns with the value of high-value fish
not being factored in.
Handling and postharvest
The location of many leasable fishery sites in rural areas, far from ice plants, means
that the use of ice in preservation of catches is limited. The limited availability of ice
in this regard has two major consequences:
The quality of the fish that is traded and ultimately retailed would be poor
because some degree of deterioration is inevitable in the catching and
transportation process.
Operators and fishers have little leverage to bargain with their buyers, and
must accept whatever prices offered to them. This inevitably works to the
detriment of the concessionaire/fisher, as traders would work to maximize
their profits and minimize losses due to spoilage.
Resources and resource health
No detailed published studies have been carried out on production trends within
leasable areas. The current literature available is too thin to be able to make a
comprehensive assessment of production trends for various species and whether
current stocking rates are optimal. However, information culled during this study
points to the following:
There is a serious decline (up to 70 percent) in indigenous fish landings in the
catch from leasable fisheries. This was particularly reported in the Sagaing and
Mandalay regions. The catch is increasing dominated by stocked fish and,
more prominently, by tilapia.
As tilapia is not commonly stocked in the leasable areas, their presence must
be sustained by breeding populations within the areas, or more ominous from
the floodwaters that inundate the leasehold areas from May to August.
The current practice in most leasehold sites is that the land exposed as the
water recedes over the dry period from November to April is turned over for
rice planting and re-used for fisheries after the rainy season in May.
However, rice farming employs pesticides that can have a deleterious effect on
the fish population, either through direct runoff or through residues adsorbed
in the soil. This is possibly a major reason accounting for the decline in
indigenous fish populations. As most indigenous fish breed during the rainy
season, their newly hatched fry would be susceptible to even low levels of
pesticide contamination. Stocked fish are larger and stocked later (in
September), when dilution by rainwater would have further reduced pesticide
contamination levels. Tilapia, on the other hand, is a highly robust fish that
spawns the year round, and would be able to ensure recruitment to the
standing stock even if the initial surge of contaminated water led to fry
mortality.
Again, the conflict in land use is an issue that needs to be addressed at the
policy level. A possible policy measure could be to limit paddy farming within
leasable areas to the production of organic rice, which would not involve the
use of pesticides.
MYANMAR: National Action Plan for Agriculture (NAPA)
Working Paper 4: Small-scale fisheries and aquaculture capture, production and management
30
3.4 Aquaculture
There are two major aquaculture systems practised in Myanmar, i.e. freshwater pond
and brackishwater pond culture. In 2013-2014, there were a total of 89 851 ha of
freshwater fish ponds and 92 388 ha of shrimp ponds in the country. Most of the
freshwater fish farming was found in the Ayeyarwarddy (45 685 ha) and Yangon (24
226 ha) regions, while shrimp farming was undertaken largely in Rakhine State (62
950 ha). The industry supported a total of 216 284 farmers – 125 978 full-time and 90
306 part-time.
In addition to pond-based aquaculture, crab and seaweed farming operated at Myiek,
Kyweky and Kyauk Tan, while limited brackishwater cages operated at Myiek and
Yae Pyit Awe.
There are over 26 government hatcheries managed by the Department of Fisheries and
over 70 private hatcheries producing fish and shrimp/prawn postlarvae operating in
Myanmar.
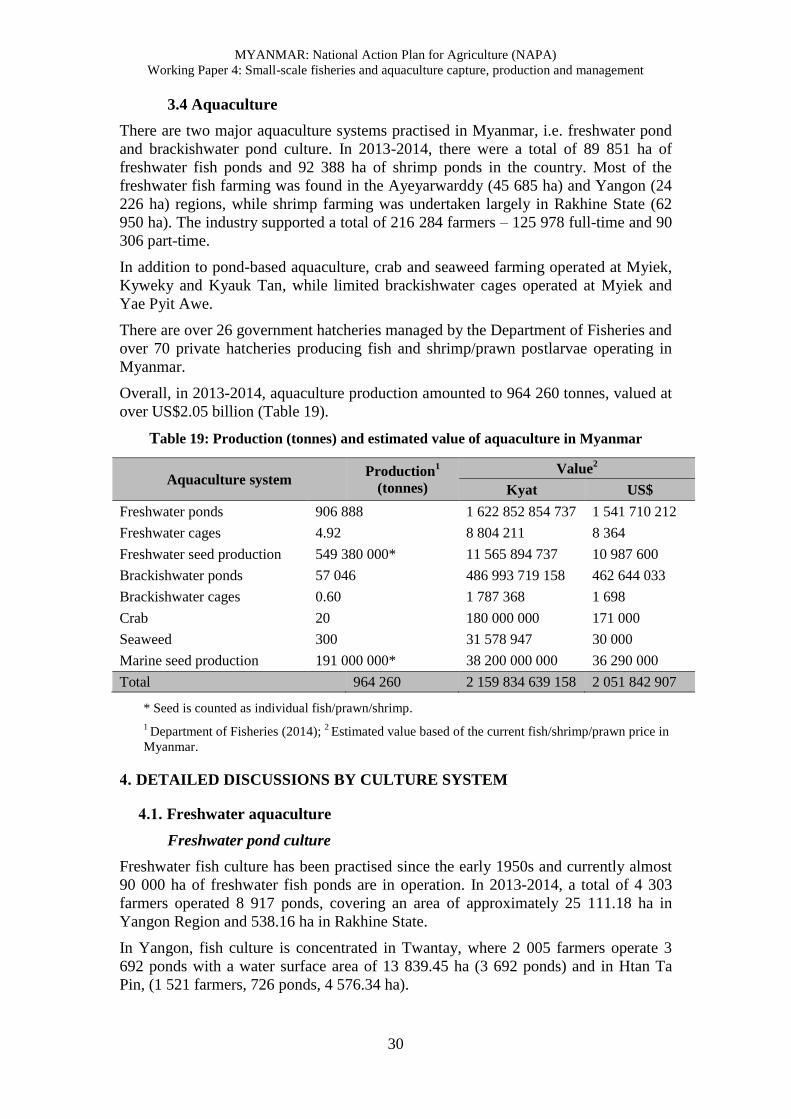
Overall, in 2013-2014, aquaculture production amounted to 964 260 tonnes, valued at
over US$2.05 billion (Table 19).
Table 19: Production (tonnes) and estimated value of aquaculture in Myanmar
Aquaculture system Production
1
(tonnes)
Value2
Kyat US$
Freshwater ponds 906 888 1 622 852 854 737 1 541 710 212
Freshwater cages 4.92 8 804 211 8 364
Freshwater seed production 549 380 000* 11 565 894 737 10 987 600
Brackishwater ponds 57 046 486 993 719 158 462 644 033
Brackishwater cages 0.60 1 787 368 1 698
Crab 20 180 000 000 171 000
Seaweed 300 31 578 947 30 000
Marine seed production 191 000 000* 38 200 000 000 36 290 000
Total 964 260 2 159 834 639 158 2 051 842 907
* Seed is counted as individual fish/prawn/shrimp.
1 Department of Fisheries (2014);
2 Estimated value based of the current fish/shrimp/prawn price in
Myanmar.
4. DETAILED DISCUSSIONS BY CULTURE SYSTEM
4.1. Freshwater aquaculture
Freshwater pond culture
Freshwater fish culture has been practised since the early 1950s and currently almost
90 000 ha of freshwater fish ponds are in operation. In 2013-2014, a total of 4 303
farmers operated 8 917 ponds, covering an area of approximately 25 111.18 ha in
Yangon Region and 538.16 ha in Rakhine State.
In Yangon, fish culture is concentrated in Twantay, where 2 005 farmers operate 3
692 ponds with a water surface area of 13 839.45 ha (3 692 ponds) and in Htan Ta
Pin, (1 521 farmers, 726 ponds, 4 576.34 ha).
MYANMAR: National Action Plan for Agriculture (NAPA)
Working Paper 4: Small-scale fisheries and aquaculture capture, production and management
31
In Rakhine, most fish culture is concentrated in Myauk-U, Minn Pyar and Pauk Taw
in Sittwe District and Than Twe in Than Twe District. The biggest areas are Myauk-U
and Minn Pyar, each covering an area of approximately 140.83 ha.
Currently, over 20 species of freshwater fish are cultured in Myanmar include rohu
(Labeo rohita), common carp (Cyprinuscarpio), tilapia (Oreochromis spp.), catla
(Catla catla), carp (Cirrhinus spp.), Mrigal carp (Cirrhinusmrigala), Thai silver carp
(Barbonymus gonionotus), bighead carp (Aristichthys nobilis), silver carp
(Hypophthalmicthys molitrix), grass carp (Ctenopharyngodon idella), hybrid catfish
(Clarias gariepinus x Clarias macrocephalus), rohtee (Rohtee cortio), river catfish
(Pangasius spp.), striped catfish (Pangasius hypopthalmus) and pacu (Colossoma
spp.).
Several new species have been introduced by the Department of Fisheries (DOF).
These include stinging catfish (Heteropneustes fossilis), sheatfish (Ompok
bimaculatus), featherback (Notopterus chitala), carp (Cyprinus intha), snakeskin
gourami (Trichogaster pectoralis), striped catfish (Pangasius bacourti), streaked
prochilod (Prochilodus luneatus), freshwater pomfret (Pitratus brachypomum) and
Sultan fish (Leptobarbus hoevenii).
There is a significant level of variation in management practices. The farmers visited
in Yae Pyong Gyi village (in upper Myanmar) preferred to stock fingerlings of 2 to 5
cm with high stocking densities of around 25 000 fingerlings/ha. Culture periods are
limited to six months with preferred marketable size of 19-25 cm/fish or 250-500
g/fish. The average output is estimated at 4.10- 4.92 tonnes/ha.
However, in Bago and Dedaya (lower Myanmar), the size of fingerlings being stocked
was much bigger, ranging from 12 to 15 cm so as to enable short culture periods.
Stocking densities were between 3 000-5 000 fingerlings/ha. The culture period was
approximately 10 to 12 months to reach a marketable size 2-3kg/fish. The average
output was estimated at 10-12 tonnes/ha.
Giant freshwater prawn (Macrobranchium rosenbergii) farming was also undertaken
in some of the farms visited, largely on a semi-intensive polyculture basis in which
prawns are stocked as a minor component. The total area of the polyculture system
operated was 4 070 ha. Only a few prawn monoculture farms still operate in
Myanmar.
Feeding is normally limited to the use of raw feedsuch as groundnut meal, soybean
meal and rice bran. Coconut cake is an important feed component for freshwater
prawns. The use of manufactured pellet feed is apparently limited.
A major impetus in the industry has been integration of aquaculture with poultry.
During the study, the integrated farming of fish with chickens was noted in Legu and
Kan Ga Lay and integrated farming of fish with ducks in Ye Gyi. The chickens and
ducks are raised in coops above the ponds. About 6 000-6 500 chickens were raised in
each area, where coops each held at least 2 000 chicks. The production cycle for
poultry was 45 days and there were six cycles in a year.
Integrated farming mainly involved rohu and catla. Other fish that were also stocked
included grass carp (Ctenopharyngodon idella) and river catfish (Pangasius spp.) in
Legu and common carp (Cyprinuscarpio) and Thai silver carp (Barbonymus
gonionotus) in Kan Ga Lay. No feed was provided. The fish survive on the
chicken/duck dung and any surplus feed that falls into the pond.
MYANMAR: National Action Plan for Agriculture (NAPA)
Working Paper 4: Small-scale fisheries and aquaculture capture, production and management
32
Overall, production from freshwater pond culture amounted to 906 888.36 tonnes
valued at US$1.54 billion. The value of the freshwater pond is based on average
prices of US$1.70/kg. The price of fish ranged from US$1.16-2.49/kg and averaged
US$1.70/kg.
Freshwater cage culture
Freshwater cage culture was only observed in Inle Lake, particularly at Pao Pah
village. This is being done on a pilot scale by the DOF and involved a total of 50
fixed cages. Each 5 x 2 m cage was a wooden frame with fine mesh Netlon.
Fish cultured in cages included common carp, grass carp and tilapia. The stocking
density was 5 000 fingerlings/cage for common carp, 3 500 fingerlings/cage for grass
carp and 3 000 fingerlings/cage for tilapia. The production rate was anticipated to be
98.40 kg/year/cage.
Seed production
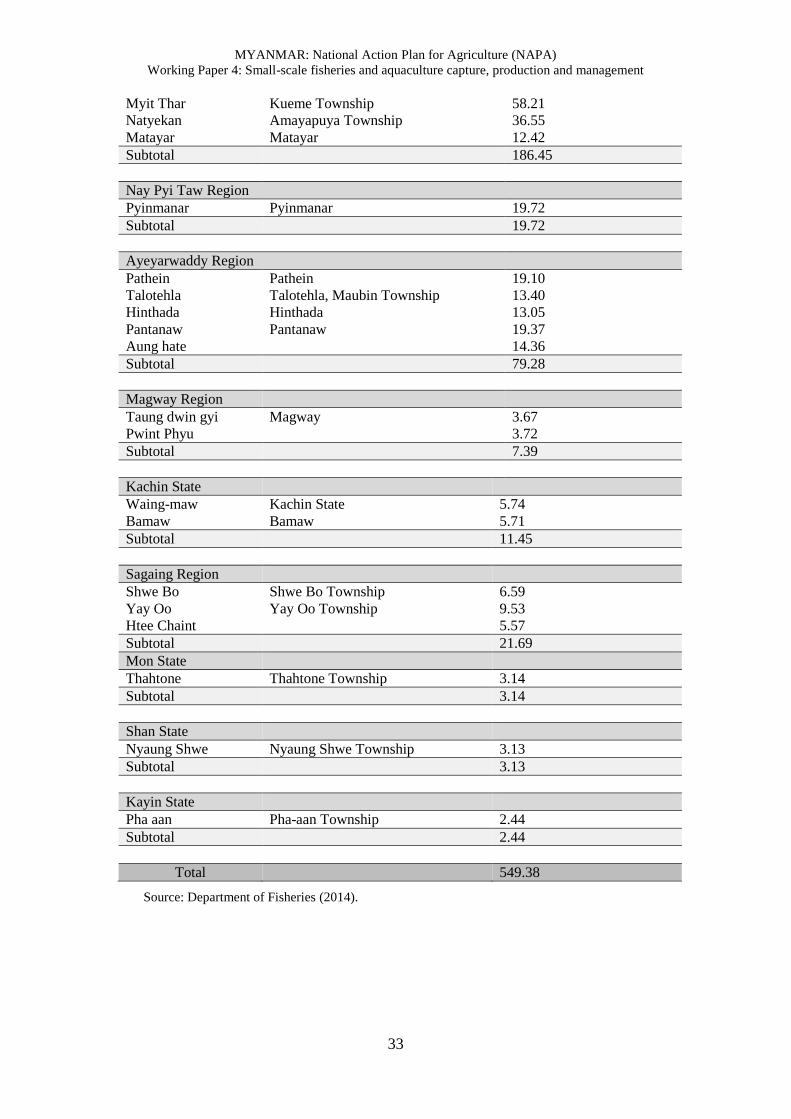
In 2013-2014, 26 government hatcheries operated in Myanmar with total production
of 549.38 million fingerlings. The highest production was in the Mandalay Region
(186.45 million), covering 33.9 percent of total production, followed by Yangon
Region (25.8 percent), Ayeyarwaddy Region (14.4 percent) and Bago Region (13.3
percent). Other regions/states accounted for only 0.4-3.9 percent of the total
production (Table 20).
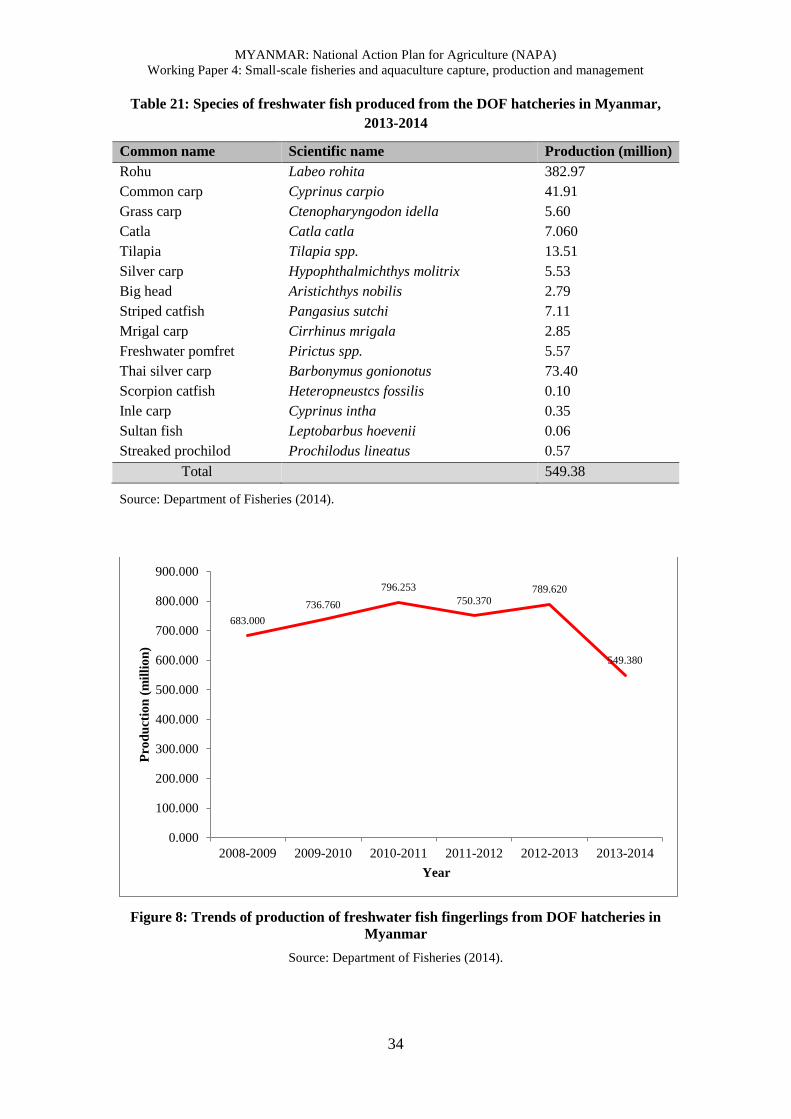
A total of 15 species of fish were produced in 2013-2014. The highest production was
rohu (69.7 percent of the total production), followed by Thai silver carp (Barbonymus
gonionotus) at 13.4 percent and common carp at 7.6 percent, while other species
accounted for less than 3.0 percent each (Table 21).
From 2008-2014, the production of fish seed fluctuated. Production increased 16.6
percent from 2008-2009 (683.000 million) to 2010-2011 (796.253 million), then,
slightly decreased to around 5.8 percent in 2011-2012 (750.370 million) and increased
5.2 percent in 2012-2013 (789.620 million), before sharply decreasing to about 30.4
percent in 2013-2014 (549.380 million) (Figure 8).
Table 20: Production volume of freshwater fish fingerlings from DOF hatcheries
in Myanmar, 2013-2014
Region/state Location Production (million)
Yangon Region
Hlaw Kar Mingalardone Township, Yangon 59.33
Twante Twante 44.55
Lay Bau Kkan Thingankyun Township 37.70
Subtotal 141.58
Bago Region
Bago (Kali) Bago Township 35.61
Thanappin Thanappin 15.16
Oakpho Oakpho 22.34
Subtotal 73.11
Mandalay Region
Pathein Gyi 79.27
MYANMAR: National Action Plan for Agriculture (NAPA)
Working Paper 4: Small-scale fisheries and aquaculture capture, production and management
33
Myit Thar Kueme Township 58.21
Natyekan Amayapuya Township 36.55
Matayar Matayar 12.42
Subtotal 186.45
Nay Pyi Taw Region
Pyinmanar Pyinmanar 19.72
Subtotal 19.72
Ayeyarwaddy Region
Pathein Pathein 19.10
Talotehla Talotehla, Maubin Township 13.40
Hinthada Hinthada 13.05
Pantanaw Pantanaw 19.37
Aung hate 14.36
Subtotal 79.28
Magway Region
Taung dwin gyi Magway 3.67
Pwint Phyu 3.72
Subtotal 7.39
Kachin State
Waing-maw Kachin State 5.74
Bamaw Bamaw 5.71
Subtotal 11.45
Sagaing Region
Shwe Bo Shwe Bo Township 6.59
Yay Oo Yay Oo Township 9.53
Htee Chaint 5.57
Subtotal 21.69
Mon State
Thahtone Thahtone Township 3.14
Subtotal 3.14
Shan State
Nyaung Shwe Nyaung Shwe Township 3.13
Subtotal 3.13
Kayin State
Pha aan Pha-aan Township 2.44
Subtotal 2.44
Total 549.38
Source: Department of Fisheries (2014).
MYANMAR: National Action Plan for Agriculture (NAPA)
Working Paper 4: Small-scale fisheries and aquaculture capture, production and management
34
Table 21: Species of freshwater fish produced from the DOF hatcheries in Myanmar,
2013-2014
Common name Scientific name Production (million)
Rohu Labeo rohita 382.97
Common carp Cyprinus carpio 41.91
Grass carp Ctenopharyngodon idella 5.60
Catla Catla catla 7.060
Tilapia Tilapia spp. 13.51
Silver carp Hypophthalmichthys molitrix 5.53
Big head Aristichthys nobilis 2.79
Striped catfish Pangasius sutchi 7.11
Mrigal carp Cirrhinus mrigala 2.85
Freshwater pomfret Pirictus spp. 5.57
Thai silver carp Barbonymus gonionotus 73.40
Scorpion catfish Heteropneustcs fossilis 0.10
Inle carp Cyprinus intha 0.35
Sultan fish Leptobarbus hoevenii 0.06
Streaked prochilod Prochilodus lineatus 0.57
Total 549.38
Source: Department of Fisheries (2014).
Figure 8: Trends of production of freshwater fish fingerlings from DOF hatcheries in
Myanmar
Source: Department of Fisheries (2014).
683.000
736.760
796.253
750.370 789.620
549.380
0.000
100.000
200.000
300.000
400.000
500.000
600.000
700.000
800.000
900.000
2008-2009 2009-2010 2010-2011 2011-2012 2012-2013 2013-2014
Pro
du
ctio
n (
mil
lio
n)
Year
MYANMAR: National Action Plan for Agriculture (NAPA)
Working Paper 4: Small-scale fisheries and aquaculture capture, production and management
35
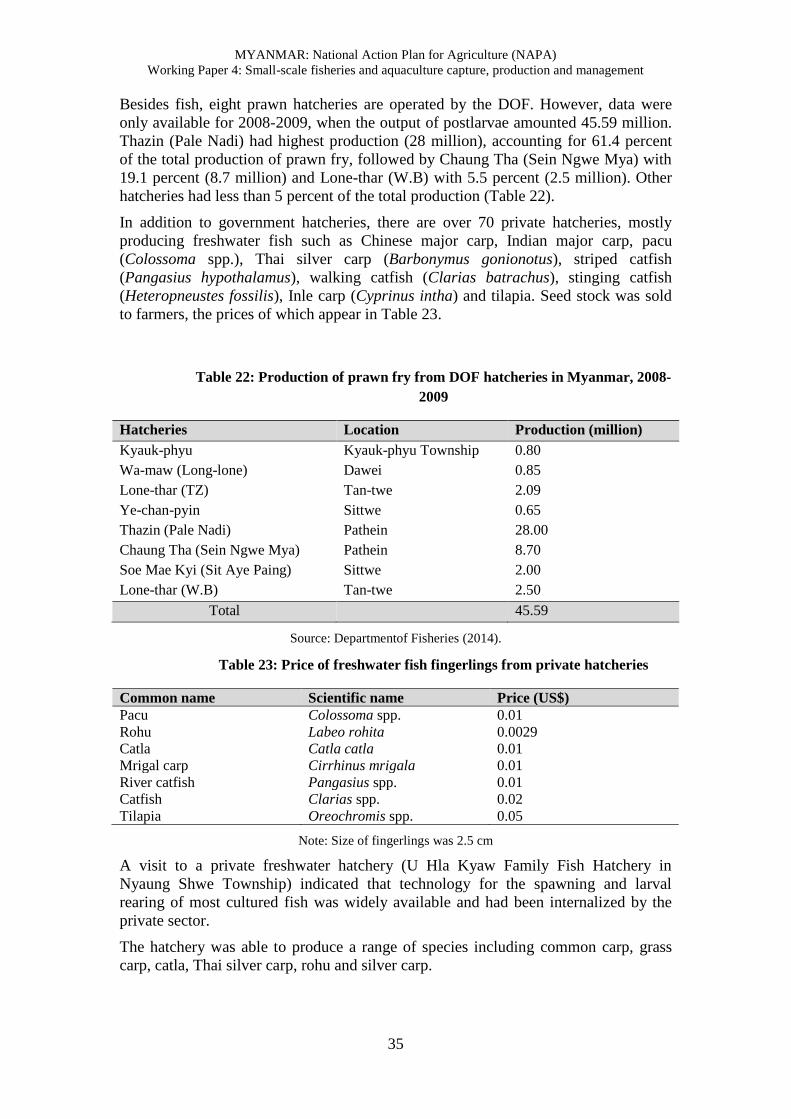
Besides fish, eight prawn hatcheries are operated by the DOF. However, data were
only available for 2008-2009, when the output of postlarvae amounted 45.59 million.
Thazin (Pale Nadi) had highest production (28 million), accounting for 61.4 percent
of the total production of prawn fry, followed by Chaung Tha (Sein Ngwe Mya) with
19.1 percent (8.7 million) and Lone-thar (W.B) with 5.5 percent (2.5 million). Other
hatcheries had less than 5 percent of the total production (Table 22).
In addition to government hatcheries, there are over 70 private hatcheries, mostly
producing freshwater fish such as Chinese major carp, Indian major carp, pacu
(Colossoma spp.), Thai silver carp (Barbonymus gonionotus), striped catfish
(Pangasius hypothalamus), walking catfish (Clarias batrachus), stinging catfish
(Heteropneustes fossilis), Inle carp (Cyprinus intha) and tilapia. Seed stock was sold
to farmers, the prices of which appear in Table 23.
Table 22: Production of prawn fry from DOF hatcheries in Myanmar, 2008-
2009
Hatcheries Location Production (million)
Kyauk-phyu Kyauk-phyu Township 0.80
Wa-maw (Long-lone) Dawei 0.85
Lone-thar (TZ) Tan-twe 2.09
Ye-chan-pyin Sittwe 0.65
Thazin (Pale Nadi) Pathein 28.00
Chaung Tha (Sein Ngwe Mya) Pathein 8.70
Soe Mae Kyi (Sit Aye Paing) Sittwe 2.00
Lone-thar (W.B) Tan-twe 2.50
Total 45.59
Source: Departmentof Fisheries (2014).
Table 23: Price of freshwater fish fingerlings from private hatcheries
Common name Scientific name Price (US$)
Pacu Colossoma spp. 0.01
Rohu Labeo rohita 0.0029
Catla Catla catla 0.01
Mrigal carp Cirrhinus mrigala 0.01
River catfish Pangasius spp. 0.01
Catfish Clarias spp. 0.02
Tilapia Oreochromis spp. 0.05
Note: Size of fingerlings was 2.5 cm
A visit to a private freshwater hatchery (U Hla Kyaw Family Fish Hatchery in
Nyaung Shwe Township) indicated that technology for the spawning and larval
rearing of most cultured fish was widely available and had been internalized by the
private sector.
The hatchery was able to produce a range of species including common carp, grass
carp, catla, Thai silver carp, rohu and silver carp.
MYANMAR: National Action Plan for Agriculture (NAPA)
Working Paper 4: Small-scale fisheries and aquaculture capture, production and management
36
The annual production of four-day hatchlings and fingerlings amounted to 100 million
and 10 million respectively. About 50 percent of the total production of fingerlings
was marketed locally, while the rest was sold at an outside area of the township.
4.2. Brackishwater aquaculture
Brackishwater pond culture
The culture of tiger shrimp (Penaeus monodon) commenced in 1975 using trapping
ponds in Rakhine State particularly in the northerrn part of its coast. Natural
postlarvae of Penaeus monodon were diverted into coastal ponds during high tides
through sluice gates, allowed to grow naturally and harvested, together with the adults
that were also trapped, using bag nets. Production ranged from 0.6-5.0 kg/ha.
However, of late, semi-intensive and intensive shrimp farming has been actively
encouraged. In 2013-2014, three types of shrimp farming were found in the country,
i.e. semi-intensive shrimp, extensive plus shrimp ponds and extensive or traditional
shrimp ponds.
The total culture area amounted to approximately 92 427.7 ha, with 1 774.58 ha of
semi-intensive shrimp ponds, 37 155.33 ha of extensive plus shrimp ponds and 53
496.37 ha of extensive shrimp ponds.
In Yangon, most shrimp culture is concentrated at Kyauk Tan, with a productive area
of 3 885.06 ha (54 ponds) and Kwun Chan Kone, (1 476.04 ha). In Rakhine, most fish
culture is concentrated in Sittwe and Kyauk Phyu districts. The biggest areas in Myay
Pon, Maung Taw and Amm cover approximately 5 614.61 ha, 5 805.22 ha and 4
264.58 ha respectively. The ponds are stocked with hatchery-bred postlarvae, with
stocking densities ranging from 25-45 fry/m2 and production generally averaging 4-5
tonnes/ha. The farmed shrimp is largely exported.
Overall, in 2013-2014, total brackishwater production in the country amounted to 57
046.12 tonnes, with an estimated valued of US$462.64 million (based on the price of
P. monodon in Rakhine, i.e. US$8.11/kg).
Brackishwater cage culture
Brackishwater cage culture in Myanmar has not developed well compared to fish and
shrimp faming in ponds. During the site survey, only one marine cage farm operated
by Mr Maung Gye was visited in Yae Pyit Awe village, about 1.5 hours from Myiek.
Of the 50 cages at the farm, only 20 are active.
The main species reared were Malabar grouper (Epinephelus malabaricus), giant
grouper (Epinephelus spp.), John’s snapper (Lutjanus johnii) and seabass (Lates
calcarifer). The fish were fed with chopped trash fish. Most of the fish were marketed
chilled in Yangon.
Crab farming
Crab farming in Myanmar is focused on the production of the soft-shelled orange mud
crab, Scylla olivacea. Two farms were visited, one in Myiek and the other, much
larger, in Kyauk Tan. The farms visited grew them in small cages holding individual
crabs. The cages were located within large ponds ranging from 0.5-1 ha in size. The
Myiek farm had 160 000 cages in operation, while the larger farm operated over a
million cages.
MYANMAR: National Action Plan for Agriculture (NAPA)
Working Paper 4: Small-scale fisheries and aquaculture capture, production and management
37
Crab seed is collected from the wild by fishers and sold to the crab farms at US$2.03-
2.90/kg. The crabs are fed with chopped trash fish. Feeding is on alternate days. The
culture period is around 30-45 days with a marketable size of 100-120 g/crab. Crabs
are harvested after moulting and before the exoskeleton can harden. They are then
cleaned, frozen and exported, mainly to Hong Kong S.A.R., Japan and Taiwan P.O.C.
Production from the smaller farm in 2014 (May to September) amounted to 20 tonnes
with wholesale value of US$171 000. The farm in Kyauk Tan (Crab World) is a major
operation, and complies with Hazard Analysis and Critical Control Points (HACCP)
protocols.
These farms do not purchase seed stock of less than 80 g, enabling adults to spawn
(the crabs becoming mature at a carapace width of 90 mm) before being harvested for
culture.
The employment potential of these farms is significant. The Myeik farm alone hired
26 workers, while the Kyauk Tan Aquaculture Zone had 250 workers. The Myeik
farm reported that current seed supply exceeds demand, i.e. the number of farms in
the region cannot absorb all the crablets that are caught for farming.
The surplus, estimated at 16 million annually, was ostensibly shipped to the adjoining
Thai province of Rayong, which also supports significant crab farming operations.
Though the seed supply suggests that the industry can be expanded significantly in the
Myeik region, appropriate land resources are not easily available to support expansion
of tproductive assets.
Seaweed farming
Seaweed farming is undertaken on a pilot basis in a site located five to six hours
offshore from Myiek. The project was started in 2003. About 30 farmers are involved
in this activity. Farming employs long lines with the rope and seed provided by the
company. The main commodity produced is Eucheuma cottonii and production of the
dried seaweed is approximately 300 tonnes/year. However, the culture of this species
has been affected by predation by the Streaked spine oot (Siganus javus). The
viability of the operation is thus still uncertain.
Seed production
Shrimp: In 2003, there were 26 hatcheries with an output of 190 million postlarvae
operated in the country (Department of Fisheries 2014). However, no recent figures
on the number of hatcheries are available. Broodstock (spawners) mainly came from
the Bay of Bengal and the Andaman Sea.
Marine fish: While the production of freshwater fish and shrimp seed is not a
problem, the production of marine fish seed remains so. Despite considerable scope
for the development of marine finfish farming, both in cages and in ponds, the
absence of adequate infrastructure and investment in marine seed production appears
to be a significant constraint to the growth of the industry.
Only one hatchery for seabass (Lates calcarifer) was visited during the field study.
The KMK SeaBass Hatchery, which is located in Yae Myit Gyi village covers an area
of 3.64 ha. In 2013, annual production amounted to 1 million fingerlings and sold at
US$0.29 per fingerling fed on pellets and US$0.19 per fingerling fed on trash fish.
About 20 percent of total production was marketed locally, while the rest was sold in
Yangon Region.
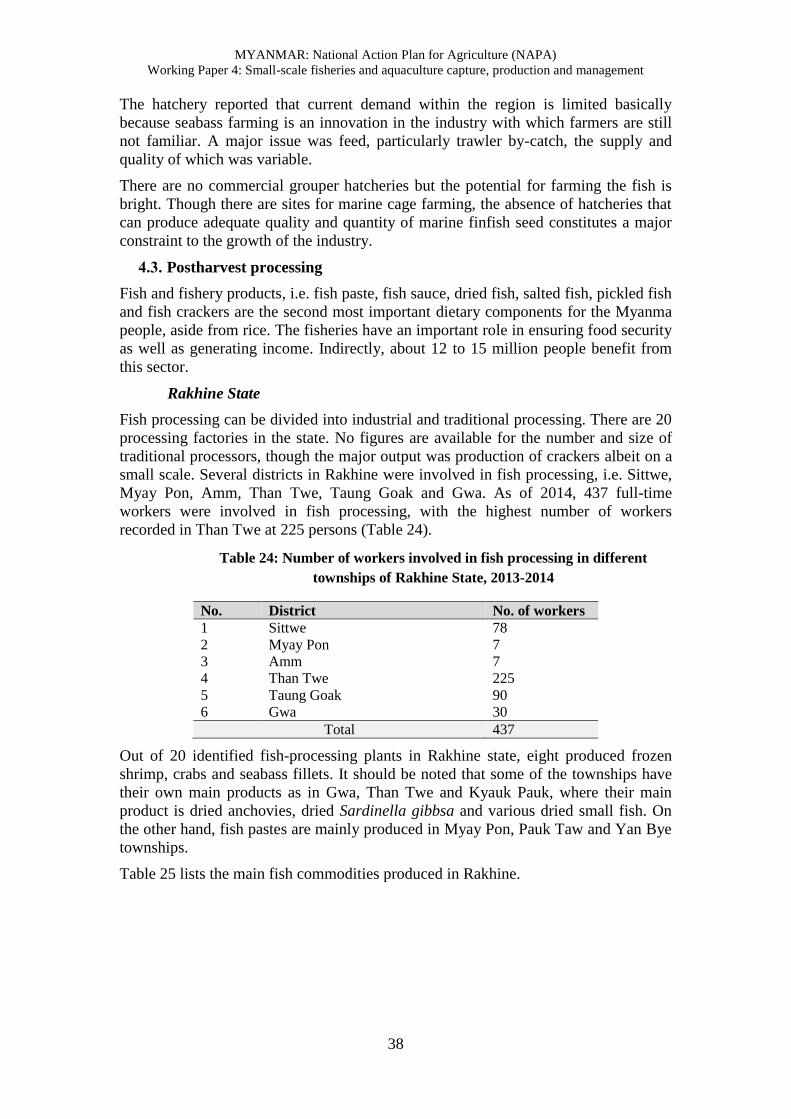
MYANMAR: National Action Plan for Agriculture (NAPA)
Working Paper 4: Small-scale fisheries and aquaculture capture, production and management
38
The hatchery reported that current demand within the region is limited basically
because seabass farming is an innovation in the industry with which farmers are still
not familiar. A major issue was feed, particularly trawler by-catch, the supply and
quality of which was variable.
There are no commercial grouper hatcheries but the potential for farming the fish is
bright. Though there are sites for marine cage farming, the absence of hatcheries that
can produce adequate quality and quantity of marine finfish seed constitutes a major
constraint to the growth of the industry.
4.3. Postharvest processing
Fish and fishery products, i.e. fish paste, fish sauce, dried fish, salted fish, pickled fish
and fish crackers are the second most important dietary components for the Myanma
people, aside from rice. The fisheries have an important role in ensuring food security
as well as generating income. Indirectly, about 12 to 15 million people benefit from
this sector.
Rakhine State
Fish processing can be divided into industrial and traditional processing. There are 20
processing factories in the state. No figures are available for the number and size of
traditional processors, though the major output was production of crackers albeit on a
small scale. Several districts in Rakhine were involved in fish processing, i.e. Sittwe,
Myay Pon, Amm, Than Twe, Taung Goak and Gwa. As of 2014, 437 full-time
workers were involved in fish processing, with the highest number of workers
recorded in Than Twe at 225 persons (Table 24).
Table 24: Number of workers involved in fish processing in different
townships of Rakhine State, 2013-2014
No. District No. of workers
1 Sittwe 78
2 Myay Pon 7
3 Amm 7
4 Than Twe 225
5 Taung Goak 90
6 Gwa 30
Total 437
Out of 20 identified fish-processing plants in Rakhine state, eight produced frozen
shrimp, crabs and seabass fillets. It should be noted that some of the townships have
their own main products as in Gwa, Than Twe and Kyauk Pauk, where their main
product is dried anchovies, dried Sardinella gibbsa and various dried small fish. On
the other hand, fish pastes are mainly produced in Myay Pon, Pauk Taw and Yan Bye
townships.
Table 25 lists the main fish commodities produced in Rakhine.
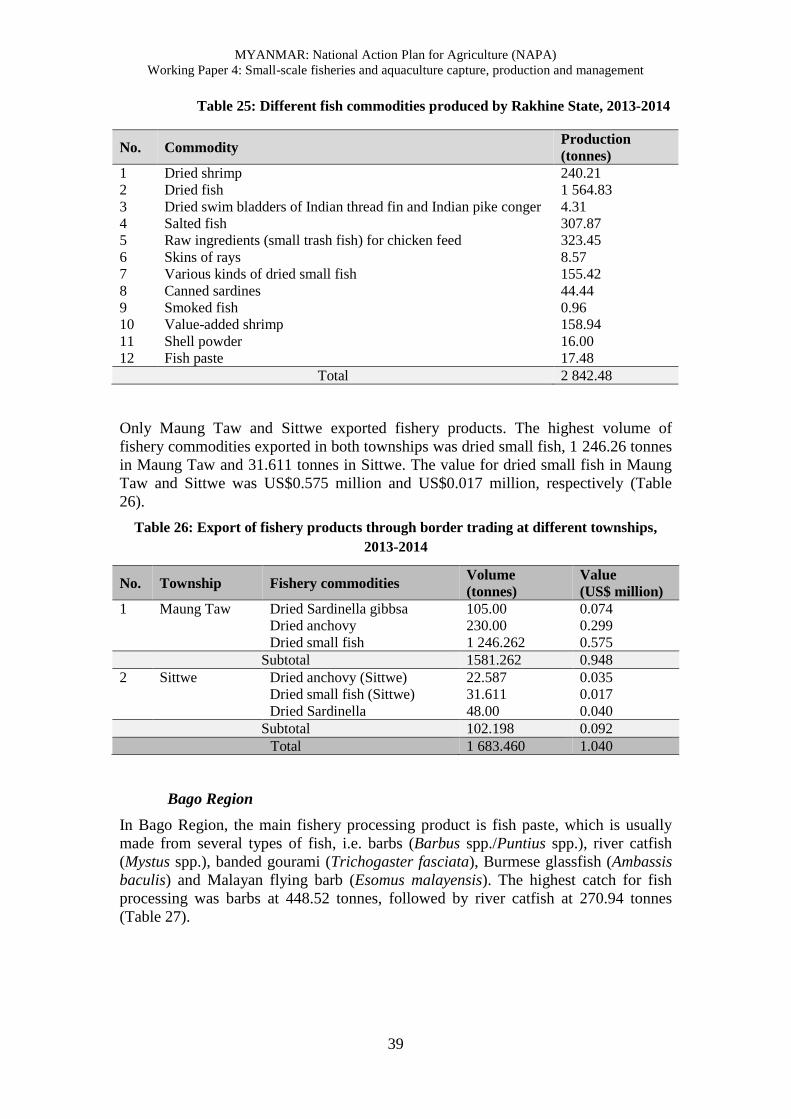
MYANMAR: National Action Plan for Agriculture (NAPA)
Working Paper 4: Small-scale fisheries and aquaculture capture, production and management
39
Table 25: Different fish commodities produced by Rakhine State, 2013-2014
No. Commodity Production
(tonnes)
1 Dried shrimp 240.21
2 Dried fish 1 564.83
3 Dried swim bladders of Indian thread fin and Indian pike conger 4.31
4 Salted fish 307.87
5 Raw ingredients (small trash fish) for chicken feed 323.45
6 Skins of rays 8.57
7 Various kinds of dried small fish 155.42
8 Canned sardines 44.44
9 Smoked fish 0.96
10 Value-added shrimp 158.94
11 Shell powder 16.00
12 Fish paste 17.48
Total 2 842.48
Only Maung Taw and Sittwe exported fishery products. The highest volume of
fishery commodities exported in both townships was dried small fish, 1 246.26 tonnes
in Maung Taw and 31.611 tonnes in Sittwe. The value for dried small fish in Maung
Taw and Sittwe was US$0.575 million and US$0.017 million, respectively (Table
26).
Table 26: Export of fishery products through border trading at different townships,
2013-2014
No. Township Fishery commodities Volume
(tonnes)
Value
(US$ million)
1 Maung Taw Dried Sardinella gibbsa
Dried anchovy
Dried small fish
105.00
230.00
1 246.262
0.074
0.299
0.575
Subtotal 1581.262 0.948
2 Sittwe Dried anchovy (Sittwe)
Dried small fish (Sittwe)
Dried Sardinella
22.587
31.611
48.00
0.035
0.017
0.040
Subtotal 102.198 0.092
Total 1 683.460 1.040
Bago Region
In Bago Region, the main fishery processing product is fish paste, which is usually
made from several types of fish, i.e. barbs (Barbus spp./Puntius spp.), river catfish
(Mystus spp.), banded gourami (Trichogaster fasciata), Burmese glassfish (Ambassis
baculis) and Malayan flying barb (Esomus malayensis). The highest catch for fish
processing was barbs at 448.52 tonnes, followed by river catfish at 270.94 tonnes
(Table 27).
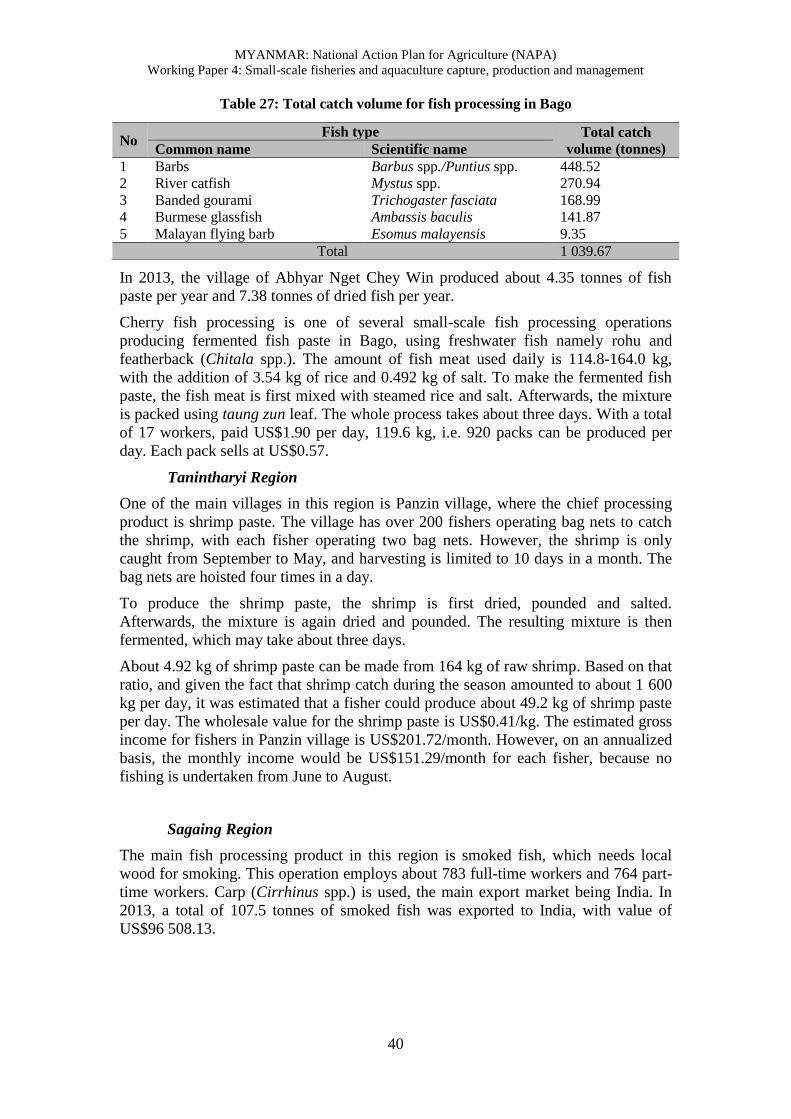
MYANMAR: National Action Plan for Agriculture (NAPA)
Working Paper 4: Small-scale fisheries and aquaculture capture, production and management
40
Table 27: Total catch volume for fish processing in Bago
In 2013, the village of Abhyar Nget Chey Win produced about 4.35 tonnes of fish
paste per year and 7.38 tonnes of dried fish per year.
Cherry fish processing is one of several small-scale fish processing operations
producing fermented fish paste in Bago, using freshwater fish namely rohu and
featherback (Chitala spp.). The amount of fish meat used daily is 114.8-164.0 kg,
with the addition of 3.54 kg of rice and 0.492 kg of salt. To make the fermented fish
paste, the fish meat is first mixed with steamed rice and salt. Afterwards, the mixture
is packed using taung zun leaf. The whole process takes about three days. With a total
of 17 workers, paid US$1.90 per day, 119.6 kg, i.e. 920 packs can be produced per
day. Each pack sells at US$0.57.
Tanintharyi Region
One of the main villages in this region is Panzin village, where the chief processing
product is shrimp paste. The village has over 200 fishers operating bag nets to catch
the shrimp, with each fisher operating two bag nets. However, the shrimp is only
caught from September to May, and harvesting is limited to 10 days in a month. The
bag nets are hoisted four times in a day.
To produce the shrimp paste, the shrimp is first dried, pounded and salted.
Afterwards, the mixture is again dried and pounded. The resulting mixture is then
fermented, which may take about three days.
About 4.92 kg of shrimp paste can be made from 164 kg of raw shrimp. Based on that
ratio, and given the fact that shrimp catch during the season amounted to about 1 600
kg per day, it was estimated that a fisher could produce about 49.2 kg of shrimp paste
per day. The wholesale value for the shrimp paste is US$0.41/kg. The estimated gross
income for fishers in Panzin village is US$201.72/month. However, on an annualized
basis, the monthly income would be US$151.29/month for each fisher, because no
fishing is undertaken from June to August.
Sagaing Region
The main fish processing product in this region is smoked fish, which needs local
wood for smoking. This operation employs about 783 full-time workers and 764 part-
time workers. Carp (Cirrhinus spp.) is used, the main export market being India. In
2013, a total of 107.5 tonnes of smoked fish was exported to India, with value of
US$96 508.13.
No Fish type Total catch
volume (tonnes) Common name Scientific name
1 Barbs Barbus spp./Puntius spp. 448.52
2 River catfish Mystus spp. 270.94
3 Banded gourami Trichogaster fasciata 168.99
4 Burmese glassfish Ambassis baculis 141.87
5 Malayan flying barb Esomus malayensis 9.35
Total 1 039.67
MYANMAR: National Action Plan for Agriculture (NAPA)
Working Paper 4: Small-scale fisheries and aquaculture capture, production and management
41
Yangon Region
One hundred and twelve small and medium enterprises conduct fish-based product
processing in the Yangon region. The main products include fish paste, dried fish and
fish sauce.
Markets
Domestic demand
Based on per capita consumption of 56 kg and a population of 51.4 million, total
domestic demand for fish is estimated to amount to over 2.856 million tonnes. Fish in
Myanmar is consumed fresh-chilled. Frozen fish are exported and domestic demand
for frozen fish is non-existent. There is also no demand for live fish and the potential
of value enhancement of farmed fish through such a conduit does not appear to be a
tenable proposition.
Export
The fisheries sector is one of the most important sectors in Myanmar; it contributes
significantly to the national GDP and is an important source of export earnings.
Normally, the products are exported alive, fresh frozen or chilled and processed. In
2013-2014, the total export for the fisheries sector amounted to 345 267.36 tonnes,
valued at US$536.27 million.
Shrimp was the top export commodity in the 1990s, generating up to 50 percent of
earnings. However, shrimp exports have declined since 2001, contributing only 4.8
percent of the total fisheries export volume in 2013. However, the volume of fish
exported has been steadily increasing. In 2013-2014, fish exports amounted to 237
142.31 tonnes or 68.7 percent of the total fishery exports in country. In terms of value,
about 50 percent of the overall export value is earned from fish exports.
In 2013-2014, the top exported fish was rohu, which amounted to 68 314.72 tonnes,
valued at US$69.05 million. Second was live eel (Anguilla spp.) at 12 631.09 tonnes,
valued at US$52.21 million.
Other top exported products include orange mud crab (Scyllaolivacea), Hilsa shad
(Tenualosa ilisha), pink shrimp (Metapanaeus intermedius), tiger prawn (Penaeus
monodon), ribbonfish (Trichiurus savala), dried prawn and white shrimp. A more
comprehensive treatment of the country’s export trends is provided in Annex 2.
There is a potential for export of live grouper. Discussions with Malaysian
wholesalers who deal with the Hong Kong S.A.R. live fish trade indicate that the well
boats that currently pick up farmed groupers from Peninsular Malaysia and Southern
Thailand would be willing to come to areas such as Myiek for the same purpose.
However, current volumes of the live grouper produced in Myanmar are too small to
justify this. Live groupers are produced from cage culture operations. Large clusters
of cage farms operating along the Malaysian and Thai coasts justify the collection and
transport of marine fish to Hong Kong S.A.R. However, the absence of such an
industry in Myanmar is a major impediment to sustaining the requisite volumes.
MYANMAR: National Action Plan for Agriculture (NAPA)
Working Paper 4: Small-scale fisheries and aquaculture capture, production and management
42
5. INSTITUTIONAL ENVIRONMENT
5.1. Management institutions
The primary management institution for fisheries in Myanmar is the DOF. Located
with the Ministry of Fisheries, Livestock and Rural Development, the DOF has
several divisions and subdivisions that enable it to cover a wide range of fisheries and
aquaculture activity in the country (Figure 9). The DOF also has field offices at
region/state, district and township levels. Related departments include the Department
of Agriculture under the Ministry of Agriculture and Marine Protected Areas and
Riverine Protected Areas, under the Department of Environmental Conservation
under the Ministry of Forestry and Environmental Conservation.
5.2. Human resource development
Human resource development infrastructure is extremely limited. Apparently there is
a fisheries training school established with Japanese funding, but it does not appear to
play a prominent role in generating capacity, either within the industry or
management agencies. There are also no structured extension training programmes for
field staff and farmers. Training for farmers and hatchery operators is carried out on-
site on an ad hoc basis, as for example at the U Hla Kyaw Family Fish Hatchery in
Nyaung Shwe. A building for extension training is located in Pyapontownship,
Pathein, but not fully utilized for that purpose.
No university-level courses on fisheries are offered in the country. However, two
universities offer a marine science programme. Neither was visited or evaluated
during the course of the study visit.
5.3. Policy
The DOF has an organizational vision: to ensure a sufficiency of fish supplies not
only for the present population but also for future generations by conserving fisheries
resources and using sustainable fisheries at all times.
The department also has a number of mission statements concerning:
Conservation and rehabilitation of fishery resources;
Promotion of fishery research and surveys;
Collection and compilation of fishery statistics and information;
Extension services; and
Supervision of fishery sectors.
However, there is no policy document that sets specific goals, directions and time
frames. There is also no overarching policy document that can tie agriculture,
environmental conservation and livestock together with land use into a comprehensive
and cohesive platform that would enable the sector to operate in an integrated manner
with other sectors.
In addition, both the vision and mission statements have a clear capture fisheries slant
and do not address aquaculture in specific terms. The vision statement emphasizes the
strategic value of fish as a commodity but does not appear to focus on its potential to
be a major force for rural empowerment and economic development in its own right.
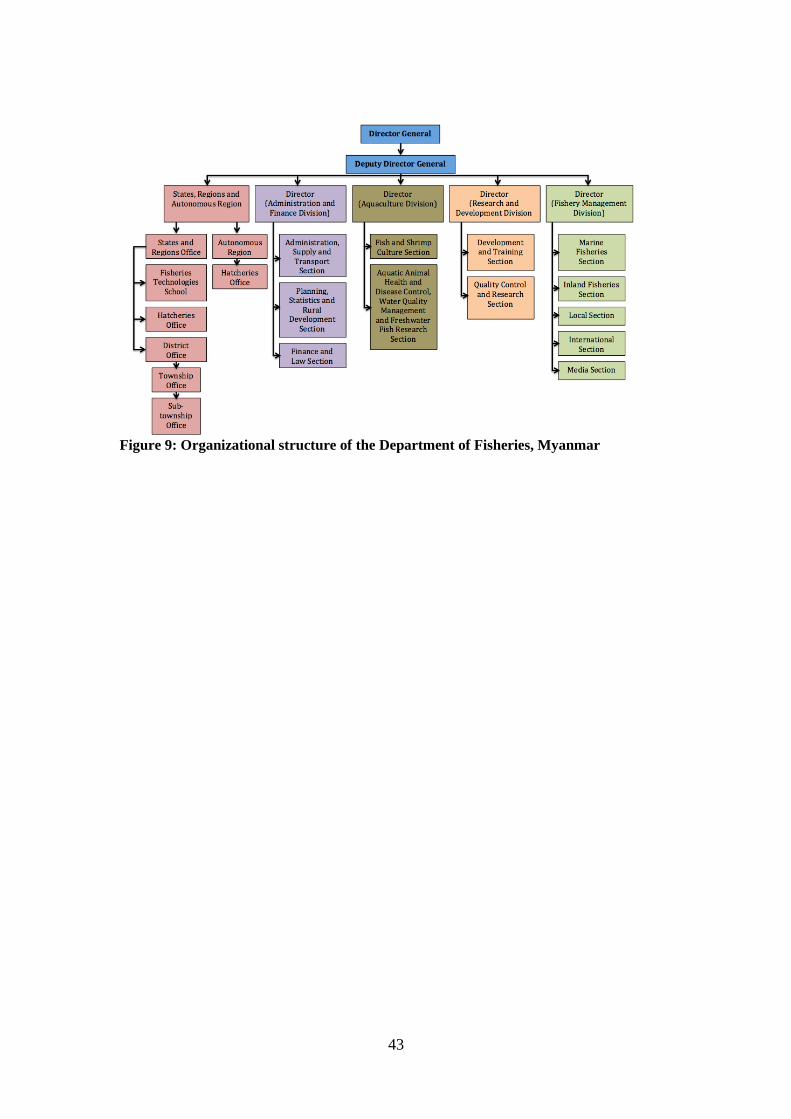
43
Figure 9: Organizational structure of the Department of Fisheries, Myanmar
44
6. KEY OPPORTUNITIES AND CONSTRAINTS TO SECTOR
DEVELOPMENT
6.1. Marine fisheries
The current resource outlook for the offshore marine fisheries industry is bleak.
Resource data strongly suggest that the current fishing effort far exceeds resource
capacity to support it, much less any expansion in fleet numbers or gear size. This is
particularly relevant for demersal stocks, though pelagics have also shown declines.
The opportunities for expansion of the offshore fisheries sector by increasing the
fishing effort are, therefore, nonexistent. On the contrary, it appears that the fleet will
need to be downsized if offshore stocks are to be conserved. This is likely to have a
major impact on coastal communities because most crews on offshore vessels come
from these communities.
The resource situation for inshore fisheries is unclear due to lack of data. However,
given the open entry nature of the inshore fishery sector, coupled with their reported
encroachment by offshore boats, it is likely that the resource health of fisheries stocks
is equally poor, if not worse. This is underscored by the near universal feedback of the
fishers interviewed of serious declines in catch, especially over the last few years.
Another issue is related to the absence of appropriate handling and storage
infrastructure at smaller landing points or even the availability of ice at a reasonable
cost. Though some of the villages visited were close enough to ice plants and cold
rooms to enable preservation of catches, others were not. The inability to preserve the
catch, at least until it reaches the market, impacts on poorer communities in two ways:
The catch quality deteriorates during catching and transportation to the
marketing centres, drawing a much lower wholesale or retail price.
Not being able to sustain the quality of their catch, the fishers become
vulnerable to buyers and traders and are forced to accept the prices they are
offered.
In either instance, the returns to the fishers are considerably diminished from what
they could otherwise expect.
6.2. Inland fisheries
As with the inshore fisheries, inland fisheries share a dearth of resource data that
could form the basis of an assessment of the industry’s current sustainability. Again,
the feedback from inland fishers almost universal speaks of declines in catch. The
absence of a national water quality monitoring programme means that it is impossible
to establish if the declines can be attributed to degradation in water quality alone.
Interviews from a number of sites also indicate uncontrolled expansion of the fishing
effort and illegal fishing during closed seasons to be responsible. On the whole, the
outlook for reducing poverty through expansion of the current inland fisheries
industry does not appear to be a feasible.
Another issue is related to the absence of appropriate handling and storage
infrastructure, e.g. for marine inshore fisheries. As pointed out above, this is a serious
shortcoming for fishers’ income.
45
6.3. Leasable fisheries
The leasable fishery, as a managed fishery, has a more substantial chance of
sustainability and possible expansion. However, even here there are issues that need
to be addressed. Primary among them appears to be the growing presence of exotics,
specifically tilapia, in the catch profile and the concomitant decline in the landings of
indigenous fish. The issue has as stark profile where economic returns are concerned.
Tilapia is considered a low-value fish (prices range from US$0.29-0.58/kg) as
opposed to indigenous fish such as featherback (Chitala spp./Notopterus spp.) (about
US$2.32/kg) and giant catfish (Wallago sp.) (US$2.90/kg). While most
concessionaires are reasonably well off, the fishing communities that also use these
waters live on a marginal economy and would be seriously impacted by the decline in
landed value.
Related to this would be the conflict in land use that could be a central cause of the
declines in indigenous fish.
While the dual use of land resources optimizes overall food output, it brings with it
consequences arising from the use of pesticides and fertilizers. Stopping paddy
planting in the leasable fisheries is not an option because it compromises the interests
of rice farmers who are often the poorer members of the agricultural community. The
fact remains that there is a need to see the issue in policy terms, and evolve production
strategies for both fisheries and agriculture that are mutually compatible.
6.4. Aquaculture
The potential for aquaculture to spearhead rural economic transformation is
significant. However, two key issues need to be given due attention.
Freshwater seed supply is not a constraint because the private sector has
largely mastered technologies relating to the induced spawning of most farmed
cyprinids. However, government hatcheries produce the same species as
private operatives, thus competing with private hatcheries, and discouraging
private sector investment in private hatcheries. Though the establishment of
the government hatcheries at the early phase of the industry was justified,
there needs to be an exit plan where the private sector takes over from their
original mandate.
There is no production of many indigenous fish such as featherback and giant
catfish, among others. These fish have been the primary victims of habitat
degradation in open waters and in the leasable fisheries. Their natural stocks
would benefit from stocking programmes. In addition, carnivorous fish would
predate on tilapia fry (at least until they developed their dorsal spines) and thus
keep their population in check.
A phased approach that advocates for government hatcheries to move out of the
production of carp and other fish that can be produced by private hatcheries should
thus be taken. The current hatcheries should then focus on developing mass
production techniques for other indigenous fish or use them for training and
demonstration.
Marine
Though the marine shrimp seed industry appears to be largely adequate, the
production of marine finfish seed remains a major constraint to the development of
the sector.
46
In particular, the production of grouper seed is a crucial requirement if Myanmar is to
get into the live fish trade. At present, this is a trial stage and there are no dedicated
production facilities for grouper seed. Much of the technology for the production of
farmed groupers such as tiger grouper (Epinephelus suillus) has been largely
established and importing and applying it should be a major government initiative.
Where crab seed is concerned, current supply exceed demand and the surplus is
exported. This suggests that there is scope for the crab grow-out industry in the
country to be expanded.
Feed
The second most important issue related to aquaculture development is feed.
Formulated manufactured feeds are relatively expensive and justified only when
output prices can match feed input costs. The issues for the freshwater and marine
industries are again different.
Freshwater
Formulated feeds are not employed to any great extent in freshwater aquaculture. The
approach has been to focus on the use of raw feeds such as rice bran and peanut meal.
Though the cost of these raw feeds is cheaper than manufactured feeds, variable
supply and quality are major constraints.
It is also not tenable to keep considering these items inexpensive. Even now, data
from interviews indicate that the demand from China has pushed up prices for
groundnut meal and the price of rice bran is increasing due to demand from the
poultry industry.
The use of raw feeds is not a major constraint with main cultured freshwater fish,
most of which are planktivorous or opportunistic omnivores. Even if the raw feed that
is supplied is inadequate in terms of nutrient quality, the balance can be derived from
the environment.
This is the basis of the integrated farming strategy that many farms have chosen to
pursue. However, it is pertinent to note that poultry use a considerable number of
vaccines, especially for controlling Newcastle Disease, and these can find their way
into the water. The pharmacokinetics of these vaccines and drugs in an aquatic
environment has not been fully studied. In addition, the potential transference of avian
pathogens such as Streptococcus agalactiae needs to be monitored.
The organoleptic qualities of fish raised under these conditions can also be a major
marketing issue. The fish may have a ‘muddy smell’ characteristic of 2-
methylisoborneol residues from cyanobacteria.
Marine
Feeding of shrimp would inevitably involve formulated feeds. Charoen Pokhpand, the
world’s largest shrimp feed manufacturer, maintains an office in Yangon to facilitate
imports of formulated feeds from Thailand.
However, where crab and marine fish are concerned, reliance can be expected to
continue on trawler by-catch.
However, the same commodity is being used for fish meal as well as raw material by
small-scale village processors, which means, in the long term, that marine aquaculture
47
(including crabs) would be facing the same constraints as the freshwater aquaculture
industry with respect to raw feeds.
6.5. Departmental emphasis on management
The survey revealed that the historical emphasis of the DOF has been on management
rather than on development. This is evidenced by:
The absence of a comprehensive extension system that involves extension
training institutes and an extension human resource network that can act as a
bridge to the production operatives with respect to technology and technical
support. A major infrastructure development in this regard would be
technology demonstration centres that can enable verification and localization
of newer technologies and their demonstration to target groups. The
establishment of such centres need not been a major investment. The DOF
does maintain a network of hatcheries for the production of seed stock, some
of which can be redeveloped and expanded as technology extension centres.
Current DOF hatcheries, however, do not appear to have been designed to
undertake this function.
Related to this is the absence of field laboratories that can provide on-site data
on water quality that would enable farmers to make production management
decisions on an objective and scientific basis. The DOF’s current laboratory is
used to assess food safety of exported products but there are no laboratories
that assess the quality of the production environment itself. A key constraint to
this is the continuing perception that the cost of such a system of laboratories
would involve a high establishment and operational cost. However, the fact
remains that it would be crucial infrastructure for the continued development
of fisheries. While it is true that there is a cost involved in providing such
services, it is important to note that there are various commercially available
portable laboratories that can be purchased as single kits. Also, farmers
(especially larger ones) can be made to pay for some of the analyses
undertaken on their behalf. An indication of this was the willingness of
leasable farmers to subsidize the establishment of a laboratory in Nyaungdon
Township.
The absence of a section that calls for the development of the postharvest
processing of fish and fish products. While the DOF is involved in this area,
its primary focus appears to be on inspectorate and food safety, rather than
product development or upgrading of traditional skills and human resources.
The latter become important if the country wishes to be seen simply as a
producer of raw (fish) material or of value-added products. It is pertinent to
note that many processed fish products from Myanmar have a demand
overseas and have potential for expansion.
The DOF does not have a research and development institute that can focus on
development of applied technologies for the fisheries industry. The absence of
this basic infrastructure is in intense contrast to other countries in the region,
which have invested significantly in fisheries R&D infrastructure. The
Fisheries Research Institute of Malaysia, for instance, has seven campuses
scattered through the country, while Indonesia maintains an even more
48
impressive network of research institutes throughout its archipelago.4 The
establishment of a dedicated research centre that looks at fisheries and
aquaculture technologies and their application in a local setting is a crucial
inadequacy that needs to be addressed even in the short term.
Statistics and data collection on the industry are poor and limited in scope. The
annual fisheries statistics provide volume data but not values, a major
shortcoming that inhibits the ability of the sector to assert its economic
importance. There is no dedicated data collection and management system
within the DOF to provide accurate and actionable data on the various
subsectors within the industry, so appropriate management measures cannot be
taken. A case in point is the landing from leasable fisheries as reported in
Mandalay and Sagaing, where indigenous fish landings continue to seriously
decline, while landings of tilapia expand. On the whole, landing volumes
appear to be sustainable, but in reality there is a decline in value as indigenous
fish can be sold for 3 000-5 000 kyat/kg as opposed to tilapia at 500-1 000/kg.
There is thus a net loss in value (hence income), notwithstanding catch rates
remaining the same. Accurate data are necessary to capture trends so the DOF
can be more mindful of the impact of resource shifts on the socio-economics
of its stakeholders.
6.6. Institutional fragmentation
Institutional fragmentation occurs at Union and state/regional levels.
Union level
While the Department of Fisheries and Livestock comes under the Ministry of
Fisheries, Livestock and Rural Development, agriculture comes under the Ministry of
Agriculture. However, where the farming communities are concerned, fisheries,
livestock and agriculture are undertaken together, often sharing resources such as land
and water. Their allocation within separate ministries means that conflicts in
production strategies are much more difficult to resolve.
Another area of potential contention is with the Ministry of Forestry and
Environmental Protection, which undertakes the establishment of protected areas and
environmental protection of inland waters. Both of these aspects are crucial in
ensuring the sustainability of marine and inland fisheries. All parties need to take
possession of such efforts. For instance, the Ministry of Forestry and Environmental
Protection has developed a lake management plan for Inle Lake. While the draft copy
of the plan was sent to the DOF for comment, its formulation did not involve the
Department or the stakeholders it manages. The tendency was to see it as a plan of the
Environmental Protection Department rather than one that was collectively owned by
all relevant stakeholders.
Institutional fragmentation is commonplace in all bureaucracies where there are
administrative turf boundaries drawn to enable investment in specific disciplines and
avoid overlaps in jurisdiction.
However, an overall policy framework that stitches these several initiatives together
into a cohesive whole is missing. Each ministry appears to be approaching their
4http://earth01.net/RGDudley/PDF/MASECSTU.pdf
49
respective areas of administration in isolation of each other. While we were assured
that there was substantial consultation between the various ministries, feedback from
the survey indicated that Union ministry consensus has not filtered to the field offices
that are the frontline in fisheries development.
Regional/state level
The current political environment calls for a federal system where:
a. All inland fisheries are state/regional matters; and
b. Inshore marine fisheries of up to 10 nautical miles are state/regional
matters.
This means that various state and regional administrations would need to develop the
capacity to manage the resources within their ambit. The absence of a national policy
framework means that states/regions need to manage on their own, while their
capacities are at a nascent level of development. There is an immediate and crucial
need to develop such capacities so that the management of the sector is not
constrained by the fragmentation of human resources once available for the collective
management of the fisheries sector.
6.7. Human resource development infrastructure is poor
A key requirement for fisheries development is human resource development (HRD).
However, this is poor in Myanmar. There are no dedicated institutes to meet HRD
requirements for the industry. These need to be established at three levels.
Producer level
The producer level is the working personnel that are directly or indirectly involved
with producing, catching or processing fishery resources. This may include fishers,
aquaculturists, traders, processing workers and other involved parties. These people
are the backbone of the fisheries sector. At the producer level, most of the training
should be focused on working etiquette as they are in contact with the resources, and
there is a crucial need to make the sector sustainable. On the other hand, they should
also be trained in improving the overall production of the fishery sector, such as catch
planning as well as conserving and rehabilitating fisheries resources.
Management level
Management-level training would need to be directed at those responsible for
supervising and developing the fisheries sectors.; This may include the fisheries
management agencies and the private sector. The main management level focus
would be the improvement of the fishery sector and creating sustainable resources for
the overall benefit of the nation. Management-level training would need to address the
exigencies of producers and emphasize their role in the transfer of information
between the producer and the academic level.
Academic level
The academic level is responsible for research and development, which could greatly
benefit the fisheries sector. This includes universities, government agencies and also
the private sector. The academic level should provide training and knowledge,
especially for the producer and management levels. This will greatly improve the
fisheries sector when the added knowledge has been implemented. An example is
universities providing related courses for the producer level and also continuously
50
researching for better fishing methods and farming techniques, which may later be
implemented by the managing agencies.
6.8. Extension training
There needs to be a network of extension training institutes to transfer technology in
relation to the targets the Union government has set for the sector. Again, investment
need not be as extensive as it sounds. Extension training centres can be very easily
merged with demonstration and technology extension centres.
6.9. Fisheries academies
There is a need for separate institutions that train managers, both within the DOF, but
also within other relevant agencies, on capacities for management. The focus would
be on producing professional managers for the DOF, but also to expose officials from
other agencies to fishery and habitat issues so that they can better grasp them in the
context of their functions. They would include officials from the Ministry of Forestry
and Environmental Protection and Ministry of Agriculture.
6.10. Academia
It is a huge shortcoming that Myanmar does not have a university-level institute for
fisheries and aquaculture. Though the University of Yangon did have a fisheries
programme in the 1960s, this was discontinued. A dedicated faculty or institute of
higher learning that generates the professional workforce that both management
agencies and the private sector require is a crucial precursor for the continued
development of the industry. In addition, such an institute would be able to
undertaken basic research on fisheries issues. While a departmental R&D institute
would necessarily look at applied research, it would be within the purview of a
university research institute to look at basic research that has more of a long-term
reach.
6.11 Policy
The present policy framework governing Myanma fisheries is weak and fragmented.
There is a material policy endorsed at the Union level. While the DOF has a 30-year
fisheries development plan, there is no overarching policy that ties the various actors
involved in the development of the sector into a cohesive engine of growth. In
particular, the absence of such an overarching policy framework would lead to
conflicts in land use, a lack of adequate protection for fishery ecosystems, lack of
emphasis in processing industries, and poor coverage of extension services,
particularly for poorer farmers and fishers. Undoubtedly, these same troubles would
face those who undertake agriculture and livestock production.
The reality is that these are the same stakeholders and their interests at the farm level
tend to merge. Towards this end, there is a need for a strong policy framework that
advocates for the following overarching goals:
To ensure that the food security needs of Myanmar are never compromised.
To ensure an integrated approach is taken for development of:
Land use that emphasizes production of food crops (fish/livestock/plant
crops) in consonance with sustainable use of land and water resources;

51
Water use that emphasizes sustainable extraction of living aquatic
resources;
The emphasis on the ecosystem-based approach to land and water
resource management; and
Optimal returns from fish production through reduction of postharvest
losses and increased value adding.
52
7. KEY OPPORTUNITIES FOR SECTOR DEVELOPMENT
From the data obtained during the course of the study, it is manifestly clear that any
approach to poverty eradication that focuses on increasing fishing effort is totally
untenable. This includes any measures to increase fishing populations or increase
fishing fleets. Improvements in gear technology need to focus on catch selectivity,
ease of use and durability of material rather than on fishing efficiency while fishing
boat designs need to concentrate on fuel, rather than catch, efficiency.
However, there are many areas where enhanced management or technological focus
would leapfrog current levels of activity. These are listed below.
7.1. Empowerment of fishing communities in marine protected areas (MPAs)
The declaration of MPAs with their concomitant no-take zones is often met with
strong objections from communities that have traditionally fished in these waters. The
problem has been caused largely by the inability to integrate the relevant fishing
communities in the management plans of the MPAs and to derive economic benefits
from them. MPAs attract visitors, especially recreational divers, scientists and
holidaymakers. Fishers from these communities can be retrained to provide boating
and guide services and hospitality services such as homestays and restaurants to these
visitors. The added benefit of such an approach is that, cognizant of the value of the
habitats being protected to their own economic health, fishers will also act as
observers against poaching, illegal intrusion and illegal, unreported and unregulated
(IUU) activities.
At present, there two major MPAs in the country, i.e. the Lampi Island Marine Park in
the Myeik archipelago, while a second one, the Mainmahla Marine Park in Bogalay
Township is under planning. Both come under the Ministry of Environmental
Conservation, and while the involvement of the DOF has been solicited, there appears
to be no concerted effort at the ground level to engage with the fishing communities
as part of a major initiative to provide employment and increase incomes.
A more structured programme is required, and again, this needs to come as part of a
concerted policy framework that sees MPAs not simply as protected areas, but also
sustainable development zones.
7.2. Reduction of postharvest spoilage
The use of ice among smaller communities, both in coastal and inland areas, as well
as leasable fisheries and aquaculture operators would go a long way in reducing
wastage and improving the marketability of catches or crops. A major limitation in
this regard is the unreliability or absence of electricity in many of these communities
or farms. However, there are commercially-available diesel-powered chest freezers
that may be useful in this regard.
A chest freezer can produce 72 1.5-kg blocks in an eight-hour day. Though it may be
too costly for individual farmers to procure, it can be purchased and operated on a
cooperative basis.
7.3. Expansion of pond culture
There is huge potential for the expansion of pond fish culture in community ponds
and homestead pond-based integrated farming with livestock, horticulture, etc.
However, current land policies appear to prevent conversion of rice fields to fish
53
farming, not withstanding the fact that economic returns from aquaculture appear to
be far more attractive than paddy.
Again, this appears to be anoutcome of a fragmented policy environment where crop
production (specifically, paddy) is prioritized over fish production, to the ultimate
detriment of the farmers involved. Pond production of fish can be expanded
considerably if conversion of land from paddy planting to fish farming is not
restricted in any way.
7.4. Expansion of freshwater cage culture
Though pond-based aquaculture is an established activity in the country, there are
considerable opportunities to expand current production by use of other systems such
as cages and pens. Among the potentials observed in the course of this study it was
observed that:
Fixed cage culture can be operated in the communities of Inle Lake as a means
of supplementing incomes of fishers. The cages can be located immediately
next to their individual dwellings. The key feature of this system is its low cost
and low labour input. The fishers, who go out fishing for up to nine hours a
day, need not divert time for operating the cages. The proximity of the cages
to their houses means that women in the individual household can manage
them. The farming of omnivorous carp means that kitchen waste, currently
disposed directly into lake, can be ground and fed to the cultured fish.
Currently, a pilot project is being implemented in Pao Pah village, but given
the fact that there is a shortfall in supply of fish to local markets, there is
considerable scope for the expansion of the activity.
Pen and fixed cages can be operated in many leasable fisheries’ concessions.
The employment of these systems in those sections of the concession where
there is sufficient standing water even during the dry season would enable
additional output from the same waterbody. More important, it would enable
specific species of fish (particularly indigenous fish) to be grown to larger
sizes, when they fetch a higher price. It is clear though, that not all leasable
fisheries’ concessions can support aquaculture along these lines because there
is a considerable variation in their morphology and water supply patterns.
Nonetheless, it can be expected that most would have some capacity to so, and
this can translate into significant production volumes.
7.5. Development of rice field aquaculture
Rice field fisheries have had a longstanding history throughout the rice-growing
regions in Asia. Rice field aquaculture, the deliberate stocking and harvesting of fish
from rice fields, however, is comparatively recent and has been pursued both for rural
economic empowerment and food production in countries such as Indonesia and the
Philippines. Given the fact that there are over 8 million ha under rice cultivation, rice
field aquaculture has considerable potential.
It is outside the scope of this document to address the technical and infrastructure
issues relating to the development of the activity. However, with cage and pen culture
in leasable fisheries, it is likely that the activity can only be undertaken in specific
areas, particularly where water supply is not a major limitation. However, rice field
fisheries (i.e. the capture of wild fish that accidentally enter the rice field
environment) was observed in at least one village in Kyau Tan, where the main catch
was sea bass (Lates calcarifer). With appropriate infrastructure, the activity could be
54
expanded to become more productive to support the fishing populations in the
surrounding villages.
7.6. Expansion of crab farming
There have been a number of initiatives in marine and brackishwater aquaculture in
Myanmar, but to date it appears that only crab farming has established itself as a
major industry. Anecdotal information suggests that crab seed in the Myeik area is in
surplus of productive capacity. If that is the case, then investment in crab farms
should be encouraged. The employment potential of these farms is considerable and
can potentially dent rural unemployment and underemployment in the region.
7.7. Expansion of seaweed farming
Though seaweed farming has been undertaken at a pilot stage off Myeik, the results
are still unclear. Seaweed farming has been a boon for the coastal communities in
many countries including the Philippines, Indonesia and Malaysia. Seaweed farming
offers a rare opportunity of using the sea for the production of an industrial crop, and
is broadly consistent with the lifestyles and working environment of fishing
communities. The pilot seaweed farm was not visited during the course of this study
visit.
However, the feedback obtained indicated that long-line culture was being employed
and predation by siganids was undermining production. The same problem beset the
Malaysian industry until basket cultivation was introduced. The baskets, made out
netting material and steel frames (bamboo would work as well), provided a physical
barrier that protected the crop and enabled a higher output for the fishers that, even in
the short term, compensated for the cost of the baskets. It is pertinent to point out that
while seaweed culture was introduced in Malaysia only in the early 1990s (Ahemad et
al. 2006), production reached 269 431 tonnes by 2013, and involved 1 063 fishers
(Department of Fisheries, Malaysia 2014).
7.8. Development of cage culture for the live fish trade
The Myanma coast has numerous lagoons and islands that are ideal for marine cage
farming. Some of this potential has been ill-explored, particularly in Rakhine State,
where security concerns are major constraints. However, the potential for
development in Myeik is promising for the following reasons.
There are over 70 islands in the Myeik archipelago that provide
numerous sites for floating cage culture. Many of these sites are fringed
by fishing villages that extend into the water thus enabling each
household to operate cages in the proximity of their dwellings. It is
estimated that there are over 2 000 dwellings in the Myeik archipelago
that do this.
Myeik Township is the base for a large offshore trawler fleet. Trawler
by-catch that is otherwise discarded can be used as feed for the fish that
is reared.
Well boats, that collect live fish for sale primarily for the Hong Kong
S.A.R. market, are ready to come to the Myeik area if there is sufficient
supply to justify their presence. These boats now service cage culture
clusters off the West Coast of Peninsular Malaysia and southern
Thailand.

55
The major constraint to developing the industry is the lack of seed stock. Hatchery-
produced grouper fingerlings, particularly of the tiger grouper (Epinephelus suillus),
Malabar grouper (E. malabaricus) and greasy grouper (E. tauvina) are available from
Malaysian, Thai and Indonesian hatcheries.
However, current air links to Myeik are only from Yangon. Fingerlings imported from
these countries must be doublehandled at Yangon before reaching Myeik, a process
that takes too long for the fingerlings to remain healthy, while adding to the cost at the
same time.
The solution is for the government to either establish a grouper hatchery or facilitate
private sector investment into one. Government intervention is essential because there
is very little demand at present, and private investors would be averse to putting in
their money in the absence of guarantees that the cage culture in the area will be
developed. At present, there is only one operator of a cage farm, located in Yae Pyit
Awe, about 1.5 hours from Myeit. The farm operates at less than half its capacity
because of the lack of seed stock.
7.9. Development and expansion of the fish-based processing subsector
Myanmar has a rich tradition of processing fish and fish products, utilizing a wide
range of fish species in the production of dried fish, fish pastes, fish sauces and
crackers. Industrial processing appears to be less diverse, concentration being more on
the production of frozen fish for the export market. Currently, there is only one
factory in the country manufacturing fish fillets for export, among over 160 other
plants. The level of value added is, thus, very limited.
However, the fact that there is vast variety of traditional fish products means that there
is scope for the development of value-added fishery products on a broader scale than
just freezing and chilling. The owner of Cherry Fish in Bago, despite being a small-
scale producer of fish paste, spoke of her products being sold as far as Singapore. The
perception that traditional fish products only have a local demand is an erroneous
assumption.
There are also product opportunities that can be developed based on existing
resources. The snakehead, Channa striata, for instance, is a fish that is widely in
demand in the Malaysia/Indonesia/Singapore markets as a medicinal product to
enhance dermal wound healing, to reduce postoperative pain and discomfort and in
the treatment of skin conditions such as eczema. Antiseptic creams and tonics
containing extracts of the fish are widely sold in these country. However, these
countries lack the supply of the fish that Myanmar enjoys.
Despite these several opportunities, there is no dedicated government support for
expanding and growing the industry. The focus of official intervention so far has been
to provide inspectorate services in food safety. While these are no doubt crucial, they
do not promote the development and growth of the industry, only its compliance with
food safety standards. A more proactive focus on the processing industry as an
integral part of the fisheries subsector, including data on its economic impact and
values, would enable the processing sector to be a major game changer in its own
right.
56
8. POVERTY AND INCLUSIVENESS
8.1. Background to rural poverty in Myanmar
The poverty rate in Myanmar is at 37.5 percent (World Bank 2014) based on a caloric
threshold of 2 300 calories per adult equivalent per day as the anchor of the poverty
line. The poor in Myanmar are predominantly in rural areas (76 percent) and they rely
on agriculture (including fisheries and aquaculture) and casual employment for their
livelihoods.
Poverty also varies across different regions of Myanmar. In terms of agro-ecological
zones, the highest poverty rate is in coastal zones (53.1 percent), while the lowest is in
the Dry Zone (29.5 percent). The hills and Delta zones are at 40.9 and 40.4 percent,
respectively. In terms of regions and states, the highest poverty rate is in Rakhine
Region (coastal zone) at 78 percent as well as in Chin State (hills zone), which
borders Bangladesh, at 71.5 percent. It is pertinent to note that most of those who
work in the fisheries subsector are within the coastal zone and probably make up the
bulk of the poor there.
8.2. Poverty in the fisheries sector
There are no detailed data on poverty levels within the fisheries sector. Inquiries with
several state fisheries’ directors indicated that such data were not available or there
was no awareness of such information. This strongly points to a situation where
poverty alleviation is not central to the development of the fisheries subsector.
Leaving aside illness or accidents requiring hospitalization or long-term medical
attention, which can, and probably has, pushed many households into poverty,
declining resources is the major reason affecting those who depend on fisheries for
income. Declines in income were observed in almost all the sites that were visited.
The declines in stocks of high-value fish species in inland fishing areas as well in the
leasable fisheries translates into a greater number of hours spent fishing, lower
income, or both. In other instances, it has forced fishers to seek employment outside
their villages, as reported in Chaung Wa village.
The situation is compounded by fluctuations in the prices of basic needs (especially
food). Increases in food prices and other basic commodities make it harder for the
poor to meet their basic needs while the concurrent decline in income levels leads to
straightened circumstances.
Poverty alleviation is rarely the outcome of a single action, but comes with
improvements in living standards, education and health. Beyond ensuring income
stability for workers within the sector, it is also crucial that rural citizenry are
provided basic necessities such education, health, electricity, water, communications
and so forth.
A crucial strategy in poverty alleviation would be to facilitate capital flows into the
fisheries sector. Towards this end, measures to improve the investment climate for the
private sector would be instrumental in reducing employment and increasing incomes
in rural areas.
57
9. RECOMMENDED AREAS OF INTERVENTION
The current level of investments in policy, institutional and physical infrastructure in
Myanmar’s fisheries sector remains highly inconsistent with its estimated output
value of over US$16 billion. Output value is only one of several factors that dictate a
need for greater emphasis on the sector. Foremost would be the fact that fish is a
staple protein source for the country and should share centre stage with rice in
national food security strategies.
There is significant potential for expansion of the sector, both in volume and value
terms, through introduction of new technologies (such as in seaweed farming),
reduction of postharvest losses, optimization of aquaculture resources through
opening up land and expanding cage and pen culture, and development of fish-based
products (such as Channa-based health foods). Actualizing these potentials would
demand, however, that government agencies currently mandated to be sector stewards
shift emphasis from their monitoring and inspectorate roles to more focus on
development.
Towards this end, the interventions listed below involve significant changes at policy
and institutional levels. These must remain precursors to any fundamental change that
the sector experiences.
9.1. Formulation of a national agriculture and food policy
There is an urgent need for a national agriculture and food policy that emphasizes
food security and environmental sustainability. The main goals of such a policy
framework would be to:
Set a cohesive platform for the sustainable development of agriculture,
fisheries and livestock on a sustainable and integrated basis for the nation as a
whole through facilitated access to land resources, technology, finance and
markets;
To ensure these sectors are developed and managed in consonance with the
need to ensure empowerment of poorer rural communities; and
To ensure private capital flows and complementary government investments,
into these sectors.
9.2. Establishment of a tertiary-level institution for fisheries
Education helps societies to grow, develop and plan for the future and help in the
battle against poverty, malnutrition and infant mortality in addition to promoting
literacy, innovation and sustainability. Capacity building is defined by UNESCO as a
“...continuing process of strengthening of abilities to perform core functions, solve
problems, define and achieve objectives, and understand and deal with development
needs”. In short, capacity development is not just about knowledge but how to use
knowledge to deal with challenges.
It is a matter of major importance to establish a tertiary-level institution for fisheries
in the country. Such an institution would be able to provide professional human
resources to undertake basic research in all facets of fisheries’ activities in the
country. The institution can take the form of a college or faculty within an existing
institution. In the fishery sector context, its mandate would be to plan, undertake, aid,
promote and coordinate education, research and extension for fishery science and
offer B.Sc., M.Sc. and Ph. D. degrees in the various disciplines concerned.
58
9.3. Establishment of a fisheries and aquaculture academy
There is also an urgent need to provide technical training to the staff of management
agencies with the various ministries on specific areas such as fish identification,
disease and health management, postharvest and processing techniques, new
technologies in aquaculture production and other areas. Towards this end, an
Academy of Fisheries and Aquaculture is recommended. Such an academy would
provide certificate-level training for existing and new staff within the DOF as well as
other departments whose functions cover activities within the sector.
9.4. Establishment of fisheries extension and vocational training institutes
The capacity building at this level is directed at producers. Producers are not
necessarily fishers or farmers, though these groups would be primary targets of the
institutes. They would also cover traders and staff of fish-processing establishments.
Training at this level would need to two points of focus:
Extension training would be directed at existing operatives within the sector.
Training would be necessarily short-term residential courses (a week at most) or even
nonresidential in situ training. Focus would be on strengthening skills among target
operatives so that they can undertake their particular activity more efficiently.
Towards this end, courses have to be very focused and clearly directed towards
achieving specific outcomes. For instance, in the case of fishers, the focus can be on
training them on maintenance of outboard engines so that they can reduce repair costs
and improve fuel efficiency, thus reducing their overall operational costs.
Vocational training would be for those who wish to acquire hands-on skills in
various aspects of fisheries. Vocational training is largely directed towards those who
are new to the industry, though there may be those who are sponsored by existing
operators. The training here would be longer (a month or more) depending on the type
of training and the level of skills desired.
9.5. Establishment of a fisheries and aquaculture reseach institute
It is pertinent to note that research and development (R&D) has been a major factor in
the growth of the fisheries and aquaculture industries in Thailand, the Philippines and
Indonesia. The absence of such an institute in Myanmar is a major shortcoming and
needs to be urgently addressed. Dedicated R&D institutes are a corollary to tertiary-
level research. While the latter focuses more on basic research, the Fisheries and
Aquaculture Reseach Institute would work on relating those findings with the
industry’s needs and exigencies. R&D is urgently required to bridge the technological
gaps that much of the fisheries industry in Myanmar faces and must be given the
urgent attention it demands.
9.6. Restructuring seed production infrastructure for the aquaculture
industry
Seed supply is crucial for aquaculture development. It is often forgotton that it was
only through mass production of seed that many cultured commodities were able to
grow from small-scale backyard activities to major industries in their own right.
9.7. Restructuring the functions of freshwater hatcheries
As the private sector has grasped and internalized the technologies relating to the
production of most Chinese and Indian major carps, government hatcheries should
withdraw on a phased basis from the activity and hand over the role to the private
59
sector. A limited number may need to remain in operation, only to cater for identified
poor farmers. The rest should focus on species of high value that current private
hatcheries are unable to produce. These would largely be high-value indigenous
species such as the giant catfish, featherback and others, whose populations in natural
waters appear to be declining. The seed production of these species can be used to
support their farming as well as to increase recruitment to natural stocks through
public stocking programmes.
9.8. Establishment of marine finfish hatcheries
The culture of marine finfish has huge potential in the country but has been seriously
constrained by the lack of seed stock. Investment in seed production infrastructure for
marine finfish seed, particularly for groupers, but also for other species, is central to
the ability of Myanmar to become a major player in the region marine aquaculture
sector.
9.9. Establishment of a network of aquaculture technology centres
The recommendation for the network of aquaculture technology centres is predicated
on two major requirements:
Technology verification and demonstration: The success of aquaculture
tends to relate to its ability to adapt to site-specific conditions. Thus
technologies developed at research levels must be verified in particular agro-
climatic environments and their use demonstrated to local operatives and
entrepreneurs interested in the particular technology.
Laboratory support: Fisheries operations need diagnostic services to
establish if their operations are run appropriately or otherwise. There is also a
need to establish the quality of the water they are abstracting for their
operations.
In both cases, the demand would be for a network of centres throught the country that
would reflect the agro-climatic zones, if not the regions and states.
9.10. Establishment of processing industry development within the DOF
There is a need to promote the fisheries processing industry as a major facet of
sectoral development.
9.11. Promotion of aquaculture optimization initatives
These have also been discussed earlier. They include:
Provision of greater access to land resources for aquaculture development; and
Promotion of systems such as cage and pen culture to enhance existing inland
water production.
9.12. Provide greater access to financial capital for the sector
This intervention needs to operate at two levels.
Small-scale and microfinancing need to support current small-scale
industries that need funds for replacing degraded productive assets
(nets, fishing lines, etc) or making small investments in upgrading
production (e.g. procuring a grinder for fish meat processing).
Financing for larger scale investors, either within the industry, or
intending to get into it.

60
Investment promotion to attract investors to bring capital into the
fisheries sector.
61
ANNEX 1: BIBLIOGRAPHY
Ahemad, S., Ismail, A. & Mohamamad Raduan, M.A. 2006. The seaweed industry
in Sabah, East Malaysia. Journal of Southeast Asian Studies, 11(1): 97-107.
Department of Fisheries. 2014. Fishery statistics 2014. Department of Fisheries,
Ministry of Livestock, Fisheries and Rural Development, The Republic of the Union
of Myanmar. 78p.
Department of Fisheries, Malaysia. 2014. Fishery statistics 2013. Department of
Fisheries, Ministry of Agriculture and Agro-based Industry Malaysia. 302p.
Food and Agriculture Organization of the United Nations (FAO). 2003. Myanmar
– mission report on inland aquaculture and fisheries.
Mine, S. 2014. Myanmar: current status of aquaculture in Myanmar. In International
workshop on resources enhancement and sustainable aquaculture practices in
Southeast Asia: Challenges in Responsible Production of Aquatic Species, pp. 28-29.
Philippines, SEAFDEC.
Soe, K.M. 2008. Trends of development of Myanmar fisheries: With references to
Japanese experiences. Institute of Developing Economies Japan External Trade
Organization. VRF Series No. 433. 69p.
Tun, M.T. 2014. Unpublished. The coastal resources management in Myanmar.
Department of Fisheries, Ministry of Livestock, Fisheries and Rural Development,
The Republic of the Union of Myanmar. 22p.
World Bank. 2014. Myanmar: ending poverty and boosting shared prosperity in a
time of transition. World Bank Group.
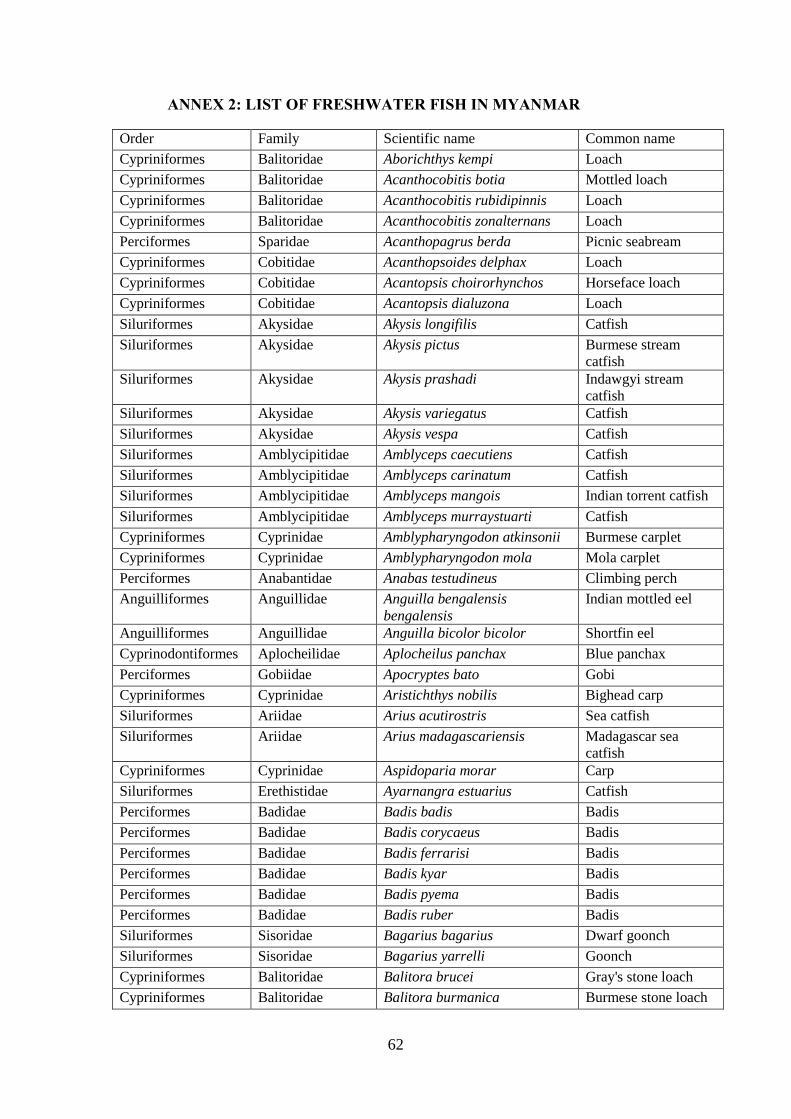
62
ANNEX 2: LIST OF FRESHWATER FISH IN MYANMAR
Order Family Scientific name Common name
Cypriniformes Balitoridae Aborichthys kempi Loach
Cypriniformes Balitoridae Acanthocobitis botia Mottled loach
Cypriniformes Balitoridae Acanthocobitis rubidipinnis Loach
Cypriniformes Balitoridae Acanthocobitis zonalternans Loach
Perciformes Sparidae Acanthopagrus berda Picnic seabream
Cypriniformes Cobitidae Acanthopsoides delphax Loach
Cypriniformes Cobitidae Acantopsis choirorhynchos Horseface loach
Cypriniformes Cobitidae Acantopsis dialuzona Loach
Siluriformes Akysidae Akysis longifilis Catfish
Siluriformes Akysidae Akysis pictus Burmese stream
catfish
Siluriformes Akysidae Akysis prashadi Indawgyi stream
catfish
Siluriformes Akysidae Akysis variegatus Catfish
Siluriformes Akysidae Akysis vespa Catfish
Siluriformes Amblycipitidae Amblyceps caecutiens Catfish
Siluriformes Amblycipitidae Amblyceps carinatum Catfish
Siluriformes Amblycipitidae Amblyceps mangois Indian torrent catfish
Siluriformes Amblycipitidae Amblyceps murraystuarti Catfish
Cypriniformes Cyprinidae Amblypharyngodon atkinsonii Burmese carplet
Cypriniformes Cyprinidae Amblypharyngodon mola Mola carplet
Perciformes Anabantidae Anabas testudineus Climbing perch
Anguilliformes Anguillidae Anguilla bengalensis
bengalensis
Indian mottled eel
Anguilliformes Anguillidae Anguilla bicolor bicolor Shortfin eel
Cyprinodontiformes Aplocheilidae Aplocheilus panchax Blue panchax
Perciformes Gobiidae Apocryptes bato Gobi
Cypriniformes Cyprinidae Aristichthys nobilis Bighead carp
Siluriformes Ariidae Arius acutirostris Sea catfish
Siluriformes Ariidae Arius madagascariensis Madagascar sea
catfish
Cypriniformes Cyprinidae Aspidoparia morar Carp
Siluriformes Erethistidae Ayarnangra estuarius Catfish
Perciformes Badidae Badis badis Badis
Perciformes Badidae Badis corycaeus Badis
Perciformes Badidae Badis ferrarisi Badis
Perciformes Badidae Badis kyar Badis
Perciformes Badidae Badis pyema Badis
Perciformes Badidae Badis ruber Badis
Siluriformes Sisoridae Bagarius bagarius Dwarf goonch
Siluriformes Sisoridae Bagarius yarrelli Goonch
Cypriniformes Balitoridae Balitora brucei Gray's stone loach
Cypriniformes Balitoridae Balitora burmanica Burmese stone loach
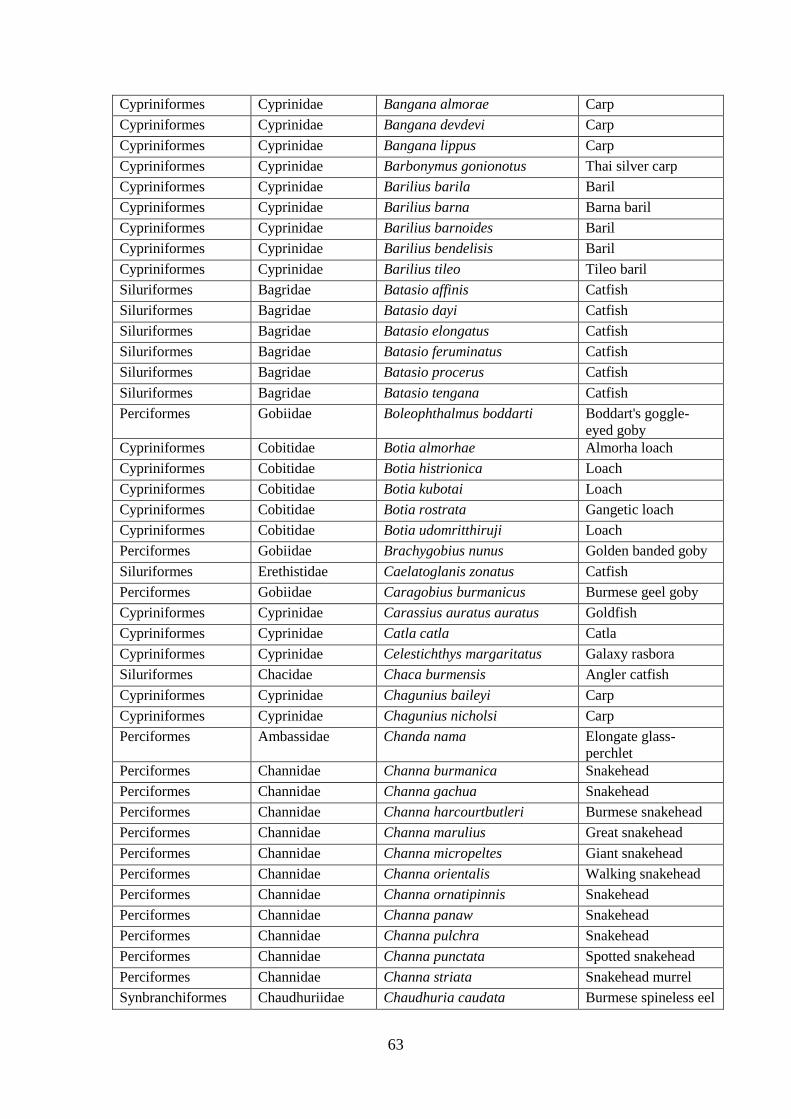
63
Cypriniformes Cyprinidae Bangana almorae Carp
Cypriniformes Cyprinidae Bangana devdevi Carp
Cypriniformes Cyprinidae Bangana lippus Carp
Cypriniformes Cyprinidae Barbonymus gonionotus Thai silver carp
Cypriniformes Cyprinidae Barilius barila Baril
Cypriniformes Cyprinidae Barilius barna Barna baril
Cypriniformes Cyprinidae Barilius barnoides Baril
Cypriniformes Cyprinidae Barilius bendelisis Baril
Cypriniformes Cyprinidae Barilius tileo Tileo baril
Siluriformes Bagridae Batasio affinis Catfish
Siluriformes Bagridae Batasio dayi Catfish
Siluriformes Bagridae Batasio elongatus Catfish
Siluriformes Bagridae Batasio feruminatus Catfish
Siluriformes Bagridae Batasio procerus Catfish
Siluriformes Bagridae Batasio tengana Catfish
Perciformes Gobiidae Boleophthalmus boddarti Boddart's goggle-
eyed goby
Cypriniformes Cobitidae Botia almorhae Almorha loach
Cypriniformes Cobitidae Botia histrionica Loach
Cypriniformes Cobitidae Botia kubotai Loach
Cypriniformes Cobitidae Botia rostrata Gangetic loach
Cypriniformes Cobitidae Botia udomritthiruji Loach
Perciformes Gobiidae Brachygobius nunus Golden banded goby
Siluriformes Erethistidae Caelatoglanis zonatus Catfish
Perciformes Gobiidae Caragobius burmanicus Burmese geel goby
Cypriniformes Cyprinidae Carassius auratus auratus Goldfish
Cypriniformes Cyprinidae Catla catla Catla
Cypriniformes Cyprinidae Celestichthys margaritatus Galaxy rasbora
Siluriformes Chacidae Chaca burmensis Angler catfish
Cypriniformes Cyprinidae Chagunius baileyi Carp
Cypriniformes Cyprinidae Chagunius nicholsi Carp
Perciformes Ambassidae Chanda nama Elongate glass-
perchlet
Perciformes Channidae Channa burmanica Snakehead
Perciformes Channidae Channa gachua Snakehead
Perciformes Channidae Channa harcourtbutleri Burmese snakehead
Perciformes Channidae Channa marulius Great snakehead
Perciformes Channidae Channa micropeltes Giant snakehead
Perciformes Channidae Channa orientalis Walking snakehead
Perciformes Channidae Channa ornatipinnis Snakehead
Perciformes Channidae Channa panaw Snakehead
Perciformes Channidae Channa pulchra Snakehead
Perciformes Channidae Channa punctata Spotted snakehead
Perciformes Channidae Channa striata Snakehead murrel
Synbranchiformes Chaudhuriidae Chaudhuria caudata Burmese spineless eel
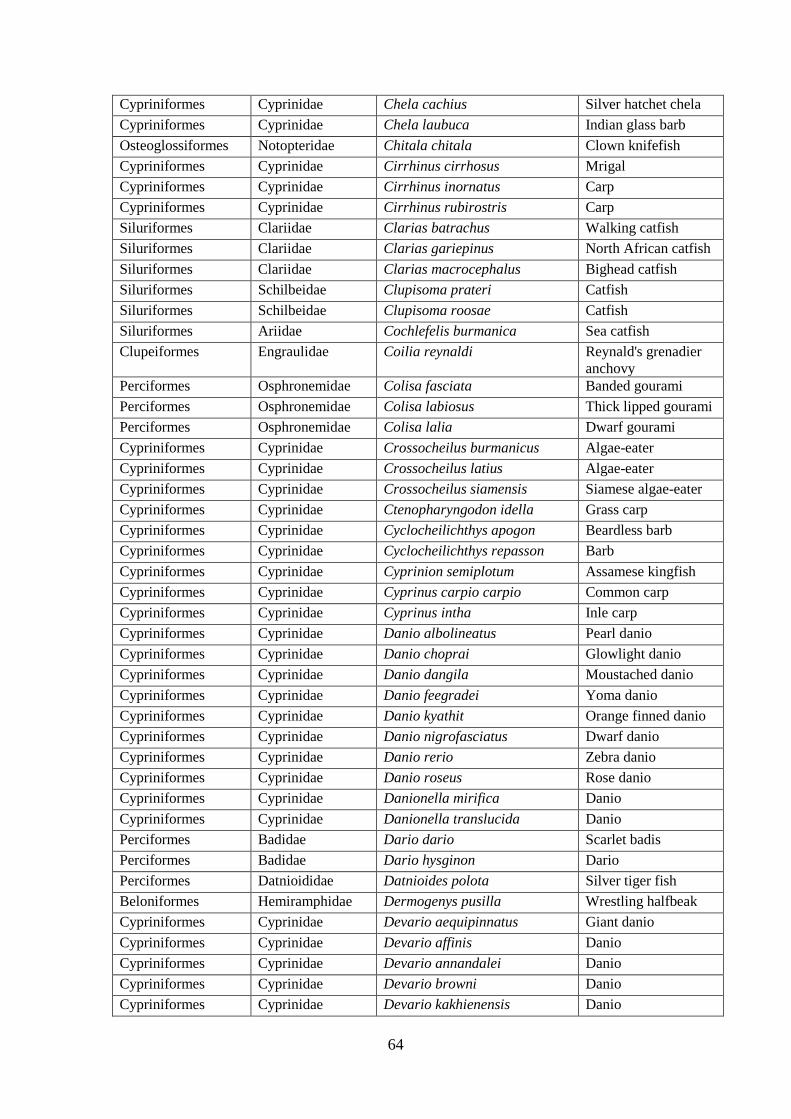
64
Cypriniformes Cyprinidae Chela cachius Silver hatchet chela
Cypriniformes Cyprinidae Chela laubuca Indian glass barb
Osteoglossiformes Notopteridae Chitala chitala Clown knifefish
Cypriniformes Cyprinidae Cirrhinus cirrhosus Mrigal
Cypriniformes Cyprinidae Cirrhinus inornatus Carp
Cypriniformes Cyprinidae Cirrhinus rubirostris Carp
Siluriformes Clariidae Clarias batrachus Walking catfish
Siluriformes Clariidae Clarias gariepinus North African catfish
Siluriformes Clariidae Clarias macrocephalus Bighead catfish
Siluriformes Schilbeidae Clupisoma prateri Catfish
Siluriformes Schilbeidae Clupisoma roosae Catfish
Siluriformes Ariidae Cochlefelis burmanica Sea catfish
Clupeiformes Engraulidae Coilia reynaldi Reynald's grenadier
anchovy
Perciformes Osphronemidae Colisa fasciata Banded gourami
Perciformes Osphronemidae Colisa labiosus Thick lipped gourami
Perciformes Osphronemidae Colisa lalia Dwarf gourami
Cypriniformes Cyprinidae Crossocheilus burmanicus Algae-eater
Cypriniformes Cyprinidae Crossocheilus latius Algae-eater
Cypriniformes Cyprinidae Crossocheilus siamensis Siamese algae-eater
Cypriniformes Cyprinidae Ctenopharyngodon idella Grass carp
Cypriniformes Cyprinidae Cyclocheilichthys apogon Beardless barb
Cypriniformes Cyprinidae Cyclocheilichthys repasson Barb
Cypriniformes Cyprinidae Cyprinion semiplotum Assamese kingfish
Cypriniformes Cyprinidae Cyprinus carpio carpio Common carp
Cypriniformes Cyprinidae Cyprinus intha Inle carp
Cypriniformes Cyprinidae Danio albolineatus Pearl danio
Cypriniformes Cyprinidae Danio choprai Glowlight danio
Cypriniformes Cyprinidae Danio dangila Moustached danio
Cypriniformes Cyprinidae Danio feegradei Yoma danio
Cypriniformes Cyprinidae Danio kyathit Orange finned danio
Cypriniformes Cyprinidae Danio nigrofasciatus Dwarf danio
Cypriniformes Cyprinidae Danio rerio Zebra danio
Cypriniformes Cyprinidae Danio roseus Rose danio
Cypriniformes Cyprinidae Danionella mirifica Danio
Cypriniformes Cyprinidae Danionella translucida Danio
Perciformes Badidae Dario dario Scarlet badis
Perciformes Badidae Dario hysginon Dario
Perciformes Datnioididae Datnioides polota Silver tiger fish
Beloniformes Hemiramphidae Dermogenys pusilla Wrestling halfbeak
Cypriniformes Cyprinidae Devario aequipinnatus Giant danio
Cypriniformes Cyprinidae Devario affinis Danio
Cypriniformes Cyprinidae Devario annandalei Danio
Cypriniformes Cyprinidae Devario browni Danio
Cypriniformes Cyprinidae Devario kakhienensis Danio
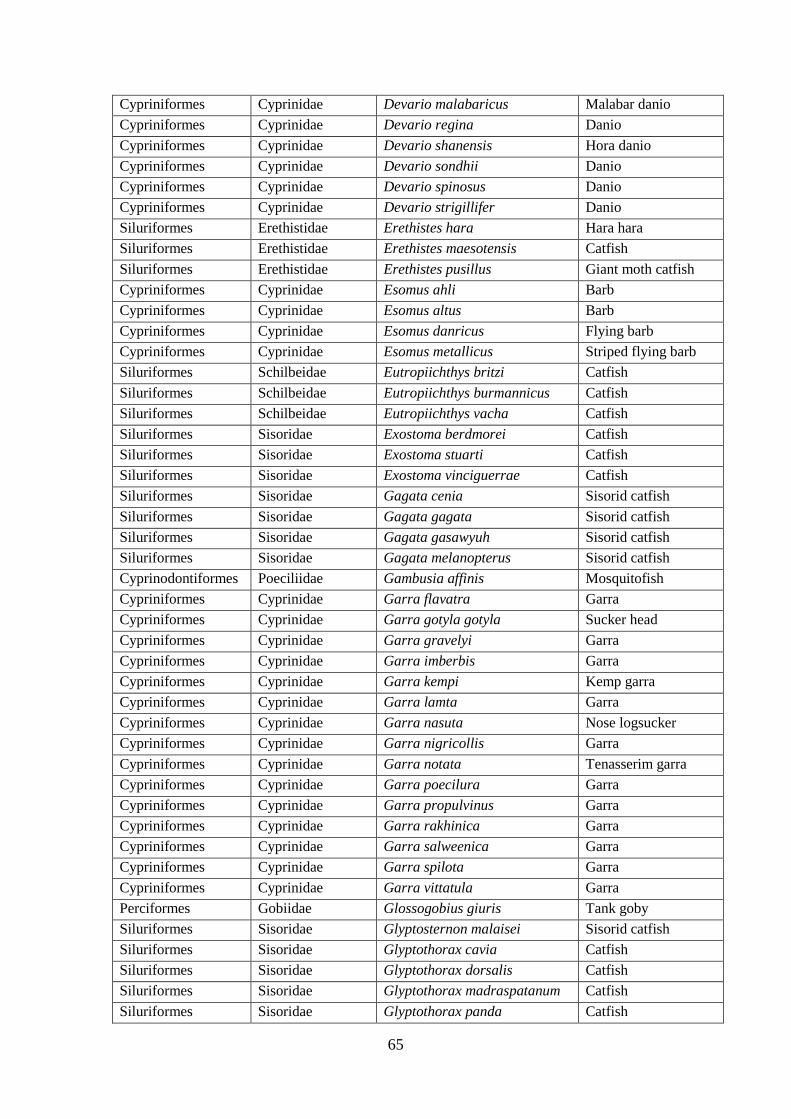
65
Cypriniformes Cyprinidae Devario malabaricus Malabar danio
Cypriniformes Cyprinidae Devario regina Danio
Cypriniformes Cyprinidae Devario shanensis Hora danio
Cypriniformes Cyprinidae Devario sondhii Danio
Cypriniformes Cyprinidae Devario spinosus Danio
Cypriniformes Cyprinidae Devario strigillifer Danio
Siluriformes Erethistidae Erethistes hara Hara hara
Siluriformes Erethistidae Erethistes maesotensis Catfish
Siluriformes Erethistidae Erethistes pusillus Giant moth catfish
Cypriniformes Cyprinidae Esomus ahli Barb
Cypriniformes Cyprinidae Esomus altus Barb
Cypriniformes Cyprinidae Esomus danricus Flying barb
Cypriniformes Cyprinidae Esomus metallicus Striped flying barb
Siluriformes Schilbeidae Eutropiichthys britzi Catfish
Siluriformes Schilbeidae Eutropiichthys burmannicus Catfish
Siluriformes Schilbeidae Eutropiichthys vacha Catfish
Siluriformes Sisoridae Exostoma berdmorei Catfish
Siluriformes Sisoridae Exostoma stuarti Catfish
Siluriformes Sisoridae Exostoma vinciguerrae Catfish
Siluriformes Sisoridae Gagata cenia Sisorid catfish
Siluriformes Sisoridae Gagata gagata Sisorid catfish
Siluriformes Sisoridae Gagata gasawyuh Sisorid catfish
Siluriformes Sisoridae Gagata melanopterus Sisorid catfish
Cyprinodontiformes Poeciliidae Gambusia affinis Mosquitofish
Cypriniformes Cyprinidae Garra flavatra Garra
Cypriniformes Cyprinidae Garra gotyla gotyla Sucker head
Cypriniformes Cyprinidae Garra gravelyi Garra
Cypriniformes Cyprinidae Garra imberbis Garra
Cypriniformes Cyprinidae Garra kempi Kemp garra
Cypriniformes Cyprinidae Garra lamta Garra
Cypriniformes Cyprinidae Garra nasuta Nose logsucker
Cypriniformes Cyprinidae Garra nigricollis Garra
Cypriniformes Cyprinidae Garra notata Tenasserim garra
Cypriniformes Cyprinidae Garra poecilura Garra
Cypriniformes Cyprinidae Garra propulvinus Garra
Cypriniformes Cyprinidae Garra rakhinica Garra
Cypriniformes Cyprinidae Garra salweenica Garra
Cypriniformes Cyprinidae Garra spilota Garra
Cypriniformes Cyprinidae Garra vittatula Garra
Perciformes Gobiidae Glossogobius giuris Tank goby
Siluriformes Sisoridae Glyptosternon malaisei Sisorid catfish
Siluriformes Sisoridae Glyptothorax cavia Catfish
Siluriformes Sisoridae Glyptothorax dorsalis Catfish
Siluriformes Sisoridae Glyptothorax madraspatanum Catfish
Siluriformes Sisoridae Glyptothorax panda Catfish
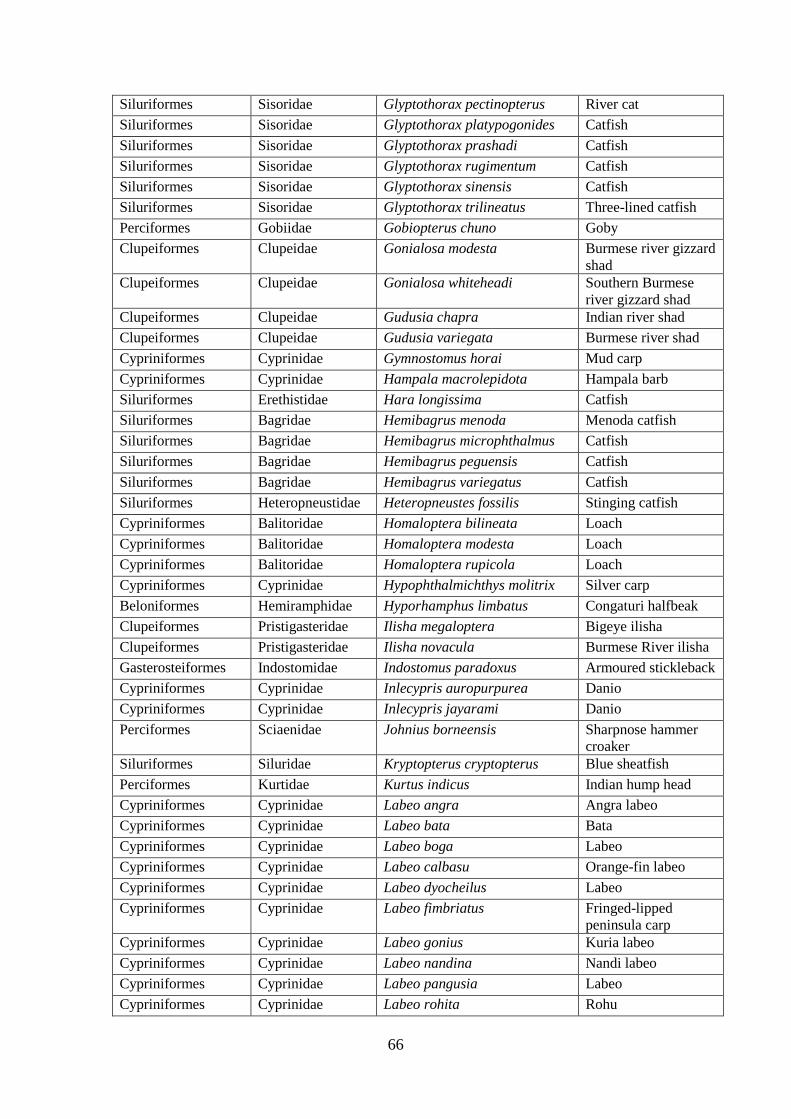
66
Siluriformes Sisoridae Glyptothorax pectinopterus River cat
Siluriformes Sisoridae Glyptothorax platypogonides Catfish
Siluriformes Sisoridae Glyptothorax prashadi Catfish
Siluriformes Sisoridae Glyptothorax rugimentum Catfish
Siluriformes Sisoridae Glyptothorax sinensis Catfish
Siluriformes Sisoridae Glyptothorax trilineatus Three-lined catfish
Perciformes Gobiidae Gobiopterus chuno Goby
Clupeiformes Clupeidae Gonialosa modesta Burmese river gizzard
shad
Clupeiformes Clupeidae Gonialosa whiteheadi Southern Burmese
river gizzard shad
Clupeiformes Clupeidae Gudusia chapra Indian river shad
Clupeiformes Clupeidae Gudusia variegata Burmese river shad
Cypriniformes Cyprinidae Gymnostomus horai Mud carp
Cypriniformes Cyprinidae Hampala macrolepidota Hampala barb
Siluriformes Erethistidae Hara longissima Catfish
Siluriformes Bagridae Hemibagrus menoda Menoda catfish
Siluriformes Bagridae Hemibagrus microphthalmus Catfish
Siluriformes Bagridae Hemibagrus peguensis Catfish
Siluriformes Bagridae Hemibagrus variegatus Catfish
Siluriformes Heteropneustidae Heteropneustes fossilis Stinging catfish
Cypriniformes Balitoridae Homaloptera bilineata Loach
Cypriniformes Balitoridae Homaloptera modesta Loach
Cypriniformes Balitoridae Homaloptera rupicola Loach
Cypriniformes Cyprinidae Hypophthalmichthys molitrix Silver carp
Beloniformes Hemiramphidae Hyporhamphus limbatus Congaturi halfbeak
Clupeiformes Pristigasteridae Ilisha megaloptera Bigeye ilisha
Clupeiformes Pristigasteridae Ilisha novacula Burmese River ilisha
Gasterosteiformes Indostomidae Indostomus paradoxus Armoured stickleback
Cypriniformes Cyprinidae Inlecypris auropurpurea Danio
Cypriniformes Cyprinidae Inlecypris jayarami Danio
Perciformes Sciaenidae Johnius borneensis Sharpnose hammer
croaker
Siluriformes Siluridae Kryptopterus cryptopterus Blue sheatfish
Perciformes Kurtidae Kurtus indicus Indian hump head
Cypriniformes Cyprinidae Labeo angra Angra labeo
Cypriniformes Cyprinidae Labeo bata Bata
Cypriniformes Cyprinidae Labeo boga Labeo
Cypriniformes Cyprinidae Labeo calbasu Orange-fin labeo
Cypriniformes Cyprinidae Labeo dyocheilus Labeo
Cypriniformes Cyprinidae Labeo fimbriatus Fringed-lipped
peninsula carp
Cypriniformes Cyprinidae Labeo gonius Kuria labeo
Cypriniformes Cyprinidae Labeo nandina Nandi labeo
Cypriniformes Cyprinidae Labeo pangusia Labeo
Cypriniformes Cyprinidae Labeo rohita Rohu
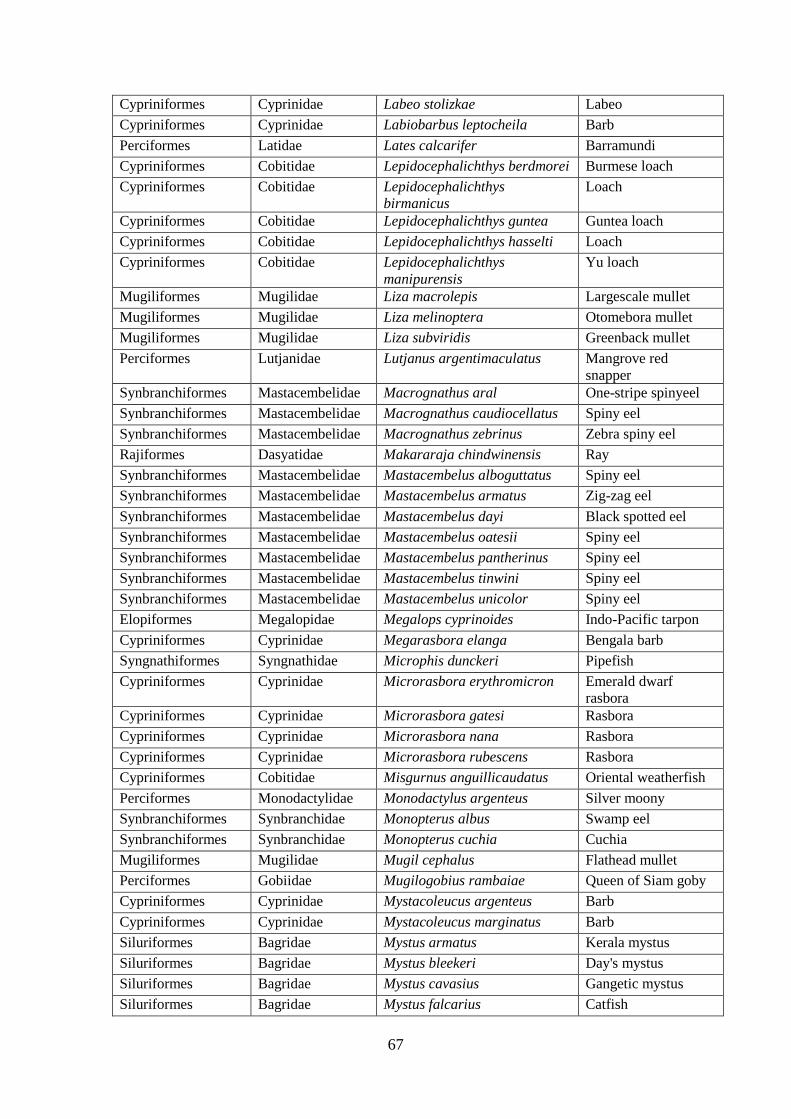
67
Cypriniformes Cyprinidae Labeo stolizkae Labeo
Cypriniformes Cyprinidae Labiobarbus leptocheila Barb
Perciformes Latidae Lates calcarifer Barramundi
Cypriniformes Cobitidae Lepidocephalichthys berdmorei Burmese loach
Cypriniformes Cobitidae Lepidocephalichthys
birmanicus
Loach
Cypriniformes Cobitidae Lepidocephalichthys guntea Guntea loach
Cypriniformes Cobitidae Lepidocephalichthys hasselti Loach
Cypriniformes Cobitidae Lepidocephalichthys
manipurensis
Yu loach
Mugiliformes Mugilidae Liza macrolepis Largescale mullet
Mugiliformes Mugilidae Liza melinoptera Otomebora mullet
Mugiliformes Mugilidae Liza subviridis Greenback mullet
Perciformes Lutjanidae Lutjanus argentimaculatus Mangrove red
snapper
Synbranchiformes Mastacembelidae Macrognathus aral One-stripe spinyeel
Synbranchiformes Mastacembelidae Macrognathus caudiocellatus Spiny eel
Synbranchiformes Mastacembelidae Macrognathus zebrinus Zebra spiny eel
Rajiformes Dasyatidae Makararaja chindwinensis Ray
Synbranchiformes Mastacembelidae Mastacembelus alboguttatus Spiny eel
Synbranchiformes Mastacembelidae Mastacembelus armatus Zig-zag eel
Synbranchiformes Mastacembelidae Mastacembelus dayi Black spotted eel
Synbranchiformes Mastacembelidae Mastacembelus oatesii Spiny eel
Synbranchiformes Mastacembelidae Mastacembelus pantherinus Spiny eel
Synbranchiformes Mastacembelidae Mastacembelus tinwini Spiny eel
Synbranchiformes Mastacembelidae Mastacembelus unicolor Spiny eel
Elopiformes Megalopidae Megalops cyprinoides Indo-Pacific tarpon
Cypriniformes Cyprinidae Megarasbora elanga Bengala barb
Syngnathiformes Syngnathidae Microphis dunckeri Pipefish
Cypriniformes Cyprinidae Microrasbora erythromicron Emerald dwarf
rasbora
Cypriniformes Cyprinidae Microrasbora gatesi Rasbora
Cypriniformes Cyprinidae Microrasbora nana Rasbora
Cypriniformes Cyprinidae Microrasbora rubescens Rasbora
Cypriniformes Cobitidae Misgurnus anguillicaudatus Oriental weatherfish
Perciformes Monodactylidae Monodactylus argenteus Silver moony
Synbranchiformes Synbranchidae Monopterus albus Swamp eel
Synbranchiformes Synbranchidae Monopterus cuchia Cuchia
Mugiliformes Mugilidae Mugil cephalus Flathead mullet
Perciformes Gobiidae Mugilogobius rambaiae Queen of Siam goby
Cypriniformes Cyprinidae Mystacoleucus argenteus Barb
Cypriniformes Cyprinidae Mystacoleucus marginatus Barb
Siluriformes Bagridae Mystus armatus Kerala mystus
Siluriformes Bagridae Mystus bleekeri Day's mystus
Siluriformes Bagridae Mystus cavasius Gangetic mystus
Siluriformes Bagridae Mystus falcarius Catfish
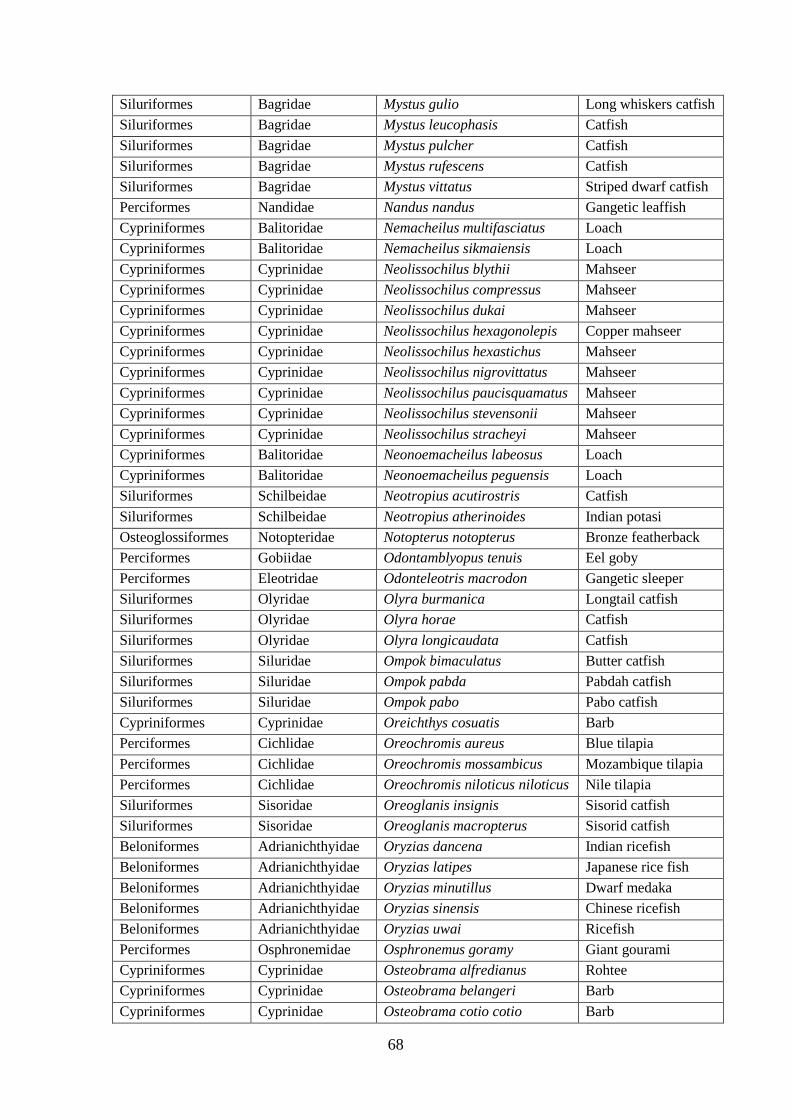
68
Siluriformes Bagridae Mystus gulio Long whiskers catfish
Siluriformes Bagridae Mystus leucophasis Catfish
Siluriformes Bagridae Mystus pulcher Catfish
Siluriformes Bagridae Mystus rufescens Catfish
Siluriformes Bagridae Mystus vittatus Striped dwarf catfish
Perciformes Nandidae Nandus nandus Gangetic leaffish
Cypriniformes Balitoridae Nemacheilus multifasciatus Loach
Cypriniformes Balitoridae Nemacheilus sikmaiensis Loach
Cypriniformes Cyprinidae Neolissochilus blythii Mahseer
Cypriniformes Cyprinidae Neolissochilus compressus Mahseer
Cypriniformes Cyprinidae Neolissochilus dukai Mahseer
Cypriniformes Cyprinidae Neolissochilus hexagonolepis Copper mahseer
Cypriniformes Cyprinidae Neolissochilus hexastichus Mahseer
Cypriniformes Cyprinidae Neolissochilus nigrovittatus Mahseer
Cypriniformes Cyprinidae Neolissochilus paucisquamatus Mahseer
Cypriniformes Cyprinidae Neolissochilus stevensonii Mahseer
Cypriniformes Cyprinidae Neolissochilus stracheyi Mahseer
Cypriniformes Balitoridae Neonoemacheilus labeosus Loach
Cypriniformes Balitoridae Neonoemacheilus peguensis Loach
Siluriformes Schilbeidae Neotropius acutirostris Catfish
Siluriformes Schilbeidae Neotropius atherinoides Indian potasi
Osteoglossiformes Notopteridae Notopterus notopterus Bronze featherback
Perciformes Gobiidae Odontamblyopus tenuis Eel goby
Perciformes Eleotridae Odonteleotris macrodon Gangetic sleeper
Siluriformes Olyridae Olyra burmanica Longtail catfish
Siluriformes Olyridae Olyra horae Catfish
Siluriformes Olyridae Olyra longicaudata Catfish
Siluriformes Siluridae Ompok bimaculatus Butter catfish
Siluriformes Siluridae Ompok pabda Pabdah catfish
Siluriformes Siluridae Ompok pabo Pabo catfish
Cypriniformes Cyprinidae Oreichthys cosuatis Barb
Perciformes Cichlidae Oreochromis aureus Blue tilapia
Perciformes Cichlidae Oreochromis mossambicus Mozambique tilapia
Perciformes Cichlidae Oreochromis niloticus niloticus Nile tilapia
Siluriformes Sisoridae Oreoglanis insignis Sisorid catfish
Siluriformes Sisoridae Oreoglanis macropterus Sisorid catfish
Beloniformes Adrianichthyidae Oryzias dancena Indian ricefish
Beloniformes Adrianichthyidae Oryzias latipes Japanese rice fish
Beloniformes Adrianichthyidae Oryzias minutillus Dwarf medaka
Beloniformes Adrianichthyidae Oryzias sinensis Chinese ricefish
Beloniformes Adrianichthyidae Oryzias uwai Ricefish
Perciformes Osphronemidae Osphronemus goramy Giant gourami
Cypriniformes Cyprinidae Osteobrama alfredianus Rohtee
Cypriniformes Cyprinidae Osteobrama belangeri Barb
Cypriniformes Cyprinidae Osteobrama cotio cotio Barb
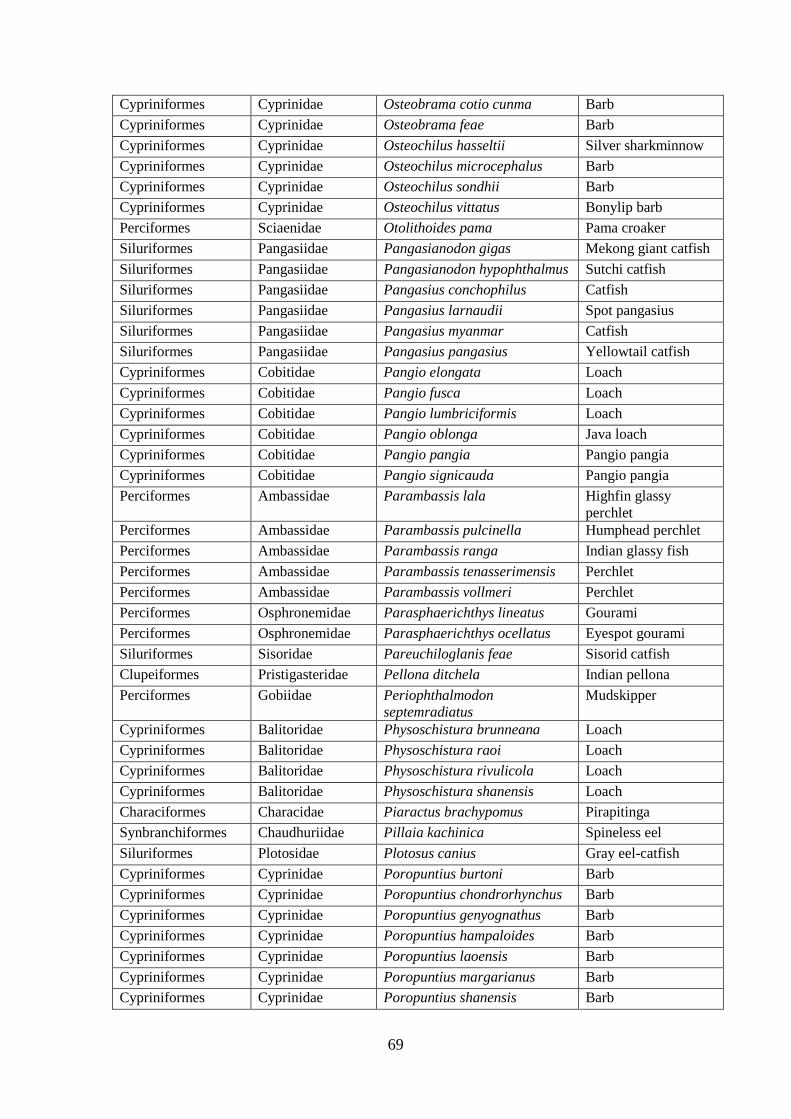
69
Cypriniformes Cyprinidae Osteobrama cotio cunma Barb
Cypriniformes Cyprinidae Osteobrama feae Barb
Cypriniformes Cyprinidae Osteochilus hasseltii Silver sharkminnow
Cypriniformes Cyprinidae Osteochilus microcephalus Barb
Cypriniformes Cyprinidae Osteochilus sondhii Barb
Cypriniformes Cyprinidae Osteochilus vittatus Bonylip barb
Perciformes Sciaenidae Otolithoides pama Pama croaker
Siluriformes Pangasiidae Pangasianodon gigas Mekong giant catfish
Siluriformes Pangasiidae Pangasianodon hypophthalmus Sutchi catfish
Siluriformes Pangasiidae Pangasius conchophilus Catfish
Siluriformes Pangasiidae Pangasius larnaudii Spot pangasius
Siluriformes Pangasiidae Pangasius myanmar Catfish
Siluriformes Pangasiidae Pangasius pangasius Yellowtail catfish
Cypriniformes Cobitidae Pangio elongata Loach
Cypriniformes Cobitidae Pangio fusca Loach
Cypriniformes Cobitidae Pangio lumbriciformis Loach
Cypriniformes Cobitidae Pangio oblonga Java loach
Cypriniformes Cobitidae Pangio pangia Pangio pangia
Cypriniformes Cobitidae Pangio signicauda Pangio pangia
Perciformes Ambassidae Parambassis lala Highfin glassy
perchlet
Perciformes Ambassidae Parambassis pulcinella Humphead perchlet
Perciformes Ambassidae Parambassis ranga Indian glassy fish
Perciformes Ambassidae Parambassis tenasserimensis Perchlet
Perciformes Ambassidae Parambassis vollmeri Perchlet
Perciformes Osphronemidae Parasphaerichthys lineatus Gourami
Perciformes Osphronemidae Parasphaerichthys ocellatus Eyespot gourami
Siluriformes Sisoridae Pareuchiloglanis feae Sisorid catfish
Clupeiformes Pristigasteridae Pellona ditchela Indian pellona
Perciformes Gobiidae Periophthalmodon
septemradiatus
Mudskipper
Cypriniformes Balitoridae Physoschistura brunneana Loach
Cypriniformes Balitoridae Physoschistura raoi Loach
Cypriniformes Balitoridae Physoschistura rivulicola Loach
Cypriniformes Balitoridae Physoschistura shanensis Loach
Characiformes Characidae Piaractus brachypomus Pirapitinga
Synbranchiformes Chaudhuriidae Pillaia kachinica Spineless eel
Siluriformes Plotosidae Plotosus canius Gray eel-catfish
Cypriniformes Cyprinidae Poropuntius burtoni Barb
Cypriniformes Cyprinidae Poropuntius chondrorhynchus Barb
Cypriniformes Cyprinidae Poropuntius genyognathus Barb
Cypriniformes Cyprinidae Poropuntius hampaloides Barb
Cypriniformes Cyprinidae Poropuntius laoensis Barb
Cypriniformes Cyprinidae Poropuntius margarianus Barb
Cypriniformes Cyprinidae Poropuntius shanensis Barb
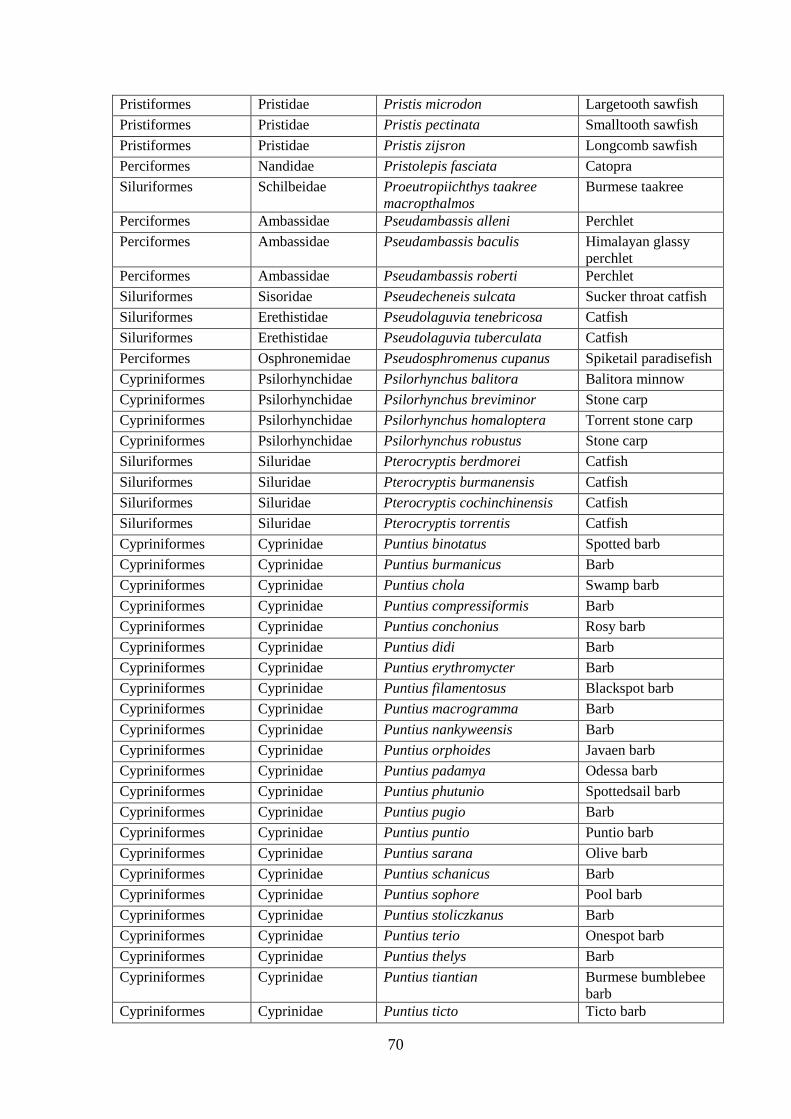
70
Pristiformes Pristidae Pristis microdon Largetooth sawfish
Pristiformes Pristidae Pristis pectinata Smalltooth sawfish
Pristiformes Pristidae Pristis zijsron Longcomb sawfish
Perciformes Nandidae Pristolepis fasciata Catopra
Siluriformes Schilbeidae Proeutropiichthys taakree
macropthalmos
Burmese taakree
Perciformes Ambassidae Pseudambassis alleni Perchlet
Perciformes Ambassidae Pseudambassis baculis Himalayan glassy
perchlet
Perciformes Ambassidae Pseudambassis roberti Perchlet
Siluriformes Sisoridae Pseudecheneis sulcata Sucker throat catfish
Siluriformes Erethistidae Pseudolaguvia tenebricosa Catfish
Siluriformes Erethistidae Pseudolaguvia tuberculata Catfish
Perciformes Osphronemidae Pseudosphromenus cupanus Spiketail paradisefish
Cypriniformes Psilorhynchidae Psilorhynchus balitora Balitora minnow
Cypriniformes Psilorhynchidae Psilorhynchus breviminor Stone carp
Cypriniformes Psilorhynchidae Psilorhynchus homaloptera Torrent stone carp
Cypriniformes Psilorhynchidae Psilorhynchus robustus Stone carp
Siluriformes Siluridae Pterocryptis berdmorei Catfish
Siluriformes Siluridae Pterocryptis burmanensis Catfish
Siluriformes Siluridae Pterocryptis cochinchinensis Catfish
Siluriformes Siluridae Pterocryptis torrentis Catfish
Cypriniformes Cyprinidae Puntius binotatus Spotted barb
Cypriniformes Cyprinidae Puntius burmanicus Barb
Cypriniformes Cyprinidae Puntius chola Swamp barb
Cypriniformes Cyprinidae Puntius compressiformis Barb
Cypriniformes Cyprinidae Puntius conchonius Rosy barb
Cypriniformes Cyprinidae Puntius didi Barb
Cypriniformes Cyprinidae Puntius erythromycter Barb
Cypriniformes Cyprinidae Puntius filamentosus Blackspot barb
Cypriniformes Cyprinidae Puntius macrogramma Barb
Cypriniformes Cyprinidae Puntius nankyweensis Barb
Cypriniformes Cyprinidae Puntius orphoides Javaen barb
Cypriniformes Cyprinidae Puntius padamya Odessa barb
Cypriniformes Cyprinidae Puntius phutunio Spottedsail barb
Cypriniformes Cyprinidae Puntius pugio Barb
Cypriniformes Cyprinidae Puntius puntio Puntio barb
Cypriniformes Cyprinidae Puntius sarana Olive barb
Cypriniformes Cyprinidae Puntius schanicus Barb
Cypriniformes Cyprinidae Puntius sophore Pool barb
Cypriniformes Cyprinidae Puntius stoliczkanus Barb
Cypriniformes Cyprinidae Puntius terio Onespot barb
Cypriniformes Cyprinidae Puntius thelys Barb
Cypriniformes Cyprinidae Puntius tiantian Burmese bumblebee
barb
Cypriniformes Cyprinidae Puntius ticto Ticto barb
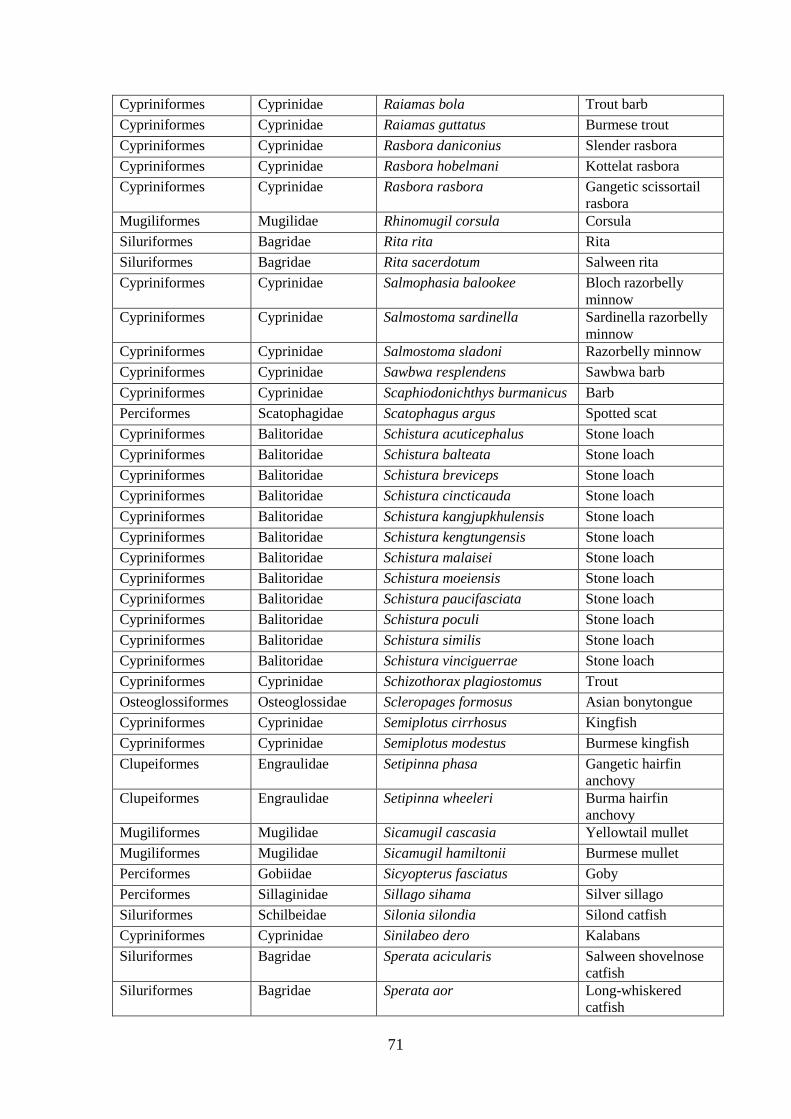
71
Cypriniformes Cyprinidae Raiamas bola Trout barb
Cypriniformes Cyprinidae Raiamas guttatus Burmese trout
Cypriniformes Cyprinidae Rasbora daniconius Slender rasbora
Cypriniformes Cyprinidae Rasbora hobelmani Kottelat rasbora
Cypriniformes Cyprinidae Rasbora rasbora Gangetic scissortail
rasbora
Mugiliformes Mugilidae Rhinomugil corsula Corsula
Siluriformes Bagridae Rita rita Rita
Siluriformes Bagridae Rita sacerdotum Salween rita
Cypriniformes Cyprinidae Salmophasia balookee Bloch razorbelly
minnow
Cypriniformes Cyprinidae Salmostoma sardinella Sardinella razorbelly
minnow
Cypriniformes Cyprinidae Salmostoma sladoni Razorbelly minnow
Cypriniformes Cyprinidae Sawbwa resplendens Sawbwa barb
Cypriniformes Cyprinidae Scaphiodonichthys burmanicus Barb
Perciformes Scatophagidae Scatophagus argus Spotted scat
Cypriniformes Balitoridae Schistura acuticephalus Stone loach
Cypriniformes Balitoridae Schistura balteata Stone loach
Cypriniformes Balitoridae Schistura breviceps Stone loach
Cypriniformes Balitoridae Schistura cincticauda Stone loach
Cypriniformes Balitoridae Schistura kangjupkhulensis Stone loach
Cypriniformes Balitoridae Schistura kengtungensis Stone loach
Cypriniformes Balitoridae Schistura malaisei Stone loach
Cypriniformes Balitoridae Schistura moeiensis Stone loach
Cypriniformes Balitoridae Schistura paucifasciata Stone loach
Cypriniformes Balitoridae Schistura poculi Stone loach
Cypriniformes Balitoridae Schistura similis Stone loach
Cypriniformes Balitoridae Schistura vinciguerrae Stone loach
Cypriniformes Cyprinidae Schizothorax plagiostomus Trout
Osteoglossiformes Osteoglossidae Scleropages formosus Asian bonytongue
Cypriniformes Cyprinidae Semiplotus cirrhosus Kingfish
Cypriniformes Cyprinidae Semiplotus modestus Burmese kingfish
Clupeiformes Engraulidae Setipinna phasa Gangetic hairfin
anchovy
Clupeiformes Engraulidae Setipinna wheeleri Burma hairfin
anchovy
Mugiliformes Mugilidae Sicamugil cascasia Yellowtail mullet
Mugiliformes Mugilidae Sicamugil hamiltonii Burmese mullet
Perciformes Gobiidae Sicyopterus fasciatus Goby
Perciformes Sillaginidae Sillago sihama Silver sillago
Siluriformes Schilbeidae Silonia silondia Silond catfish
Cypriniformes Cyprinidae Sinilabeo dero Kalabans
Siluriformes Bagridae Sperata acicularis Salween shovelnose
catfish
Siluriformes Bagridae Sperata aor Long-whiskered
catfish
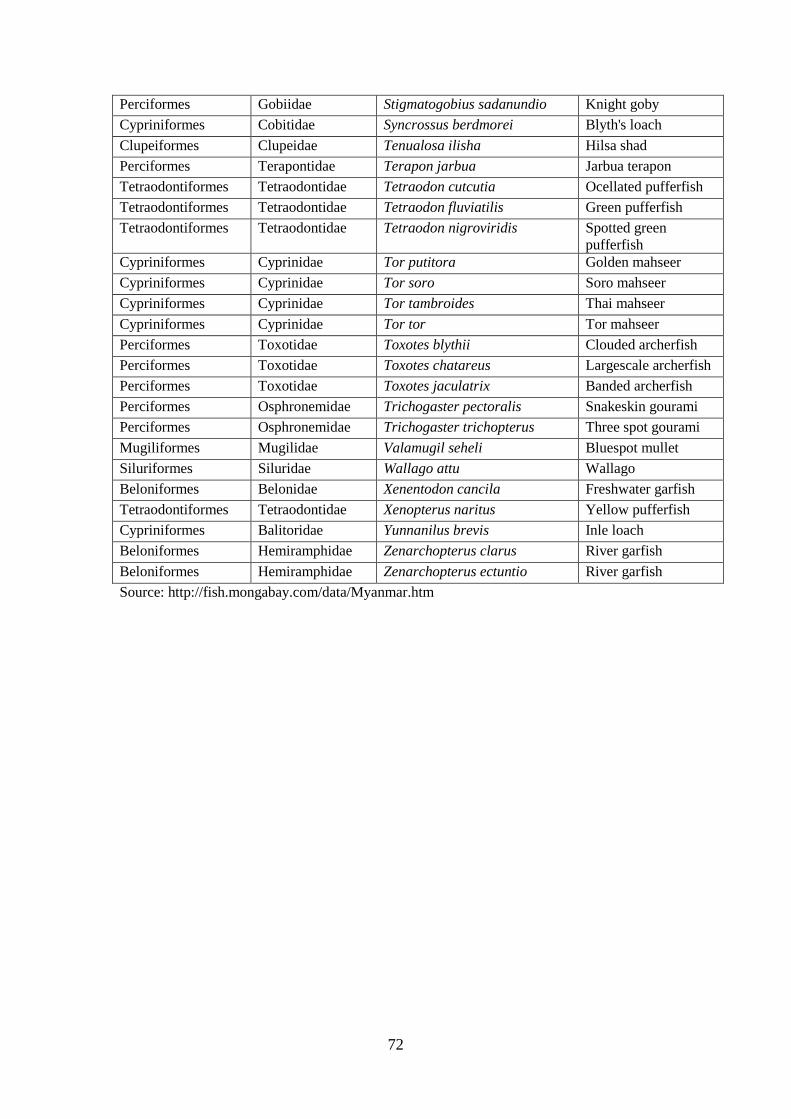
72
Perciformes Gobiidae Stigmatogobius sadanundio Knight goby
Cypriniformes Cobitidae Syncrossus berdmorei Blyth's loach
Clupeiformes Clupeidae Tenualosa ilisha Hilsa shad
Perciformes Terapontidae Terapon jarbua Jarbua terapon
Tetraodontiformes Tetraodontidae Tetraodon cutcutia Ocellated pufferfish
Tetraodontiformes Tetraodontidae Tetraodon fluviatilis Green pufferfish
Tetraodontiformes Tetraodontidae Tetraodon nigroviridis Spotted green
pufferfish
Cypriniformes Cyprinidae Tor putitora Golden mahseer
Cypriniformes Cyprinidae Tor soro Soro mahseer
Cypriniformes Cyprinidae Tor tambroides Thai mahseer
Cypriniformes Cyprinidae Tor tor Tor mahseer
Perciformes Toxotidae Toxotes blythii Clouded archerfish
Perciformes Toxotidae Toxotes chatareus Largescale archerfish
Perciformes Toxotidae Toxotes jaculatrix Banded archerfish
Perciformes Osphronemidae Trichogaster pectoralis Snakeskin gourami
Perciformes Osphronemidae Trichogaster trichopterus Three spot gourami
Mugiliformes Mugilidae Valamugil seheli Bluespot mullet
Siluriformes Siluridae Wallago attu Wallago
Beloniformes Belonidae Xenentodon cancila Freshwater garfish
Tetraodontiformes Tetraodontidae Xenopterus naritus Yellow pufferfish
Cypriniformes Balitoridae Yunnanilus brevis Inle loach
Beloniformes Hemiramphidae Zenarchopterus clarus River garfish
Beloniformes Hemiramphidae Zenarchopterus ectuntio River garfish
Source: http://fish.mongabay.com/data/Myanmar.htm
73
ANNEX 3: EXPORT TRENDS FOR FISHERIES PRODUCTS IN
MYANMAR
Fishery is one of the most important sectors contributing to the national GDP of
Myanmar as well as an important source of export earnings. Normally, the products
are exported alive, fresh frozen or chilled and processed. In 2013-2014, the total
export for fisheries sector amounted 345,267.36 metric tonnes, valued at US$536.27
million (Table 1).
The shrimp was the top export commodity in 1990s, generating up to 50% of
earnings. However, shrimp exports have declined since 2001 contributes 4.8% of the
total fisheries export volume in 2013. However, the volume of fish exported has been
steadily increasing. In 2013-2014, the fish exports amounted to 237,142.31 tonnes or
68.7% of the total fishery export in country. In term of value, about 50% of the
overall export value is earned from fish exports.
In 2013-2014, the top exported fish was Rohu (Labeo rohita), which amounted
68,314.72 tonnes, valued at US$69.05 million. Second was live Eel (Anguilla spp.)
with 12,631.09 tonnes, valued at US$52.21 million. Other top exported products
include Orange Mud Crab (Scyllaolivacea), Hilsa Shad (Tenualosa ilisha), Pink
shrimp (Metapanaeus intermedius), Tiger prawn (Penaeus monodon), Ribbonfish
(Trichiurus savala), dried prawn, and White shrimp.
Overall, there are fluctuated trends throughout the year (2008-2014) in terms of
quantity of the fisheries exports. There was increment of 15.5% of the total fishery
exports from 2008-2009 (324,710.54 tonnes) to 2009-2010 (375,092.43 tonnes), then
slight decrease 0.3% in 2010-2011 (373,892.71 tonnes). In 2011-2012, the fisheries
export increased 3.5% (386,981.32 tonnes), before continuously decreased 10.8% in
2013-2014 (345,267.36 tonnes) (Figure 1). Similar trends are also observed for each
exported commodities (fish, prawn and others fishery products) through out the year.
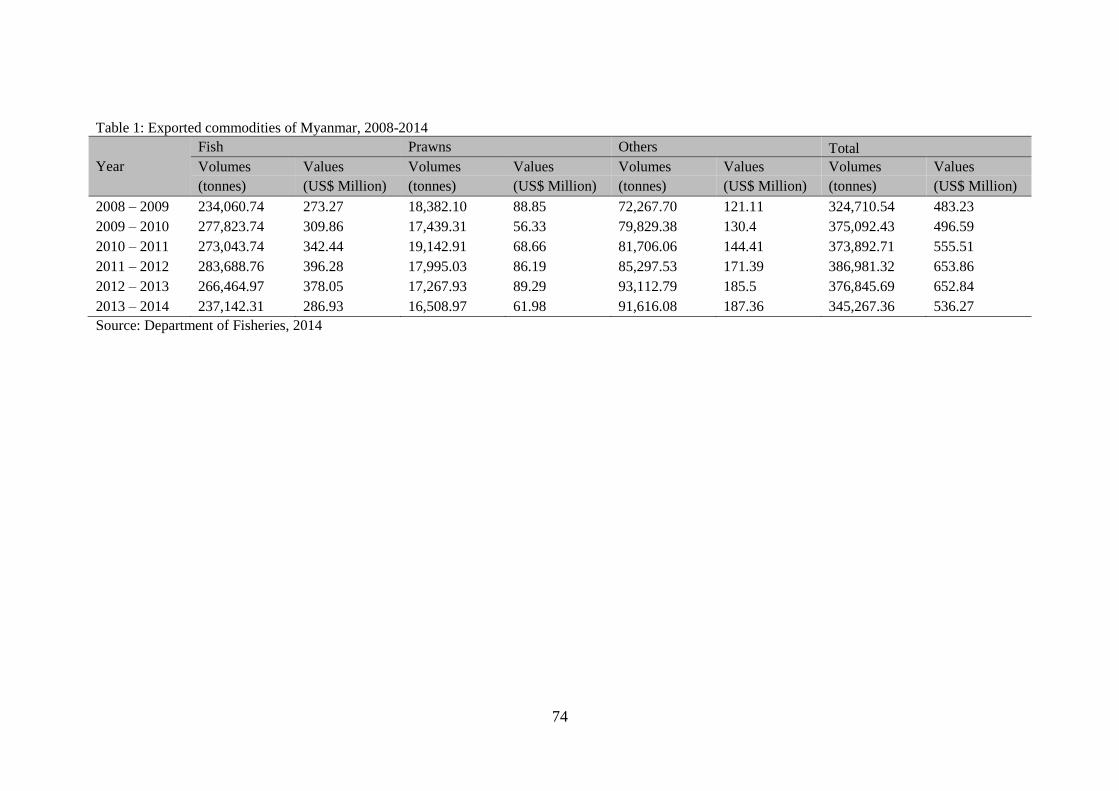
74
Table 1: Exported commodities of Myanmar, 2008-2014
Year
Fish Prawns Others Total
Volumes Values Volumes Values Volumes Values Volumes Values
(tonnes) (US$ Million) (tonnes) (US$ Million) (tonnes) (US$ Million) (tonnes) (US$ Million)
2008 – 2009 234,060.74 273.27 18,382.10 88.85 72,267.70 121.11 324,710.54 483.23
2009 – 2010 277,823.74 309.86 17,439.31 56.33 79,829.38 130.4 375,092.43 496.59
2010 – 2011 273,043.74 342.44 19,142.91 68.66 81,706.06 144.41 373,892.71 555.51
2011 – 2012 283,688.76 396.28 17,995.03 86.19 85,297.53 171.39 386,981.32 653.86
2012 – 2013 266,464.97 378.05 17,267.93 89.29 93,112.79 185.5 376,845.69 652.84
2013 – 2014 237,142.31 286.93 16,508.97 61.98 91,616.08 187.36 345,267.36 536.27
Source: Department of Fisheries, 2014
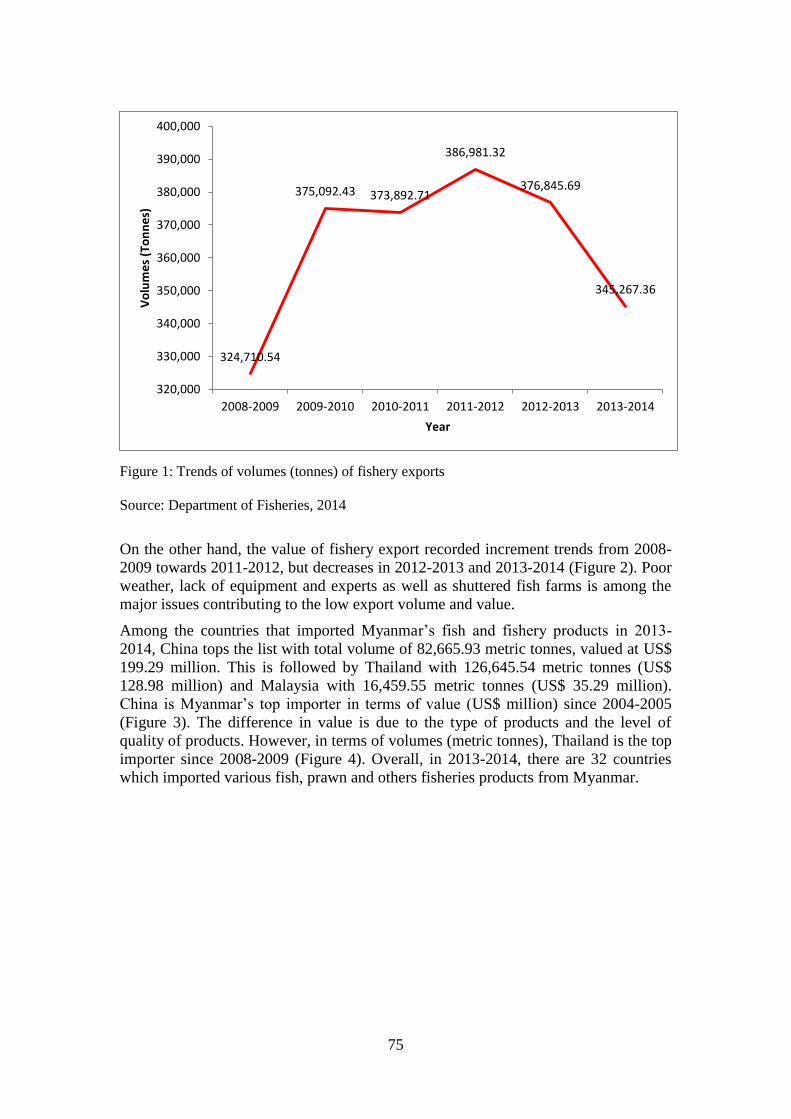
75
Figure 1: Trends of volumes (tonnes) of fishery exports
Source: Department of Fisheries, 2014
On the other hand, the value of fishery export recorded increment trends from 2008-
2009 towards 2011-2012, but decreases in 2012-2013 and 2013-2014 (Figure 2). Poor
weather, lack of equipment and experts as well as shuttered fish farms is among the
major issues contributing to the low export volume and value.
Among the countries that imported Myanmar’s fish and fishery products in 2013-
2014, China tops the list with total volume of 82,665.93 metric tonnes, valued at US$
199.29 million. This is followed by Thailand with 126,645.54 metric tonnes (US$
128.98 million) and Malaysia with 16,459.55 metric tonnes (US$ 35.29 million).
China is Myanmar’s top importer in terms of value (US$ million) since 2004-2005
(Figure 3). The difference in value is due to the type of products and the level of
quality of products. However, in terms of volumes (metric tonnes), Thailand is the top
importer since 2008-2009 (Figure 4). Overall, in 2013-2014, there are 32 countries
which imported various fish, prawn and others fisheries products from Myanmar.
324,710.54
375,092.43 373,892.71
386,981.32
376,845.69
345,267.36
320,000
330,000
340,000
350,000
360,000
370,000
380,000
390,000
400,000
2008-2009 2009-2010 2010-2011 2011-2012 2012-2013 2013-2014
Vo
lum
es
(To
nn
es)
Year
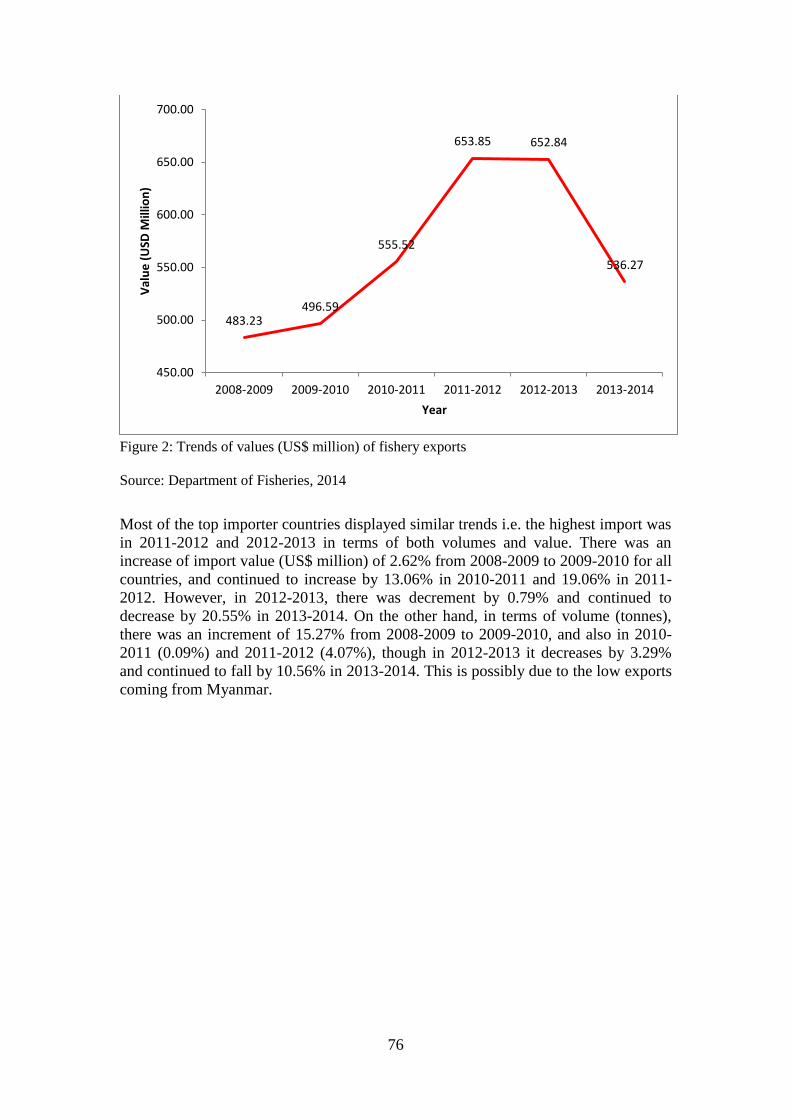
76
Figure 2: Trends of values (US$ million) of fishery exports
Source: Department of Fisheries, 2014
Most of the top importer countries displayed similar trends i.e. the highest import was
in 2011-2012 and 2012-2013 in terms of both volumes and value. There was an
increase of import value (US$ million) of 2.62% from 2008-2009 to 2009-2010 for all
countries, and continued to increase by 13.06% in 2010-2011 and 19.06% in 2011-
2012. However, in 2012-2013, there was decrement by 0.79% and continued to
decrease by 20.55% in 2013-2014. On the other hand, in terms of volume (tonnes),
there was an increment of 15.27% from 2008-2009 to 2009-2010, and also in 2010-
2011 (0.09%) and 2011-2012 (4.07%), though in 2012-2013 it decreases by 3.29%
and continued to fall by 10.56% in 2013-2014. This is possibly due to the low exports
coming from Myanmar.
483.23 496.59
555.52
653.85 652.84
536.27
450.00
500.00
550.00
600.00
650.00
700.00
2008-2009 2009-2010 2010-2011 2011-2012 2012-2013 2013-2014
Val
ue
(U
SD M
illio
n)
Year
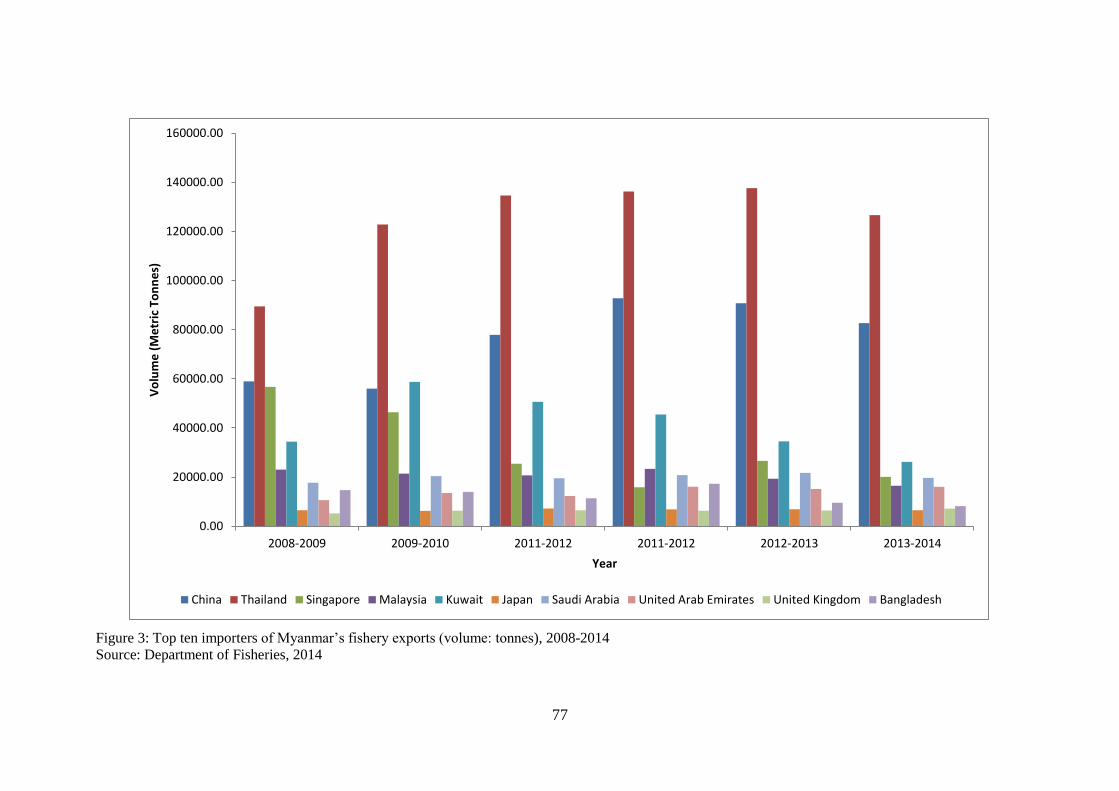
77
Figure 3: Top ten importers of Myanmar’s fishery exports (volume: tonnes), 2008-2014
Source: Department of Fisheries, 2014
0.00
20000.00
40000.00
60000.00
80000.00
100000.00
120000.00
140000.00
160000.00
2008-2009 2009-2010 2011-2012 2011-2012 2012-2013 2013-2014
Vo
lum
e (
Me
tric
To
nn
es)
Year
China Thailand Singapore Malaysia Kuwait Japan Saudi Arabia United Arab Emirates United Kingdom Bangladesh
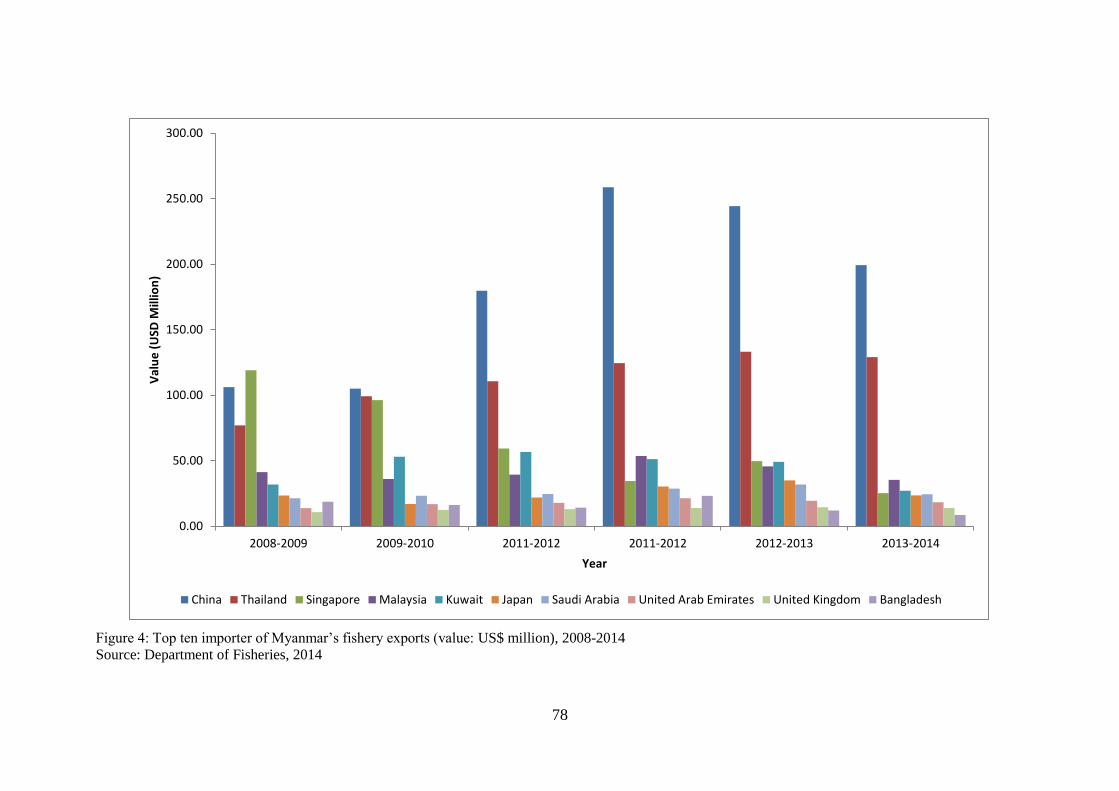
78
Figure 4: Top ten importer of Myanmar’s fishery exports (value: US$ million), 2008-2014
Source: Department of Fisheries, 2014
0.00
50.00
100.00
150.00
200.00
250.00
300.00
2008-2009 2009-2010 2011-2012 2011-2012 2012-2013 2013-2014
Val
ue
(U
SD M
illio
n)
Year
China Thailand Singapore Malaysia Kuwait Japan Saudi Arabia United Arab Emirates United Kingdom Bangladesh