status and potential of fisheries and aquaculture in … rap publication 2010/17 status and...
TRANSCRIPT

Status and potential of
fisheries and
aquaculture in Asia and
the Pacific 2010
APFICmember
Res t o fthe wor ld
Ch ina
0
20 000
40 000
60 000
80 000
100 000
1950
1955
1960
1965
1970
1975
1980
1985
1990
1995
2000
RAP PUBLICATION 2010/17
ASIA-PACIFIC FISHERY COMMISSION

iv

i
RAP PUBLICATION 2010/17
Status and potential of fisheries and aquaculture
in Asia and the Pacific 2010
Food and Agriculture Organization of the United Nations
Regional Office for Asia and the Pacific
Bangkok, 2010

ii
The designations employed and the presentation of material in this information product do
not imply the expression of any opinion whatsoever on the part of the Food and Agriculture
Organization of the United Nations (FAO) concerning the legal or development status of any
country, territory, city or area or of its authorities, or concerning the delimitation of its frontiers
or boundaries. The mention of specific companies or products of manufacturers, whether or
not these have been patented, does not imply that these have been endorsed or
recommended by FAO in preference to others of a similar nature that are not mentioned.
ISBN 978-92-5-106721-5
All rights reserved. Reproduction and dissemination of material in this information product
for educational or other non-commercial purposes are authorized without any prior written
permission from the copyright holders provided the source is fully acknowledged.
Reproduction of material in this information product for resale or other commercial purposes
is prohibited without written permission of the copyright holders. Applications for such
permission should be addressed to:
Chief
Electronic Publishing Policy and Support Branch
Communication Division
FAO
Viale delle Terme di Caracalla, 00153 Rome, Italy
or by e-mail to:
© FAO 2010
For copies please write to:
The Secretary
Asia-Pacific Fishery Commission
FAO Regional Office for Asia and the Pacific
Maliwan Mansion, 39 Phra Athit Road
Bangkok 10200
THAILAND
Tel: (+66) 2 697 4000
Fax: (+66) 2 697 4445
E-mail: [email protected]

iii
Foreword
The Asia-Pacific Fishery Commission (APFIC) is committed to acting as a regional consultative
forum, providing member countries, regional organizations and fisheries professionals in the
region with the opportunity to review and discuss the challenges facing the region’s fisheries
sector and helping them decide on the most appropriate actions to take. As part of this function,
APFIC prepares a biennial status report to inform member countries and other stakeholders of
trends in fisheries and aquaculture, of emerging issues and other information tracking related
to fisheries governance. The report is prepared for and provided to member countries and other
stakeholders to assist in their deliberations during the biennial APFIC regional consultative forum
meeting and the regular session of the commission.
The present report Status and potential of fisheries and aquaculture in Asia and the Pacific
2010 provides short reviews of some current issues facing fisheries and aquaculture in the region
that are likely to challenge the sector as it adapts to the continuously changing production and
market environments. The structure of the report has been organized to reflect the two large
ecosystems of interest to the region, namely the South China Sea and the Bay of Bengal. The
information contained here will support regional dialogue on the status of these two fishery
subregions as well as provide valuable baseline or background information on the fisheries. It
is also hoped that this type of report will assist the development of more effective ecosystem
indicators or monitoring points.
Hiroyuki Konuma
Assistant Director-General and Regional Representative
FAO Regional Office for Asia and the Pacific

iv
Preparation of this document
This document was prepared for the Thirty-first Session of the Asia-Pacific Fishery Commission (APFIC),
which was held in Jeju, Republic of Korea from 6 to 8 September 2010. APFIC has continued to
implement its new role as a regional consultative forum and is endeavouring to respond effectively to
the changing requirements in the fisheries and aquaculture sector in the region. APFIC is committed to
improving the quality of information on the status and trends of fisheries and aquaculture in the region
and to reviewing and analyzing this information regularly. The purpose of this document is to inform
APFIC Member States of the current status and potential of fisheries and aquaculture in Asia and the
Pacific region and of the emerging issues facing the sector.
This review would not have been possible without access to the national statistical information of APFIC
member countries, FAO colleagues, the work of regional organizations such as SEAFDEC, BOBP-IGO
and the many others that collate and analyze information relevant to the fishery and aquaculture
subsectors of the region. In particulalr, we would like to acknowledge the dedicated contributions by
country correspondents:
■ Ahmad AbuTalib, SEAFDEC-MFRDMD, Department of Fisheries Malaysia, Fisheries Garden,
Chendering, 21080 Kuala Terengganu, Malaysia
■ Rattanawalee Phoonsawat, Fisheries Biologist, Marine Fisheries Research and Development
Bureau DOF Thailand, 49 Soi Prarachaveriyaporn 16, Bang Pheung, Phra Pradeang, Samut
Prakan, 10130, Thailand
■ Duto Nugroho, Researcher, Research Institute for Marine Fisheries (RIMF), Jalan Muara Baru
Ujung, Komplek Pelabuhan Perikanan Samudra, Jakarta 14430, Indonesia
■ Noel Barut, Bureau of Fisheries and Aquatic Resources, Department Agriculture, Arcadia
Building, Quezon Avenue, Quezon City, Philippines
■ E. Vivekanandan, Principal Scientist, Central Marine Fisheries Research Institute, Post Box
No. 1603, Cochin 682018, Kerala, India
■ Champa Amarasiri, Former Director , National Aquatic Resources Research and Development
Agency (NARA) , Crow Island, Mattakkuliya, Colombo 15, Sri Lanka
■ Myint Pe, Assistant Director, Department of Fisheries, Sinmin Road, Ahlone Township, Yangon,
Myanmar
■ Yongsong Qiu, Chief of Fishery Resources Division, South China Sea Fisheries Research
Institute, 231 Xingang Road West, Guangzhou 510300 China
■ M. Jalilur Rahman, Senior Scientific Officer, Bangladesh Fisheries Research Institute, Marine
Fisheries and Technology Station, Cox’s Bazar 4700, Bangladesh
Bibliographic reference
Lymer, D., Funge-Smith, S. & Miao, W. 2010. Status and potential of fisheries and aquaculture in Asia
and the Pacific 2010. FAO Regional Office for Asia and the Pacific. RAP Publication 2010/17.
85 pp.
v
Geographical scope of this review
States, entities and areas
This review covers the states, entities and areas of Asia and the Pacific region that report fisheries and
aquaculture statistics to FAO, and which are within the area of competence of the Asia-Pacific Fishery
Commission. They are subdivided into the subregions identified below, but other subdivisions, e.g. “South
China Sea and Gulf of Thailand” and “Bay of Bengal and Andaman Sea” may appear as necessary
later in the report.
South Asia: Bangladesh (the People’s Republic of), Bhutan (the Kingdom of), India (the Republic
of), Maldives (the Republic of), Nepal (Federal Democratic Republic of), Pakistan (Islamic Republic
of) and Sri Lanka (the Democratic Socialist Republic of).
Southeast Asia: Brunei Darussalam, Cambodia (the Kingdom of), Indonesia (the Republic of),
Lao PDR (People’s Democratic Republic), Malaysia, Myanmar (the Union of), Philippines (the
Republic of the), Singapore (the Republic of), Thailand (the Kingdom of), Timor-Leste (the
Democratic Republic of) and Viet Nam (the Socialist Republic of).
China: China PR (People’s Republic of), Hong Kong SAR (Special Administrative Region of China)
and Taiwan POC (Province of China).
Other Asia: Iran (Islamic Republic of), Japan, Kazakhstan (the Republic of), Korea DPR
(Democratic People’s Republic of), Mongolia, Korea, RO (Republic of), Tajikistan (the Republic
of) and Uzbekistan (the Republic of).
Oceania: American Samoa, Australia, the Cook Islands, Fiji Islands (the Republic of the), French
Polynesia, Guam, Kiribati (the Republic of), the Marshall Islands, the Federated States of
Micronesia (FSM), Nauru (the Republic of), New Caledonia, New Zealand, Niue (the Republic
of), Norfolk Island, Northern Mariana Islands (the Commonwealth of the), Palau (the Republic of),
Papua New Guinea (PNG), Pitcairn Island, Samoa (the Independent State of), Solomon Islands,
Tokelau, Tonga (the Kingdom of), Tuvalu, Vanuatu (the Republic of), and Wallis and Futuna Islands.
Production areas
All catches made outside the subregional areas mentioned above are excluded from this review. The
subregional areas included in this review are part of the FAO major fishing areas (MFAs) listed below. If
specifically mentioned, the data presented in the report could also correspond to other production areas,
e.g. “world production” might refer to all FAO major fishing areas.
Note: For the review of the two large marine areas, the Bay of Bengal and the South China Sea, the relevant sub-areas
have been used and are described in detail.
Species
Data on aquatic mammals, aquatic plants, corals, pearls, sponges and crocodiles from capture fisheries
are excluded.
Inland waters: Asia — Inland waters (MFA 04)
Oceania — Inland waters (MFA 06)
Marine waters: Western/Eastern Indian Ocean (MFA 51 and 57)
Northwest, Western/Eastern Central and (MFA 61, 71, 77 and 81)
Southwest Pacific Ocean


vii
Table of contents
Page
Foreword ........................................................................................................................................... iii
Preparation of this document ......................................................................................................... iv
Geographical scope of this review ................................................................................................ v
Tables ................................................................................................................................................. vii
Figures ............................................................................................................................................... xi
Introduction ....................................................................................................................................... 1
Part 1 – Capture fisheries ............................................................................................................... 3
Capture fisheries — trends in Asia and the Pacific region ........................................................ 5
Marine capture fisheries .................................................................................................... 5
Inland waters ...................................................................................................................... 6
Subregional trends from the FAO statistics ......................................................................... 6
China .................................................................................................................................. 6
Southeast Asia ................................................................................................................... 6
South Asia .......................................................................................................................... 7
Other Asia ........................................................................................................................... 7
Oceania .............................................................................................................................. 7
Issues of reporting species composition (not elsewhere included – ‘nei’) ..................... 9
Marine capture fisheries subregional fisheries assessment ..................................................... 10
Total catch and estimated MSY by country .......................................................................... 13
South China Sea and Gulf of Thailand subregion ............................................................... 14
Catch composition trends and production ........................................................................ 15
Fishery/stock assessments ............................................................................................... 17
CPUE/catch rates .............................................................................................................. 19
Low value/trash fish production ......................................................................................... 20
Fishmeal production........................................................................................................... 21
Capture production of surimi species ................................................................................ 22
Fisheries classifications ..................................................................................................... 22
Vessel numbers and employment ..................................................................................... 24
Fishery zoning and management measures (including protected areas) ........................ 24
Bay of Bengal and Andaman Sea subregion ........................................................................ 27
Catch composition trends and production ........................................................................ 27
Fishery/stock assessments ............................................................................................... 29
CPUE/catch rates .............................................................................................................. 31
Low value/trash fish production ......................................................................................... 32
Fishmeal production........................................................................................................... 33
Capture production of surimi species ................................................................................ 33
Vessel numbers and employment ..................................................................................... 34
Fishery zoning and management measures (including protected areas) ........................ 35
Interest in potential for offshore fisheries ............................................................................ 37
Inland capture fishery production ................................................................................................. 39
Historical and systematic underestimation of inland capture fishery production ......... 39
Status of enhancement of inland fisheries resources in Asia ........................................... 42
Objectives and practices ................................................................................................... 42
Investment and benefits .................................................................................................... 43
Issues and constraints ....................................................................................................... 43
Recommendations ............................................................................................................. 44

viii
Part 2 – Aquaculture trends in Asia and the Pacific region ....................................................... 45
Trends in Asia and the Pacific region ........................................................................................... 47
Species composition ....................................................................................................................... 51
Freshwater carnivorous species or species requiring higher production inputs ............. 51
Marine and brackish water carnivorous species or species requiring higher production
inputs .................................................................................................................................. 53
Other important carnivorous species ................................................................................ 55
Finfish requiring lower inputs ................................................................................................ 56
Crustaceans .............................................................................................................................. 59
Molluscs .................................................................................................................................... 61
Aquatic plants ........................................................................................................................... 62
Reptiles and amphibians ........................................................................................................ 63
Niche aquaculture species ..................................................................................................... 63
Subregional trends .................................................................................................................. 63
South Asia .......................................................................................................................... 63
Southeast Asia ................................................................................................................... 65
China .................................................................................................................................. 65
Other Asia ........................................................................................................................... 68
Oceania .............................................................................................................................. 69
Part 3 – Regional policy issues ...................................................................................................... 71
The impact of climate change on the fisheries sector in Asia ................................................... 73
How Asia will be impacted by climate change ..................................................................... 75
Implications for the fisheries sector in Asia ........................................................................ 75
Implications for governance ................................................................................................... 77
Actions for adaptation and mitigation .................................................................................. 77
International and regional agreements ......................................................................................... 79
Binding agreements ................................................................................................................. 79
Voluntary agreements ............................................................................................................. 81
Table of contents (continued)
Page
ix
Tables
Table 1 Capture production in Asia and the Pacific region (by subregion) for major nei groups
and the contribution of nei groups to total catch............................................................. 9
Table 2 Fishing areas or management areas by country ............................................................ 12
Table 3 Total catch and estimated MSY for country areas .......................................................... 13
Table 4 Trends in catch composition for the assessed fisheries areas in the South China
Sea ................................................................................................................................... 16
Table 5 Composition of catch landings by major resource groupings in the South China
Sea ................................................................................................................................... 16
Table 6 Status of fisheries/species groups for fisheries in the South China Sea areas ............. 18
Table 7 Trends in CPUE/catch rates by gear for the assessed fisheries in the South China
Sea areas ......................................................................................................................... 19
Table 8 Detailed trends in CPUE/catch rates by gear or resource for the assessed South China
Sea fisheries areas .......................................................................................................... 20
Table 9 Production of trash fish/low value fish for the South China Sea fisheries areas ........... 21
Table 10 National production, import and export of fishmeal in countries bordering the South
China Sea......................................................................................................................... 21
Table 11 Production of surimi and catch of fish (raw material) from which it is derived .............. 22
Table 12 Typical species used for surimi production ..................................................................... 22
Table 13 Classification of small-scale and commercial fisheries .................................................. 23
Table 14 Number and type of fishing vessels in the assessed fisheries (by area) ...................... 24
Table 15 Employment in the South China Sea fisheries (and associated areas) ........................ 25
Table 16 Fishing zones of the countries in Southeast Asia ........................................................... 25
Table 17 Examples of management measures used in the different fisheries (by zone) ............. 26
Table 18 Marine protected areas and areas where fishing is restricted or excluded ................... 26
Table 19 Trends in catch composition for the assessed Bay of Bengal fisheries areas .............. 28
Table 20 Composition of catches by major resource groupings ................................................... 28
Table 21 Status of fisheries/species groups for fisheries in Bay of Bengal fisheries areas ......... 30
Table 22 Trends in CPUE/catch rates by gear for the assessed Bay of Bengal fisheries
areas ................................................................................................................................. 31
Table 23 Detailed CPUE/catch rates by gear or resource for the assessed Bay of Bengal
fisheries areas .................................................................................................................. 32
Table 24 Production of trash/low value fish for the assessed Bay of Bengal fisheries areas ...... 33
Table 25 Production, import and export of fishmeal ...................................................................... 33
Table 26 Production of surimi and catch of fish (raw material) from which it is derived .............. 34
Table 27 Number and type of fishing vessels and employment in the assessed Bay of Bengal
fisheries (by area) ............................................................................................................ 34
Table 28 Employment in the assessed Bay of Bengal fisheries (by area, excluding Myanmar) . 35
Table 29 Fishing zones of the countries in South and Southeast Asia with waters in the East
Indian Ocean .................................................................................................................... 35
Table 30 Examples of management measures used in the different Bay of Bengal fisheries
(by fishing zone) ............................................................................................................... 36
Table 31 Marine protected areas and areas where fishing is restricted or excluded ................... 36
Table 32 Potential yield estimates of various offshore resources in the South and Southeast
Asia regions provided (tonnes) ........................................................................................ 37
Table 33 Approaches for enhancement and conservation of inland fisheries resources in
Asia ................................................................................................................................... 42
Table of contents (continued)
Page

x
Tables
Table 34 Top ten global aquaculture producer states in 2008, by quantity and value (excluding
aquatic plant production) ................................................................................................. 47
Table 35 Top fifteen cultured species in Asia and the Pacific region by quantity (excluding
aquatic plants and molluscs) ........................................................................................... 50
Table 36 Aquaculture production reported under marine fishes nei, 2006 and 2008 .................. 56
Table 37 Top eight producer States of tilapia, 2008 ...................................................................... 57
Table 38 Countries exporting tilapia, 2008..................................................................................... 57
Table 39 Top ten producer States of carps and barbs, 2008 ........................................................ 58
Table 40 Top four producer States of milkfish, 2008 ..................................................................... 58
Table 41 Top ten producers of Penaeid shrimp, 2008 ................................................................... 59
Table 42 Top eight producers of freshwater prawn, 2008 ............................................................. 60
Table 43 Top ten producers of lower value molluscs, 2008 .......................................................... 61
Table 44 Top ten producers of higher value molluscs, 2008 ......................................................... 62
Table 45 Top ten producers of aquatic plants, 2008 ...................................................................... 62
Table 46 Top ten cultured species of aquatic plants, 2008 ........................................................... 62
Table 47 Niche aquaculture species, 2008 .................................................................................... 63
Table 48 How climate change could directly affect the fisheries sector ....................................... 73
Table 49 Review of parties to global conventions and agreements .............................................. 80
Table 50 Countries that have started the process of implementing the FAO IPOA through
development of an NPOA or other measures equivalent in national planning
documents ........................................................................................................................ 83
Table of contents (continued)
Page

xi
Table of contents (continued)
Page
Figures
Figure 1 Trends in global capture production by region for inland and marine fisheries ............. 5
Figure 2 Subregional trends in capture production by species group .......................................... 8
Figure 3 Capture productions in Asia and the Pacific region by detail of reporting ..................... 9
Figure 4 Outline of the two subregions and the areas included in this review ............................. 11
Figure 5 South China Sea fish biomass abundances between 1960 and 1980 .......................... 16
Figure 6 Fishery/stock assessments for the assessed fisheries areas of the South China
Sea ................................................................................................................................... 18
Figure 7 Outline of the area covered by the Bay of Bengal and Andaman Sea subregions ....... 27
Figure 8 Indicative fishery/stock assessments for the assessed fisheries areas ........................ 30
Figure 9 Changes in reported production that contributed to more than 30 percent of the
APFIC regional total change in the same year (top graph) and the total regional
change for inland capture fishery catches 1950–2007 (bottom graph) ......................... 40
Figure 10 Historically modelled data of inland water capture fisheries catch in the APFIC region 41
Figure 11 Trends in global aquaculture production (quantity and value) 1984–2008 (excluding
aquatic plants) .................................................................................................................. 48
Figure 12 Trends in aquaculture production in Asia and the Pacific region by environment
1980–2008 ....................................................................................................................... 49
Figure 13 Changes in freshwater carnivorous species production, 1979–2008 in Asia and the
Pacific region.................................................................................................................... 51
Figure 14 Marine and brackish water carnivorous species production 1979–2008 ....................... 54
Figure 15 Trends in aquaculture production in Asia by major species groups (excluding aquatic
plants) ............................................................................................................................... 64
Figure 16 Aquaculture production of major species in South Asia ................................................. 65
Figure 17 Aquaculture production of major species in Southeast Asia .......................................... 66
Figure 18 Trends in aquaculture production in China by environment, 1980–2008 ...................... 67
Figure 19 Trends in top eight cultured species in China (aquatic plants and molluscs included) . 67
Figure 20 Production trends of major cultured carnivorous species in China ................................ 68
Figure 21 Aquaculture production of major species groups in Other Asia ..................................... 68
Figure 22 Top eight species produced by aquaculture in Oceania ................................................. 69

xii

1
Introduction
Fish and fishery products make an enormous contribution to the nutrition and wellbeing of the peoples
of Asia and the Pacific region, possibly exceeding their contribution in any other region of the world.
The quantities produced and the sheer diversity of species and products from inland and marine waters
that exist in the region is clear testimony to a deep-rooted tradition of fish consumption.
The Asia-Pacific Fishery Commission (APFIC) biennial review Status and potential of fisheries in Asia
and the Pacific is intended to provide updated information on emerging issues relevant to fisheries and
aquaculture, and to summarize regional information to describe some of the key trends that affect these
resources and production systems. The sources of data for this review are extensive, but several primary
sources must be acknowledged:
■ National correspondents – country information was requested from country correspondents
who are fisheries professionals working in the area of fisheries resources and have access to
a wide range of national data.
■ FAO/APFIC/SEAFDEC workshops – Report of the FAO/SEAFDEC/APFIC 2nd Workshop on
the Assessment of Fishery Stock Status in South and Southeast Asia 5–9 October 2009
Bangkok, Thailand (proceedings published as FAO Technical Report No. 940).
For its biennial review for 2010, APFIC went beyond an analysis of aggregated official statistics and
worked closely with fishery professionals in the region to provide more disaggregated information on
local trends that underlie some of the “big picture” statistics. This is part of a major shift towards
ecosystem level reporting requested by the APFIC members at its thirtieth session. In this regard, APFIC
has modified the analysis of marine capture fisheries to focus on two marine areas: the Bay of Bengal
and the South China Sea.
Compiling data from a variety of sources at the ecosystem level goes beyond national capture production
statistics and enables a clearer overall picture of the fisheries. By using a range of indicators related to
fishing and fishery resources, the social, economic and environmental characteristics of these fisheries
can be viewed as interrelated components rather than isolated data or stand – alone trends.
This approach is in line with the recommendation of the thirtieth APFIC session to promote ecosystem
approaches to management. Presentation of information in this format enables policy issues to be viewed
in a broad context and our understanding of how these issues relate to other aspects of fisheries and
aquaculture management to be increased. It is expected that this review will also encourage APFIC
member countries to look deeper into the information and statistics that they collect, regularly or
occasionally, with a view to present them in a more integrated, holistic manner, thereby broadening the
analysis and improving understanding of trends in the region’s fisheries and aquaculture.
As with all reviews of this nature, the information provided will raise more questions than it answers. It
is intended that this biennial review will be updated regularly, allowing some of these indicators to be
tracked over time. In some cases only individual “snapshots” are available and it is hoped that these
will encourage further tracking and analysis where there are gaps or patchy information preventing better
understanding. This review also serves the purpose of highlighting those areas where more information
is needed and where trends need to be tracked.

iv

3
Part 1
Capture fisheries

iv
5
Capture fisheries — trends in Asia and the Pacific region
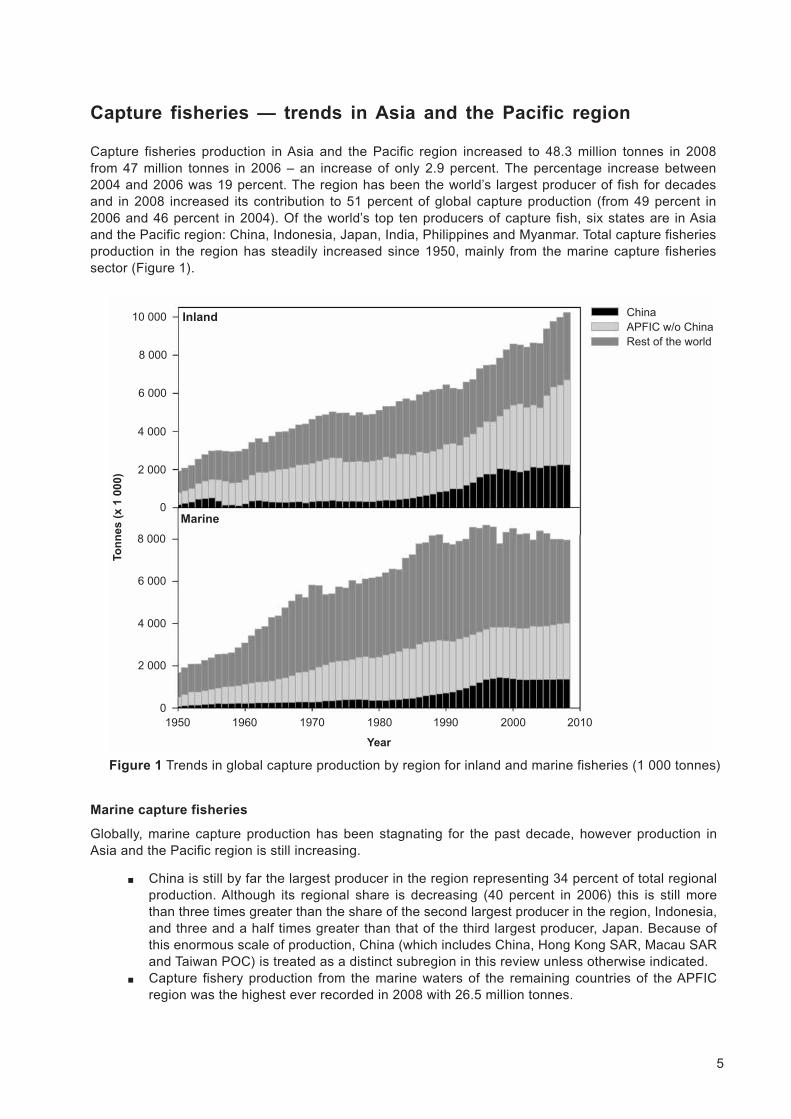
Capture fisheries production in Asia and the Pacific region increased to 48.3 million tonnes in 2008
from 47 million tonnes in 2006 – an increase of only 2.9 percent. The percentage increase between
2004 and 2006 was 19 percent. The region has been the world’s largest producer of fish for decades
and in 2008 increased its contribution to 51 percent of global capture production (from 49 percent in
2006 and 46 percent in 2004). Of the world’s top ten producers of capture fish, six states are in Asia
and the Pacific region: China, Indonesia, Japan, India, Philippines and Myanmar. Total capture fisheries
production in the region has steadily increased since 1950, mainly from the marine capture fisheries
sector (Figure 1).
Figure 1 Trends in global capture production by region for inland and marine fisheries (1 000 tonnes)
10 000
8 000
6 000
4 000
2 000
0
8 000
6 000
4 000
2 000
0
�1950� 1960� 1970� 1980� 1990� 2000� 2010
Year
To
nn
es (
x 1
000)
Inland
Marine
China
APFIC w/o China
Rest of the world
Marine capture fisheries
Globally, marine capture production has been stagnating for the past decade, however production in
Asia and the Pacific region is still increasing.
■ China is still by far the largest producer in the region representing 34 percent of total regional
production. Although its regional share is decreasing (40 percent in 2006) this is still more
than three times greater than the share of the second largest producer in the region, Indonesia,
and three and a half times greater than that of the third largest producer, Japan. Because of
this enormous scale of production, China (which includes China, Hong Kong SAR, Macau SAR
and Taiwan POC) is treated as a distinct subregion in this review unless otherwise indicated.
■ Capture fishery production from the marine waters of the remaining countries of the APFIC
region was the highest ever recorded in 2008 with 26.5 million tonnes.
6
■ Southeast Asia has continued to increase its production and has maintained the largest share
(excluding China) of the APFIC region since 1994 (Figure 2).
■ There has been a relatively moderate increase in South Asia.
■ The subregion Other Asia used to be the top contributor to capture fishery production in the
region, but has continuously declined since 1988, a trend that now shows signs of levelling
off. This can partly be explained by the facts that the Japanese and DPR Korea fisheries are
not decreasing at the same rate as in previous years and the production of the Republic of
Korea has been increasing.
■ In terms of production increases, the largest share of the region’s 2.9 percent increase
over 2006 is from the subregions other than China, which increased 3.9 percent compared to
1.0 percent for the China subregion.
Inland waters
Inland capture fisheries production in the region grew by 6.0 percent between 2006 and 2008 compared
to a growth rate of only 1.3 percent between 2004 and 2006.
■ This region contributes 65.6 percent of global inland fisheries production (64.8 percent in 2006).
■ In inland waters, excluding China, total production of the region reported in 2008 was 4.5 million
tonnes (4.1 million tonnes in 2006).
■ For the Chinese subregion, inland production was 2.2 million tonnes in 2008, representing
33.5 percent of the total regional catch (6.7 million tonnes in 2008).
This overall increase in inland fisheries is probably a result of more enhancement and growing effort as
this increases the yield. However, part of the increase is probably because of a significant re-evaluation
of the contribution of inland fisheries – this greatly revised the previous underestimates upwards (and
is covered in depth in the section “Historical and systematic underestimation of inland capture fishery
production” page 39). This is also a cause for concern when analyzing the inland fisheries status and
trends: if the reported increasing production mainly relies on improved reporting, then the real production
may de facto be decreasing. This would be in line with feedback from fishers reporting general decreasing
catches. However, it should also be noted that there is an increasing number of fishers in the sector as
predicted in the 2008 biennial report. Additionally, inland capture fisheries production in Thailand has
been estimated at 1.0 million tonnes, compared to the reported 0.2 million tonnes (Lymer et al., 2008).
Subregional trends from the FAO statistics
China
Total capture fishery production in the China subregion was 15.1 million tonnes in 2008. The production
figure has been relatively stable since 2000 although there have been fluctuations in recent years
(+0.5 percent since 2006).
■ Production of pelagic marine fish and marine fish “not elsewhere included” (nei) increased by
2.6 and 3.9 percent respectively in 2007 and 2008 and now makes up 38 percent of the total
catch.
■ Demersal fish production is at an almost identical level as in 2006, comprising 24 percent of
total catch (Figure 2).
■ Freshwater fish show a continued increasing production trend (+4.1 percent since 2006)
■ Mollusc and crustacean production show decreases (-14.1 and -6.5 percent respectively).
■ Cephalopod production continues to increase (+18.5 percent) and total production was almost
0.7 million tonnes in 2008.
Southeast Asia
Increase in capture fishery production in Southeast Asia has also been very strong in the past four
decades with marine capture production increasing almost linearly throughout this period. The total
capture production in 2008 was 16.1 million tonnes (Figure 2). The main species groups are pelagic
marine fish and marine fish nei.

7
■ The production of marine fish nei keeps growing strongly (an average of 4.3 percent since
2006). Southeast Asia is a major driving force of the overall production growth for this group
of non-identified species.
■ Pelagic marine fish production has increased (an average of 5.5 percent since 2006).
■ Demersal marine fish production has increased (an average of 5.5 percent since 2006).
■ Production of crustaceans and molluscs has also increased since 2006.
■ Production of freshwater and diadromous fishes has increased (an average of 10 percent since
2006).
■ Production of “aquatic animals” has decreased on average by more than 80 percent since 2006.
South Asia
Capture fishery production in the South Asian subregion has grown continuously since 1980, with a small
dip in production in 2004. The region has more than doubled its capture production from 3.1 million
tonnes in 1980 to 6.6 million tonnes in 2008 and increased capture production by 5.5 percent since
2006 and 18 percent since 2004 (Figure 2).
■ Among marine species, both pelagic fishes and demersal fishes showed almost parallel
increasing trends with similar levels of production in 2008 (1.4 million tonnes and 1.3 million
tonnes, respectively).
■ Production of marine demersal fish has increased by 15 percent since 2006.
■ Production of pelagic fish has increased by 5.5 percent.
■ Freshwater fish and diadromous fish have been the number one production group for the last
four decades (except in 1992) and achieved very rapid growth in the 1990s and in the previous
biennium (37 percent between 2004 and 2006) but only increased by 2 percent since 2006.
■ Crustacean production has been relatively stable.
■ Production of cephalopods in this region is declining (Figure 2).
■ Mollusc production has risen by 140 percent since 2006, however the volume is still relatively
small (12 000 tonnes in 2008).
Other Asia
In the Other Asia subregion, total production increased to a peak production of 13.6 million tonnes in
1988, and thereafter decreased steadily until 2000. This now (in 2008) totals 6.5 million tonnes and the
decline has levelled off, with production relatively stable over the last five years, with a slight increase
of 2 percent since 2006 (Figure 2).
■ The largest production figure is for pelagic marine fish with 50 percent of the catch composition.
The production of pelagic marine fish has been relatively stable in the first half of this decade
and increased by 0.5 percent between 2006 and 2008.
■ Notably, the production of marine fish nei has increased by 11.5 percent in this region since
2006; however, compared to other regions, it still makes up a relatively small percent of the
total catch (7 percent in 2008).
■ The production of freshwater and diadromous fish and crustaceans decreased between 2006
and 2008 by 9.8 and 12.3 percent respectively.
Oceania
Oceania’s capture production also consists mainly of fish taken from marine waters, but unlike Other
Asia there was an increasing trend until 2006 (Figure 2). In 2006 there was a rapid drop of almost
7 percent compared to the year before and this trend has continued with a 12 percent drop between
2006 and 2008. The decrease can also be seen in the absolute values of pelagic marine fish, demersal
marine fish, crustaceans, cephalopods and marine fish nei. Declining catches in the fisheries within
Australia’s EEZ can partly be explained by a reduction in effort and in lower catches following a structural
adjustment and a ministerial direction in 2005 aimed at ending overfishing and allowing overfished stocks
to rebuild. The economics of fishing are expected to improve in the medium and long term, but higher
profits can also be expected for individual fishers in the short term because fewer vessels are operating.

8
Figure 2 Subregional trends in capture production by species group
20 000
15 000
10 000
5 000
0
15 000
10 000
5 000
0
6 000
4 000
2 000
0
10 000
5 000
0
1 200
1 000
800
600
400
200
0
China
Southeast Asia
South Asia
Other Asia
Oceania
To
nn
es
(x
1 0
00
)
Year
�1950� 1960� 1970� 1980� 1990� 2000� 2010
Molluscs
Miscell aquat anim prod
Marine fishes
Freshwater fishes
Diadromous fishes
Crustaceans
Aquatic animals nei
Cephalopods

9
Issues of reporting species composition (not elsewhere included – ‘nei’)
There remains a considerable proportion of the region’s capture production that is not identified at the
species level but instead is recorded as marine/freshwater fish nei, marine/freshwater molluscs nei and
marine/freshwater crustaceans nei (Figure 3). In 2008, 14.3 million tonnes or 30 percent of capture
production in Asia and the Pacific region was not identified at species, genus, or family level. In 2006,
the region produced 14 million tonnes that was reported as nei, representing 31 percent of the catch.
■ The quantity reported under these categories has been increasing significantly in recent years
for some subregions, which indicates a worrying trend in the quality of the available statistical
information.
■ The biggest producers of nei fish (Southeast Asia, China and South Asia) also report the least
disaggregated data (Table 1).
■ It is notable that China has improved its reporting on individual species. The reporting on nei
species has been reduced from 52 percent of reported capture production in 2002 to 31 percent
in 2008 (Table 1).
■ The incease in reporting of nei fish may also reflect a strong trend towards the capture of
smaller lower-value species. The percentages of these are high in the assessed catch
composition (see Table 5). These small, low value or trash fish species may not be considered
worth reporting in detail as part of catch landings. This hides the effects of overfishing on the
capture of juveniles of higher value species.
■ An alternative explanation is that the quality of catch landing statistics is deteriorating.
Table 1 Capture production in Asia and the Pacific region (by subregion) for major nei groups and the
contribution of nei groups to total catch (x 1 000 tonnes)
ChinaSoutheast
South Asia Other Asia OceaniaAsia
Marine fishes nei 2 103 4 868 991 495 60
Marine molluscs nei 646 80 12 2 4
Marine crustaceans nei 0 9 81 17 2
Freshwater fishes nei 1 615 1 588 1 361 13 8
Freshwater molluscs nei 268 63 0 2 2
Freshwater crustaceans nei 0 4 80 0 0
Total of included nei groups 4 633 6 613 2 524 529 77
Total capture production 15 141 16 133 6 591 6 467 1 096
Total % contribution of nei groups 31% 41% 38% 8% 7%
50 000
40 000
30 000
20 000
10 000
0
To
nn
es
(x
1 0
00
)
� 1950� 1960� 1970� 1980� 1990� 2000� 2010
Year
“Nei”
Detailed
Figure 3 Capture productions in Asia and the Pacific region by detail of reporting

10
Marine capture fisheries subregional fisheries assessment
There is a general perception globally that fishery resources are declining and that the marine
environment is deteriorating as a result of fishing and other human activities. Although there is evidence
that this is occurring throughout the world, there are signs that fisheries are responding positively to
effective management. The global evidence however is not particularly comprehensive and most of the
information on effective management comes from developed country fisheries, typically in the more
temperate regions of the world.
In South and Southeast Asia, catch trends are generally showing consistent increases that may be
masking underlying fishing effects such as serial depletion of higher trophic level species (e.g. large
demersal and pelagic species, sharks and rays) and a tendency towards faster recruiting species from
a lower trophic level (small pelagic species, small demersal species, squids, low value/trash fish species).
The expansion of new areas and transhipment of species between fishing areas complicates trend
reporting by area and the determination of the status of stocks in specific localities. The combination of
a lack of detailed information on and limited critical analysis of fish stocks trends mean that a clear
message regarding the need for action to implement management measures cannot be clearly
communicated. It also leads to the false assumption that there remains significant potential for further
expansion of fishing.
Appropriate knowledge, analysis and communication of stock status are needed to enable decision-
makers to develop appropriate harvest strategies to ensure sustainability of fishing activities and fishery
resources.
In the 2006 report on the status and potential of fisheries and aquaculture several recommendations
were made to member countries to improve the disaggregation of marine capture species composition
data, including a recommendation to conduct targeted surveys to assess composition of nei reports to
get better estimates. Following on from this, APFIC together with FAO and SEAFDEC and member
countries conducted a series of workshops (FAO, 2009a and FAO, 2009b) to explore the idea of using
existing information, including fishery-dependent data, scientific surveys and expert opinion to understand
trends in stock development of marine resources.
Fisheries assessments were conducted by national consultants for selected areas/fisheries in Asia and
the Pacific region. For each of these areas time series data were collected/compiled for the following
variables: catch trends of larger groupings of fish (large, high value demersal species, large pelagic
species, sharks/rays, small pelagic species, trash fish/low value fish (plus nei), squids/cuttlefish/octopus
and crustaceans); production of fishmeal, surimi and trash fish; CPUE/catch-rates; fishery/stock
assessment; fishing vessel capacity and employment; fishery zoning; management measures; protected/
reserved areas; and the incidence and impacts of tropical storms and other natural disasters. However,
it should be noted that there is incomplete coverage for all variables in these areas. The data for selected
fisheries were sorted by area and were summarized and collated into two larger subregions (Figure 4):
South China Sea and Gulf of Thailand subregion, including FAO fishing areas 61 and 71 (SCS region,
shaded in green) and Bay of Bengal and Andaman Sea subregion, including FAO fishing area 57 (BoB
subregion, shaded in grey).
For the South China Sea subregion (SCS) data for assessed fisheries and supporting fisheries
management information were used from the following areas:
■ China (northern South China Sea part, covering three provinces in the Beibu Gulf and the
northern shelf);
■ Viet Nam (whole country);
■ Philippines (whole country);
■ Thailand (east coast, Gulf of Thailand);
■ Malaysia (Peninsular east coast, Sarawak and Sabah); and
■ relevant fishing areas from Indonesia (FMA 711).

11
For the Bay of Bengal (BoB) subregion the data (for assessed fisheries) were used from:
■ Sri Lanka (whole country);
■ India (east coast);
■ Bangladesh (whole country);
■ Thailand (Andaman Sea/west coast);
■ Malaysia (Malacca straits/Peninsular west coast); and
■ relevant fishing areas from Indonesia (FMA 571, FMA 572).
The details of the fishing areas and their geographical descriptions are presented in Table 2.
Note that the data for the compilation into these two subregions is not based on complete geographical
coverage (i.e. there are only partial data for Myanmar and no data for Cambodia); also note that additional
data are included (e.g. from bordering areas such as the Philippines).
Despite the fact that these assessments and the data are not comprehensive, these subregional
assessments do provide a picture of the status of stocks and resources in the region. Since this sort of
synthesized assessment is not yet available at an ecosystem or ecoregion level, it is intended that
this information will be used to complement other assessments and catch databases for the region
(e.g. FAO FishStat, SEAFDEC, Bay of Bengal LME, ASEAN/BIMSTEC Working Groups on Fisheries),
to identify gaps in data needs as well as to initiate more holistic assessments of resources at subregional
levels.
Figure 4 Outline of the two subregions and the areas included in this review
Bay of Bengal
subregion
South China Sea
subregion
The following two sections (SCS and BoB subregions) describe and discuss these fishery related areas
from a regional perspective based on country/area reports:
■ Catch composition trends and production;
■ CPUE/catch rates;
■ fishery/stock assessment;
■ fishing vessel capacity and employment;
■ fishery zoning and management measures (including protected areas); and
■ impacts of tropical storms and other natural disasters.
For each of the two subregions a review of the status of the resources and fisheries is given at the end
of each of the two sections.

12
Table 2 Fishing areas or management areas by country
Countries Fishing Areas
Bangladesh South patches (6 200 km2) 60–80 m depth (91°10’E – 91°50’E; 21°10’N – 21°40’N squares 302–305,
402–405, 502–505 and adjacent waters
Middle ground (4 600 km2) 80–100 m depth
■ Southwest of south patches (90°30’E – 91°40’E; 20°45’N – 21°10’N, squares 603–609, 703–709 and
adjacent waters)
■ East of swatch of no-ground (90°00’E – 90°40’E; 21°00’N – 21°25’N Squares 509–512, 609–612)
Swatch of no-ground (3 800 km2) submarine canyon type, depth of 800–1000 m
Cambodia
China Northern shelf, South China Sea
(North SCS) Beibu Gulf (Gulf of Tonkin)
India Northeast coast: Orissa, West Bengal
Southeast coast: Tamil Nadu & Puducherry, Andhra Pradesh
Southwest: Goa, Karnataka, Kerala
Northwest: Gujarat, Maharashtra
Andaman & Nicobar Islands; Lakshadweep Islands
Indonesia Indonesian fishery management areas (FMAs) (AFMR, 2005. Assessment of Fisheries Management Area)
■ 571 Malacca Strait (135 522 km2)
■ 572 Indian Ocean (Western Sumatra) (938 944 km2)
■ 573 Indian Ocean (South of Java) (779 110 km2)
■ 711 Natuna Sea (577 451 km2)
■ 712 Java Sea (423 290 km2)
■ 713 Makassar Strait – Flores Sea (1 567 135 km2)
■ 714 Banda Sea (673 602 km2)
■ 715 Tomini Bay, Seram and Molucca Seas and Bintuni Bay (543 609 km2)
■ 716 Sulawesi, Halmahera Seas
■ 717 West Pacific Ocean (including Sulawesi and Halmahera Seas 1 037 376 km2)
■ 718 Arafura and Timor Sea (481 511 km2)
Malaysia South China Sea
■ Peninsular east coast
■ Sabah
■ Sarawak
Peninsular West Coast
■ Malacca Straits
■ Peninsular west coast
Myanmar Coastline 2 832 km, EEZ area 486 000 km2
Philippines Luzon, Visayas, Mindanao
Sri Lanka 15 districts for enumeration and landings: Puttalam, Chilaw, Colombo, Negombo, Kalutara, Galle,
Matara, Tangalle, Kalmunai, Batticaloa,Trincomalee, Mullaithivu, Kilinochchi, Jaffna, Mannar
Thailand East coast/Gulf of Thailand fishery management area
Fishery statistical areas:
■ Fishing ground 1: Eastern Gulf of Thailand consisting of the seas off the provinces of Trad, Chanthaburi
and Rayong.
■ Fishing ground 2: the Inner Gulf consisting of the seas off the provinces of Chon Buri, Chachoengsao,
Samut Prakan, Bangkok Metropolitan, Samut Sakon, Samut Songkhram, and Phetchaburi.
■ Fishing ground 3: Upper western Gulf of Thailand consisting of the seas off the provinces of Prachuab
Khiri Khan, Chumphon, and Surat Thani.
■ Fishing ground 4: Lower western Gulf of Thailand consisting of the seas off the provinces of Nakhon
Si Thammarat, Songkhla, Pattani and Narathiwat.
■ Fishing ground 5: Mid-Gulf of Thailand consisting of the seas in the mid-Gulf that extend southward to
the international boundary line between Thailand and Kingdom of Cambodia and Thailand and Malaysia.
Andaman sea fishery management area
Fishery statistical areas:
■ Fishing ground 6: Upper Andaman Sea consisting of the seas off the provinces of Ranong,
Pang-nga, and Phuket.
■ Fishing ground 7: Lower Andaman Sea consisting of the seas off the provinces of Krabi, Trang, and Satun.
Viet Nam Northern area: comprising nine provinces from Quang Ninh to Quang Binh
Central area: comprising nine provinces from Quang Tri to Ninh Thuan
Southeast area: comprising eight provinces from Binh Thuan to Bac Lieu
Southwest area: comprising Ca Mau and Kien Giang only.
Sources: Country correspondent reports and national reports

13
Total catch and estimated MSY by country
Maximum sustainable yield (MSY) is a measure used to express the average maximum level of production
that a fish stock or fishery can sustain without suffering a decline in stock abundance. This is also
sometimes expressed in aggregate terms for an entire fishery as the total potential yield, thus including
all the species caught in the fishery. The use of total potential yield for an entire fishery may be misleading
since the complex composition of tropical fisheries means that individual species can suffer severe
depletion, but compensation by fast-growing small species continues to provide the same or even
a higher total weight of catch from the fishery. In this way, extended periods of excess fishing pressure
can greatly modify the species composition within a fishery, tending towards the reduction of abundance
of more valuable (and often more vulnerable) larger species and the proliferation of lower-value small
species. Under heavy fishing pressure, even these small, usually highly productive species start to decline
and the fishery actually exhibits declining production. In the tropical fisheries of the South China Sea
and the Bay of Bengal, these effects are already being seen either at species or fishery level. Therefore,
combining all species caught in a fishery in a single assessment may cover up serious overfishing effects
for some of the species and lead to depletions and changes in species composition, even though total
catches may be maintained.
Table 3 Total catch and estimated MSY for country areas
Country Catch Estimated MSY Area
China 1980s 530 000–710 000 1 000 000–1 200 000 Northern Shelf & Beibu Gulf (Gulf of Tonkin)
Viet Nam 2004 1 724 200 1 500 000–1 600 000 National figure. Total biomass estimated at
5 075 143 tonnes. Demersal biomass 1 174 261;
large pelagic 1 156 032; small pelagic 2 744 850
tonnes
~double MSY 582 212 Nearshore zone (50 m depth)
(Pomeroy et al., 2008)
Thailand 2007 1 447 898 2 159 049 East Coast/Gulf of Thailand
2007 631 453 912 943 Andaman sea
Indonesia 2008 4 702 933 5 120 000 National figure
20081 66 100 FMA 711 – Large pelagic group
621 500 FMA 711 – Small pelagic group
334 800 FMA 711 – Demersal group
11 900 FMA 711 – Penaeid shrimps group
27 700 FMA 571 – Large Pelagic group
147 300 FMA 571 – Small Pelagic group
82 400 FMA 571 – Demersal group
11 400 FMA 571 – Penaeid shrimps group
164 800 FMA 572 – Large Pelagic group
315 900 FMA 572 – Small Pelagic group
68 900 FMA 572 – Demersal group
4 800 FMA 572 – Penaeid shrimps group
Malaysia 2008 1 409 929 1 616 988 National potential yield
62 000 West coast peninsular demersal potential yield
155 500 West coast peninsular small pelagic potential yield
55 500 East coast peninsular demersal potential yield
366 500 Eest coast peninsular small pelagic potential yield
86 661 Sarawak demersal potential yield
38 327 West coast Sabah demersal potential yield
852 500 Sarawak and west coast Sabah small pelagic
potential yield
No declared MSY. Potential yield estimated as
a management tool for vessel and gear numbers
Philippines 2008 2 559 191 2 500 000 National figure
Bangladesh 2008 514 644 MSY not established Estimated pelagic biomass 319 000 tonnes [1973];
(MFO, 2009) estimated demersal biomass 1 560 000 tonnes
[1986]. A 50% estimate for MBSY is ~939 500
tonnes
Sri Lanka 2009 293 170 MSY not established Estimated potential yield 250 000 tonnes/year
(170 000 pelagic, 80 000 demersal)
India 2009 3 160 000 3 930 000 National figure
Myanmar 2007 1 679 000 1 050 000 National figure based on marine fishery stock
assessment survey conducted by FAO from 1980
to 1983
1 Purwanto, S. Nurhakim and Wudianto (2010)

14
MSY can still be a criterion used to judge if a fishery is overfished or production of a fishery exceeds
the level that may cause serious long-term impacts. The methods for the calculation of MSY vary from
relatively complex methods to simpler surplus-production models that only require time series of catch
and effort data. Even simpler methods can be used (e.g. Gulland’s formula) that calculate MSY as
a fraction of standing biomass. Estimating MSY is a challenge for tropical multispecies multigear fisheries
because classical methods require good time series data of individual species. In situations where
measurement of MSY may not be an appropriate tool, methodologies like the Productivity Susceptibility
Analysis (PSA) can provide useful additional information for fisheries management, as they provide risk
assessment of the species in a community that are being impacted by a given fishery/gear.
From Table 3 it can be seen that many countries appear not to have exceeded their declared or estimated
MSY for the fisheries listed. This does not necessarily suggest that fishing the Bay of Bengal and South
China Sea subregions is commensurate with the production potential of the fisheries. As indicated above,
these aggregated estimates may be misleading as important changes in species composition may be
occurring even though total catches can be maintained at a high level, at least for some time. The MSY
estimates from total yields do not take into account the species specific effects. It is important that MSY
information is supplemented with other assessment information that will also provide evidence on
individual stock status. This sort of evidence for overfishing effects can be found in subsequent tables:
■ The species composition of the catches indicates a shift towards short-lived, low trophic level
species. (Tables 4 and 5).
■ Species or resource group assessments record overfishing or depletion of larger, longer-lived
and more valuable species. (Table 6).
■ CPUE (catch per unit effort) appears to be declining for many of the assessed stocks, fishing
gears or fisheries (Tables 7 and 8).
■ Trash fish quantities are increasing and form significant percentages of catches. (Table 9).
There have been clear ecosystem level effects, however data for the past ten years (based on reports
provided for this review) may indicate that the South China Sea area has reached a low level plateau
and the shifts in composition from previous decades have now settled down to favour an ecosystem
dominated by small species. These shifts may not be observed in aggregated catch statistics provided
to FAO, but are evident from national records and this emphasizes the need to look more deeply into
the national catch statistics. These lower value species are being utilized for various ways (surimi, canned
fish, fishmeal, aquaculture feeds), but the loss has been in the higher value larger species and thus
fishers are having to work harder to catch a lower value product. In economic terms, this is rather
inefficient, however it may also reflect the tendency towards maximizing employment in the fishery at
the expense of economic efficiency and product quality in many of the developing countries that comprise
this region.
The picture for the Bay of Bengal is less clear. This area does not have the same area of productive
shelf fisheries as the South China Sea and is more dominated by pelagic resources. They are still subject
to overfishing and depletion in some areas. Recent fisheries expansion is also driving these fisheries
towards reduction of higher value, larger species resources.
South China Sea and Gulf of Thailand subregion
Historically, there have been large and widespread changes in the fish fauna of the South China Sea
(Figure 5). These changes include changes in species composition whereby the abundance of the more
valuable fishes (groupers, snappers, sharks and rays) has decreased sharply whereas the abundance
of smaller, less valuable species has increased (e.g. cardinal and trigger fishes). The production trends
of the past ten years do not reveal the changes very clearly as the majority of the impact is presumed
to have taken place during the massive expansion of fisheries effort between 1975 and 1985. The picture
that emerges is one of a subregional fishery that has been under heavy fishing pressure for more than
30 years and which has been fished down considerably. The changes were less obvious previously, but
there remains a clear trend of a declining catch of large demersal and pelagic species and a rising catch
of smaller fast recruiting species.

15
Catch composition trends and production
The catch from the assessed fisheries in the South China Sea subregion shows similar trends with an
increasing fraction of the catch being made up of smaller sized species (Table 4). The comparison of
the two maps for the South China Sea clearly show the decline in biomass across the subregion’s coastal
fisheries between 1960 and 1980. Multivariate analyses by the TrawlBase project showed differences
in species composition between the two survey periods, i.e. in the 1970s and the 1990s. The percentage
composition data from the west coast of Peninsular Malaysia generally showed that large and more
valuable species declined in relative abundance whereas species of small body sizes increased, thus
indicating a trend of “fishing down the food web”.
Table 4 presents the changes in the relative composition of major species groups. The time frame for
the data is the past decade, but trends from 1950 to the present are available for China. The relative
trends were based on a 5 percent change over the period.
■ Large demersal species: For the northern part of the South China Sea there is a trend of
decreasing catches of large demersal species (37 percent of catch in the 1950s down to
17 percent in the 1970s and it has since been stable). There is also a decline in relative catch
of large demersals in Malaysia and the Gulf of Thailand, but it is stable in the Philippines and
even increasing in Indonesia.
■ Large pelagic species: In the northern part of the South China Sea, large pelagics and sharks
and rays have disappeared from the catch since the 1970s. Conversely, there has been an
increased catch of larger pelagic species in the eastern parts of the South China Sea
(the Philippines, including areas outside the South China Sea ) and in the Gulf of Thailand
and in the southern part of the South China Sea (Indonesia) in the last ten years.
■ Sharks and rays: These have declined throughout the subregion except in the Gulf of Thailand.
■ Small demersal species: Small demersal landings have increased in the Gulf of Thailand
and in the southern part of the South China Sea (FMA 711, Natuna Sea, Indonesia), whereas
catches have remained stable in Malaysia and declined in the Philippines.
■ Small pelagic species, (including sardines and anchovies): In the northern part of the South
China Sea, small pelagic species, including sardines and anchovies, have increased from
30 to 60 percent of the catch between 1970s and 2000 onwards. In other parts of the South
China Sea, the relative catches of small pelagics have increased in all but one area, the
Philippines, where they remain stable.
■ Trash and low value fish: The relative catches of anchovies/sardines and trash fish have
declined in the South China Sea over the course of the assessments. However, they still make
up a large contribution of the total catch in the region (Table 5). This may be partly explained
by greater classification into catch destined for human consumption and the massive boom in
surimi in the region, or because of the rising costs of trawling reducing effort over the past
decade. This group is reported in detail in Table 9.
■ Surimi species: These are small demersal species, but specifically utilized for surimi production.
The relative catch of surimi species has increased in all assessed areas (Table 4). The
conversion of raw material to surimi is approximately 3.5 upwards, thus based on estimates
of surimi production a total demand for raw material can be determined. The total production
for the South China Sea area could be as high as 1 347 000 tonnes (see Table 11 later in the
report).
■ Crustaceans: In a majority of the areas the relative catch of crustaceans has declined and
the catch of sharks and rays has declined in a majority of the fisheries.

16
Figure 5 South China Sea fish biomass abundances from 1960 (left panel)
to 1980 (right panel).
Table 4 Trends in catch composition for the assessed fisheries areas in the South China Sea
China Viet Nam Philippines Thailand Malaysia Indonesia
Northern SCS all East coast all FMA 711
Time period 1950–2000 nd 1998–2008 1997–2007 2000–2008 1997–2008
Large demersal - 0 - - +
Small demersal nd - + 0 +
Large pelagic - + + 0 +
Small pelagic + 0 + + +
Anchovy/Sardine nd - - + -
Trash fish/low value fish - nd - - -
Surimi species nd nd + + +
Shark/rays - - + nd -
Squids/cuttlefish + - 0 - -
Crustaceans + - - - -
Shellfish nd 0 - 0 +
* abs (change (percent)/initial value (percent)) <0.05
The different groupings were assessed against their relative occurrence (percent): Increased (+); - Decreased (-) or were stable*
(0) over a specific time period, “nd” denotes no data available.
Source: Country correspondents
Table 5 Composition of catch landings by major resource groupings in the South China Sea (%)
China Indonesia Thailand Malaysia Philippines
(SCS) (FMA 711) (East coast) Peninsular East all
coast, Sarawak,
Sabah
>2000 2008 2007 2008 2008
Large demersal 17 8 4 4 3
Small demersal 11 12 5 9
Large pelagic 0 16 9 8 32
Small pelagic 60 41 15 29 32
Anchovy/Sardine 7 14 6 22
Trash fish/low value fish 16 4 25 13 0
Surimi species 3 7 15 0
Shark/rays 0 2 0 2 0
Squids/cuttlefish 5 2 7 9 3
Crustaceans 2 5 5 9 0
Source: TrawlBase, WorldFish Center, Penang, Christensen et al. (2003)

17
■ Northern South China Sea: From 1950 onwards the demersal catches rose until 1960 when
they began a long-term decline, although the total catch showed a rising trend because of
increasing catches of abundant low-trophic level species. There have been no fishery
assessments since the late 1980s but some catch landing data is available. Total catch
underwent a decline after 1990, indicating that even the dominating low-trophic species were
also overfished.
■ The Gulf of Thailand fishery contributes about 44 percent of the national total catch (40 percent
of which is caught outside of Thai national waters). The estimated trawlable biomass (estimated
from research trawl results) declined from 680 000 tonnes in 1961 to 560 000 tonnes in 1995.
Landing data is composed of catch from 9 gears (Otter board trawl; pair trawl; beam trawl;
purse seine; push net; anchovy purse seine; mackerel encircling gill net; king mackerel drift
gill net; bamboo stake trap). Total landings have decreased from 1 919 564 tonnes in 1999 to
1 447 898 tonnes in 2007, attributed principally to overcapacity in the fishery.
■ The Philippines has accepted 2.5 million tonnes as its maximum sustainable yield for the
marine fishery sector. In 2008, 2 559 191 tonnes of marine fish were recorded for the marine
fishery sector. Recent years have seen increasing catches of small species (up to 10 percent
of landings). However, there have also been increases of larger species and for some areas
the CPUE/catch per day is increasing.
■ Viet Nam’s annual landing of marine capture fisheries has increased rapidly over recent years
from around 0.73 million tonnes in 1990 to 2.07 million tonnes in 2007.
■ Indonesia’s FMA 711: This FMA’s fishing activities take place mainly in the coastal water in
the surrounding area with a depth of less than 70 m and mostly dominated by trawlable ground
for demersal fish. The area is a rich source of Nemipterus (for surimi production), coral reefs
and coastal neritic small pelagic fish species in the southern area at a depth of less than
40 m. Small pelagic fisheries are mostly operated in the northern part. There is no significant
legal transhipment in the overall FMA (approximately <10 percent), but there are indications
that foreign vessels are operating in the area because of access to the open part of the South
China Sea.
■ Malaysia (Peninsular east coast, Sabah and Sarawak): Total marine fish production in
Malaysia was 1.38 million tonnes in 2007 with 24 percent from the South China Sea off the
east coast of Peninsular Malaysia and the remaining 26 percent was from the South China
Sea, Sulu Sea and Celebes Sea off the coasts of Sabah and Sarawak. Inshore waters
(an area of less than 30 nautical miles from the coastline) contributed 81 percent of the catch
and fishing vessels were usually below 70 gross tonnes. This is consistent with the large number
of inshore fishing vessels, which comprise 97 percent of the country’s fishing vessels. Trawls
and purse seines are the two major gear types and contribute up to 78 percent of the landings.
Fishery/stock assessments
Stock assessments based on estimations, calculation or expert opinion, were obtained for this regional
overview. Some of this data was also presented in APFIC-related regional workshops (FAO, 2009a and
FAO, 2009b). The assessment of fisheries/stocks has received little attention in recent years, despite
its importance for decision-making in fisheries. The continued lack of this information is a major constraint
on effective communication of the changing status of various species groupings and of the extent to
which overfishing (driven by overcapacity) is occurring in this region. Basedon the stock assessments
performed for the different groups of species show that a majority of the stocks or species groupings in
the South China Sea subregion are overfished or fully-fished (Table 6). In some cases the species groups
are even scored as depleted. Figure 6 presents this visually using an indicative “traffic light” system
(note that this is an illustration rather than a definitive statement regarding the status of individual species
or stocks)
■ The heaviest fishing (indicated by depleted or fully-fished groupings) is on the western side of
the South China Sea (in the shallower shelf fisheries) with stocks in better condition around
Sabah, Sarawak and parts of the Philippines.

18
■ The stocks of large demersals and small demersals are overfished in a majority of the areas.
■ Large and small pelagics are overfished or fully fished in a majority of the cases.
■ The stocks of anchovies and sardines are overfished in a majority of the assessed fisheries.
■ Low value/trash fish species are fully fished where assessed.
■ All the assessed stocks of surimi species are overfished.
■ Squids/cuttlefish and crustaceans are scored as fully-fished or overfished in all the assessed
fisheries.
Table 6 Status of fisheries/species groups for fisheries in the South China Sea areas
China Viet Nam Philippines Thailand Malaysia Indonesia
Northern Luzon, East coast Peninsular FMA 711
shelf, Visayas, East coast,
Beibu Gulf, Mindanao Sarawak,
Deep sea Sabah
Large demersal D, D, nd nd O O, O/U, O F/O
Small demersal O, O, na nd F, M, U O O, O/U, O F/O
Large pelagic nd, nd, F nd M, U, F O U, U, U U/M
Small pelagic O, O, F nd F, U, F O U, U, U M
Anchovy/Sardine O, O, nd nd M, U, F O O, nd, nd nd
Trash fish/low value fish F, F, nd nd F/O
Surimi species O, O, nd nd O, O, O F/O
Shark/rays D, D, O nd nd
Squids/cuttlefish F, F, nd nd F, M, F O F, F, nd nd
Crustaceans O, O, U nd O F, F, nd F/O
Note: This table presents indicative status for species groupings. Terminologies for the level of exploitation vary between countries
as do the methods of assessment and date of last assessment and the geographic scope of those assessments.
Depleted (D); overfished (O); fully fished (F); moderately fished (M); underfished (U) and “nd” denotes no data available or
uncertain status. Several values indicate the range of reported values (e.g. several sub-areas).
LD Large demersals
SD Small demersals
LP Large pelagics
SP Small pelagics
A/S Anchovy/sardine
TF Trash fish/low value fish
Su Surimi species
S/R Sharks/rays
S/C Squid/cuttlefish
Cr Crustaceans
Depleted or overfished
Fully fished
Moderately fished or Underfished
Figure 6 Fishery/stock assessments for the assessed fisheries areas of the South China Sea

19
CPUE/catch rates
For a majority of the assessed fisheries (by gear) in the region the catch per unit effort (CPUE) and
catch rates are declining (Table 7; 12 out of 15 examples). A majority of the assessed trawl fisheries
show declining CPUE or catch trends. Also a majority of the assessed purse seine fisheries show
declining CPUE or catch rates. All net fisheries assessed show declining CPUE or catch rates. The CPUE
for hand line fisheries declined in one of the two assessed fisheries. Table 8 contains more detailed
CPUE data for specific gears or fisheries.
Table 7 Trends in CPUE/catch rates by gear for the assessed fisheries in the South China Sea areas
China Viet Nam Philippines Thailand Malaysia Indonesia
Northern Demersal Moro Gulf East coast Peninsular FMA 711
SCS CPUE East coast
Time period 1970–2008 1985–2003 2003–2007 1997–2002 2000–2008 1990–2007
Overall � -43% � -68%
Otter/pair trawl � -21 to -58% � -8% � +6% � -43%
Purse seine � +21% � -35% � -25% � - 63%
Other seines � -3%
Drift/gill net � -47% � -17% � -36%
Hand line � +48%
Longline
Increased (�); Decreased (�) over the time period indicated. Where data were available, a two year average for the CPUE at
the start and finish dates was used.
■ China: CPUE showed a decreasing trend until the 1990s. This is perhaps a similar situation
to the Gulf of Thailand where heavy fishing pressure has resulted in a “fishing down” effect
and the fishery has stabilized, with a shift to faster recruiting smaller species.
■ Thailand: CPUE appears relatively stable in the Gulf of Thailand fishery, although overall rates
are extremely low compared with rates 20 years ago. This perhaps suggests a relative stability
in the fishery at a highly “fished down” level.
■ Indonesia (FMA 711): CPUE/catch per hour decreasing – mainly the demersal and some small
pelagics. This is expressed in mT/boat/y between 1998 and 2008: large demersals decreasing
from 600 to 20; small demersals decreasing from 300 to 20; small pelagics decreasing from
40 to 20; large pelagics stable at 5 to 6; small tuna stable at 10 to 15; crustaceans stable at
400.
■ Viet Nam: Catch rate has declined over the last few decades, from about 1.1 tonnes/hp/year
in 1985 to 0.35 tonnes/hp/year in 2003.
■ Philippines: CPUE has been increasing in some areas, although no data are presented for
nearshore coastal demersal or reef associated resources.
■ Malaysia: CPUE is generally decreasing in all fishing zones.
Box 1 Note on interpretation of CPUE trends
Information on trends in CPUE can be informative but it does have to be interpreted.
1. Declining CPUE is normal when a fishery is developed. It is considered a bad situation when CPUE starts
falling below about 50 percent of initial value and, as a rule of thumb, 20 percent of initial values should be
considered as the limit.
2. Stabilizing CPUE means that some kind of equilibrium has been reached, but this does not necessarily mean
that the fishery is being operated at the optimum level.
3. Increasing CPUE can be obtained through a reduction in effort. However, it can also be increased by increased
efficiency in fishing operations or changes in the system productivity.
It is therefore important to analyze CPUE trends in association with other background information about the fishery if
a reasonable interpretation is to be made about the condition of that fishery.

20
Table 8 Detailed trends in CPUE/catch rates by gear or resource for the assessed South China Sea
fisheries areas
Country Time period CPUE/comment Area
China 1990 to present CPUE decreasing and seems to have levelled off Northern South China Sea
since the late 1990s
Otter trawl 251 to 104 kg/hr (1983 to 1992) Northern shelf
Pair trawl 792 to 382 kg/kW/yr (1986 to 1998)
Pair trawl 638 to 275 kg/hr (1986 to 2008)
Otter trawl 159 to 116 kg/hr (1983 to 2007) Beibu Gulf (Gulf of Tonkin)
Otter trawl 1870 to 750 kg/kW/yr (1970 to 1992)
Viet Nam 1985 to 2003 CPUE decreasing from 1.12 tonne/hp/year (1985) National
to 0.35 tonne/hp/year (2003)
2000 to 2005 87 kg/hr Demersal, north
60 kg/hr to 40 kg/hr Demersal, southwest
40 kg/hr to 70 kg/hr Demersal, southeast
71 kg/hr to 88 kg/hr Demersal, central
Philippines 2003 to 2007 Handline: (YFT) 45 to 114 kg/day Moro Gulf
Purse seine: (YFT) 858 to 1 704 kg/day
Purse seine: (skipjack) 3 450 to 5 820 kg/day
Ringnet: (YFT) 1 472 to 701 kg/day
Ringnet: (skipjack) 5 989 to 1 777 kg/day
Thailand 1976 to 1998 77.5 kg/hr decline to 17.9 kg/hr Gulf of Thailand
2003 to 2005 22.4 to 24.2 kg/hr, overall
1.01 to 0.94 kg/hr, pelagic species
6.85 to 6.4 kg/hr, demersal species
4.05 to 5.8 kg/hr, cephalopods
0.11 to 0.06 kg/hr, shrimp
0.27 to 0.23 kg/hr, crab
9.59 to 10.38 kg/hr, true trash fish
Malaysia 2000 to 2008 Peninsular east coast
Drift gillnet: 0.054 to 0.060 mT/trip – slight increase Zone A
Purse seine: 2.2 to 1.5; 5.5 to 4.2; 21 to 15 mT/trip – Zone B; Zone C; Zone C2
decreasing
Anchovy purse seine: 1.13 to 1.05 mT/trip – Zone B, Zone C
decreasing
Trawl: 0.8 to 0.96; 9.8 to 9.5; 13 to 15 mT/trip – Zone B; Zone C; Zone C2
slight increase
Indonesia 1998 to 2008 Trawler stable 40 to 50 tonnes/boat/yr FMA 711
Seiners decreasing from ~50 to ~20 tonnes/boat/yr
Drift gillnets fluctuating between ~8 to ~5 tonnes/
boat/yr
Low value/trash fish production
Total production of trash/low value fish species in the South China Sea subregion is estimated at
4.85 million tonnes (Table 9). The percentages of total production vary according to area, but reaches
60 percent or more in some areas. Overall, in the reported fisheries low value trash fish is consistently
more than 20 percent of the overall catch and will be a considerably higher percentage for the trawl
fisheries (more typically 40 to 60 percent of catch) which are responsible for the majority of the catch.

21
Fishmeal production
The total fishmeal production (Table 10) for the South China Sea subregion is estimated at 576 000
tonnes and is derived largely from the low value/trash fish catch reported in Table 9, although there are
some targeted small pelagic catches that are directed into fishmeal production. This estimate uses
a figure of 5 000 tonnes for the Southern Chinese provinces bordering the South China Sea (the major
fishmeal producing provinces in China are Shandong, using Engraulis japonicus and Zhejiang, using
Benthosema pterotum). Production of fishmeal from processing wastes from capture fish and aquaculture
is significant. These are trimmings and processing waste from fish processing converted to fishmeal
(from canning, filleting, heading and from shrimp heads/wastes, pangassius processing wastes). IFFO
estimates that ~56 percent of the fishmeal produced in the East Asian region is derived from this source.
Globally this figure is only 25 percent. There is an increasing interest in finding small pelagic fisheries
which can be certified for fishmeal production in order to enable the production of certified animal feeds
(e.g. pet foods and aquaculture feeds). The data on fishmeal production are rather difficult to obtain
and typically refer to production by industrial scale producers.
Table 9 Production of trash fish/low value fish for the South China Sea fisheries areas
Tonnes% of total
Comments/referencefisheries production
China 3 300 000 ~60% Based on estimate of 5 500 000 tonnes of marine
catch in 1999 for China mainland provinces (Watson
& Pauly, 2001) and assuming 60% of trash fish from
Chinese data.
Viet Nam 933 183 36% (of national catch, which Tables in the report “Preliminary Analysis of the
was 2.6 million tonnes in 2002) Enumerator Sampling Program”, RIMF, Hai Phong,
28 to 51% (Gulf of Tonkin) 2002 & survey data from Halong (408 vessels in
47 to 68% (southeast area) 1996 to 1997)
Otter trawl survey data 1996 to 1997, ALMRV.
Philippines 78 000
Thailand 367 505 43% of overall trawl catch Research trawls
(east coast) 65% of otter trawl catch 2007 figure, decreased from 561 514 tonnes (1997)
21% of pair trawl catch Fisheries statistics 2007 (DOF, 2009)
Indonesia 65 300 Estimated as 11-15% of total 2008 figure, increased from 21 900 in 1980
(FMA 711) landing National total 427 900 tonnes in 2008.
Malaysia 109 307 34% (as percent of total low Predominantly from trawl fisheries
value/trash fish landings: 21% Fisheries annual statistics 2000 to 2008
Peninsular east coast; 7.5% Decreased from 43% of total capture landings in
Sarawak; 5.7% Sabah) 2000.
Table 10 National production, import and export of fishmeal in countries bordering the South China Sea
(tonnes)
China* Viet Nam Philippines Thailand Malaysia Indonesia
IFFO (2008)141 000 *46 000 nd 466 000 44 000 15 000
National production
Fish meal imported*** 1 141 128 113 980 24 235 15 123 18 886 55 963
Fish meal exported*** 51 185 19 935 5 339 96 123 33 738 8 249
* This figure is variously estimated with reports of up to 185 000 mT of “fish powder” produced. Estimated by Dr Dao Manh Son,
Dang Van Thi & Huynh Nguyen Duy Bao (2005) background paper to APFIC regional workshop on low value/trash fish.
** IFFO estimate is for all China mainland provinces, there is very limited fishmeal production in the China mainland provinces
bordering the South China Sea (~5 000 tonnes).
*** 2007 data, FAO FishStat Commodities data set (2009).
Note: besides various forms of fishmeal, this also includes fish solubles, fish silage, fish waste, fish bone meals.

22
Capture production of surimi species
The production of surimi in the region has increased dramatically over the past decade and has reached
more than 321 250 tonnes in the South China Sea subregion (Table 11). This has been driven by two
main factors: The processing techniques for surimi have transferred well within the region and raw
materials from trawl fisheries are increasing. This second factor is one reason why the low value trash
fish levels of trawl fisheries are not increasing despite the increasing trawl effort; increasingly species
previously regarded in the trash fish category and not previously targeted are now increasingly sought
out for processing into surimi (Table 12).
Table 11 Production of surimi and catch of fish (raw material) from which it is derived (tonnes)
Surimi Total Thread Lizard Goat fish Croaker Snapper Barracuda others
production raw fin fish (big eye/
2005* material bream king)
required
Thailand** 150 000 530 000 189 000 190 000 119 000 incl. with 32 000
(National) goat fish
Malaysia*** 100 000 670 000 127 300 154 100 67 000 incl. with 100 500 214 400 6 700
(National) snapper
Viet Nam 63 250 115 035 67 620 55 860 126 420 44 100
(National)
Indonesia**** 8 000 32 000 21 760 4 160 3 200 2 560 320
(National)
Total 321 250 1 347 035
* Unless specified, the 2005 figures are derived from reference http://map.seafdec.org/SurimiMile/index.php and Siriraksophon
& Laong-manee (2005).
** Thailand’s 2007 produciton of surimi was 309 479 tonnes form a catch of fish suitable for surimi of 1 169 215 tonnes.
*** Malaysia’s figure for raw material may be overestimated (typically 3.5 to 5 kg of raw material are needed for 1 kg of surimi).
**** Indonesia’s surimi production is approximately 19 percent of total landings of surimi species. It is assumed the rest is exported
as raw material for surimi production elsewhere.
Table 12 Typical species used for surimi production
Common name Genus/species China Thailand Malaysia Viet Nam Indonesia
Threadfin bream Nemipterus spp. X X X
Lizard fish Saurida spp. X X X X
Goat fish Upeneus spp. X X X
Croakers Sciaenidae spp. X X X X
Snapper (big eye/king) Priacanthus spp. X X X X
Barracuda Sphyraena spp. X
Conger pike Muraenesox cinereus X
Spanish mackerel Scomberomorus spp. X
Shark X
Cuttlefish X
Other species X X X X
Recommendation: The quantity of surimi produced and the sources and quantities of raw materials
need to be tracked more accurately in future assessments.
Fisheries classifications
The number of vessels in the region is increasing and there has been a trend of increasing motorization
and increase of total fleet capacity in the region. This has led some countries to put in place measures
to decrease either the number of vessels or limit capacity (e.g. China). A large fraction of the fleet in
the region is still classified as small-scale according to regional and national definitions (Table 13).
Recommendation: Harmonized methods for classification or comparison of fleets would assist regional
capacity assessments. National vessel inventories remain incomplete and these should be updated.

23
Table 13 Classification of small-scale and commercial fisheries
Countries Small-scale Fisheries Commercial Fisheries
Brunei Small-scale/artisanal fisheries: Trawler, purse seiner, or long liner:
Darussalam Operating in all zones but concentrating ■ <60 GT; <350 hp operating in Zone 2
in Zone 1 (0 to 3 nm) ■ 60.1 to 150 GT; 351 to 600 hp operating in Zone 3
■ 151 to 200 GT; 600 to 800 hp operating in Zone 4
Cambodia Coastal fisheries: Commercial fisheries:
Small-scale fisheries with/without engine More than 50 hp operating in Zone 2
(from 5 to 50 hp) operating in Zone 1.
Indonesia Fisheries that operated without using boat, ■ Fisheries where outboard motor size 5 to 30 GT
using non-power boat, using outboard motor or inboard motor size 5 to 30 GT is used.
size <5 GT, or inboard motor size <5 GT. ■ Fisheries where outboard motor size >30 GT or
inboard motor size >30 GT is used.
Malaysia Traditional fisheries: Commercial fisheries:
Small-scale fisheries using traditional fishing Medium and large-scale fisheries using commercial
gears (i.e. other than trawls and purse fishing gears such as trawls and purse seines.
seiners) with vessels less than 40 GRT ■ With vessels less than 40 GRT operating in Zone B.
operating in all zones concentrating in ■ With vessels from 40 to 70 GRT operating in Zone C.
Zone A. ■ With vessels above 70 GRT operating in Zone C2.
Myanmar Inshore-fisheries/coastal fisheries: Industrial fisheries:
■ Vessels of less than 30 ft or using ■ Vessels more than 30 ft or using more 12 hp
less than 12 hp engine engines, operating in Zone 2 (outer limit of inshore
■ Operating in Zone 1 fishing zone to the EEZ)
■ 5 nm from shore (Rakhine coastal region)
■ 10 nm from shore (Ayeyarwaddy and
Taninthayi region)
Philippines Municipal fisheries: Commercial fisheries:
Upto 15 km from shore, or equidistant ■ Small-scale commercial fisheries: from 3.1 to 20 GT
between two adjacent municipalities. vessels operating in Zone 2; can also operate within
Small-scale fisheries with vessels of 10.1 to 15 km (within Zone 1) if authority is granted
less than 3 GT operating in Zones 1 and 2. by the concerned local government unit.
■ Medium-scale commercial fisheries: from 20.1 to
150 GT operating in Zone 2; can also operate within
10.1 to 15 km (within Zone 1) if authority is granted
by the concerned local government unit.
■ Large-scale commercial fisheries; more than
150 GT operating in Zone 2.
Singapore Small-scale fisheries with vessels of less Small-scale commercial fisheries:
than 3 GT operating in Zone 1. Inboard engine less than 50 GT or 380 hp operating in
Zone 2.
Thailand Small-scale fisheries: Large-scale fisheries:
Vessels of less than 5 GT operating in Zone 1. Vessels of more than 5 GT operating in Zone 2.
Viet Nam Small-scale fisheries: Large-scale fisheries:
Vessels with no engine and with engine less Vessels with engine more than 40 hp.
than 40 hp. “Nearshore fishery”: Fishing “Offshore fishery”:
vessels with an engine capacity of less than Defined as fishing in the waters bordered by a 30-m
90 hp, that have not registered for operating deep line from the shore onwards for the Tonkin Gulf
offshore. Fishing vessels fishing in waters waters, East and SouthWest waters, and Gulf of
of less than 30-m depth from the shore in the Thailand and by a 50-m deep line from the shore
Tonkin Gulf waters, East and Southwest onwards for the Central coast
waters, and Gulf of Thailand or in waters of
under 50-m depth from the shore onwards
in the Central coastal area.
Source: SEAFDEC (2008)

24
Vessel numbers and employment
There are approximately 1.72 million fishing vessels operating in the SCS subregion, the majority are
small-scale vessels (Table 14). Only two areas reported vessels by type of gear and of these two areas
gillnetters and trawlers dominate the fleet composition. Purse seiners are relatively common, however,
smaller sized gears are used to a large extent (e.g. hook and line). The capacity of the Vietnamese and
Chinese SCS fleet is between 3 and 4 million kW each, giving an average vessel capacity of about
35 kW or 45 hp.
Table 14 Number and type of fishing vessels in the assessed fisheries (by area)
China Viet Nam Philippines Thailand Malaysia Indonesia
(SCS) (East coast) (Peninsular (FMA 711)
East coast,
Sabah,
Sarawak)
2000 2003 2002 2000 2008 2008
Trawlers 10 357 24 231 5 509
Purse seiners 3 729 5 545 4 256
Gillnet 51 754 31 200 50 472
Hook-and-line 5 022 58 761
Set net 4 117 –
Others 2 650 40 870 86 043
Longline 2 444 –
Non-powered 2 639 2 894 21 402
Outboard engine 42 217 10 200 14 888
Inboard engine 13 263 9 875 32 187
<5 GRT 15 508 24 567
>5 GRT 7 461 7 620
Small scale 1 371 676
Commercial 16 497
Total 77 629 104 290 1 388 173 58 119 22 969 68 477
Fleet capacity (kW) 3 176 168 3 910 976
Notes:
Malaysia: the breakdown of vessel numbers does not sum to the total number of vessels because the breakdown is given for
both motorization and GRT.
Thailand: data from the 2000 Intercensal Survey of Marine Fishery in: Department of Fisheries. 2009;
Indonesia: the gear breakdown is more than the total number of vessels since one vessel may use more than one type of gear.
The breakdown by GRT applies only to inboard powered vessels. The total for all Indonesian FMA is 596 184 vessels,
The number of people employed in the sector in the South China Sea area, is more than 5.4 million
people, of which more than two million are part time (Table 15). This figure is probably an underestimate
due to the notorious difficulties of assessing everyone who is engaged in some form of fishing as
a livelihood, especially the part-time segment. Foreign crews are found in some fisheries and they are
largely migratory labour from neighbouring countries.
The definitions of employment in small-scale fisheries and larger scale more commercial type fisheries
are poorly defined and thus it is not possible to indicate employment in the two parts of the sector.
However, the fact that the majority of vessels are operating within the small-scale sector indicates that
this is the most significant form of employment as well.
Fishery zoning and management measures (including protected areas)
All countries in the region have zoned their EEZ, although the zoning differs among the countries
(Table 16). All countries have two or more zones and most countries have two zones but some have up
to four different zones. The zones are either divided by distance (i.e. nautical miles) from shore or by
depth of the water. The outer zone extends to the limit of the EEZ.
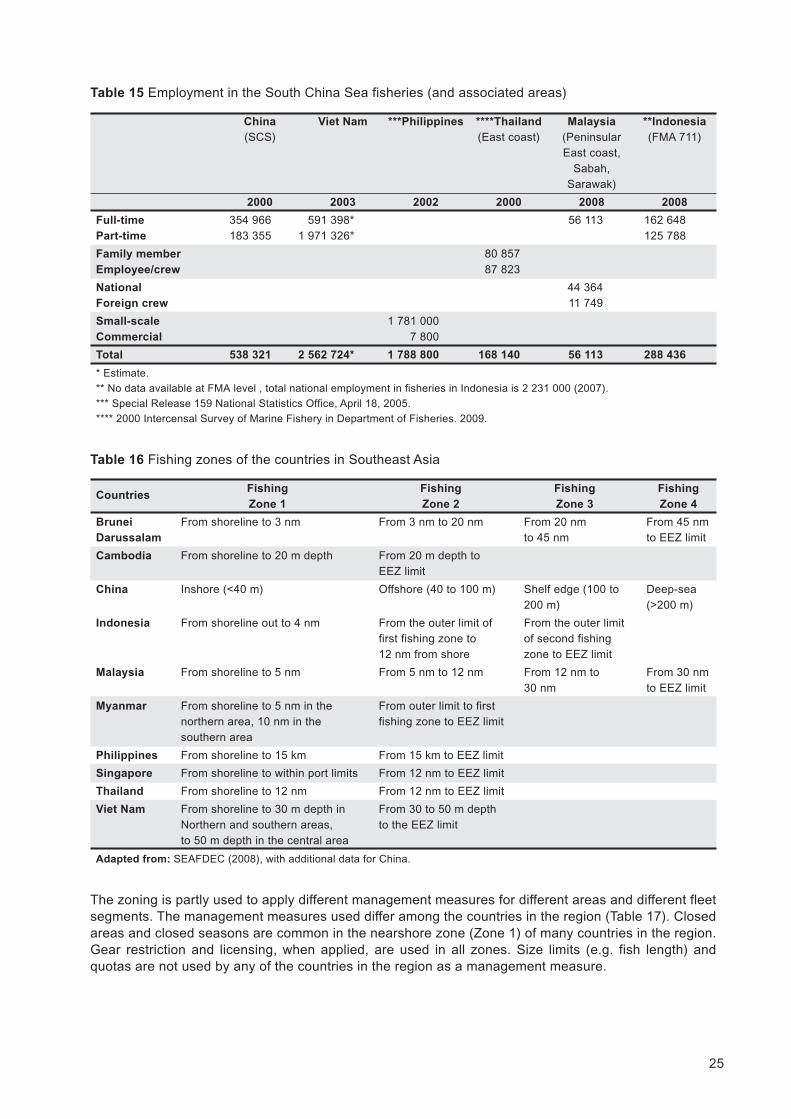
25
The zoning is partly used to apply different management measures for different areas and different fleet
segments. The management measures used differ among the countries in the region (Table 17). Closed
areas and closed seasons are common in the nearshore zone (Zone 1) of many countries in the region.
Gear restriction and licensing, when applied, are used in all zones. Size limits (e.g. fish length) and
quotas are not used by any of the countries in the region as a management measure.
Table 15 Employment in the South China Sea fisheries (and associated areas)
China Viet Nam ***Philippines ****Thailand Malaysia **Indonesia
(SCS) (East coast) (Peninsular (FMA 711)
East coast,
Sabah,
Sarawak)
2000 2003 2002 2000 2008 2008
Full-time 354 966 591 398* 56 113 162 648
Part-time 183 355 1 971 326* 125 788
Family member 80 857
Employee/crew 87 823
National 44 364
Foreign crew 11 749
Small-scale 1 781 000
Commercial 7 800
Total 538 321 2 562 724* 1 788 800 168 140 56 113 288 436
* Estimate.
** No data available at FMA level , total national employment in fisheries in Indonesia is 2 231 000 (2007).
*** Special Release 159 National Statistics Office, April 18, 2005.
**** 2000 Intercensal Survey of Marine Fishery in Department of Fisheries. 2009.
Table 16 Fishing zones of the countries in Southeast Asia
CountriesFishing Fishing Fishing Fishing
Zone 1 Zone 2 Zone 3 Zone 4
Brunei From shoreline to 3 nm From 3 nm to 20 nm From 20 nm From 45 nm
Darussalam to 45 nm to EEZ limit
Cambodia From shoreline to 20 m depth From 20 m depth to
EEZ limit
China Inshore (<40 m) Offshore (40 to 100 m) Shelf edge (100 to Deep-sea
200 m) (>200 m)
Indonesia From shoreline out to 4 nm From the outer limit of From the outer limit
first fishing zone to of second fishing
12 nm from shore zone to EEZ limit
Malaysia From shoreline to 5 nm From 5 nm to 12 nm From 12 nm to From 30 nm
30 nm to EEZ limit
Myanmar From shoreline to 5 nm in the From outer limit to first
northern area, 10 nm in the fishing zone to EEZ limit
southern area
Philippines From shoreline to 15 km From 15 km to EEZ limit
Singapore From shoreline to within port limits From 12 nm to EEZ limit
Thailand From shoreline to 12 nm From 12 nm to EEZ limit
Viet Nam From shoreline to 30 m depth in From 30 to 50 m depth
Northern and southern areas, to the EEZ limit
to 50 m depth in the central area
Adapted from: SEAFDEC (2008), with additional data for China.

26
Closed areas come in many forms of which marine protected areas (MPAs) are the most common and
well-known. The countries in the region have a total of at least 726 MPAs at national, district and local
level (Table 18). There is a degree of mixing of marine protected areas (inferring water surface or benthic
ecologies such as coral or seagrass) and more general mangrove or coastal areas (which are
a combination of water and land). The contribution of these environments to fisheries varies, but they
all have unique value and should not be aggregated. There are many examples of seasonally closed
areas or zones in many of the countries. Artificial reefs have also been constructed in several countries
and these could be included in future inventories. Additionally, there are examples of oil exploration areas
that tend to be de facto no fishing zones (or exclusion areas).
Table 17 Examples of management measures used in the different fisheries (by zone)
AreaClosed Closed Size limits Gear
Licensing Quotasareas seasons (Biological) restrictions
China (northern part Zone 1 Zone 1 Zones 1 & 2 Zones 1 & 2
of South China Sea)
Viet Nam ExistNo closed
National TACseasons
Philippines Zone 1 All zones All zones
Thailand (east coast) Zone 1 Zone 1 All zones
Malaysia (Peninsular
east coast, Sarawak, Zone 1 All zones All zones
Sabah)
Indonesia (FMA 711) All zones All zones
Table 18 Marine protected areas and areas where fishing is restricted or excluded
China Viet Nam Philippines Thailand Malaysia Indonesia**
(SCS) (East coast) (Peninsular (FMA 711)
East coast,
Sabah,
Sarawak)
Marine protected areas (32) (22)(~600)*
(5) (41 marine parks;3 411 km
2
(number) Area 4 635 km2 2 577 km2 1 271 km2 6 MPA)
No fishing zones 0 (47)
Oil exploration areas 0 21 479 km2
Seasonal closed areas (21)
60 000 km2 (3) (8)**
* At local and district level
** Indonesia existing MPA nationally 66 000 km2
Sources: Country reviews, http://www.wdpa-marine.org/, http://www.southchinasea.org/docs/marine%20protected%20areas_in_
South%20East%20Asia.pdf (2002)
Recommendation: It remains a challenge to summarize the wide variety of management approaches
and measures implemented within the region. An inventory of these would assist in monitoring fishery
management at the ecosystem level.
Recommendation: A more comprehensive inventory of the different types of area which are protected
or managed on a seasonal or permanent basis would be an important ecosystem level indicator. Ideally,
there would also be some measurement or monitoring of their function or value for fisheries sustainability.

27
Bay of Bengal and Andaman Sea subregion
The Bay of Bengal and Andaman Sea subregion has seen total catches steadily increasing and there
are no signs of the catch levelling off2. From the country correspondents’ reports there are indications
that the catch, although increasing, has changed composition. Until quite recently the catch was
composed of large and valuable fish but here is now apparently a trend over the last five to ten years
for the catch to be composed of lower value and smaller fish. This may not yet be reflected in the
aggregated national catch statistics reported to FAO and will require further analysis at national level.
Figure 7 Outline of the area covered by the Bay of Bengal and Andaman
Sea subregions
Catch composition trends and production
The catch composition from the assessed fisheries in the Bay of Bengal subregion shows different trends
depending on areas (Table 19). The trends for catches of large demersals are divided into an east and
west part, with catches in the east decreasing whereas the catches in the west are increasing.
■ Small demersal species: there is an overall stable or increasing relative catch in the region.
■ Large and small pelagics: relative catch trends are increasing or are stable.
■ Sharks and rays: The catch of sharks and rays are decreasing in a majority of the assessed
fisheries, however it is increasing in some fisheries.
■ Squids/cuttlefish, crustaceans and shellfish: The same picture, with both increasing and
decreasing relative catch trends in different fisheries.
■ Anchovy/sardine: Catches have increased in half of the assessed fisheries.
■ Trash/low value fish: The relative catches have declined in the subregion over the course of
the assessments. The total production of trash/low value fish is about 800 000 tonnes and
together with anchovies/sardines still makes up between 12 and 47 percent of the total catch
in the subregion (Table 20).
2 FAO FishStat 2010 (The total catch of fish in the Bay of Bengal and Andaman Sea subregion was estimated by looking at the
catch from the surrounding countries and their specific catch from the FAO fishing area Indian Ocean, Eastern. The total catch
today is about 5 000 million tonnes and has been steadily increasing since the start of measurements (1950). The rate of increase
has been more rapid in the last 30 years of measurement than in the first 30 years with the most extensive increase in catch in
the 1990s.

28
■ For Sri Lanka, in 2007 and 2009 the marine catch was recorded as 252 670 and 293 170
tonnes respectively. There is nearly an annual increase of 40 000 tonnes. This increase is
mainly a result of the catch from the north and east and also because of the ending of fishing
restrictions imposed during the civil war. It is expected to increase more as the fishery is
developing in the north and east. There is increasing fishing capacity in offshore fisheries and
gill net fishery is being gradually replaced by tuna longlining. This is largely driven by export
demand for tuna from the European Union (EU).
■ Across India, annual average landings increased from 0.56 million tonnes during 1950 to 1954
to 2.9 mt during 2005 to 2009. This is largely driven by technological advances (mechanization
and motorization of craft; introduction of high-opening trawl net and ring seine). The contribution
of small pelagics, as a group, has increased by 1.3 percent. Within the small pelagics, the
contribution of oil sardine has increased from 8 percent during 1995 to 1999 to 13 percent
during 2005 to 2009. Significant changes in the contribution of low-value, small demersals were
not noticed. The contribution of high-value, large pelagics has increased by 1.3 percent, and
Table 19 Trends in catch composition for the assessed Bay of Bengal fisheries areas
Sri Lanka India Bangladesh Thailand Myanmar Malaysia Indonesia
East & West coast all FMA 571
West coast FMA 572
Time period2000— 1995— 1999— 1997— 1978— 2000— 1997—
2009 2009** 2009 2007 1994 2008 2008
Large demersal + + + - - - -
Small demersal 0 + + - 0 -
Large pelagic + + 0 - + 0 +
Small pelagic 0 + 0 - + +
Anchovy/sardine 0 + nd - + +
Trash fish/low value fish + - + + - -
Surimi species nd + 0 + + + +
Shark/rays - + - - 0 0 +
Squids/cuttlefish nd - + - nd - +
Crustaceans + - + - nd - 0
Note: The different groupings were assessed in terms of their relative occurrence (percent): Increased (+); - Decreased (-) or
were Stable* (0) over a specific time period, “nd” denotes no data available.
* abs (change (percent)/initial value (percent)) <0.05.
** Data for whole country.
Table 20 Composition of catches by major resource groupings (percent)
Sri Lanka India Bangladesh Myanmar Thailand Malaysia Indonesia
Andaman Malacca FMA 571
Sea Straits
2009 2005/2009 2008/2009 1994 2007 2008 2008
Large demersal 6 9 11 14 6 3 12
Small demersal 15 11 21 13 6 12
Large pelagic 53 12 41 4 5 5 10
Small pelagic 31 40 9 4 19 36 25
Anchovy/Sardine 0 7 2 5
Trash fish/low value fish 12 17 47 34 35 7
Surimi species 16 0 9 5 6 8
Shark/rays 4 4 1 1 1 1 3
Squids/cuttlefish 4 0 6 1 2
Crustaceans 6 15 10 4 3 16
Source: APFIC correspondents’ reports.

29
that of large demersals by 1.6 percent. This is because of selective fishing for sharks, tuna,
ribbonfish and major perches. In the southeast trawl fishery there is a declining catch rate
with economic collapse of whitefish and silverbellies and “fishing down” the food web is evident
(Vivekanandan et al., 2005). The area is home to relatively large numbers of fishermen and
fishing craft but the productivity is less than other areas. In the northeast, marine fisheries are
developing rapidly with catches increasing. This is because of the relatively recent upgrading
of the fishing fleet.
■ In Bangladesh, in 1991/1992, the marine catch recorded was 245 474 tonnes and the catch
then increased to 333 799 tonnes in 1999/2000, 474 597 tonnes in 2004/2005 and 514 644
tonnes in 2008/2009 (FYSB, 1999–2009). In 2009, 0.611 million tonnes of marine fish were
recorded as a production from the marine fishery sector (MFO, 2009). Hilsa shad (Tenualosa
ilisha) is the most important species in marine capture fishery and accounts for nearly half of
the national marine catch and 12 to 13 percent of the total fish production of the country.
■ Myanmar: Marine fisheries have developed continuously since 1950 and gone through a phase
of rapid growth since the late 1990s, increasing production from 0.6 million tonnes in 1998 to
about 1.6 million tonnes. Formal stock assessment was last conducted in Myanmar 30 years
ago and no current information on fish stock status is available. Some fishery indicators seem
to indicate a declining trend in marine resource abundance. Size composition of the catch of
some commercially important fishes such as pomfret and hilsa shad has become smaller, and
the CPUE of bottom trawl fisheries is also declining annually. It may be assumed that some
marine fishery resources in Myanmar are overexploited and this seems consistent with the
fact that the current landings are 50 percent higher than the estimated MSY. The national
MSY estimation might need to be revised if ecosystem shifts have occurred increasing the
productivity of smaller species.
■ The Andaman Sea fishery in Thailand has seen a reduction in total landings from 805 643
tonnes in 1999 to 631 453 tonnes in 2007 and this is principally attributed to overcapacity.
This fishery contributes 16 percent of the national production, of which 60 percent is caught
in Thai waters (~40 percent is caught outside of Thai waters).
■ Malaysia: 50 percent of the total national catch (1.38 million tonnes) was from the Strait of
Malacca. Inshore waters (an area of less than 30 nautical miles from the coastline) contributed
81 percent of the catch and fishing vessels were usually below 70 gross tonnes. This is
consistent with the large number of inshore fishing vessels, which comprise 97 percent of fishing
vessels in the country. Trawls and purse seines are the two major gear types and contribute
up to 78 percent of the landings.
Fishery/stock assessments
The stock assessments performed for the different groups of species show that a majority of these species
groups in the region are overfished or fully-fished (Table 21 and Figure 8). However, there is also
a large fraction of the species groups that are scored as moderately fished. The stocks of large demersals
and small demersals are overfished in a majority of the areas and large and small pelagics are overfished
or fully fished in a majority of cases. However, for all these groups, some stocks are scored as moderately
fished. The stocks of anchovies and sardines are fully fished in a majority of the assessed fisheries.
The assessed stocks of surimi species are overfished and moderately fished but certain stocks are
overfished or even underfished. The stocks of crustaceans are scored as fully fished in a majority of
the assessed fisheries whereas squids/cuttlefish have some stocks fully fished and others are moderately
fished. No assessments were made for shellfish in this region.
Recommendation: Routine assessments are required to enable adequate tracking of resources for
management decision making. This is particularly important to assess ecosystem level changes in relative
compositions, shifting trophic levels in response to fishing pressure and the determinations of appropriate
fishing effort/capacity levels in both nearshore and offshore fisheries.

30
Table 21 Status of fisheries/species groups for fisheries in Bay of Bengal fisheries areas
Sri Lanka India Bangladesh Thailand Malaysia Indonesia
SE, NE <40 m, >40 m West coast Peninsular FMA 571
coast west coast FMA 572
Large demersal M, U O/F, M O, F O O F/O, F/O
Small demersal M O, M O, M O O F/O, F/O
Large pelagic F F, M F, U O F M, M
Small pelagic F, M M, M F, M O F M, M
Anchovy/sardine F M, U F
Trash fish/low value fish M nd, M O, U F/O, F/O
Surimi species F, M O F/O, F/O
Shark/rays F, M M, U
Squids/cuttlefish M F, M U, U F
Crustaceans F F, M F, M F F/O, F/O
Note: This table presents indicative status for species groupings. Terminologies for level of exploitation vary between countries
as do the methods of assessment and date of last assessment and the geographic scope of those assessments.
Depleted (D); overfished (O); fully fished (F), moderately fished (M); underfished (U) and empty cells or “nd” denotes no data
available. Several values indicate a range of reported values (e.g. several sub-areas).
Figure 8 Indicative fishery/stock assessments for the assessed fisheries areas
LD Large demersals TF Trash fish/low value fish Depleted/overfished
SD Small demersals Su Surimi species Fully fished
LP Large pelagics S/R Sharks/rays Moderately fished/underfished
SP Small pelagics S/C Squid/cuttlefish
A/S Anchovy/sardine Cr Crustaceans

31
CPUE/catch rates
For a majority of the assessed fisheries (by gear) in the region the catch per unit effort (CPUE) and
catch rates are declining (Table 22). A majority of the assessed trawl fisheries show declining CPUE or
catch trends. Moreover, a majority of the assessed purse seine fisheries show declining CPUE or catch
rates and also other seine fisheries are declining. A majority of the net fisheries assessed show declining
CPUE or catch rates. The CPUE rates for prawn and lobster fisheries have declined. Detailed CPUE
rates are presented in Table 23.
■ Sri Lanka: It is not certain whether CPUE/catch per hour is increasing or decreasing as there
is no long term data set on CPUE.
■ India: CPUE trends have declined in trawl fisheries nationally. In the southeast, CPUE is
25 percent of 1992 rates.
■ Bangladesh: CPUE/catch per day per trawler is steady for shrimp trawlers but declining for
fish trawlers (MFO, 2009).
■ Myanmar: the CPUE of bottom trawl fisheries is declining annually.
■ Thailand (Andaman Sea): CPUE trends are either stable or slightly increasing over a three
year period.
■ Malaysia (Peninsular west coast): Trends in CPUE here appear to be stable or increasing.
■ Indonesia (FMA 571 Malacca Strait): CPUE/catch per hour show large decreases, mainly
the demersal and some small pelagic (mT/boat/y between 1998 and 2008): Large demersal –
decreasing from 400 to 40; small demersal – decreasing from 300 to 40; small pelagic –
relatively stable at 30 to 35; large pelagic – fluctuating between 30 and 35; large tuna – increase
from 0.1 to 0.6; small tuna – stable at 15 to 20; crustaceans – decreasing from 400 to 50.
■ Indonesia (FMA 572 Western Sumatra): Large demersal – decreasing from 200 to 20; small
demersal – decreasing from 300 to 30; small pelagic – stable at 60 to 80; large pelagic –
increasing from 2 to 8; large tuna – decreasing from 7 to 3; small tuna – fluctuating between
50 to 70; crustaceans – decreasing from 100 to 20.
Table 22 Trends in CPUE/catch rates by gear for the assessed Bay of Bengal fisheries areas
Sri Lanka India Bangladesh Thailand Malaysia Indonesia
Southeast West coast Peninsular FMA 571
coast west coast FMA 572
Gear 1985–2005 1995–2009 1999–2009 1984–2005 2000–2008 1977–2008
Overall
Trawl � -73% � -38% � -38% � � -94% � +116%
Purse seine � -76% � � -61% �-21%
Other seines � -69% �
Net (drift, gill ring) � -51% � � +71% � +250%
Hand line
Longline � -76% � -83%
Prawn trawl fishery � -6% �-1%
Lobster fishery � -60%
Increased (�); decreased (�) over a specific time period – where data available, a two year average for the CPUE at the start
and finish dates were used. Refer to Box 1, page 19 for a note on interpreting CPUE trends.

32
Low value/trash fish production
Total production of trash/low value fish species in the Bay of Bengal subregion (Table 24) is estimated
at 0.9 million tonnes (including the whole of India). The percentages of total production vary according
to area, but reaches 65 percent or more in some areas. Overall in the reported fisheries, trash/low value
fish ranges between 4 and 65 percent, with a more typical range of 14 to 64 percent. The principal
source of this information is reports from trawlers.
Table 23 Detailed CPUE/catch rates by gear or resource for the assessed Bay of Bengal fisheries areas
CountryTime
CPUE/catch rate Resource/Area/source of informationperiod
Sri Lanka 1986–1995 3.3 to 1.0 kg/boat/day South coast lobster fishery
1990–1995 9.1 to 8.6 kg/boat/day Prawn trawl fishery (Negombo lagoon &
adjacent waters)
1953–1986 65 to 177 kg/haul West coast beach seine fishery
1953–1986 83 to 210 kg/haul North West coast beach seine fishery
1983–2005 336 to 28 kg/haul South West coast beach seine fishery
1985–2005 186 to kg/haul South West coast ring net (scad) fishery
India 1995–2008 48.5 to 35.7 kg/hr All India average for trawl
1992–2008 82.5 to 21.8 kg/hr SE coast (Chennai)
Bangladesh 2000–2009 3 000 to 1 859 kg/day Fish trawl, <40 m depth within EEZ
2000–2009 490 to 483 kg/day shrimp trawl, <40 m depth within EEZ
2004–2009 139 to 25 kg/day Fishing >40 m depth Chittagong/Cox’s Bazaar
Myanmar 1979–1980 670 to 946 kg/hr Fritjof Nansen Survey
1983–1989 184 to 253 kg/hr FRV Chulaborn, FV251, Commercial data
1996–1998 96 to137 kg/hr Commercial fishing
2006–2007 90 kg/hr MV SEAFEC Survey
Thailand 2003–2005 76.5 to 82.8 kg/hr total Andaman Sea
1.8 to 2.2 kg/hr pelagic
21.4 to 25.9 kg/hr demersal
6.6 to 5.0 kg/hr cephalopod
16.1 to 16.0 true trash fish
Malaysia 2000–2008 Peninsular west coast
Drift/gillnet – stable Zone A
Purse seine – increasing Zone B; Zone C; Zone C2
Anchovy purse seine – decreasing Zone B; Zone C; Zone C2
Trawl – increasing Zone B; Zone C; Zone C2
Indonesia 1998–2008 Trawler – 90% decrease FMA 571
1 284 to 130 tonnes/boat/yr
Seiners – decreasing from
56 to 41 tonnes/boat/yr
Drift gill netter – fluctuating between
8 to 6 tonnes/boat/yr
2001–2007 Trawlers – decreasing from FMA 572
225 to 54 tonnes/boat/yr
Seiners – initially 102 increasing
to 146 tonnes/boat/yr
Drift gill netters – ~5 increasing
to ~20 tonnes/boat/yr

33
Fishmeal production
The total fishmeal production for the Bay of Bengal subregion (Table 25) is estimated at 152 000 tonnes
(Malaysia, Indonesia and Thailand production is reported under South China Sea subregion). This is
presumed to be derived largely from the catch above. The region produces large quantities of dried
fish, which are powdered/pounded to form basic animal feeds or fish feeds or directly as human food
and which are not classified as fishmeals (alternative local terms are used such as “fish powders” etc.).
Reducing demand in Bangladesh is attributed to the decline in shrimp production. There appears to be
interest in some areas (e.g. India) to increase the utilization of discards (75 000 tonnes) for fishmeal by
establishing a collection system at sea. This is in response to increasing demands associated with
aquaculture intensification in the Bay of Bengal subregion and could start to drive direct targeting and
mesh size reductions if a significant onshore market was established. This has been the experience
from the South China Sea subregion. In other cases (e.g. Thailand and Malaysia) the trash fish production
above will be directed into fishmeal as well as fed directly to marine fish cages.
Table 24 Production of trash/low value fish for the assessed Bay of Bengal fisheries areas
Tonnes % of total catch Comments/reference
Sri Lanka nd Shrimp trawl fisheries bycatch in Sri Lanka’s Palk
Bay and Gulf of Mannar fisheries have ratios of trash
fish: shrimp of 14:1 and 12:1, respectively. The ratios
for Negombo and Chilaw shrimp trawl fisheries are
much lower at 1.3:1 and 1.8:1, respectively.
Bangladesh 85 843 17% Includes nei species.
India 347 862 12% of total national production Total country production.
25% (Veraval, NW coast) Recalculated from annual report of CMFRI, 2009.
14% (Chennai, SE coast) Detailed figures from trawler landings.
32% (Visakhapatnam, SE)
24% (Mangalore, SW coast)
17% Calicut, SW coast)
Thailand 215 571 64% of otter trawl catch; 23% 2007 figure, decreased from 260 596 tonnes (1997).
(West coast) of pair trawl; 10% purse seine Fisheries statistics 2007 (DOF, 2009).
catch (Andaman Sea)
Malaysia 206 105 65% national low value/trash Predominantly from trawl fisheries.
(Peninsular fish catch Fisheries annual statistics 2000–2008.
west coast)
Indonesia
(FMA 571) 25 500 6.2% 2008 figure, reduced from 77 400 (1980).
(FMA 572) 18 000 4.3% 2008 figure, increased from 5 200 (1980).
9% (nationally) National total 477 900 tonnes in 2008.
Table 25 Production, import and export of fishmeal (tonnes)
Sri Lanka India Bangladesh
Fishmeal produced *0 **19 300 ***2 000
Fishmeal imported 7 390 9 222 1 017
Fishmeal exported 63 10 170 421
* Sri Lanka does not produce fish meal commercially, there is some home based small-scale production.
** IFFO production figure 19 300 tonnes/year, fishmeal production capacity 300 000 tonnes/year.
*** Estimated, 105 tonnes reported to FAO.
Capture production of surimi species
The relative catch of surimi species has increased in all assessed areas (Table 20) and the total
production for the region is roughly estimated as 75 000 tonnes, requiring approximately 262 500 tonnes
of raw material. (Table 26). Many countries in the Bay of Bengal subregion do not produce surimi in

34
significant quantities. This largely assumes that facilities to produce surimi are not yet established (there
is a technological lag). It may also be speculated that the fisheries of this region are also in a better
condition, thus fish is utilized directly for consumption and there is less pressure to process fish into
surimi to increase utilization for human consumption (especially products of trawl fisheries). Note that
surimi production for Thailand, Malaysia and Indonesia is reported in the South China Sea section as
the majority of production of these species is derived from this subregion.
Table 26 Production of surimi and catch of fish (raw material) from which it is derived (tonnes)
Surimi Total rawThreadfin Lizard Goat
Snapper
production materialbream fish fish
Croaker (big eye/ Barracuda others
2005 required king)
India* ~70 000 **245 000
Myanmar 5 000 17 500 10 150 1 050 2 450 2 800 700 350
Total 75 000 262 500
* India figure for whole country.
** Estimate.
Note: Bangladesh and Sri Lanka do not produce surimi.
Vessel numbers and employment
The total number of vessels in the BOB subregion is less than 415 000 (this includes all of India and
thus the west coast Indian fleet should be subtracted, Table 27). Small-scale, outboard, non-motorized
or artisanal gears comprise 77 percent of the fishing vessels. The number of people employed in the
sector is more than 1.6 million and a large fraction of these are part-time fishers. Employment figures in
fisheries are notoriously difficult to obtain and even more so for the “hidden” workforce (Table 28). In
many cases entire households are engaged in some form of work in the fishery either directly in fishing
or indirectly in the post-harvest activities. In some cases there is considerable foreign employment of
fishing crews from neighbouring countries.
Table 27 Number and type of fishing vessels and employment in the assessed Bay of Bengal fisheries
(by area)
Sri Lanka India Bangladesh Myanmar Thailand **Malaysia Indonesia
West coast Peninsular FMA 571
west coast FMA 572
Year 2007-2008 2008 2000 2008 2008
Trawlers 29 241 2 217
Purse seiners 983 2 012
Gill net 14 183 27 957
Dol net
Hook-and-line 8 862 32 133
Set net
Others 5 284 46 949
Longline 1 190 7 691
Non-motorized 39 104 104 270 15 219 19 412 98
Motorized/outboard 75 591 10 027 43 031
Inboard/mechanized 4 749 59 743 16 376 1 744 7 865 34 560
<5 grt 10 884
>5 grt 7 106
Small scale 43 026
Large-Commercial 200
Total 41 733 *239 604 43 236 31 595 21 156 17 990 ***118 959
* Whole country. Note that gear categories ar ento strict, as more than one gear type may be utilized.
** Malaysia figures do not include 61 vessels operating on high sea.
*** Data based on Indonesia annual statistical report (2009). Note that this figure differs from Lymer D., Funge-Smith S., &
Greboval D. (2009). The national total for Indonesia is 590 000 fishing vessels comprising 348 000 motorized fishing vessels
and 242 000 non-motorized.

35
Recommendation: Improved statistical information on the workforce and its structure would inform policy
making as well as allow more effective valuation of the role of fisheries in the subregion.
Fishery zoning and management measures (including protected areas)
All the countries have established an economic exclusion zone (EEZ), although the zoning differs among
the countries (Table 29). All countries have at least two zones but some have up to four different zones.
The zones are either divided by distance (i.e. nm) from shore or by depth of the water. The outer zone
extends to the limit of the EEZ in all cases except for India, which has not included it in its definition.
Table 28 Employment in the assessed Bay of Bengal fisheries (by area, excluding Myanmar)
Sri Lanka India Bangladesh Thailand Malaysia Indonesia
East coast West coast Peninsular FMA 571
west coast FMA 572
Year 2007- 2008 2000 2008 2008
Full time 132 000 430 654 519 000 42 846 261 002
Part time 33 100 117 241 259 500* 75 279
Family members 29 820
Employees/crew 17 717
Nationals 32 349
Foreign crew 10 497
Total 165 000 547 895 778 500* 47 537 42 846 336 281***
* Estimate.
** Whole country.
*** Lymer D., Funge-Smith S., & Greboval, D. (2009) cite a figure of 46 714 for FMA 571.
Table 29 Fishing zones of the countries in South and Southeast Asia with waters in the East Indian
Ocean
Countries Fishing Zone 1 Fishing Zone 2 Fishing Zone 3 Fishing Zone 4
Sri Lanka* Lagoon fisheries, Offshore area is up to
continental shelf and EEZ and high seas
the slope
India Artisanal craft within Mechanized craft Mechanized craft OAL Mechanized craft OAL
(Southeast coast) 5 km from shore; beyond 5 km from <20 m beyond 10 km >20 m beyond 23 km
shore
(Northeast coast) Artisanal craft within Mechanized craft OAL Mechanized craft OAL
5 km from shore; <15 m beyond 5 km; >15 m beyond 20 km
Bangladesh Coastal area and Whole EEZ of
shallower part of the Bangladesh which is
EEZ of Bangladesh deeper than 40 m
which is shallower
than 40 m
Myanmar From shore line to From outer limit of
5 nm in the northern inshore fishing zone (1)
area (Rakhine), 10 nm to EEZ limit
in the southern area
(Ayeyarwaddy and Engine >12 HP;
Taninthayi) Boat OAL >30 ft
Engine <12 HP;
Boat OAL <30 ft
Thailand From shoreline to From 12 nm to
12 nm EEZ limit

36
Malaysia From shoreline to From 5 nm to 12 nm From 12 nm to 30 nm From 30 nm to
(Peninsular 5 nm EEZ limit
west coast)
Indonesia From shoreline out to From the outer limit From the outer limit of
4 nm of first fishing zone to second fishing zone to
12 nm from shore EEZ limit
Adapted from: SEAFDEC (2008), with additional data for Sri Lanka, India and Bangladesh.
* No official zoning exists.
Table 29 (continued)
Countries Fishing Zone 1 Fishing Zone 2 Fishing Zone 3 Fishing Zone 4
The zoning is partly used to apply different management measures for different areas and different fleet
segments. The management measures used differ among the countries in the region (Table 30). Closed
areas and closed seasons are common in the nearshore zone (Zone 1) of many countries in the region,
but there are examples of these measures being applied in other zones. Gear restriction and licensing,
when applied, are used in all different zones for most countries. Size limits (e.g. fish length) are used
by some countries but quotas are not used by any of the countries in the subregion as a management
measure.
Table 30 Examples of management measures used in the different Bay of Bengal fisheries (by fishing
zone)
AreaClosed Closed Size limits Gear
Licensing Quotasareas seasons (Biological) restrictions
Sri Lanka Zone 1 Zone 1 Zone 1 Zone 1
India (East coast) Zones 1–3 Zones 2–4 All zones All zones
Bangladesh Zone 1 Zone 1 All zones All zones
Myanmar All zones All zones All zones All zones
Thailand (West coast) Zone 1 Zone 1 All zones
Malaysia (Peninsular west coast) Zone 1 All zones All zones
Indonesia (FMA 571) All zones All zones
Closed areas come in many forms of which marine protected areas (MPAs) are the most common (and
known). The countries in the subregion have a total of at least 636 MPAs at national, district and local
level (Table 31). Additionally, there are examples of oil exploration areas that are often de facto no fishing
zones, and there are seasonally closed areas in many of the countries. There are also areas designated
as no fishing zones in a majority of the countries.
Table 31 Marine protected areas and areas where fishing is restricted or excluded
Sri Lanka* India** Bangladesh Myanmar Thailand Malaysia Indonesia
East coast West coast Peninsular FMA 571
west coast FMA 572
Marine protected (2) (31) 4 (4) (13) (4) (10)
areas/parks 6 271 km2 387 km2 4 359 km2 188 km2 2 488 km2
No fishing zones 1 2 4
Oil exploration areas 0 2 1 0
Seasonal closed areas 0 2 4 0
* Two marine parks, four marine sanctuary/reserves, nature reserves, mangrove reserves.
** Not entirely marine area as includes some land. There are 31 MPAs and two biosphere reserves (6.16 percent of coastal
biogeographic zone; there is a proposal to increase this to 7.61 percent). Oil fields in Bombay High and Godavari Basin also
function as MPAs. All MPAs include some fishing exclusion zones.

37
Interest in potential for offshore fisheries
All countries of South Asia and Southeast Asia have policies to promote and expand fishing further
offshore from their coasts. In some cases the policy explicitly states that the move offshore is to transfer
fishing from overexploited inshore areas to underexploited areas. The push offshore will need a concerted
effort and development of appropriate technologies and human capacity that make harvesting, processing
and marketing these resources effective, efficient and environmentally responsible. The main policy
drivers are:
■ Overfishing in inshore areas;
■ attempting to realize the potential of offshore fishing;
■ building up catch history records for subsequent negotiations in regional fisheries management
organizations (RFMOs); and
■ ensuring full utilization so that others cannot fish under the provisions of the UN Convention
on the Law of the Sea (UNCLOS).
Although it is known that there are resources which could be exploited in the offshore waters of South
Asia and Southeast Asia, including tunas, small pelagic resources, oceanic squid and some economically
important demersal species such as snapper and grouper and deep-sea shrimp, the extent of the potential
is not known as exploratory fishing and technology advances are still being made. However, the
indications are that these resources are limited and, in the case of the oceanic tuna, already heavily
fished in both the Pacific Ocean and the Indian Ocean. Although some surveys have been undertaken,
the data have generally been analyzed or communicated poorly. They have not provided conclusive
evidence of the potential yield of the resources, but indications are that they are approximately 10 percent
of the densities that are typically found in nearshore areas and therefore a cost-benefit analysis may
conclude that there is little benefit accessing these resources. In some cases, the results from surveys
have been converted into potential yield estimates (Table 32).
Table 32 Potential yield estimates of various offshore resources in the South and Southeast Asia regions
provided (tonnes)
Southeast Asia South Asia
Malaysia Viet Nam Brunei India*** Pakistan Sri Lanka
(inc. Sarawak
& Sabah)
Pelagic 25 000 247 000 25 000
Small pelagic 340 000 1 150 000* 159 000
Small demersal 79 000 355 000 230 000 217 000
Offshore potential yield/MSY 542 000 1 200** 635 000 150 000
* Small and large pelagic combined
** Mainly large pelagic
*** all India EEZ
Sources: APFIC (2009) and Staples (2009)
The typical yield estimates can be converted into sustainable catches per unit area (tonnes/km2):
■ For pelagic species these annual yields correspond to sustainable catches of between 100
and 155 kg/km2 of offshore area in these countries.
■ Fewer estimates of the offshore potential yield of small pelagic are available; these correspond
to 79 kg and 2 125 kg/km2 of EEZ, respectively. One combined figure for large and small
pelagics was 1 150 kg/km2. It should be noted that these sustainable yield figures are at least
one tenth of those calculated for inshore resources.
■ Demersal species density estimates vary between 100 and 900 kg/km2 of offshore area. As
with the pelagic resources, it should be noted that these sustainable yield figures are at least
one tenth of those calculated for inshore resources.

38
Governments are providing a number of incentives to facilitate this move. Illegal, unreported and
unregulated (IUU) fishing is already a major constraint on sustainable development in many of the coastal
fisheries of the region. This is also linked to limitations with monitoring, control and surveillance (MCS)
programmes and other management controls. There is a high risk that this limited control will become
even more overstretched as fishing capacity moves offshore, leading to increased IUU fishing activity
and subsequent undermining of sustainable management objectives. Some of the offshore resources
of the region, especially the highly migratory species like tunas, are being exploited by countries both
from within the subregion as well as from outside the subregion. Likewise, competition exists for the
same resources between countries in the subregion as well as between small-scale and large-scale
fishing boats within the countries.

39
Inland capture fishery production
In the 2006 Status and potential report several recommendations were made to member countries to
improve the disaggregation of inland capture species composition data and capture trends. It was also
recognized that the lack of updated data might hamper the proper recognition of this important subsector.
The capture statistics from inland fisheries in the region have shown a steady increase during the last
years. However there are concerns that this might only reflect improvements in monitoring systems rather
than a real increase in catch.
Historical and systematic underestimation of inland capture fishery production3
The apparent regional trend of inland fishery production in Asia and the Pacific region is one of sustained
increase in production (Figure 1). It is not clear when viewing aggregated statistics whether this is
because of a gradual increasing production from all countries’ inland fisheries, or because of large
increases from individual countries. The rising total could also be a result of better reporting of catches
that were already being made by previously unrecorded sectors of the fishery, such as rice field fisheries
or small-scale subsistence catches, or could represent real gains in production. If the latter, stock
enhancement may have played a part.
Most countries at some stage review their inland fisheries statistics basing this on newer information,
or improved estimation of the proxy indicators. As a result of this type of updated information, countries
may revise their inland fisheries production quite radically, resulting in a significant increase or decrease
in the reported inland fishery production. Large changes in national estimates indicate that there may
have been a significant revision in the statistical data collection system, or an adjustment in the national
estimate based on new supporting evidence, for example:
■ The availability of direct measurement data, rather than estimates or proxies;
■ revision of the area of fisheries such as inclusion of other habitats (where estimates are based
on habitats and productivity per unit area estimations (new information of fishery habitats,
wetlands areas previously not included);
■ inclusion of previously unrecorded fisheries (e.g. inclusion of artisanal or subsistence fisheries,
where previously only large-scale fisheries were reported);
■ revision of the number of fishers (typically as a result of census updates);
■ recalculation of fixed transformation values (e.g. catch/ha or catch/fisher);
■ availability of updated consumption data, economic survey data (e.g. per capita consumption
of freshwater fish); and
■ revision based on assumptions regarding effects of enhancements of wild stocks as a result
of stocking or other interventions.
Large changes in national estimates indicate that there may have been a significant revision in the
statistical data collection system, or an adjustment in the national estimate based on new supporting
evidence. Analysis of the reported inland waters capture production data in Asia and the Pacific region
has shown that individual countries have reported an overall annual increase of more than 40 percent,
a total of 128 times in terms of national statistics between 1950 and 2007 (Figure 9). On average, this
corresponds to more than two countries per year reporting a very large increase in national production.
These identified events accounted for more than 43 percent of the total increase in inland water
production between 1951 and 2007. Not all of these changes will significantly influence the trend of
inland fisheries catch at a regional or global level (i.e. many of these countries have a relatively small
contribution to total production). It is nevertheless noteworthy that such large increases are a common
occurrence.
3 A more comprehensive review can be found in Lymer D. & S. Funge-Smith (2009).

40
Criteria 2
Original
6e+5
4e+5
2e+5
-2e+5
0
6e+5
4e+5
2e+5
-2e+5
0
Ch
an
ge (
Xyear-
Xyear-
1/X
year-
1)
Year
� 1950� 1960� 1970� 1980� 1990� 2000� 2010
A B D EF G H I J K L M N O PQR
Out of the 128 events, 17 events were of a magnitude that they were greater than 30 percent of the
average regional change (1950–2007) and hence significantly affect the regional trend. These 17 events
were confined to seven countries and represent more than 36 percent of the total change between 1951
and 2007 or 2 050 966 tonnes. It can be concluded therefore that the regional trend in inland catch is
significantly driven by these large changes in only eight countries. Since the APFIC region is the largest
inland capture fisheries producer in the world, the effects of these events on the APFIC regional trend
have a major influence on the global trend.
These revised estimates do not represent a sudden increase, but almost certainly a systematic and
historical underestimation of the national production. The implications of this are that we must
avoid falling into the trap of assuming that production is increasing, when we are really only seeing
a re-adjustment of the baseline and that from some countries at least there may actually be a trend of
decline in the fishery being masked by the aggregation of catches and production of multiple countries.
If these sudden “jumps” in production are smoothed backwards (assuming that the trend is the same,
but systematic errors have resulted in underestimation), a very different trend curve for production
emerges (Figure 10).
Figure 9 Changes in reported production that contributed to more than 30 percent of the APFIC regional
total change in the same year (top graph) and the total regional change for inland capture fishery catches
1950–2007 (bottom graph)
Note: Alphabetic code corresponds to the identified changes and countries as follows: A (1951, China); B (1953, China); D (1956,
Myanmar); E (1960, China); F (1961, China); G (1968, Philippines); H (1978, Philippines); I (1981, Cambodia); J (1983, Philippines);
K (1990, India); L (1993, India); M (1996, Viet Nam); N (1999, Cambodia); O (2001, Cambodia); P (2004, Myanmar); Q (2005,
India); and R (2006, Pakistan).

41
Although inland fisheries are generally considered to be underreported for the reasons provided earlier
in this review, there are a number of reasons why production increases may be reported. The stocking
or enhancement of inland fisheries can significantly increase their productivity leading to reports of
increasing production. Such increases may be genuine in which case there is real increase and
contribution to production, however they may simply be artefacts created by the optimism generated
from national programmes to increase production, leading to impacts being overestimated. In the case
of commercialization of enhanced fisheries, the actual production increases may be real and this is an
area which also requires further attention: the production increases from inland wild fisheries is driven
by pressure and “fishing down the food chain” whereas productivity increases from enhanced fisheries
are driven by the enhancement regime. The two do not exist in isolation and both of these factors may
be occurring simultaneously in adjacent fisheries or even within some fisheries.
The multistakeholder issues surrounding freshwater use (for power, irrigation, leisure etc.) also mean
that fisheries services may not be valued highly and as a consequence little effort and few resources
have been allocated to information gathering with respect to inland fisheries and their management.
There is a growing awareness that in certain parts of the world inland fisheries can be a major source
of protein and livelihoods and this has sparked recent interest in these fisheries. Furthermore, the
common lack of inclusion of recreational and subsistence catches and the fact that many countries still
encounter great difficulties in managing and funding the collection of inland capture statistics are
highlighted as major problems by FAO. In addition, the very poor species breakdown reported by many
countries risks a biased trend analysis by species or species groups of the inland catch data. In 2006,
global inland catches classified as “freshwater fishes not elsewhere included (nei)” again exceeded
50 percent (57.2 percent) of the global catch and about 74 percent in Asia and the Pacific region
(Table 1). A most worrying trend is that these figures are actually increasing both globally and in the
region.
7e+6
6e+6
5e+6
4e+6
3e+6
2e+6
1e+6
0
Year
� 1940� 1950� 1960� 1970� 1980� 1990� 2000� 2010
Original
Back-adjusted PG
Back-adjusted
Ca
tch
(to
nn
es
)
Figure 10 Historically modelled data of inland water capture fisheries catch
in the APFIC region

42
Status of enhancement of inland fisheries resources in Asia4
Inland capture fisheries production of APFIC members reached 6.7 million tonnes in 2008 (FAO Fishstat,
2010). In contrast to marine capture fisheries, the production increased by 130 percent compared to
1988. Although the increase resulted from improved reporting of inland capture fisheries production by
the members, inland fisheries resource enhancement and conservation have definitely made a significant
contribution to the increase. Enhancement and conservation of inland fisheries resources have been
practiced for a long time in many Asian countries for the purpose of promoting inland capture fisheries,
conservation of biodiversity and environmental benefit. The latter two have become the objectives of
enhancement and conservation activities recently. However, the objectives of such enhancement and
conservation activities are often different in different countries, for different species and in different water
bodies. Enhancement and conservation activities in river systems tend to focus more on protection of
aquatic biodiversity (including genetic biodiversity) and reinstallation of depleted wild stock, whereas,
enhancement and conservation activities in lakes, reservoirs and floodplains usually focus more on
enhancing catch and sometimes on environmental benefit.
Current enhancement and conservation of inland fisheries resources cover all kinds of inland water bodies
and involve many varieties of fish and other aquatic animals in the region. More than 100 species of
fish and other aquatic animals are directly used in the enhancement or are directly/indirectly impacted
by conservation activities. Thirty-three species (mostly fish, but some crustaceans) are currently used
for enhancement in two or more countries in the region.
Objectives and practices
Although promotion of inland capture fisheries is still one of the primary objectives of inland fisheries
resources enhancement and conservation, there are a variety of objectives including:
■ Promotion of the inland capture fisheries for enhancement of the livelihoods of traditional inland
fishery communities;
■ restoration of depleted natural populations;
■ preservation of endangered species and aquatic biodiversity;
■ improvement of ecosystem function and environment condition;
■ preservation of aquatic genetic resources; and
■ promotion of ecotourism.
Practices relating to the enhancement and conservation of inland fisheries resources are extremely
diversified in the region, varying with water environment, species of animal involved and the enhancement
objectives. Among the enhancement and conservation approaches, the most common are release of
seed, establishment of protected areas/sanctuaries, gear restrictions and closed seasons (Table 33).
4 This section is a brief summary from the outputs of the APFIC/FAO regional review on enhancement and conservation of
inland fisheries resources that covered ten Asian countries with significant practices relating to the enhancement and conservation
of inland fisheries resources (Bangladesh, China, India, Indonesia, Republic of Korea, Myanmar, Nepal, Sri Lanka, Thailand and
Viet Nam).
Table 33 Approaches for enhancement and conservation of inland fisheries resources in Asia
ArtificialHabitat
ClosedRestriction
Artificial fish Protected San-improve-
seasonof harmful
Fishing
release breeding areas ctuariesment
forgears
quota
substrates fishing
Rivers ✓ ✓ ✓ ✓
Lakes ✓ ✓ ✓ ✓ ✓ ✓ ✓
Reservoirs ✓ ✓ ✓ ✓ ✓ ✓
Flood plains ✓ ✓ ✓

43
Investment and benefits
The regional review identified some economic aspects of inland fisheries resources enhancement and
conservation such as investment and benefit distribution. Enhancement and conservation of inland
fisheries resources used to be principally funded by governments. Government funding is still a major
funding source for large-scale enhancement and conservation programmes in many countries. Many
enhancement and conservation activities are not aimed at increasing catch and thus do not generate
direct economic benefits to any specifically targeted group of people. Instead, they usually serve the
purpose of protection of endangered species, preservation of aquatic genetic resources, restoration of
depleted wild populations and environmental improvement.
More recently, sources of investment are becoming more diverse. In many cases, enhancement and
conservation activities are often jointly funded by different levels of government, together with other
sources of funding. Entrepreneurial investment is commonly used for covering the costs of an
enhancement programme when fishing rights are leased to companies/collectives/cooperatives.
Contributions from beneficiaries (fishers) have become an important source of investment for the
enhancement and conservation programmes. The common practice is a resource enhancement fee
collected from fishers when renewing fishing licenses. Public donation is becoming a significant source
of investment for the enhancement programmes and often results from public campaigns or religious
practices. In some countries, governments allocate significant financial resources for enhancement and
conservation activities. Elsewhere, the activity remains dependent on external donors.
Properly implemented inland fisheries resource enhancement and conservation activities can directly
generate economic and/or ecological benefits. Economic benefits are usually shared by a targeted
population (e.g. licensed fishers in the vicinity of a lake, reservoir or river) or among a designated group
of people (such as a cooperative or individual), which happens when the fishing rights to a water are
leased to group of people (e.g. people displaced by the construction of a reservoir) or individual
entrepreneurs (in the case of concession fisheries).
Issues and constraints
The review concludes that inland fisheries resource enhancement and conservation activities typically
contribute positively to improved livelihoods of inland fisher communities and provide ecological and
environmental benefits in the region. It does recognize though that there have been some problems
and constraints on the enhancement and conservation efforts, and these have resulted in limited positive
impacts.
Inequality in benefit distribution: As a common practice, fishing rights to a certain reservoir, floodplain
and lake are often leased to a small group of people or even individual entrepreneurs. Such enhancement
protocols might bring about an increase in food fish production, but could marginalize other users,
particularly traditional fishers in the vicinity of the water body, by preventing access to a potential food
source and a subsidiary income opportunity.
Lack of informed planning and poor execution of enhancement and conservation programmes: Fisheries
enhancement and conservation programmes are often well-intended by government, development
assistance agencies or through traditional or religious practice, but without proper knowledge-based
planning and design. Enhancements are often implemented by different agencies and groups of people
and lack of coordination among the different parties often prevents maximized benefit from these efforts.
Lack of attention to basic technical aspects can seriously limit the effectiveness of the enhancement
practice. The result of fisheries resource enhancement and conservation is significantly affected by the
hydrological condition of the water bodies that is usually under the control of water authorities and poor
coordination of water management can significantly affect the fishery potential of a water body under
an enhancement programme.
Potential negative impacts on biodiversity through releasing programmes: Release of hatchery-produced
seed is a commonly used approach for inland fisheries resource enhancement. Seed of alien species
is also used in releasing programmes in some countries. Lack of control of genetic quality/attributes in
indigenous species seed used for a releasing programme may result in potential negative impacts on

44
biodiversity and genetic diversity of natural populations. The use of alien species may result in competition
with indigenous species and negative impacts on the diversity of indigenous species.
Standardized protocol for good practice of enhancement and conservation activities: There are a few
examples of guidelines/codes of conduct for implementing enhancement and conservation programmes
in the region, however, there is general lack of science-based standardized protocols covering planning
and implementation of enhancement and conservation programmes. This has resulted in uncertain results
and adverse impacts.
Applicable methodology for effective impact assessment: In general, there is no applicable methodology
for effective impact assessment of different enhancement and conservation programmes. This hinders
the needed improvement in planning and implementation of enhancement and conservation practices
as well as demonstration of socio-economic, ecological and environmental benefits generated from the
enhancement and conservation efforts.
Effective fisheries management: Results of fisheries enhancement and conservation efforts largely rely
on effective management of fishing activities for target waterbodies and species. Although there are
good examples (e.g. in Republic of Korea and China), there is lack of effective management in the
fisheries activities in many countries in the region, which greatly undermines the effectiveness of
enhancement and conservation efforts.
Human resources capacity building: Although enhancement and conservation of inland fisheries resources
has been practiced for decades in the region, there is general lack of well-trained human resources in
many countries in the region. Higher education programmes tend not to include subjects related to inland
fisheries enhancement and conservation.
Recommendations
In order to promote good practice of inland fisheries enhancement and conservation to improve the
livelihoods of inland fisher communities and ecological goods and avoid any potential negative impacts,
it is recommended that national governments, international organizations and NGO to take the following
actions in the region:
Strengthen capacity: The government should strengthen the human and institutional capacity related to
inland fisheries resource enhancement and conservation.
The inclusion of inland fisheries resources enhancement and conservation is recommended as an
important component of the curricula of tertiary educational programmes related to fisheries/aquaculture.
Promote regional cooperation: There is an urgent need for governments to cooperate on inland fisheries
resource use and enhancement in the region. The cooperation could be started by establishing
a mechanism for networking/continuing interaction for sharing of experience on enhancement and
conservation of inland fisheries resources through Web-based networking. It would be supported by
regional lesson-learning and sharing activities such as workshops and collaborative projects through
the joint efforts of regional/intergovernmental organizations.
Develop normative tools and guidelines: There is urgent need to develop normative tools and guidelines
on impact assessment and monitoring of inland fisheries enhancement and conservation activities in
the region Guidelines/code of conduct for informed planning and execution of enhancement and
conservation are also required for the APFIC region. It is expected that international and regional
organizations would take the initiative.
Promote advocacy of inland fisheries: Inland fisheries are often neglected in high-level decision-making
processes. Contribution of proper use and management of inland fisheries resources is not only limited
to the supply of fisheries products, but includes rural livelihoods, aquatic biodiversity, ecological function
and environmental benefit of inland waterbodies. Therefore, there is great need to increase the visibility
of inland fisheries issues with proactive advocacy at government and international forums such as FAO
Committee on Fisheries (COFI), which might consider the possibility of issuing specific technical
guidelines.

45
Part 2
Aquaculture trends in Asia
and the Pacific region

iv
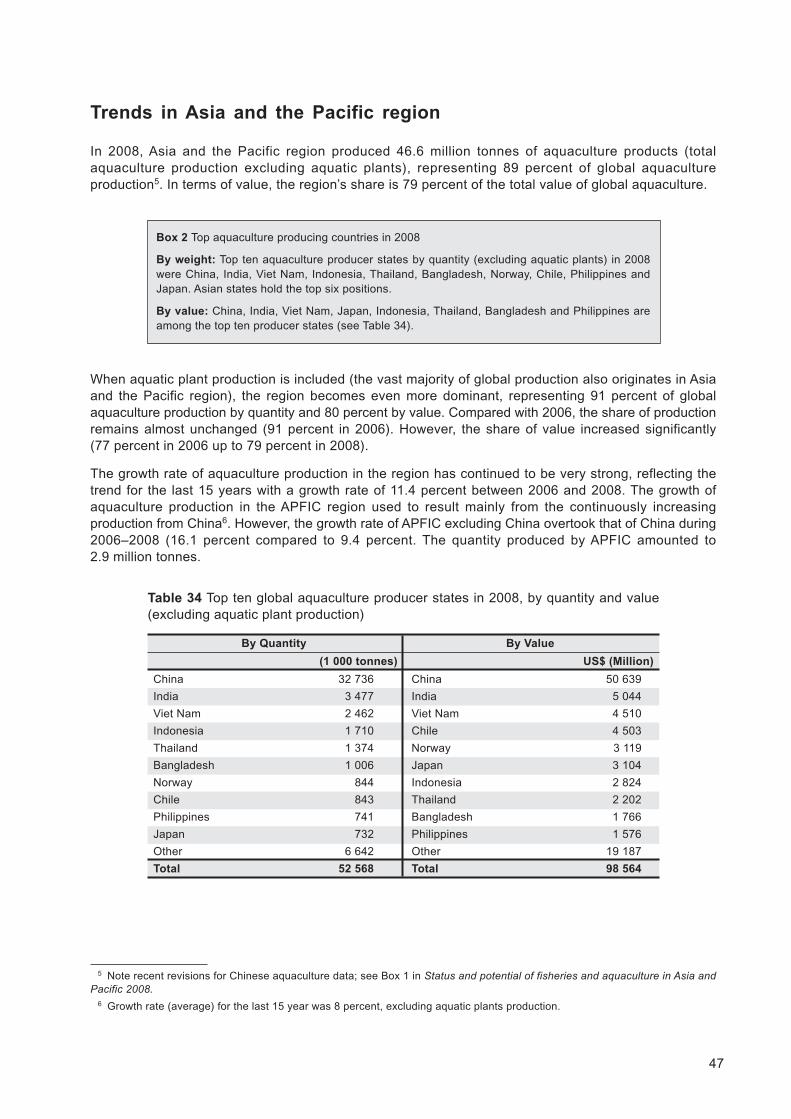
47
Trends in Asia and the Pacific region
In 2008, Asia and the Pacific region produced 46.6 million tonnes of aquaculture products (total
aquaculture production excluding aquatic plants), representing 89 percent of global aquaculture
production5. In terms of value, the region’s share is 79 percent of the total value of global aquaculture.
Box 2 Top aquaculture producing countries in 2008
By weight: Top ten aquaculture producer states by quantity (excluding aquatic plants) in 2008
were China, India, Viet Nam, Indonesia, Thailand, Bangladesh, Norway, Chile, Philippines and
Japan. Asian states hold the top six positions.
By value: China, India, Viet Nam, Japan, Indonesia, Thailand, Bangladesh and Philippines are
among the top ten producer states (see Table 34).
Table 34 Top ten global aquaculture producer states in 2008, by quantity and value
(excluding aquatic plant production)
By Quantity By Value
(1 000 tonnes) US$ (Million)
China 32 736 China 50 639
India 3 477 India 5 044
Viet Nam 2 462 Viet Nam 4 510
Indonesia 1 710 Chile 4 503
Thailand 1 374 Norway 3 119
Bangladesh 1 006 Japan 3 104
Norway 844 Indonesia 2 824
Chile 843 Thailand 2 202
Philippines 741 Bangladesh 1 766
Japan 732 Philippines 1 576
Other 6 642 Other 19 187
Total 52 568 Total 98 564
When aquatic plant production is included (the vast majority of global production also originates in Asia
and the Pacific region), the region becomes even more dominant, representing 91 percent of global
aquaculture production by quantity and 80 percent by value. Compared with 2006, the share of production
remains almost unchanged (91 percent in 2006). However, the share of value increased significantly
(77 percent in 2006 up to 79 percent in 2008).
The growth rate of aquaculture production in the region has continued to be very strong, reflecting the
trend for the last 15 years with a growth rate of 11.4 percent between 2006 and 2008. The growth of
aquaculture production in the APFIC region used to result mainly from the continuously increasing
production from China6. However, the growth rate of APFIC excluding China overtook that of China during
2006–2008 (16.1 percent compared to 9.4 percent. The quantity produced by APFIC amounted to
2.9 million tonnes.
5 Note recent revisions for Chinese aquaculture data; see Box 1 in Status and potential of fisheries and aquaculture in Asia and
Pacific 2008.
6 Growth rate (average) for the last 15 year was 8 percent, excluding aquatic plants production.

48
China
APFIC w/o China
Rest of the world
60 000
50 000
40 000
30 000
20 000
10 000
0
100 000
80 000
60 000
40 000
20 000
0
�1980� 1985� 1990� 1995� 2000� 2005� 2010
Year
To
nn
es
(x
1 0
00
)U
S$
(x
1 0
00
)In terms of tonnage, other countries that have shown large increases included Viet Nam (49 percent),
Indonesia (31 percent), India (9 percent), Philippines (19 percent), Bangladesh (13 percent) Myanmar
(17 percent) and Malaysia (44 percent). Both inland culture and mariculture have shown steady growth,
but the growth rate of the inland culture sector was more rapid in Asia and the Pacific region if China is
excluded (Figure 11).
Note: The data for China refer to the subregion (see page iii this report).
Figure 11 Trends in global aquaculture production (quantity and value) 1984–2008 (excluding aquatic
plants)
Aquaculture production is not increasing throughout the region, with some countries in the region
experiencing negative or zero growth in production during 2006–2008. These countries include Republic
of Korea (-7.74 percent), Thailand (-2.34 percent) and Japan (-0.21 percent). The negative growth
from both Republic of Korea and Thailand is mainly a result of the reduced production of mollusc (some
45 000 tonnes for Republic of Korea and 30 000 tonnes for Thailand). In some cases this reflects
reduction in the intensity of production or the restriction of culture areas.
China7 reported a production of 43 million tonnes in 2008 (including aquatic plants), representing
63 percent of the world aquaculture production. This continues China’s consistent domination of global
aquaculture production but there is a slight decrease over previous years8 (67 percent in 2004, 65 percent
in 2006). Although Chinese aquaculture production is still increasing, its world market share is slightly
decreasing. Since China is such a predominant producer, the scale of reported production can mask
other regional trends and China is therefore hereafter treated separately in this report.
7 This figure is for all China (see page iii), the massive scale of China’s aquaculture production challenges statistical collection
and there are uncertainties regarding the quantities reported.
8 China has recently reviewed and revised aquaculture production statistics and these have been reduced from previously reported
levels. This means that a comparison with production figures in earlier FAO and APFIC reports will not be possible, although the
FAO FishStat data have been adjusted backwards to compensate for this and thus the latest time series in datasets of FAO are
comparable.

49
If China’s aquaculture production is excluded, Asia and the Pacific region still remains an important
production area for aquaculture, exhibiting steady growth regardless of the culture environment.
In particular, inland aquaculture production has tripled from 3.1 (or 2.8) million tonnes in 1994 to 9.7
(or 9.0) million tonnes in 2008 and marine production has also almost doubled (+90 percent) in the same
period. Such advances far exceed the growth of aquaculture in the rest of the world (Figure 12). Excluding
aquatic plants, fresh water aquaculture production achieved much faster growth (23 percent) than
marine/brackish aquaculture production (4 percent) during 2006–2008.
Note: China refers to the subregion, see page v.
Figure 12 Trends in aquaculture production in Asia and the Pacific region by environment 1980–2008
China
APFIC w/o China
Rest of the world
Inland
Marine
To
nn
es
(x
1 0
00
)
35 000
30 000
25 000
20 000
15 000
10 000
5 000
0
20 000
15 000
10 000
5 000
0
�1980� 1985� 1990� 1995� 2000� 2005� 2010
Year
There has been considerable change in the top twenty cultured species9 in the region between 1990
and 2008 (excluding aquatic plants and molluscs).
There are six new members (whiteleg shrimp, pangas catfishes nei, Chinese mitten crab, cyprinids nei,
red swamp crawfish and black carp) in the top 20 species compared with 1990, although inland waters
species (mainly Chinese and Indian carps) still hold the top seven positions. Besides, there is also
significant change in the order of the top 20. Whiteleg shrimp and pangas catfishes nei are among the
top ten species now.
Box 3 Top cultured species in Asia and the Pacific region 2008
The top four cultured species in 2008 were all freshwater carps (grass carp, silver carp, common
carp and bighead carp) and their aggregated production was 12.6 million tonnes accounting for
27 percent of total aquaculture production of the region (excluding aquatic plants).
9 There is still significant volume of aquaculture production reported by large group of species, e.g. not identified at family, order
or species level. Consequently, the species items totals could have underestimated the real production of the individual species.

50
It is worth noting that the number of high-value species that are carnivorous or dependent on high (animal)
protein feed has increased during the past 15 years. Those species with current production exceeding
50 000 tonnes include whiteleg shrimp, channel catfish, mandarin fish, large mouth black bass, oriental
river prawn, yellow catfish, Japanese seabass, swimming crab, left eye flounder, red drum and large
yellow croaker.
In marine waters, the production is generally dominated by high-value carnivorous/high protein feed
dependent species such as penaeid shrimp, jacks and sea breams. Production of crabs as well as the
whiteleg shrimp have made significant advances in recent years, with whiteleg shrimp now the top
production species in the region at 1.3 million tonnes (Table 35).
Table 35 Top fifteen cultured species in Asia and the Pacific region by quantity, excluding aquatic plants
and molluscs (1 000 tonnes)
Inland Waters Marine Waters
1990 2008 1990 2008
Silver carp 1 432 Grass carp 3 761 Milkfish 434 Whiteleg shrimp 1 277
Grass carp 1 042 Silver carp 3 726 Giant tiger prawn 290 Giant tiger prawn 708
Common carp 678 Common carp 2 767 Fleshy prawn 185 Milkfish 676
Bighead carp 672 Bighead carp 2 318 Jap. amberjack 162 Jap. amberjack 159
Roho labeo 245 Catla 2 282 Silver seabream 52 Penaeus shrimp nei 125
Catla 235 Crucian carp 1 956 Banana prawn 33 Indo-Pacific swamp crab 119
Crucian carp 216 Nile tilapia 1 829 Metapenaeus shrimps 29 Aquatic invertebrates nei 104
Nile tilapia 199 Pangas catfishes nei 1 381 Sea squirts nei 28 Japanese seabass 98
Japanese eel 164 Roho labeo 1 159 Coho salmon 24 Japanese sea cucumber 93
Wuchang bream 162 Wuchang bream 600 Penaeus shrimp 20 Swimming crabs, etc. nei 84
Mrigal carp 160 Whiteleg shrimp 547 Aq. invertebrates 12 Banana prawn 80
Mud carp 80 Chinese mitten crab 518 Kuruma prawn 9 Silver seabream 79
Tilapias nei 80 Cyprinids nei 505 Bastard halibut 7 Lefteye flounders nei 78
Silver barb 47 Mrigal carp 464 Indian white prawn 7 Groupers nei 70
Mozambique tilapia 42 Red swamp crawfish 365 Jap. jack mackerel 6 Large yellow croaker 66
Freshwater fish nei 800 Freshwater fish nei 1 218 Marine fishes nei 39 Marine fishes nei 390
It is notable that following an APFIC recommendation in 2006 to provide disaggregated reports of
aquaculture production, the quantity of freshwater fishes nei has decreased by almost 27 percent,
whereas total production has increased indicating improved disaggregation of statistics supplied by
member countries.

51
Species composition
Aquaculture is an expanding sector in Asia and the Pacific region and very important for many of its
economies. The current trend and current expectations are that aquaculture will play an even more
important role in the future, both in terms of an important rural livelihood and an invaluable source of
protein for both the poor and the rich in Asia and the Pacific region, although attention from outside
tends to focus more on international traded commodities.
To highlight the changes taking place within the sector, a review of the major groups of species that are
currently cultured in the region is presented below. Species are grouped according to the trophic needs
of the species and in some cases the degree of reliance on external inputs (such as feeds and
infrastructure for culture). Often the lower trophic levels of aquaculture do not generate the same amount
of attention as the higher level trophic species. The lower trophic levels of aquaculture that require fewer
inputs are often the cornerstone of the diet for both the rural poor and the urban poor. Production is
presented per species (family, order) from all environments (i.e. freshwater, brackish and mariculture)
except for salmonids, in which case production is presented per environment.
To
nn
es (
x 1
000)
4 000
3 000
2 000
1 000
0
Eels
Salmonids
Perch-like fishes
Catfish
Snakeheads
Knifefish and gobies
� 1980� 1985� 1990� 1995� 2000� 2005� 2010
Year
Figure 13 Changes in freshwater carnivorous species production, 1979–2008 in Asia and the Pacific
region
Freshwater carnivorous species or species requiring higher production inputs
Catfish (order Siluriformes)
This is by far the most widely cultured freshwater species group that is carnivorous or dependent on
relatively high protein feed. This group includes the pangas catfish (Pangassius spp.), Clarias spp.,
Mystus spp., and some introduced species (e.g. channel catfish from USA, African catfish). The total
volume exceeds the global production of salmonids. The top five producing states are China, Viet Nam,
Thailand, Indonesia and India. Total production in Asia and the Pacific region in 2008 was 2.4 million
tonnes which is an increase of 70 percent over 2006 (1.4 million tonnes in 2006) and similar to the
increase between 2004 and 2006 (53 percent).
Viet Nam has seen a dramatic increase in the production of tra (Pangasianodon hypothalamus) and
basa (Pangasius bocourti), the two main catfish species cultured in that country with a 140 percent
increase in production of pangas catfishes over the past two years. The production is mainly located in
a few provinces in the south of Viet Nam in the Mekong River delta. The production in 2008 reached
a record 1.25 million tonnes. The United States used to be the largest market for Vietnamese produced
catfish, but after a trade dispute in 2003 the Vietnamese exporters have gradually diversified away from
the US market. The export to the European Union increased and today accounts for more than 50 percent

52
of the export. The Vietnam Association of Seafood Exporters (VASEP) estimates that Viet Nam accounts
for about 40 percent of the total European (27 countries) frozen freshwater fillets market.
China started to report on this group in 2003 and produces 28 percent of the total production in the
region (down from 36 percent in 2006). The Clarias and Mystus spp. of catfish are generally consumed
domestically and are not exported (except the Chinese export of channel catfish to USA).
Snakeheads (family Channidae)
The total production of this group for Asia and the Pacific region in 2008 was 373 080 tonnes. The top
four producing states are China, India, Indonesia and Thailand. China has recently started to report
snakehead production separately (as with the catfish) and in 2008 China produced 87 percent of the
total Asian production for snakeheads.
The trend for this group is hard to describe because of the recent of inclusion of the Chinese production
in 2003. Indonesia and Thailand show a stable trend at a low level (approximately 10 000 tonnes).
India has fluctuated in the past ten years with a high in 2000 of 80 000 tonnes and a low in 2001 of
1 300 tonnes, and is again showing a decrease to 18 000 tonnes (35 000 in 2006). The production in
China has increased by 24 percent to 324 000 tonnes since 2006.
The snakehead species, although generally popular in some countries do not enjoy a large export market,
even within the region. There is certainly no intraregional trade, the fish has no real fillet value and is
generally sold live or whole. However, some of it is exported from China to Hong Kong SAR. The rapid
rise of Pangassius spp. and tilapia has undermined the significance of the species group in some
countries where it once had greater prominence as a cultured species. Its carnivorous nature also means
that profit margins are generally lower than those which can be achieved from the more omnivorous
catfish species.
Eels (order Anguilliformes and Synbranchiformes)
The global production of eels in 2008 was 477 704 tonnes, more than double the production in 2002.
The vast majority (98 percent) of this production was produced in Asian farms, and increased by
18 percent compared with 2006 (Figure 13). Production in China has risen steadily, reaching a new
high in 2008 of 205 000 tonnes. The production of Taiwan POC has declined greatly to 21 000 tonnes
in 2008, compared to the top production year of 1990 (55 000 tonnes). Eel production in Japan (Anguilla
japonica) has remained stable for the past five years at about 20 000 tonnes. Taiwan POC, Malaysia
and Republic of Korea also produced some quantities of Japanese eel through aquaculture. All of this
production is reported as Japanese eel.
China has regularly imported European glass eels (Anguilla Anguilla) and therefore its reported Japanese
eel production is likely to include the European eel too. Europe has increasingly supplied Asian eel farms
with glass eels and the region has gradually become more dependent on the wild-caught eels of Europe.
In 1997, for example, France exported more than 266 tonnes of European eels to destinations outside
the European Union (EU), amounting to 55 percent of all EU eel exports outside Europe that year.
Correspondingly, the Chinese import of eel in 2007 was 203 tonnes (Ringuet et al., 2002). The listing of
European eel under CITES Appendix II came into effect on March 2009 and this now means that export
outside of Europe is restricted. The sourcing of elvers within Asia and the Pacific region has now become
a priority, with reports of several countries looking to their own resources for possible export to China
and other eel culturing countries.
The Asian swamp eel (Synbranchidae) production is also high at 212 000 tonnes for 2008 in China with
minor production reported from Thailand and Cambodia10.
It should be noted that the accurate reporting of eel production with respect to the actual species produced
is now of considerable importance with regard to the CITES listing. The APFIC region should see
a significant decline in Anguilla Anguilla production (in principle to zero) from Asian countries that lie
outside of its natural range and therefore cannot import elvers from Europe.
10 Previously reported as Chinese swamp eel and “lai”. The word “lai” is Thai and is generally used for eel (i.e. pla lai; probably
swamp eel Monopterus albus). This reporting from China could be because of the import of elvers from Thailand.

53
Perch-like fishes (family Percichthyidae)
China reported a production of 229 000 tonnes for mandarin fish (Siniperca chuatsi) in 2008. The
production has been steadily increasing since 1995 when it was first reported in China. Other reported
species in this family are Murray cod (Australia) and golden perch. The culture of mandarin fish in China
is worth mentioning since being highly carnivorous it is considered only possible to raise it on live food.
There has now developed a complete service sector of farmers who produce small bream as live feed
for this fish. This is a good example of a low trophic level fish being cultured as feed for a carnivore,
with little or no reliance on marine sources of feed in the system. A lesson here is that small-scale farmers
can use low risk systems to service more intensive or higher-value aquaculture operations. China also
reported the production of 166 601 tonnes for largemouth black bass (Micropterus salmoides), which
was introduced to China from North America and was first reported in 2003.
Salmonids – freshwater (family Salmonidae)
Freshwater production of salmonid species in the region has developed rapidly in the last four years
and reached 93 628 tonnes in 2008, an increase by 27 percent compared with 2006. This is in part
because of the development of the rainbow trout industry in the Islamic Republic of Iran, which has
more than doubled the production in four years (to 62 630 tonnes) and in part because of the salmonid
(trout) production in China that now amounts to almost 17 000 tonnes (increased from 10 247 tonnes in
2004)11. Trout is now also produced in smaller quantities in several other Asian countries (e.g. Republic
of Korea, Viet Nam, Thailand, India, Nepal and Afghanistan), but in some cases may not appear in the
disaggregated statistics.
Knifefish and gobies (order Osteoglosiformes and Gobiformes)
These species are not widely cultured but have a good market price in certain countries. The sand goby
production in Asia continues to be almost totally based on on-growing of wild caught fingerlings. The
total production of knifefish and gobies was 698 tonnes in 2008 (840 tonnes in 2006) which however is
an increase by more than 500 tonnes over 2004. Almost all this increase can be attributed to the
Indonesian production of marble goby.
Marble goby is hence also the most cultured species in the order. Thailand has shown a declining trend
and in Malaysia the production has declined by half to about 100 tonnes in 2008, except for a peak in
2003 of almost 700 tonnes. The slow growth rate and carnivorous habit as well as the requirement for
moving or well-aerated water make culture of this species comparatively costly. The low densities of
culture also mean that returns per unit area are low and the rerun period is long. Farmers may now be
tending to move away form this species towards more rapid turnover and intensive systems of tilapia,
where margins and lower, but cash flow is more regular.
Marine and brackish water carnivorous species or species requiring higher production inputs
Amberjacks (family Carangidae)
Japanese culture of amberjack (Seriola) is the leader within this family with production stable at
158 300 tonnes in 2008 (Figure 14). The Japanese fishery for fingerlings of this species (Mojako) is an
interesting example of what might be considered a sustainable fish seed fishery for aquaculture. The
juveniles are caught in a fishery using seaweed as attractants and the juveniles are transported live to
the farms for on-growing. The system is demonstrably sustainable because of the length of time it has
been pursued and the fishery catch records show no discernable impact on the adult fishery.
Barramundi and Japanese seabass (family Centropomidae and Percichthyidae)
China reported large production of Japanese seabass (Lateolabrax japonicus) starting in 2003 and is
now up to 96 000 tonnes. This may have been an effect of China’s improved reporting on individual
species (these species may have previously been reported under marine finfish nei). Republic of Korea
11 Not reported at species level, although probably included in nei group.
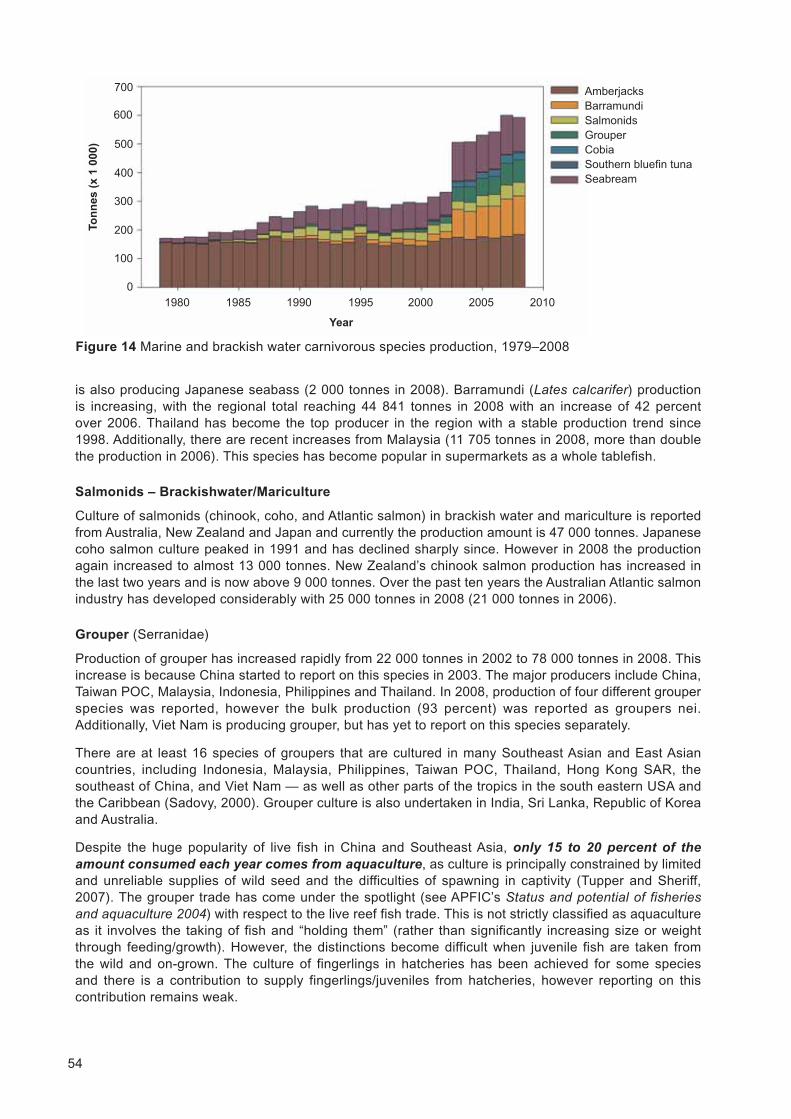
54
is also producing Japanese seabass (2 000 tonnes in 2008). Barramundi (Lates calcarifer) production
is increasing, with the regional total reaching 44 841 tonnes in 2008 with an increase of 42 percent
over 2006. Thailand has become the top producer in the region with a stable production trend since
1998. Additionally, there are recent increases from Malaysia (11 705 tonnes in 2008, more than double
the production in 2006). This species has become popular in supermarkets as a whole tablefish.
Salmonids – Brackishwater/Mariculture
Culture of salmonids (chinook, coho, and Atlantic salmon) in brackish water and mariculture is reported
from Australia, New Zealand and Japan and currently the production amount is 47 000 tonnes. Japanese
coho salmon culture peaked in 1991 and has declined sharply since. However in 2008 the production
again increased to almost 13 000 tonnes. New Zealand’s chinook salmon production has increased in
the last two years and is now above 9 000 tonnes. Over the past ten years the Australian Atlantic salmon
industry has developed considerably with 25 000 tonnes in 2008 (21 000 tonnes in 2006).
Grouper (Serranidae)
Production of grouper has increased rapidly from 22 000 tonnes in 2002 to 78 000 tonnes in 2008. This
increase is because China started to report on this species in 2003. The major producers include China,
Taiwan POC, Malaysia, Indonesia, Philippines and Thailand. In 2008, production of four different grouper
species was reported, however the bulk production (93 percent) was reported as groupers nei.
Additionally, Viet Nam is producing grouper, but has yet to report on this species separately.
There are at least 16 species of groupers that are cultured in many Southeast Asian and East Asian
countries, including Indonesia, Malaysia, Philippines, Taiwan POC, Thailand, Hong Kong SAR, the
southeast of China, and Viet Nam — as well as other parts of the tropics in the south eastern USA and
the Caribbean (Sadovy, 2000). Grouper culture is also undertaken in India, Sri Lanka, Republic of Korea
and Australia.
Despite the huge popularity of live fish in China and Southeast Asia, only 15 to 20 percent of the
amount consumed each year comes from aquaculture, as culture is principally constrained by limited
and unreliable supplies of wild seed and the difficulties of spawning in captivity (Tupper and Sheriff,
2007). The grouper trade has come under the spotlight (see APFIC’s Status and potential of fisheries
and aquaculture 2004) with respect to the live reef fish trade. This is not strictly classified as aquaculture
as it involves the taking of fish and “holding them” (rather than significantly increasing size or weight
through feeding/growth). However, the distinctions become difficult when juvenile fish are taken from
the wild and on-grown. The culture of fingerlings in hatcheries has been achieved for some species
and there is a contribution to supply fingerlings/juveniles from hatcheries, however reporting on this
contribution remains weak.
Figure 14 Marine and brackish water carnivorous species production, 1979–2008
To
nn
es
(x
1 0
00
)700
600
500
400
300
200
100
0
� 1980� 1985� 1990� 1995� 2000� 2005� 2010
Year
Amberjacks
Barramundi
Salmonids
Grouper
Cobia
Southern bluefin tuna
Seabream

55
Since grouper are particularly difficult to culture in closed systems, full-cycle culture of most grouper
species is not yet possible (although several important advances have been made in recent years). For
this reason, about two-thirds of all grouper culture involves the capture and grow-out of wild seed (Sadovy,
2000). There needs to be greater disaggregation from grouper produced from hatchery reared fingerlings
versus that dependent on wild caught fingerlings and juveniles.
This is an area that would benefit from improved labelling and traceability possibly under a certification
scheme. The starting point for this would be to target those countries that are producing significant
numbers of grouper fingerlings from hatcheries to determine the relative percentage contribution of
fingerlings from each source (and the species that this comprises).
Cobia (Rachycentridae)
Cobia (Rachycentron canadum) culture has increased rapidly from 13 tonnes in 1996 to 2 400 tonnes
in 2002 and was almost 25 000 tonnes in 2008. One main reason for the rapid increase is that China is
reporting this species separately. Chinese production in 2008 was 23 500 tonnes whereas Taiwan POC
reported a production of 1 000 tonnes (a decrease of almost 2 000 tonnes compared to 2006). Culture
of this species is believed to take place in other states such as Viet Nam and Thailand, largely as
a result of the increasing availability of fingerlings from Taiwan POC. This production is, however, not
reported widely, therefore the total production can be considered conservative.
The very rapid growth rate of this species and relative hardiness in ponds make it an attractive species
for aquaculture. It has been dubbed the “tropical salmon” because of these characteristics, however
feed conversion ratios (FCRs) are high currently which increases production costs and reduces the profit
margin (in some cases there is a net loss). The fish does not enjoy wide acceptance in Asia partly
because of it being an unusual catch item (it has a solitary habit) and hence an unfamiliar species to
many. Its firm flesh makes good sashimi and it bakes well, but in other places it is more commonly
known as a dried or salted fish.
Southern bluefin tuna (Scombridae)
Aquaculture fattening of southern bluefin tuna in Australia has emerged as a significant industry for the
country over the past ten years reaching 4 000 tonnes in 2002 and 4 500 tonnes in 2008. Although the
quantity is relatively low compared with other species, the very high value of this product makes its
production a significant economic activity wherever it is practiced. The total effective catch limit of the
Australian southern bluefin tuna wild harvest component of the fishery was set at 4 015 tonnes12.
Since 1 January 2009, the Commission for the Conservation of Southern Bluefin Tuna (CSSBT) has
established a list of authorised farms, which are approved to operate for farming southern bluefin tuna.
SBT Farms not on the list are deemed not to be authorised to operate for farming of southern bluefin
tuna. Currently, data regarding the weight added through fattening is not available.
Seabream (Sparidae)
Seabream production is confined to Japan, China, Taiwan POC, Republic of Korea and Hong Kong SAR.
The Japanese production of seabream was 71 000 tonnes in 2008. China reported almost 40 000 tonnes
from 2003 (the first year figures for seabream production were reported). In 2008 the production was
36 000 tonnes (down from 46 000 tonnes in 2006). The production of this species was probably reported
earlier as “other marine finfish nei”.
Other important carnivorous species
There are some important marine carnivorous species that were not specially mentioned in earlier editions
of the APFIC biennial status and potential review. These species may have significant impact on marine
finfish culture in the region in the coming years although their culture is currently limited to a few countries.
These species include silver seabream (78 515 tonnes in 2008), lefteye flounder (78 141 tonnes in 2008),
large yellow croaker (65 977 tonnes in 2008), red drum (50 947 tonnes in 2008), bastard halibut
(50 632 tonnes in 2008), porgies and seabream nei (38 753 tonnes) and puffer fish (21 733 tonnes).
12 http://www.ccsbt.org/docs/management.html

56
■ Silver sea bream is mainly cultured in two countries: Japan with more or less stable production
in recent years and Republic of Korea with increased production of about 20 percent between
2006 and 2008. Production of lefteye flounder nei is primarily from China where production
has been increasing steadily since it was first reported in 2003 (an increase of 40 percent
between 2006 and 2008).
■ This group of fish also includes the European turbot which represents more than 50 percent
of the lefteye flounder nei produced in China. DPR Korea has recently started the experimental
culture of European turbot through an FAO TCP project.
■ Both large yellow croaker and red drum are currently cultured only in China with steady increase
in the production since it was first reported in 2003. The production of the species both
increased by nearly 30 percent during 2003–2008. Bastard halibut production is reported from
Japan and Republic of Korea only. Production from Japan has declined slightly and production
from Republic of Korea has increased steadily in recent years.
■ Production of porgies and seabream nei were reported from China (including Taiwan POC)
and Republic of Korea. The production has fluctuated in China and declined in Republic of
Korea in recent years.
Other marine finfish not elsewhere identified (nei)
Most of the fish in this group are assumed to be carnivorous species and are fed by trash/low value
fish from capture fisheries. This group of fish is of interest because of the large reported production
Table 36 Aquaculture production reported
under marine fishes nei, 2006 and 2008
(tonnes)
Country/Entity 2006 2008
China 243 950 308 451
India 75 000 37 064
Indonesia 826 22 449
Japan 5 930 7 900
Viet Nam 0 5 000
Malaysia 3 276 2 460
Philippines 416 2 391
Taiwan POC 3 056 2 259
Australia 27 1 924
China, HK SAR 728 342
Korea, Republic of 262 231
from China. Even though China has decreased its
reporting on nei species by 64 percent from 2002 to
2004, it has since increased again in 2006 and again
in 2008 (Table 36). Since the individual species are not
reported, trends cannot be determined.
Total production of culture marine/brackish carnivorous
fish species in the APFIC region has increased
considerably in the last four years and reached some
650 000 tonnes in 2008, an increase of 23 percent over
2004. The culture of marine carnivorous fish typically
depends on direct use of low-value fish, which has
brought about increasing concern over the pressure on
capture fisheries recently. To address the issue, an FAO
regional TCP project on substituting low value fish with
pellet feed has been implemented successfully and
indicates that the substitution with formulated feeds can
be profitable and improve management.
Finfish requiring lower inputs
Freshwater omnivorous and herbivorous fish have been important food fish for developing states in Asia
and the Pacific region. Traditional production methods have become diversified and intensified, starting
with fertilized polyculture systems and moving towards systems using more supplementary feeds and
even complete feeds. Driven by the pursuit of a high economic return per unit water body and offsetting
the slacked market price, further pressure on intensification and the use of feeding can be expected in
many states.
Traditional pond culture still remains as the dominant production system for finfish species requiring
lower inputs in the region. For instance, production from pond systems accounts for 80 percent of the
total production. On the other hand, non-dominant farming systems, such as backyard ponds, paddyfields
and floodplains are expanding in some countries in the region. Production from these non-dominant
farming systems is often poorly captured in national statistical data collection, mainly because of the
small unit size and scattered distribution. The production from individual operation of such systems may
be insignificant. However, the large number of these ponds and the aggregated production and value to

57
the households engaging in the activity is probably very significant. The lack of reliable information about
this part of the sector currently limits evaluation of the grassroots impact of rural aquaculture in the
region. Member countries should improve the data collection for aquaculture statistics to fully capture
the contribution of all kinds of aquaculture operations.
Although it has been suggested that the wide range of aquatic species currently cultured would reduce
as greater rationalization and aggregation of production operations focus on a small number of species
based on the lesson of livestock sector “industrialization”, this has not appeared to be the case in the
region so far. Instead, significant diversification of species used in aquaculture has been observed in
many countries in the region as the response to diversifying market demand domestically and
internationally.
Freshwater fish nei
The reported statistics from China saw a reduction of “freshwater fish nei” from almost 1.8 million tonnes
in 2002 to less than 500 000 tonnes in 2003, but this has now increased again to 675 000 tonnes in
2008. Many of these “freshwater fish nei” are now reported by species and interestingly are mostly
carnivorous species with the exception of pirapatinga. The species which are now reported in detail by
China are Amur catfish (307 000 tonnes), snakehead (303 000 tonnes), swamp eel (lai) (192 000 tonnes),
channel catfish (170 000 tonnes), pond loach (127 000 tonnes), yellow catfish (100 000 tonnes),
pirapatinga (90 000 tonnes), Chinese longsnout catfish (24 000 tonnes), sturgeons nei (17 000 tonnes),
trout (15 000 tonnes), pond smelt (10 000 tonnes), and salmonids nei (1 500 tonnes). Of these, the
channel catfish and Chinese longsnout catfish have seen the biggest increases (in terms of percentage)
since 2004.
Tilapia (Cichlidae)
Tilapia production has increased steadily over the past two decades and is the 2nd most important cultured
finfish species group after carps. Tilapia production reached 2.13 million tonnes in 2008 with an increase
of 23 percent over 2006. This development has been mainly driven by the demand in the international
market. In order to meet the export standard on size of fish, the culture is getting more intensive and
dependent on pellet feed. Such an “industrialization” trend is seen in some states with species such as
tilapia. There is a trend towards standardization of size, feeds and production systems, some quality
control, avoidance of off-flavours, and marketing to supermarket chains. In 2008 the top eight producers
in the region together produced 2.1 million tonnes of tilapia, a large increase from the 1.7 million tonnes
produced in 2006 (Table 37).
Reported volume of exports
of tilapia is equivalent to 14
percent of the regional pro-
duction volume. However,
tilapia is usually exported in
processed form (often fillet).
Considering the normal
dressing out percentage of
60 percent for whole fish and
35 percent for fillet, raw tilapia
used for export may account for nearly 30 percent of the total
production. The production of tilapia is still largely consumed locally.
The continuing domestic demand and the high quality required for
export targeted fish mean that domestic marketing is still attractive
in many states. The biggest exporter of frozen whole tilapia and frozen fillets to the USA was China
(mainland and Taiwan Province, Table 38), accounting for 90 percent of total supply in 2006.
Table 38 Countries exporting
tilapia, 2008
Country Tonnes
China 164 008
Taiwan POC 37 071
Thailand 18 735
Bangladesh 112
Table 37 Top eight producer
States of tilapia, 2008
Country Tonnes
China 1 110 298
Indonesia 328 831
Philippines 257 133
Thailand 209 945
Taiwan POC 81 009
Viet Nam 50 000
Malaysia 34 823
Myanmar 32 794

58
grass carp, which was previously in a distant second position, has now moved to first place. Common
carp, bighead carp and crucian carp follow on this list. Common carp is the most widely cultured species
in the region with 20 states and areas having reported culturing this species.
Although production of most of the species in this group generally exhibits an increasing trend, the rate
of growth since 2001 for silver carp has started to show signs of slowing down. There are reports that
the profitability of production of these species in India and China is declining and farmers are starting to
explore the production of alternative higher value species. Since the markets of these species are largely
domestic, there is little opportunity for export, although India, for example, does export to neighbouring
Nepal and Bangladesh. Moreover, Myanmar has recently strongly developed its exports of carp to
neighbouring Bangladesh and also to the Near East.
Pacus and pirapatinga (Collossoma spp. and Piaractus spp.)
These Latin American species are not reported in detail for most countries, instead they are grouped
under “freshwater species nei”. China began reporting production of pirapatinga (Piaractus brachypomus)
separately in 2003 and there was a reported 78 000 tonnes produced in 2006 and 77 000 tonnes produced
in 2008. Additionally, Viet Nam and Myanmar started to report production in 2008, about 6 000 tonnes
each.
Milkfish
Table 39 Top ten producer States of carps
and barbs, 2008
Country Tonnes
China 14 609 519
India 3 200 621
Bangladesh 696 053
Myanmar 553 101
Viet Nam 415 000
Indonesia 287 877
Pakistan 135 000
Iran (Islamic Rep. of) 87 679
Thailand 63 016
Lao People’s Dem. Rep. 58 410
Table 40 Top four producer States of milkfish,
2008
CountryCulture
TonnesEnvironment
Philippines Brackish 226 032
Marine 80 365
Freshwater 44 439
Indonesia Brackish 277 002
Marine 469
Taiwan POC Brackish 27 944
Freshwater 18 930
Singapore Marine 917
Carps and barbs (Cyprinidae)
Finfish aquaculture production from the APFIC region has long been dominated by carps and barbs,
a situation which is very unlikely to change in the foreseeable future. This is because of the massive
volume of production, which is almost entirely consumed domestically. Total production of carps and
barbs from APFIC states in 2008 exceeded 20 million
tonnes for the first time in history (Table 39). Compared
with 2006, the share of carps and barbs in total
aquaculture production (43 percent, excluding aquatic
plants) remained the same in 2008. Within the region,
production of carps and barbs declined in China from
46 percent in 2006 to 44 percent in 2008, whereas
regionally the production of carps and barbs in APFIC
countries excluding China increased from 38 percent in
2006 to 41 percent in 2008.
The top four cultured fish species are carps from
freshwater production (Table 35). Their production is
particularly important in terms of the vital supply of
protein in the major populous states in the region such
as China, India and Bangladesh. Silver carp has had
the highest production for decades, however in 2008
Milkfish culture is a strong tradition in the Philippines
and this reflects the country’s preference for the species
(Table 40). There are also traditions of milkfish culture
in some of the Pacific Islands (e.g. Guam, Kiribati, Cook
Islands and Palau). Milkfish have typically been
produced in brackishwater ponds but there is an
increasing trend in mariculture production reported,
indicating the more intensive use of cage systems.
These systems are fed with either pellets or trash/low
value fish and are part of the general trend of
intensification of mariculture in the Philippines.
Indonesia and the Philippines are traditionally the
largest producers. Taiwan POC is reducing its production, possibly because of increasing attention to
higher-value species. Singapore has developed its mariculture of milkfish steadily.

59
Mullet (order Mugiliformes)
Pond-based brackishwater culture of mullet is typical, but Republic of Korea has been reporting increasing
mariculture production since 2000 (over 6 000 tonnes in 2008), and the freshwater culture is almost
zero. Indonesia produces the bulk of these species (over 8 000 tonnes) and although the country
experienced a sharp decline in 1998, it has since shown a stable positive trend (although there was
a sharp drop again by nearly 50 percentage in 2007). Taiwan POC has seen a 50 percent drop in
production between 2006 and 2008 and Thailand has greatly reduced production in recent years.
Although not reported as a separate species, China is a noteworthy producer of mullet (reported as
marine finfish nei).
Crustaceans
Crustaceans are the aquaculture species group of highest value in the region. Production of crustaceans
has been increasing since the mid-1990s despite problems with a number of diseases. Cultured
crustacean production reached 4.45 million tonnes in 2008, an increase of 19 percent over 2006. Although
a large number of crustacean species are cultured currently in the region, the predominant commercial
species are two penaeid shrimp, two freshwater prawn and three crab species.
Penaeid shrimp culture
Marine shrimp continued to dominate crustacean aquaculture, with two major species (the whiteleg shrimp
Penaeus vannamei and giant tiger shrimp Penaeus monodon) accounting for 57 percent of the total
crustacean production in 2008 (62 percent in 2006). Whiteleg shrimp production in Asia and the Pacific
region increased from 2 000 tonnes in 2000 to over a million tonnes in 2004. Production of whiteleg
Table 41 Top ten producers of
Penaeid shrimp, 2008
Country Tonnes
China 1 268 074
Thailand 507 500
Indonesia 408 246
Viet Nam 381 300
India 86 600
Bangladesh 67 197
Malaysia 51 047
Myanmar 48 303
Philippines 48 199
Taiwan POC 11 761
shrimp in the region reached 1.82 million tonnes in 2008 with an
8 percent increase over 2006. China, Thailand, Indonesia and
Viet Nam were the major producers of cultured whiteleg shrimp in
the region during 2008 (Table 41). The production from China
reached more than 1 million tonnes in 2007 with a significant
increase of 20 percent over 2006, production has since stabilized.
Production from Thailand has remained stable during 2006–2008
(0.5 million tonnes). Production from Indonesia has increased
steadily since 2004, reaching 209 000 tonnes in 2008. Viet Nam has
seen a huge drop in production (-74 percent) in 2008 following rapid
increases between 2004 and 2006).
Giant tiger prawn is the most important species of crustacean
traditionally cultured in the region. After continuous decline of
production during 2004–2007, production of giant tiger prawn
increased by 22 percent at 714 527 tonnes in 2008. However, such
increase was mainly because of the drastic growth of production from
Viet Nam (174 000 tonnes) and a limited increase from the Philippines (7 000 tonnes). A declining trend
of production was observed for most other producers in the region. This may be caused by the shift of
some farmers to extensive farming practices.
Many other countries are now producing this species, but not yet at a level that it is entering the statistics.
Whiteleg shrimp ranked tenth by weight in terms of regional aquaculture production in 2006 (excluding
plants). However, it ranked first by value at US$6 485 million, which is almost a doubling since 2004.
Production trends in the region have increased over the past twenty years for the major producers
(Table 35). China suffered a major setback in shrimp farming in the mid-1990s because of the occurrence
of viral diseases in shrimp culture, but since that time production has recovered (initially slowly) and
has been increasing rapidly in recent years.
Other major producers, Thailand and Viet Nam, have also encountered fluctuations in production primarily
associated with the impact of viral diseases. Production in the Philippines, India, Sri Lanka and Indonesia
has also been affected by the impact of viral diseases, typically white spot syndrome virus (WSSV).
There are good indications that the development of more biosecure shrimp farming systems and better

60
farm management practices have made it possible for shrimp farmers to limit the negative impact of
viral diseases. The introduction of specific pathogen free (SPF) broodstock and post-larvae has also
been important in this development. Generally, the high demand from the international market has
maintained interest in the culture of shrimp for export. The main reason for importing P. vannamei to
Asia has been the poor performance, slow growth rate and disease susceptibility of the major indigenous
cultured shrimp species, P. chinensis in China and P. monodon virtually everywhere else.
The trend in shifting production away from P. monodon to P. vannamei is quite clear now and has been
reported in previous APFIC publications. The massive increase in the volume of production of whiteleg
shrimp coupled to the similar size ranges produced by all countries has led to severely depressed prices
for whiteleg shrimp. With so many states now producing essentially the same product, global prices
dropped dramatically during 2002 and 2003. There has been a trend of decreasing shrimp prices for
a number of years now, especially for the smaller sized whiteleg shrimp. This has follow-up effects
regarding the actual value of the product sold and disagreements regarding possible dumping of shrimp
onto markets.
Producers are attempting to overcome the problem of low prices and narrow profit margins through
greater intensification. This echoes the trend in the early 1990s and although systems have improved
with the use of limited water exchange and SPF stock, there are still aggregated environmental impacts
at the system level because of the total loadings. P. monodon prices remain very high because of
a lack of supply, however, until SPF broodstock can be produced, the disease risks for intensive systems
remain too high for farmers. It can be anticipated that there will be a significant shift back to P. monodon
production once reliable and commercially available supplies of SPF stocks can be accessed in the
region.
Freshwater prawns
Giant river prawn and oriental river prawn are major freshwater prawn species cultured in the region.
Production of these two species has increased by 13 percent during 2006–2008. Oriental river prawn is
Table 42 Top eight producers of
freshwater prawn, 2008
Country Tonnes
China 345 894
Thailand 28 500
Bangladesh 23 377
India 12 800
Taiwan POC 10 058
Myanmar 2 881
Indonesia 942
Malaysia 355
currently cultured in China only. Giant river prawn is cultured in some
13 countries in the region. However, the major production is from
China, Thailand, Bangladesh, India and Taiwan POC (Table 42). Total
production of the species reached 207 093 tonnes in 2008 with an
increase of 13 percent over 2006. Production from China, Thailand
and Bangladesh increased significantly during 2006–2008. However,
production from India declined more than half from 30 115 tonnes
in 2006 to 12 800 tonnes in 2008.
It is not easy to intensify production of freshwater prawns because
of their territorial habits and divergent growth effects. This means
that the development of this sector is reasonably slow and in some
states the sector has even shrunk, as attention and resources have
been diverted to brackishwater shrimp production. Export markets
for freshwater prawns are much smaller and less developed, mainly
because consumers in general are not as familiar with these species as they are with brackishwater
shrimp. Freshwater prawns, however, enjoy good domestic markets especially in South Asian and
Southeast Asian states.
Crabs
During 2006–2008, culture crab production continued its increasing trend of the past two decades. The
production reached 759 114 tonnes in 2008 with an increase of 25 percent over 2006. Chinese mitten
crab contributed 68 percent of the total culture crab production in the region in 2008. This species is
currently mainly cultured in China with a very small amount produced in Republic of Korea, although
a few countries have shown some interest.
Indo-Pacific swamp crab (Scylla serrata) is the most cultured species in the region (12 countries reported
production in 2008) with 138 000 tonnes produced in 2008 (an increase of 29 percent over 2006).
Indo-Pacific swamp crab has shown a stable increasing production trend for the past decade.

61
Production of swimming crab from China has increased steadily since it was first reported in 2003.
Production reached 83 803 tonnes in 2008, which is an increase of 8 percent over 2006.
Freshwater crayfish
Freshwater crayfish production has increased dramatically in recent years, because of the rapid increase
of production of red swamp crayfish from China. The production reached 364 619 tonnes in 2008, an
increase of 224 percent over 2006. The other three crayfish species (yabby crayfish, red claw crayfish
and marron crayfish) totalled little more than 200 tonnes, a significant reduction from the 2006 figure of
260 tonnes.
Lobster
Lobster is a commodity with very little production volume but very high value. Its production reached
372 tonnes in 2008, more than ten times the production in 2006. The dominant species cultured is tropical
spiny lobster. Indonesia is the largest producer followed by the Philippines. The rapid increase in the
culture of lobster may adversely impact the natural resources as it is entirely dependent on natural seed.
Lobster culture is also practiced in other countries in the region such a Viet Nam, but this is not
disaggregated in the reporting to FAO.
Molluscs
Mollusc culture is split into low-value species produced in extensive cultured systems (e.g. seeded blood
cockle mudflats, mussel and oyster stake culture) and high-value species produced in intensive systems
(fed systems, and possibly recirculation).
Recent improved breakdown by species of aquaculture production of Chinese molluscs has given a better
indication of the proportion of low- and high-value mollusc production. China’s reported production of
“molluscs nei” has dropped from 1.3 million in 2000 to below 1 million tonnes in 2006 and down to
780 000 tonnes in 2008, back to the 2004 level (the major drop between 2002 and 2004).
Although it is possible to separate species such as abalone or giant clam as high-value species, there
are difficulties with some species such as mussels that may be cultured in low-input systems in one
country (e.g. Thailand) but relatively high-input systems in another (e.g. New Zealand). Many states
report their mollusc production in large groupings such as “marine molluscs nei”. The IFPRI/WFC outlook
on fish supply (Delgado et al., 2003) projected increasing mollusc production, although this may have
been based on current production trends rather than the resource potential.
Unlike fish culture, the intensification of mollusc culture is quite difficult and probably not economically
viable. The issue of site availability is likely to constrain future development of mollusc culture in several
states as can be seen in the levelling off, or decline in production from both Japan and the Republic of
Korea. In these two states, the production of molluscs decreased significantly in 2008 (Tables 43 and 44).
Table 43 Top ten producers of lower value molluscs, 2008
Country Species 2006 2008 % Change
China Japanese carpet shell 2 639 841 3 058 073 16
China Constricted tagelus 593 771 742 084 25
China Blood cockle 276 288 290 177 5
Thailand Green mussel 272 901 243 821 -11
New Zealand New Zealand mussel 97 000 100 100 3
Korea, Republic of Korean mussel 81 617 67 442 -17
Thailand Blood cockle 66 062 66 140 0
Malaysia Blood cockle 45 674 61 138 34
Philippines Green mussel 19 690 23 017 17
India Green mussel 10 060 16 789 67

62
Table 44 Top ten producers of higher value molluscs, 2008
Country Species 2006 2008 % Change
China Cupped oysters nei 3 403 446 3 354 382 -1
Korea, Republic of Pacific cupped oyster 283 296 249 976 -12
Japan Yesso scallop 212 094 225 600 6
Japan Pacific cupped oyster 208 182 190 400 -9
Taiwan POC Pacific cupped oyster 28 547 34 514 21
Thailand Cupped oysters nei 21 612 21 800 1
Philippines Slipper cupped oyster 16 838 20 175 20
Australia Cupped oysters nei 5 397 5 448 1
Australia Sydney cupped oyster 4 071 4 000 -2
New Zealand Pacific cupped oyster 2 800 3 170 13
The trend in mollusc culture is more likely to be a shift from lower-value species to higher-value species
in those areas where sites are suitable. A further dimension is the development of intensive onshore
culture operations such as those for abalone and a number of gastropod species. Abalone production
in the region increased 70 percent between 2006 and 2008 reaching 39 046 tonnes.
Aquatic plants Table 45 Top ten producers of aquatic
plants, 2008
Countries Tonnes
China 9 933 785
Indonesia 2 145 061
Philippines 1 666 556
Korea, Republic of 921 024
Japan 455 400
DPR Korea 444 300
Malaysia 111 298
Viet Nam 35 700
Cambodia 16 000
Taiwan POC 6 879
Table 46 Top ten cultured species of aquatic
plants, 2008
Species Tonnes
Japanese kelp 4 320 776
Aquatic plants nei 2 470 617
Eucheuma seaweeds nei 2 007 041
Wakame 1 755 886
Zanzibar weed 1 422 691
Warty gracilaria 1 151 321
Nori nei 814 660
Laver (Nori) 562 160
Gracilaria seaweeds 245 649
Elkhorn sea moss 239 768
Aquatic plant production can be divided into two distinct
groups. The first group consists of seaweeds of
temperate waters that are traditionally used for food
purposes and are mainly produced in East Asia. The
second group consists of tropical species mainly
processed as a source of commercially valuable
biopolymers (carrageenan, agar) that are used for
various food and non-food purposes and are produced
in Southeast Asia (Table 45).
Seaweeds for food purpose
This group includes Japanese kelp, laver (nori), green
laver and wakame. The production of these species is
confined to East Asian states and has a relatively stable
production. The only exception to this is Japanese kelp
culture, which has the largest share of aquatic plant
production. The production of Japanese kelp has
doubled from two million tonnes in three years to 1993
and another one million tonnes was added in the next
six years. This rapid increase was probably a result of
continued expansion of cultured areas in China. The
production of Japanese kelp peaked in 1999 and since
then has stabilized, which might indicate that the rapid
expansion of production area reached a limit and further
sites are not available, in 2008 the total production was
almost 5 million tonnes (Table 46). Recent detailed
reporting from China has given a clearer picture of
aquatic plant production (Table 46).

63
Seaweeds for biopolymers
This group13 consists of Eucheuma cottonii, Kappaphycus alvarezzi, Gracilaria spp., red seaweeds and
others. The Philippines has the highest production of these aquatic plants and Euchema cottonii (also
known as Zanzibar weed), and far exceeds the production of other seaweeds (1.4 million tonnes in 2008).
Also, Indonesia reports a large production of Eucheuma seaweeds, almost 2 million tonnes in 2008.
New areas are being investigated for the expansion of seaweed production since global demand for
carrageenan and other alginates is expected to continue to rise.
Reptiles and amphibians
Reported species are soft shell turtle and frogs. China has greatly increased its reported production of
soft shell turtle in the past five years to a total production of 204 000 tonnes in 2008. Other states that
reported production of turtles are Thailand, Taiwan POC, Republic of Korea and Malaysia. There are
limited data on frog production, although frogs are being increasingly cultured in many states. China
has reported a production of 82 000 tonnes of frogs in 2008. The small size of a typical frog farm (using
small cement tanks or even pens) means that quantification of this type of operation is problematic.
Crocodile production is growing quickly in the region with Cambodia exporting juvenile crocodiles to
both Viet Nam and China. Thailand and Papua New Guinea also have crocodile farms. This production
is rarely reported in fishery or aquaculture statistics.
Niche aquaculture species
There are a number of niche aquaculture species that this review does not cover. These species are
either cultured at the pilot/experimental level or simply not reported by many states. Some of the species
Table 47 Niche aquaculture species, 2008
Species Tonnes
Aquatic invertebrates nei 143 650
Japanese sea cucumber 92 567
Jellyfishes 47 405
Sea squirts nei 18 526
Sea urchins nei 3 023
Sea cucumbers nei 279
are not food type commodities (e.g. sponge and pearls,
ornamental shells, ornamental fish) and are therefore
not routinely monitored by the authority reporting
fisheries information (Table 47).
Subregional trends
South Asia
South Asia’s aquaculture production has seen major
increases in the last 20 years, from 1.1 million tonnes
in 1988 to 4.6 million tonnes in 2008. The majority of
production comes from inland waters and hence the growth of the sector has been mostly because of
increasing freshwater culture (Figure 15). This increase is probably not heavily dependent on marine
sources of feed and therefore a real contribution in terms of food security. There has been a major
increase in rohu and catla production since 2003. Although Indian carps (rohu, catla and mrigal carp)
have been the main group cultured in the region, there have been notable increases in the production
of introduced Chinese carps in recent years. There are more recent unverified reports of significant
increases in Pangassius production in India.
Silver carp production also increased almost fivefold in two years (1999–2001) and became the top
cultured species in 2001. Since then, the production has declined by half, but is now up to almost the
2003 quantity again (Figure 16). Production, of giant tiger prawn and penaeid shrimp increased steadily
up until 2006 when it reached 210 000 tonnes but has since declined significantly (145 000 tonnes in
2008). In general, the level of diversification of cultured species is relatively low in this area and there
has been very limited reported marine finfish production in the past, but it has increased to 37 000 tonnes
in the last years for which statistics are available.
13 The taxonomy for Eucheuma is confusing. The name cottonii is a general word used to describe a number of Eucheuma
species (Zuccarello et al., 2006). Recent taxonomic revisions have added to the confusion. Eucheuma striatum var. tambalang
and E. alvarezii var. tambalang are now Kappaphycus alvarezii [common name “tambalang”], Eucheuma striatum var. elkhorn is
Kappaphycus striatum [common name “elkhorn”], Eucheuma cottonii is Kappaphycus cottonii, and Eucheuma spinosum is now
Eucheuma denticulatum [common name “spinosum”] source: Eldredge, 1994.

64
Figure 15 Trends in aquaculture production in Asia by major species groups (excluding aquatic plants)
Year
�1950� 1960� 1970� 1980� 1990� 2000� 2010
30 000
20 000
10 000
0
6 000
4 000
2 000
0
4 000
3 000
2 000
1 000
0
1 500
1 000
500
0
150
100
50
0
China
Southeast Asia
South Asia
Other Asia
Oceania
To
nn
es
(x
1 0
00
)
Molluscs
Miscell aquat anim prod
Marine fishes
Freshwater fishes
Diadromous fishes
Crustaceans
Aquatic animals nei

65
Southeast Asia
Aquaculture production in Southeast Asia is highly diversified and in 2008 production of ninety-four
different species was reported. The number of cultured species and the details of reporting have increased
rapidly in the last years, increasing from 70 and 80 (1996 and 2003 respectively). In terms of value,
highly-priced crustaceans have an increased share of 43 percent of the total production, followed by
freshwater fish at 41 percent. The main difference is that the relatively low volume of crustaceans gives
a high value in return, whereas freshwater fishes have a relatively high value but a large quantity is
produced. In contrast, the large production of aquatic plants results in a relatively small value. Freshwater
finfish culture has increased from 0.6 million tonnes in 1991 to 4.4 million tonnes in 2008. In the
mariculture subsector, the production of aquatic plants has shown a surprisingly strong growth.
Crustaceans have been a major cultured species throughout the subregion, with rapid growth in recent
years (Figure 17).
Figure 16 Aquaculture production of major species in South Asia
� 1990� 1995� 2000� 2005� 2010
Year
5 000
4 000
3 000
2 000
1 000
0
To
nn
es (
x 1
000)
Catla
Roho labeo
Silver carp
Mrigal carp
Cyprinids nei
Giant tiger prawn
Penaeus shrimps nei
Common carp
Box 4 Top cultured species in Southeast Asia, 2006
Top ten cultured species in Southeast Asia (by quantity, excluding aquatic plants) were pangas
catfish nei, whiteleg shrimp, Nile tilapia, milkfish, giant tiger prawn, roho labeo, Cyprinids nei
and common carp.
Eucheuma cottonii is still the most widely cultured aquatic plant in the region with a production of
1.9 million tonnes in 2008 (increased from 1.05 million tonnes in 2006). It is closely followed by Zanzibar
seaweed with 1.4 million tonnes (increased from 1.3 million tonnes in 2006). The massive growth of
aquatic plants in this region reflects the strong promotion and good conditions in the islands of Philippines
and Indonesia. But it is also partly because of improvement and development of market chains. Apart
from aquatic plants, Pangas catfishes nei is the top produced species, and has very recently surpassed
the previous top species, whiteleg shrimp (P. vannamei) and giant tiger shrimp (Penaeus monodon).
China
Although production growth from China during 2006–2008 has slowed down to 9.6 percent from
12.2 percent during 2004–2006, China’s aquaculture production still increased by 2.9 million tonnes and
has now reached 33 million tonnes (Figure 15) or 63 percent (43 million tonnes) of the total world
aquaculture production in 2008 (including aquatic plants). Growth in inland culture has continued, mainly
from increased production of finfish culture and crustaceans. This increase is being achieved through
the intensification of existing systems rather than any significant increase in production area.

66
Carps have always been the most important species group cultured in China. As the result of species
diversification and faster development of culture of higher value finfish and crustaceans in the past two
decades, the contribution of carps to the total production declined to 33.6 percent in 2008 from
40.9 percent in 1998. Nevertheless, production of cultured carps from China still increased by nearly
one million tonnes between 2006 and 2008 and reached 14.5 million tonnes. Carp will remain a major
source of fish products for consumers of different income classes in China in the foreseeable future.
Diversification of cultured species is a very unique feature of the Chinese aquaculture industry. China
is currently reporting to FAO the production data of some 110 cultured species/species groups. The
species diversification has been oriented towards high value species and indigenous species newly
developed for aquaculture. The former include mainly carnivorous marine and freshwater fish species
and freshwater and marine/brackish crustaceans, which have been well captured in earlier analyses.
The latter are usually reported as freshwater/marine finfish nei. It is expected these species will be
reported as identified species in the future.
Among the four major cultured groups, crustaceans achieved outstanding growth (29 percent) in
production during 2006–2008. Which is followed by finfish (10 percent). Comparatively, increases in the
production of aquatic plants and molluscs were much less significant with rates of 5 percent and 4 percent
respectively.
Growth in production from marine waters has been driven by molluscs and aquatic plants in the past,
however, the production of aquatic plants has levelled off in the last two years (Figure 18).
The production of most cultured species continued to increase. However, there are a number of species
worth highlighting, as follows:
■ Japanese kelp (Laminaria japonica): growth in its production is remarkable, increasing from
1.2 million tonnes in 1990 to 4.0 million tonnes in 2008 in line with production figures of
3.7 million tonnes in 2006 and 3.5 million tonnes in 2002.
■ Miscellaneous aquatic plants: this massive volume of aquatic plants is not reported at the
species level. However, production jumped from 0.2 million tonnes in 1990 to 3.4 million tonnes
in 2002. The large decline in aquatic plant production in 2003 is explained by improved reporting
at species level by China. The reported figure for aquatic plant production in 2008 is 2.4 million
tonnes. As a result of the improved reporting by China, wakame (Undaria pinnatifida) has
become the second largest cultured plant with a total of 1.3 million tonnes in 2008. Most of
the Chinese plant production is for food purposes.
■ Cupped oysters nei: this is another cultured species group that has achieved outstanding
growth, increasing from 0.5 million tonnes in 1990 up to 3.4 million tonnes in 2008. Mollusc
production is also difficult to intensify and increased production suggests the development of
Figure 17 Aquaculture production of major species in Southeast Asia
� 1990� 1995� 2000� 2005� 2010
Year
6 000
5 000
4 000
3 000
2 000
0
To
nn
es
(x
1 0
00
)
1 000
Pangas catfishes nei
Whiteleg shrimp
Nite tilapia
Milkfish
Giant tiger prawn
Roho labeo
Cyprinids nei
Common carp

67
new production areas as in the case of aquatic plants (Figure 19). Additionally, the production
of sea snails has increased in recent years, from 0 tonnes in 2002 to 225 000 tonnes in 2008;
again this might reflect improved reporting and not necessarily increased production.
■ Carnivorous species: Rapid growth in production of high value carnivorous species such as
mandarin fish, Chinese mitten crab and marine finfish started to occur in 1995. More recently
there have been large increases in the production of snakehead and grouper. Many of the
carnivorous species show very similar patterns of growth in production (Figure 20).
Molluscs
Marine fishes
Freshwater fishes
Diadromous fishes
Crustaceans
Aquatic plants
Aquatic animals nei
Molluscs
Miscell aquat anim prod
Marine fishes
Diadromous fishes
Crustaceans
Aquatic plants
Aquatic animals nei
� 1980� 1985� 1990� 1995� 2000� 2005� 2010
Year
Inland
Marine
To
nn
es
(x
1 0
00
)
20 000
15 000
10 000
5 000
0
20 000
15 000
10 000
5 000
0
Figure 18 Trends in aquaculture production in China by environment, 1980–2008
Figure 19 Trends in top eight cultured species in China (aquatic plants and molluscs included)
� 1990� 1995� 2000� 2005� 2010
Year
30 000
To
nn
es
(x
1 0
00
)
25 000
20 000
15 000
10 000
5 000
0
Japanese kelp
Grass carp
Cupped oysters nei
Silver carp
Japanese carpet shell
Aquatic plants nei
Common carp
Bighead carp

68
Other Asia
Aquatic plants continue to dominate aquaculture production in Other Asia, particularly in East Asian states
(Figure 21). They account for 56 percent of total production. This is followed by molluscs (25 percent)
and marine finfish (11 percent). However, the high economic value of marine finfish makes this species
group the largest contributor in terms of value, constituting 43 percent of total production value.
Excluding aquatic plants, the aquaculture production in this region has been very stable; most of the
major species groups have been maintained at the current level of production for the last ten years
(Figure 15). The exception is aquatic plant production, which peaked in 1993 at 2.3 million tonnes then
decreased by almost 35 percent to 1.3 million tonnes in 2000, but has since steadily increased and
was 1.8 million tonnes in 2008.
It is notable that the percentage of carnivorous fish in the total for fish production is very high in this
subregion (72 percent in 2008) compared with South Asia, Southeast Asia and China, which all have
much lower levels (all below 10 percent).
The estimated aquaculture production from the Democratic People’s Republic of Korea (DPR Korea) in
FAOSTAT was about 0.5 million tonnes for 2008, which was mainly composed of Japanese kelp and
marine molluscs. The government of DPR Korea is strongly promoting the culture of marine molluscs
and finfish in the country. Supported by FAO technical assistance, a significant increase in marine
molluscs and finfish production may be expected in the coming years because of the country’s abundant
natural resources.
Figure 20 Production trends of major cultured carnivorous species in China
� 1990� 1995� 2000� 2005� 2010
Year
1 200To
nn
es
(x
1 0
00
)
1 000
800
600
400
200
0
Snakehead
Mandarin fish
Japanese eel
Japanese seabass
Lefteye flounders nei
Large yellow croaker
Groupers nei
Cobia
Figure 21 Aquaculture production of major species groups in Other Asia
� 1990� 1995� 2000� 2005� 2010
Year
3 500
To
nn
es (
x 1
000)
3 000
2 500
2 000
1 500
1 000
500
0
Japanese kelp
Laver (Nori)
Pacific cupped oyster
Wakame
Yesso scallop
Japanese amberjack
Silver seabream
Rainbow trout

69
Oceania
Aquaculture production in Oceania is relatively limited. The production (excluding aquatic plants) was
174 000 tonnes in 2008 (Figure 15) almost exclusively from New Zealand and Australia. Molluscs and
diadromous fish are the main cultured groups.
The main cultured species are New Zealand mussels and different salmon species, and this also makes
up the bulk of the production (Figure 22). However, live reef fish, aquarium fish and pearls bring significant
income to some Pacific Islands, although relatively low in quantity. Although the target species are mostly
caught from the wild, there is an increasing desire for culture-based sources. Giant clam culture for the
ornamental trade is widespread throughout the region and the total export is probably in the range of
30 000 to 50 000 pieces/annum. The Pacific is also a major supplier of “live rock” (rock encrusted with
coralline algae) with approximately 50 000 pieces of live rock currently being cultured in the Fiji Islands.
Euchema cottonii seaweed (Zanzibar weed) culture is well established in the Kiribati atolls and is being
rejuvenated in the Solomon Islands and Fiji. Interest in inland freshwater aquaculture is growing,
particularly among the larger Melanesian states such as Fiji and Papua New Guinea.
Figure 22 Top eight species produced by aquaculture in Oceania
� 1990� 1995� 2000� 2005� 2010
Year
180
To
nn
es
(x
1 0
00
)
160
140
120
100
80
60
40
20
0
Mussels
Salmonid fish
Oysters
Penaeid shrimp
Southern bluefin tuna
Giant sea perch
Euchema

70

71
Part 3
Regional policy issues

iv

73
The impact of climate change on the fisheries sector in Asia
Because of the importance of fisheries in Asia and the Pacific region, any adverse climate change related
impacts on the fisheries sector will have implications for the region’s economic development, poverty
reduction efforts and regional food security. The sector contributes significantly to national GDPs in many
countries in Asia as well as plays a significant role in food security, and the Asian region currently is
home to 87 percent of all people involved globally in fisheries and aquaculture (FAO, 2008). Existing
marine and inland capture fisheries resources are typically fully utilized or overexploited and there is
increasing reliance on aquaculture to supplement regional and international demand for fish. Asia’s stake
in the aquaculture industry is disproportionately high, accounting for about 90 percent of global volume
and 80 percent of global value on average (FAO, 2006), thus negative impacts to this subsector will
have far reaching repercussions.
There is now a considerable, credible body of evidence that human induced climate change is occurring
and is causing changes in the earth’s fundamental physical, chemical and biological processes (IPCC,
2006 and Meehl et al., 2007). The future scale of this change will depend on what course of action the
governments of the world take in reducing emissions over the coming decades.
As a sector highly dependent on natural resources and highly sensitive to environmental variables, the
potential impact of climate change on the fisheries sector should be of great concern to policy makers
in the region. Climate change is likely to have further negative impacts on capture fisheries systems
already stressed by overexploitation and pollution as well as on the productivity and viability of
aquaculture operations across the region. Climate change will also have profound consequences for
related sectors such as agriculture, water management and coastal development, which will intersect
with and have an influence on the fisheries sector.
Table 48 below summarizes the main pathways by which climate change could potentially have an
adverse impact on the fisheries sector.
Table 48 How climate change could directly affect the fisheries sector
Drivers Biophysical effects Implications for fisheries and aquaculture
Impacts on the abundance and species
composition of capture fisheries stocks. For
aquaculture: Changes in infrastructure and
operating costs from worsened infestations of
fouling organisms, pests, nuisance species
and/or predators; infrastructure and operating
costs from worsened infestations of fouling
organisms.
Potential for increased production and
profit in certain localities, especially for
aquaculture.
Potential benefits for aquaculture and
fisheries but perhaps offset by changed
species composition.
Potential loss of species or shift in com-
position in capture fisheries; impacts on seed
availability for aquaculture.
Aquaculture opportunities both lost and
gained; potential species loss and altered
species composition for capture fisheries.
Reduced recruitment of fishery species;
worsened wave damage to infrastructure or
flooding from storm surges.
More frequent harmful algal blooms; less
dissolved oxygen; increased incidence of
disease and parasites; altered local
ecosystems with changes in competitors,
predators and invasive species; changes in
plankton composition.
Changes in sea
surface temperature
In certain areas: Longer growing seasons;
lower natural mortality in winter; enhanced
metabolic and growth rates.
Enhanced primary productivity.
Changes in timing and success of migrations,
spawning and peak abundance, as well as in
sex ratios.
Change in the location and size of suitable
range for particular species.
Damage to coral reefs that serve as breeding
habitats and may help protect the shore from
wave action.

74
Loss of land.
Table 48 (continued)
Drivers Biophysical effects Implications for fisheries and aquaculture
Rising sea level Reduced area available for aquaculture; loss
of freshwater fisheries.
Shifts in species abundance, distribution and
composition of fish stocks and aquaculture
seed.
Damage to freshwater capture fisheries;
reduced freshwater availability for aqua-
culture; shift to brackish water species.
Reduced recruitment and stocks for capture
fisheries and seed for aquaculture; worsened
exposure to waves and storm surges and risk
that inland aquaculture and fisheries become
inundated.
Altered abundance and composition of wild
stock; impacts on seed availability for aqua-
culture.
Higher costs of maintaining pond water levels
and from stock loss; reduced production
capacity; conflict with other water users;
change of culture species.
Changes to estuary systems.
Saline intrusion.
Loss of coastal ecosystems such as man-
grove forests.
Changes in fish migration and recruitment
patterns and so in recruitment success.
Lower water availability for aquaculture;
lower water quality causing more disease;
increased competition with other water users;
altered and reduced freshwater supplies with
greater risk of drought.
Changes in lake and river levels and the
overall extent and movement patterns of
surface water.
Altered distribution, composition and abun-
dance of fish stocks; fishers forced to migrate
more and expend more effort.
Reductions in fish stocks.
Changes in
precipitation and
water availability
Higher inland water
temperatures
Increased stratification and reduced mixing of
water in lakes, reducing primary productivity
and ultimately food supplies for fish species.
Raised metabolic rates increase feeding
rates and growth if water quality, dissolved
oxygen levels, and food supply are adequate,
otherwise possible reductions in feeding rates
and growth; potential for enhanced primary
productivity.
Possible enhanced fish stocks for capture
fisheries or else reduced growth where the
food supply does not increase sufficiently in
line with temperature; possible benefits for
aquaculture, especially intensive and semi-
intensive pond systems.
Aquaculture opportunities both lost and
gained; potential loss of species and
alteration of species composition for capture
fisheries.
Altered capture fisheries stocks and species
composition; altered culture species and
possibly worsened losses to disease (and so
higher operating costs) and possibly higher
capital costs for aeration equipment or deeper
ponds.
Potential loss of species or shift in com-
position for capture fisheries; impacts on seed
availability for aquaculture.
Shift in the location and size of the potential
range for a given species.
Reduced water quality, especially in terms of
dissolved oxygen; changes in the range and
abundance of pathogens, predators and
competitors; invasive species introduced.
Changes in timing and success of migrations,
spawning and peak abundance.

75
Table 48 (continued)
Drivers Biophysical effects Implications for fisheries and aquaculture
Large waves and storm surges; inland
flooding from intense precipitation; salinity
changes; introduction of disease or predators
into aquaculture facilities during flooding
episodes.
Loss of aquaculture stock and damage to or
loss of aquaculture facilities and fishing gear;
impacts on wild fish recruitment and stocks;
higher direct risk to fishers; capital costs
needed to design cage moorings, pond walls,
jetties, etc. that can withstand storms; higher
insurance costs.
Loss of wild and cultured stock; increased
production costs; loss of opportunity as
production is limited.
Reduced wild fish stocks; intensified
competition for fishing areas and more
migration by fisher folk.
Changes in the distribution and productivity
of open sea fisheries.
Increase in frequency
and/or intensity of
storms
Drought
Lower water quality and availability for
aquaculture; salinity changes.
Changes in lake water levels and river flows.
Changes in El Niño-
Southern Oscillation
Changed location and timing of ocean
currents and upwelling alters nutrient supply
in surface waters and consequently primary
productivity.
Changed ocean temperature and bleached
coral.
Altered rainfall patterns bring flooding and
drought.
Reduced productivity of reef fisheries.
See impacts for precipitation trends, drought
and flooding above.
Source: Adapted from WorldFish (2007).
How Asia will be impacted by climate change
The impacts of climate change are likely to be far from uniform and it is expected that the Asian region
will face very specific and locally variable challenges. Certain trends and impacts may be more
pronounced in Asia (e.g. temperature increases are likely to be above the global norm in many parts of
the region; a number of important river basins in Asia are threatened by further water stress; the number
of people impacted by flooding in the region is likely to be disproportionately high; biodiversity losses
will be greater in the tropics). Moreover, it is recognized that Asia is highly vulnerable to climate change
because of the low capacity of countries in the region to respond and adapt; many countries cannot
cope with current levels of climatic variability and extreme events, indicating that existing systems would
be overwhelmed (Preston et al., 2006). As a region that is still beset with poverty and low levels of
development, it is likely that only sudden, disaster-related climate change related issues will be addressed
(Michel and Pandya, 2010). There is a possibility that slower processes, such as rising sea levels and
gradual shifts in agricultural and fisheries related production systems may be ignored, even if planning
ahead for these changes will ultimately increase the chances of coping with negative impacts.
Implications for the fisheries sector in Asia
Non-climate related drivers are likely to have a greater impact on the fisheries sector in the short-term,
but our ability to manage these will also determine the mid-term to long-term impacts that climate change
will have. Poor practice in fisheries and ecosystem management as a result of inadequate governance
are likely to have a greater influence on the fisheries sector in the short-term and currently pose a threat
to fisheries-based livelihoods and economic growth. Through undermining the health of fisheries systems,
current practices may be reducing the resilience of fishery systems to withstand climate change related
impacts. Current management approaches therefore play a hand in determining possible outcomes for
the sector in a climate changed future.
Though we have a good understanding of the general impacts of climate change, our ability to make
specific predictions on the fisheries sector are limited. Nevertheless, trends regarding sea surface and

76
inland temperature changes, sea level rise, and changes to hydrological patterns can be estimated with
a relatively high level of confidence and, given the projections for the region, such fundamental
environmental changes will undoubtedly have some impact on fisheries operations. However, the specific
effects that climate change, coupled with other anthropogenic drivers and underlying natural patterns,
may have on particular fishery systems and localities over the next 10 to 40 years and beyond is
extremely difficult to predict, indicating that flexibility in management systems and institutions is necessary
and that decision-makers cannot expect to depend on prescriptive advice for the sector.
There are likely to be geographical shifts in productivity in both capture fisheries and aquaculture
(Vivekanandan et al., 2009) that present more challenges than opportunities for the region; there is
expected to be a general poleward shift in catch potential for capture fisheries that may disadvantage
many Asian countries, particularly tropical and subtropical countries (Cheung et al., 2009). Similarly,
aquaculture productivity is likely to experience geographical shifts in response to temperature changes,
requiring support to areas that are currently heavily invested in aquaculture to adapt or exit the sector,
in addition to support to new areas that could potentially expand into this subsector (De Silva and Soto,
2009).
Different countries in the region will face different kinds and levels of risks.
Risk analyses based on variables such as potential climate change impacts on the sector, relative
economic and social dependency on the sector, and adaptive capacity, have identified parts of the region
where climate change may have a variety of implications (Allison et al., 2009):
Socio-economic impacts may have different emphases depending on the role of the sector at the national
and local levels.
Nutritional dependence on fisheries resources is high in much of Southeast Asia as well as other
countries, such as Bangladesh, Japan and Sri Lanka; countries with the largest fisheries landings in
the region are China, Japan, Indonesia, India and Bangladesh; dependency on the fisheries sector for
export income is highest in the coastal nations of Southeast Asia.
A nation’s capacity to adapt to climate change will influence the magnitude of socio-economic disturbance
experienced.
Pakistan, Bangladesh, Lao PDR, and Nepal are believed to have the lowest capacity in the region to
adapt to climate change related impacts to the fisheries sector.
Countries that have a high dependency on the fisheries sector as well as a low capacity to adapt will
be most at risk of serious socio-economic impacts.
The river dependent countries of Bangladesh, Cambodia and Pakistan have been identified as three of
the most at risk countries in the region in this respect.
The poor are likely to be most affected.
Disruption to the fisheries sector may have a disproportionate impact on the large number of poor people
in Asia who depend on the sector for their protein intake and employment, and who are likely to be
more vulnerable to hazards and extreme events.
There is likely to be increased competition from other sectors for resources and space.
Cross-sectoral conflicts of interest are likely to be exacerbated by climate change. For instance,
freshwater capture fisheries and aquaculture could lose out in competition with other sectors
(e.g. hydropower, agriculture, domestic and industrial use) for diminishing freshwater supplies. The
combined implications of sea-level rise, coastal erosion, population growth and shrinking agricultural
land may also emerge as land-limiting factors that disadvantage aquaculture operations.

77
Mitigation opportunities associated with the sector could serve multiple functions.
Asia’s contribution to emissions via the fisheries sector is considered to be relatively low, therefore there
is unlikely to be much government emphasis on the sector in emission mitigation efforts. However,
improved energy efficiency could complement other positive fisheries management goals for the region
(e.g. reductions in fleet capacities, removal of perverse fuel subsidies). Good management of ecosystems
crucial to fisheries systems (e.g. salt marshes, seagrass beds, mangroves and coral reefs) can also
provide the dual benefits of maintaining systems efficient in sequestering carbon. Through actively
pursuing mitigation activities, the sector could potentially generate revenue to fund adaptation actions
(e.g. via carbon credits, activities under the United Nations Collaborative Programme on Reducing
Emissions from Deforestation and Forest Degradation in Developing Countries (UN-REDD), possible
future “Blue Carbon” initiatives which consider the potential of aquatic ecosystems in carbon
sequestration).
Implications for governance
Good governance is essential for effective adaptation.
The need to reverse patterns of poor management and governance has never been greater. Fisheries
governance processes that are meaningfully stakeholder inclusive, transparent, based on best practice
(e.g. the implementation of international fisheries agreements and codes) and tackle issues of corruption
and group marginalization, will provide the sector and those whose livelihoods and food security depend
on it with a better chance of adapting to climate change. Tackling existing incentive structures that make
bad practices lucrative may be an important component of this.
Flexibility and adaptability in governance and management are important components of good governance
that need to be operationalized.
Given the high degree of uncertainty that surrounds climate change, flexible and responsive governance
mechanisms and institutions will be crucial. The emphasis should be on building the adaptive capacity
of communities and industries to be able to cope with unpredictable changes and events.
Support cross-sectoral governance.
Again, although this represents best practice that should be pursued irrespective of climate change,
the specific challenges that climate change will present in constraining resources (e.g. freshwater, land)
heighten the need to improve cross-sectoral coordination. Integrating disaster management into the
fisheries sector, and vice versa, will be of particular importance given the high vulnerability of the sector
to extreme events.
Actions for adaptation and mitigation
Ensure that the fisheries sector is clearly incorporated into mainstream climate change strategies and
vice versa.
The fisheries sector should be involved in consultative processes towards the development of mainstream
adaptive strategies as well as developing strategies at the sectoral level. Potential trade-offs and conflicts
with other sectors should be carefully identified as part of these processes. For instance, adaptive
strategies pursued by other sectors (e.g. coastal defence structures, dams and diversions) may have
negative impacts on the fisheries sector. Opportunities for the fisheries sector to support cross-sectoral
efforts (e.g. through integrating aquaculture with agriculture) should be pursued. Sectoral development
plans for the fisheries sector should, conversely, integrate other sectors and climate change
considerations.
Ensure that the opportunities and threats presented by climate change are understood and supported
as part of adaptation measures for the sector.
Identify the winners and the losers in the fisheries sector. For instance, any geographical shifts in
productivity should be identified and supported strategically; supporting the “losers” to diversify or exit
the sector and the “winners” to capitalise more effectively on new opportunities.

78
High-risk countries and locations should be identified and supported.
Understanding of which countries and localities in the region will be most sensitive to climate change
related changes to the fisheries sector needs to be improved. High-risk countries should be targeted
and supported to explicitly tackle threats to the fisheries sector.
Build supportive economic and trade policies.
Given the considerable role of the sector in trade and export for the Asia region, changes in production
patterns and trade opportunities will need corresponding changes in economic and trade policies. Product
and export diversification should be pursued as part of this.
Pursue appropriate technologies.
Changing conditions will necessitate investing in new technologies and of course, adopting them. For
certain subsectors such as aquaculture, this will be of crucial importance. A great deal of this knowledge
and technology may be locally available and small-scale technologies should not be overlooked.
Pursue mitigation actions in a manner that supports the sector more broadly.
The sector could benefit from mitigation opportunities in a manner that strengthens fisheries management
systems. For instance, ecosystem management for the dual purposes of carbon sequestration and
fisheries management could be pursued; fleet capacity reduction and the removal of fuel subsidies for
non-renewables would reduce emissions from the sector and reduce overexploitation. Support from
mitigation schemes could provide resources for the sector to achieve this.

79
International and regional agreements
There are a variety of agreements that relate to different fishery issues in the region. The agreements
come in different forms: binding and voluntary; global and regional. The agreements may cover fisheries
specifically or be related indirectly through environment, biodiversity, labour or other international norms
that relate to the fishery sector and its activities. More information on these can be found on the APFIC
Website. To ensure that the participation of countries in these agreements is monitored, APFIC continues
to confirm their participation with the help of its members as recommended in the 2008 Status and
potential report.
Binding agreements
The binding agreements are usually adopted at global level; hence most of them are deposited in a UN
organization. Among these, a few are of special importance:
■ United Nations Convention on the Law of the Sea (UNCLOS)14
■ United Nations Fish Stocks Agreement (UNFSA)15
■ FAO Agreement to Promote Compliance with International Conservation and Management
Measures by Fishing Vessels on the High Seas (FAO Compliance Agreement)16
■ Convention on International Trade in Endangered Species of Wild Fauna and Flora (CITES)17
■ Convention on Biological Diversity (CBD)18
■ Agreement on Port State Measures (to come into effect) 19
■ International Convention for the Prevention of Pollution from Ships (MARPOL 73/78 (specifically
Annex V)).
There are still some countries in the region that have not signed and/or ratified the United Nations
Convention on the Law of the Sea (UNCLOS) (Table 49) and none have done so since the last review
in 2008. The agreement entered into force on 16 November 1994 and is today the globally recognized
regime dealing with all matters relating to the law of the sea. The United Nations Fish Stocks Agreement
entered into force on 11 December 2001, but there are still many countries in the region that have not
signed or ratified the convention (Table 49), however, two countries from the region have ratified the
agreement since the last review in 2008. The FAO Compliance Agreement entered into force on 24 April
2003, but has still to see acceptance instruments from many of the countries in the region (Table 49)
and since 2008 there are no new signatories to the agreement in the region. The Convention on
International Trade in Endangered Species of Wild Fauna and Flora (CITES) has been acceded by many
countries and similarly the Convention on Biological Diversity (CBD) has been ratified and/or signed by
all countries in the region.
The FAO Agreement on Port State Measures to combat illegal, unreported and unregulated (IUU) fishing
lays out in greater detail the commitments and obligations that port states have relating to the use of
14 Mainly deals with conservation, utilization and management of living resources, and the responsibility to deal with shared stocks
and stocks of the high seas through regional mechanisms (e.g. regional fisheries organizations).
15 The main purpose is to implement the UNCLOS. It further elaborates general principles concerning conservation and
management of straddling fish stocks and highly migratory fish stocks and emphasizes the special role of regional fisheries
management organizations in conservation and management. It also highlights the obligations of states with respect to vessels
flying their flags on the high seas and regional fisheries management organizations (RFMO) or arrangements, e.g. the Indian
Ocean Tuna Commission (IOTC) and the Western and Central Pacific Fisheries Commission (WCPFC).
16 Places a general obligation on flag states to take such measures as may be necessary to ensure that vessels flying their
flags do not engage in any activity that undermines the effectiveness of international conservation and management measures.
In addition, it seeks to limit the freedom of vessels that have a bad compliance record to “shop around” for new flags. The Agreement
applies to all fishing vessels over 24 metres in length used or intended for use for the commercial exploitation of living marine
resources, including mother ships and any other vessels directly engaged in such fishing operations.
17 An international agreement between governments. It aims to ensure that the international trade in specimens of wild animals
and plants does not threaten their survival. Species are categorized according to the degree of threat to their survival and this
classification determines the extent to which the species can be traded and/or moved.
18 Dedicated to promoting sustainable development and was developed as a practical tool for translating the principles of Agenda
21 into reality. CBD deals with fisheries issues separately for inland, marine and coastal systems. In addition, CBD also covers
issues relating to alien species introductions and movements.
19 As of May 2010 there where 19 signatories out of the required 25 for the treaty to come into effect.

80
Table 49 Review of parties to global conventions and agreements
Port StateUNCLOS UNFSA FAO CA CBD CITES
MARPOL
M. Annex V
sign sign rat/ac sign rat/ac acc rat/ac/acc rat/ac ac/acc
South Asia
Bangladesh 1982 2001 1995 1994 1981 2002
Bhutan 1982 1995 2002
India 1982 1995 2003 1994 1976 2003
Maldives 1982 2000 1996 1998 1992 2005
Nepal 1982 1998 1993 1975
Pakistan 1982 1997 1996 1994 1976 1994
Sri Lanka 1982 1994 1996 1996 1994 1979 1997
Southeast Asia
Brunei Darussalam 1984 1996 2008 1990
Cambodia 1983 1995 1997 1994
Indonesia 2009 1982 1986 1995 2009 1994 1978
Lao PDR 1982 1998 1996 2004
Malaysia 1982 1996 1994 1977 1997
Myanmar 1982 1996 1994 1994 1997
Philippines 1982 1984 1996 1993 1981 2001
Singapore 1982 1994 1995 1986 1999
Thailand 1982 2004 1983
Timor-Leste 2007
Viet Nam 1982 1994 1994 1994
Other Asia
Iran (Islamic Rep. of) 1992 1998 1996 1976 2002
Japan 1983 1996 1996 2006 2000 1993 1980 1983
Kazakhstan 1994 2000 1994
DPR Korea 1982 1994 1985
Republic of Korea 1983 1996 1996 2008 2003 1994 1993 1996
Mongolia 1982 1996 1993 1996 2003
Tajikistan 1997
Uzbekistan 1995 1997
Oceania
Australia 2010 1982 1994 1995 1999 2004 1993 1976 1990
Cook Islands 1982 1995 1999 2006 1993
Fiji Islands 1982 1982 1995 1996 1993 1997
Kiribati 2003 2005 1994 2007
Marshall Islands 1991 1995 2003 1992 1988
Micronesia FSO 1991 1995 1997 1994
Nauru 1982 1996 1997 1993
New Zealand 2009 1982 1996 1995 2001 2005 1993 1989 1998
Niue 1984 2006 1995 2006 1996
Palau 1996 2008 1999 2004
Papua NG 1982 1997 1995 1999 1993 1975 1993
Samoa 2009 1984 1995 1995 1996 1994 2004 2002
Solomon Islands 1982 1997 1997 1995 2007 2004
Tonga 1995 1995 1996 1998 1996
Tuvalu 1982 2002 2009 2002 1985
Vanuatu 1982 1999 1996 1993 1989 1991
China
China PR* 1982 1996 1996 1993 1981 1988
Other APFIC
France 1982 1996 1996 2003 1996** 1994 1978 1981
UK 1997 1995 2001/2003 1996** 1994 1976 1986
USA 2009 1995 1996 1995 *** 1974 1987
Total region**** 4 33 34 19 22 6 43 31 25
Note: (n = 46); (sign = signed; rat = ratified; ac = acceded; acc = accepted;
* excluding Taiwan POC, Macau and Hong Kong SAR;
** Through European Union;
*** Signed in 1992;
**** Out of a total of 43 countries in the region (excluding France, UK, USA and see * above).

81
their ports by fishing vessels and the vessels which service the fishery20. The measures have yet to
come into effect but have been open for signing since 2009 and four countries in the region has already
signed the agreement (Table 49). Once port state measures become a binding agreement it will have
an effect on fisheries trade between regions and particularly for those highly traded species from the
high seas and from within the jurisdiction of the regional fishery management organizations.
Voluntary agreements
There are a number of voluntary (non-binding) international agreements that are of importance to fisheries
in the region (see Lymer and Funge-Smith, 2008):
■ FAO Code of Conduct for Responsible Fisheries (CCRF)21
■ FAO international plan of action for the management of fishing capacity (IPOA-Capacity)22
■ FAO international plan of action to prevent, deter and eliminate illegal, unreported and
unregulated fishing (IPOA-IUU)23
■ SEAFDEC Regional Code of Conduct for Responsible Fisheries24
■ The Regional Plan of Action for Responsible Fishing25
■ APEC Bali Plan of Action26
■ Coordinating Body for the Seas of East Asia (COBSEA)27
20 “Port state measures” generally refer to actions taken to detect illegal fishing when ships come to port. This can include
undertaking inspections of documentation, catches and equipment when boats land to take on fuel and supplies or offload fish,
or requiring vessels to make activity reports before entering port. Vessels found to be involved in IUU fishing can be denied docking
rights, causing considerable financial losses to their owners. Such measures are among the most effective means of preventing
the import, transshipment or laundering of illegally caught fish.
21 Defines norms for responsible fisheries and sets out principles and international standards of behaviour for responsible practices
to ensure the effective conservation, management and development of living aquatic resources. Respect for the ecosystem and
biodiversity. is integral. The CCRF recognizes the nutritional, economic, social, environmental and cultural importance of fisheries
and the interests of all those concerned with the fishery sector. The CCRF takes into account the biological characteristics of the
resources and their environments and the interests of consumers and other users. States and all those involved in fisheries are
encouraged to apply the CCRF and give effect to it. The FAO Compliance Agreement (see binding agreements) is an integral
component of the Code.
22 The FAO international plans of action (IPOA) for the management of fishing capacity have the following objective “… to achieve
worldwide, preferably by 2003 but no later than 2005, an efficient, equitable and transparent management of fishing capacity”. It
also highlights assessment and monitoring of fishing capacity and preparation and implementation of national plans.
23 The objective of the FAO international plans of action to prevent, deter and eliminate illegal, unreported and unregulated fishing
is to prevent, deter and eliminate IUU fishing by providing all states with comprehensive, effective and transparent measures by
which to act, including through appropriate regional fisheries management organizations established in accordance with international
law. The IPOA in particular encourages states to develop national plans of action to implement the IPOA-IUU.
24 The SEAFDEC Regional Code of Conduct for Responsible Fisheries defines norms for responsible fisheries within the SEAFDEC
region, it is derived from the FAO Code of Conduct for Responsible Fisheries.
25 A voluntary instrument that takes its core principles from the above mentioned and already established international fisheries
instruments for promoting responsible fishing practices. It is a commitment to implement those aspects of fisheries management
that relate to combating IUU fishing. The coverage of the RPOA is the areas of the South China Sea, Sulu-Sulawesi Seas (Celebes
Sea) and the Arafura and Timor Seas. The ministerial meeting to sign the RPOA was convened from 2 to 4 May 2007 in Denpasar,
Bali, Indonesia and was attended by representatives of 11 countries: Australia, Brunei Darussalam, Cambodia, Indonesia, Malaysia,
Papua New Guinea, Philippines, Singapore, Thailand, Timor-Leste and Viet Nam. The countries signing the RPOA agreed to
work together on key areas of fishery management.
26 The main objectives of the APEC Bali Plan of Action (2005) are to ensure the sustainable management of the marine
environment and its resources and to strengthen regional fisheries management organizations. Based on the commitment made
by ministers in the 2002 Seoul Ocean Declaration, the Bali Plan of Action contains practical commitments to work towards healthy
oceans and coasts for the sustainable growth and prosperity of the Asia-Pacific community. The APEC Bali Plan of Action (2005)
seeks to balance conservation and management of marine resources with regional economic growth. It was adopted at the close
of the second APEC ocean-related ministerial meeting. This new plan is intended to guide the work of APEC ocean-related working
groups for the rest of the decade through domestic and regional actions in three key areas: ensuring the sustainable management
of the marine environment; providing sustainable economic benefits from the oceans; and ensuring the sustainable development
of coastal communities.
27 A regional environmental agreement covering a large part of the marine area within APFIC’s direct area of interest. The East
Asia Seas region does not have a regional convention; instead COBSEA promotes compliance with existing environmental treaties
and is based on member country goodwill. The Action Plan for the Protection and Development of the Marine Environment and
Coastal Areas of the East Asian Seas Region (the East Asian Seas Action Plan) was approved in 1981 stimulated by concerns
about the effects and sources of marine pollution. Initially, the action plan involved five countries (Indonesia, Malaysia, Philippines,
Singapore and Thailand). In 1994, it was revised to involve another five countries (Australia, Cambodia, China, Republic of Korea
and Viet Nam) and to this date the action plan still has ten member countries.

82
The FAO Code of Conduct for Responsible Fisheries (CCRF) defines norms for responsible fisheries
and sets out principles and international standards of behaviour for responsible practices. The FAO
Compliance Agreement is an integral part of CCRF. Furthermore, the international plans of action (IPOA)
are voluntary instruments elaborated within the framework of the CCRF. They apply to all states and
entities and to all fishers. Four IPOA have been developed to date, however two in particular are of
interest to the region: management of fishing capacity and prevention and deterrence of IUU fishing. As
part of its overall monitoring and reporting role, APFIC is attempting to monitor the state of planning
and implementation of the NPOA within its region. Several countries have developed NPOA, however,
it is still unclear how many additional countries have initiated the NPOA planning and implementation
process in the region (draft or national equivalent to NPOA), although there are increasing reports of
countries starting the process (Table 50). For the IPOA-Capacity, the implementation into NPOA has
seen a variety of national equivalents to the NPOA and only a few countries have developed NPOA
building on the IPOA. For the IPOA-IUU the implementation into NPOA has been started (and completed
by several countries in the region). Specifically, for Pacific Island states, a specific model scheme has
been developed to help in the formulation and implementation of the NPOA (Brown, 2005).
Other agreements in the region include: The Regional Plan of Action for Responsible Fishing which was
signed by several countries in the region and also covers a large area of the seas in the region and
complements the IPOA and NPOA on IUU fishing; the APEC Bali Plan of Action is directed towards
promoting healthy oceans and coasts for sustainable growth and management of the marine environment
and has a strong fisheries component; and the East Asian Seas Action Plan where the main components
are assessment of the effects of human activities on the marine environment, control of coastal pollution,
protection of mangroves, seagrasses and coral reefs, and waste management and is steered by the
Coordinating Body for the Seas of East Asia (COBSEA)28.
28 The East Asian Seas Regional Coordinating Unit (EAS/RCU) serves as the Secretariat for COBSEA.

83
Table 50 Countries that have started the process of implementing the FAO IPOA through development
of an NPOA or other measures equivalent in national planning documents
IUU fishing Capacity Sharks Seabirds
NPOA NPOA NPOA NPOA
South Asia
Bangladesh N
Bhutan
India N
Maldives
Nepal
Pakistan N
Sri Lanka N
Southeast Asia
Brunei Darussalam
Cambodia
Indonesia X (?) X
Lao PDR
Malaysia N X
Myanmar
Philippines N
Singapore
Thailand N
Timor-Leste
Viet Nam
Other Asia
Iran (Islamic Rep. of)
Japan X X X
Kazakhstan
DPR Korea
Republic of Korea X
Mongolia
Tajikistan
Uzbekistan
Oceania
Australia X N X X
Cook Islands Draft
Fiji Islands Draft
Kiribati Draft
Marshall Islands Draft
Micronesia FSO Draft
Nauru
New Zealand X X
Niue Draft Draft
Palau Draft Draft
Papua NG Draft Draft
Samoa Draft
Solomon Islands
Tonga Draft
Tuvalu Draft
Vanuatu Draft
China
China N N
Taiwan POC X
Other APFIC
France X
UK X X
USA X X X X
Region total*
NPOA 5 1 4 3
Draft NPOA 11 0 4
National equivalent 2 7
The symbols used denote the following: (x) = NPOA; (draft) = draft NPOA; (N) = measure/policy on national level addressing
the specific issue.
* Excluding France, UK and USA.

84
References
Allison, E.H., Perry, A.L., Badjeck, M.C., Adger, W.N., Brown, K., Conway D., Halls, A.S. Pilling, G.M., Reynolds,
J.D. Andrews, N.L., & Dulvey, N.K. 2009. Vulnerability of national economies to the impacts of climate change
on fisheries. Fish and Fisheries 10(2): 173–196.
APFIC. 2009. Workshop on assessment and management of the offshore resources of South and Southeast Asia,
17–19 June 2008, Bangkok, Thailand. FAO-RAP. RAP publication 2009/13.
Brown, C. 2005. Model plan for a Pacific Island country. National plan of action to prevent, deter and eliminate
illegal, unreported and unregulated fishing. Rome, FAO.
Cheung, W.W.L., Lam, V.W.Y., Samiento, J.L., Kearney, K., Watson, R., Zeller, D., & Pauly, D. 2009. Large-scale
redistribution of maximum fisheries catch potential in the global ocean under climate change. Global Change
Biology 16(1): 24–35.
Christensen, V., Garces, L.R., Silvestre, G.T. & Pauly, D. 2003. Fishers impact on the South China Sea large marine
ecosystem: a preliminary analysis using spatially-explicit methodology. pp. 51-62 In: G. Sivestre, L. Garces,
I. Stobutzki, C. Luna, M. Ahmed, R.A.V. Santos, L. Lachica-Aliño, P. Munro, V. Christensen & D. Pauly (eds.)
Assessment, management and future directions for coastal fisheries in Asian countries. WorldFish Center
conference proceedings 67. Penang, Malaysia.
De Silva, S.S., & Soto, D. 2009. Climate change and aquaculture: Potential impacts, adaptation and mitigation.
Fisheries Technical Paper, 537, pp. 137–215.
Delgado, C.D., Wada, N., Rosegrant, M.W. Meijer, S. & Ahmed, M. 2003. Fish to 2020. Supply and demand in
changing global markets. WorldFish Center Technical report 62.
Department of Fisheries. 2009. Fisheries Statistics of Thailand 2007. Fisheries Statistics and Information Technology
Sub-division.Fisheries Economics Division, Department of Fisheries, Ministry of Agriculture and Cooperatives,
Thailand.
Eldredge, C.G. 1994. Seaweeds. In: Perspectives in aquatic exotic species management in the Pacific Islands.
Vol. 1 Introductions of commercially significant aquatic organisms of the Pacific Islands. South Pacific
Commission, New Caledonia.
FAO. 2006. Status and potential of fisheries and aquaculture in Asia and the Pacific 2006. Bangkok.
FAO. 2007. Status and potential of fisheries and aquaculture in Asia and the Pacific 2007. Bangkok.
FAO. 2008. Status and potential of fisheries and aquaculture in Asia and the Pacific 2008. Bangkok.
FAO. 2009a. Report of the first workshop on the assessment of fishery stock status in South and Southeast Asia,
Bangkok, 16–19 June 2009. FAO Fisheries and Aquaculture report no. 913.
FAO. 2009b. Report of the second workshop on the assessment of fishery stock status in South and Southeast
Asia, Bangkok, 5–9 October 2009. FAO Fisheries and Aquaculture report no. 940.
FAO Fishstat Plus. 2010. Universal software for fishery statistical time series (http://www.fao.org/fishery/statistics/
software/fishstat/en)
FSYB. 1999–2009. Fishery Statistical Yearbook of Bangladesh: 1999-2000, 2004-05, 2005-06, 2008-09. Fisheries
Resources Survey System (FRSS), Department of Fisheries, Bangladesh.
IPCC. 2007. Summary for policymakers. In: Climate change 2007: The physical science basis contribution of working
group I to the fourth assessment report of the Intergovernmental Panel on Climate Change. Edited by
Solomon, S., D. Qin, M. Manning, Z. Chen, M. Marquis, K.B. Averyt, M. Tignor & H.L. Miller (eds.) Cambridge
University Press, Cambridge, UK and New York, USA.
Lymer, D., Funge-Smith, S., Khemakorn, P., Naruepon, S. & Ubolratana, S. 2008. A review and synthesis of capture
fisheries data in Thailand. RAP publication 2008/17. FAO, Bangkok.
Lymer, D., Funge-Smith, S. 2009. An analysis of historical national reports of inland fisheries statistics in the
Asia-Pacific region (1950–2007). FAO-RAP. RAP publication 2009/18.

85
Lymer, D., Funge-Smith, S., & Greboval, D. 2009. The fishing fleet in Aceh Province, Indonesia. FAO-RAP. RAP
publication 2009/09.
Meehl, G.A., Stocker, T.F., Collins, W.D., Friedlingstein, P., Gaye, A.T., Gregory, J.M., Kitoh, A. Knutti, R., Murphy,
J.M., Noda, A. Raper, SCB., Watterson, I.G. Weaver, A.J. & Zhao, Z-C. In: Climate change 2007: The physical
science basis contribution of working group I to the fourth assessment report of the Intergovernmental Panel
on Climate Change. Edited by Solomon, S., D. Qin, M. Manning, Z. Chen, M. Marquis, K.B. Averyt, M. Tignor
& H.L. Miller (eds.) Cambridge University Press, Cambridge, UK and New York, USA.
MFO (Marine Fisheries Office) 2009. Annual Report 2009. Marine Fisheries Resources and its Management Practices
in Bangladesh. Marine Fisheries Office, Agrabad, Chittagong, Bangladesh.
Michel, D. & Pandya, A. 2010. Coastal zones and climate change. Stimson regional voices. Stimson Center,
Washington, DC.
Pomeroy, R., Kim Anh Thi Nguyen & Ha Xuan Thong, 2009. Small-scale marinefisheries policy in Vietnam. Marine
Policy 33 (2009) 419–428.
Preston, B.L., Suppiah, R., Macadam, I., & Bathols, J. 2006. Climate change in Asia/Pacific region: A consultancy
report prepared for the climate change and development roundtable. CSIRO, Australia.
Ringuet, S, Fumihito Muto & Caroline Raymakers (2002). Eels their harvest and trade in Europe and Asia. TRAFFIC
Bulletin Vol. 19, No. 2. TRAFFIC International, 219a Huntingdon Road, Cambridge, Cambs. CB3 0DL, UK.
Sadovy, Y. 2000. Regional survey for fry/fingerling supply and current practices for grouper mariculture: evaluating
current status and long-term prospects for grouper mariculture in Southeast Asia. Final report to the
collaborative APEC grouper research and development network (FWG 01/99).
SEAFDEC. 2008. Regional framework for fishery statistics of Southeast Asia. SEAFDEC, Bangkok.
Siriraksophon, S. & Laong-manee, P. 2005. The surimi industry in Southeast Asia: trend and demand for raw
materials. NAGA newsletter Vol. 28, nos. 1 & 2, Jan-Jun 2005. WorldFish Center, Penang, Malaysia.
Siriporn Pangsorn, Penchan Laong-manee and Somboon Siriraksophon. 2007 “Status of Surimi Industry in the
Southeast Asia” Southeast Asian Fisheries Development Center TD/RES 118. SEAFDEC/Training Department/
Capture Fishery Technology Division/P.O. Box 97, Phrasamut-Chedi, Samutprakan 10290 THAILAND 29 pp.
Staples, D. 2009. Status and potential of offshore resources of South and Southeast Asia. FAO-RAP. APFIC
ad hoc publication. http://www.apfic.org/modules/wfdownloads/visit.php?cid=6&lid=245
Tupper, M. & Sheriff, N. 2007. Capture-based aquaculture for groupers. A report to the FAO international workshop
on technical guidelines for the responsible use of wild fish and fishery resources for capture-based aquaculture
production. Hanoi, Viet Nam, 8–12 October 2007.
Vivekanandan, E., Srinath, M. and Somy Kuriakose. 2005. Fishing the food web along the Indian coast. Fisheries
Research, 72, 241-252.
Vivekanandan, E., M. Rajagopalan and N.G.K. Pillai. 2009. Recent trends in sea surface temperature and its impact
on oil sardine. In: Global Climate Change and Indian Agriculture (ed. P.K. Aggarwal), ICAR, New Delhi,
89-92.
Watson, R. & Pauly, D. 2001. Systematic distortion in world fisheries catch trends. Nature 424: 534—536.
WorldFish. 2007. The threat to fisheries and aquaculture from climate change. Policy Brief. Penang, Malaysia.
Zuccarello G.C., Critchley A.T., Smith J., Sieber V., Bleicher Lhonneur G. & West J.A. (2006) Systematics and genetic
variation in commercial Kappaphycus and Eucheuma (Solieriaceae, Rhodophyta). Journal of Applied
Phycology 18: 643-651.

ASIA-PACIFIC FISHERY COMMISSION
FAO Regional Office for Asia and the Pacific
39 Phra Athit Road, Bangkok, Thailand
www.apfic.org