fiscal year 2011 water rate proposal - welcome … island may 4 wagner high school 8 pm bronx may 6...
TRANSCRIPT

Fiscal Year 2011 Water Rate Proposalto the New York City Water Board
April 9, 2010
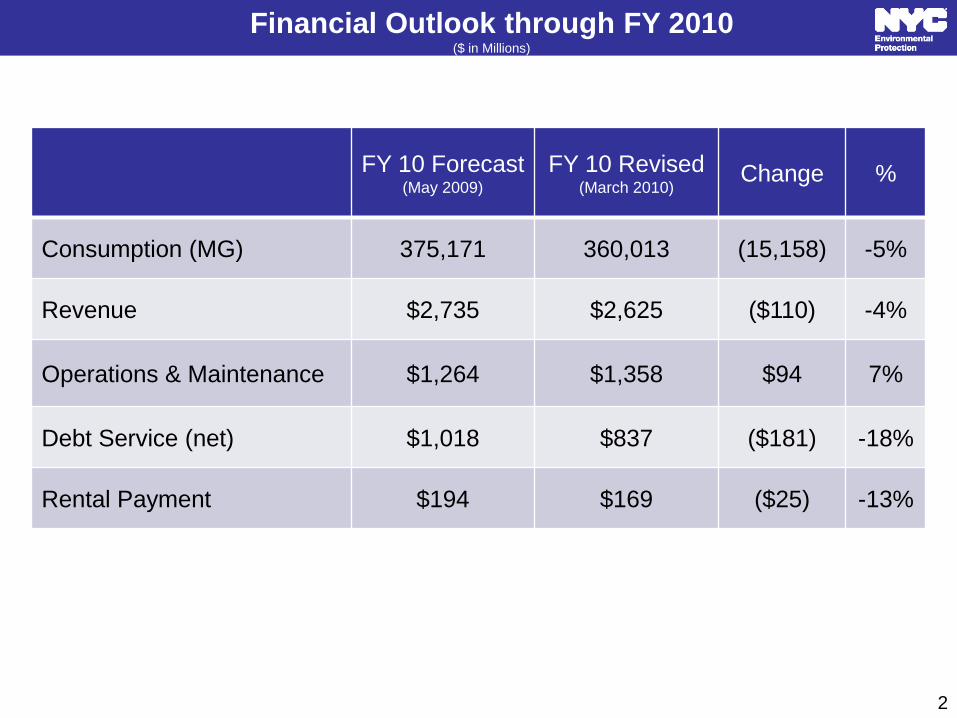
FY 10 Forecast(May 2009)
FY 10 Revised (March 2010)
Change %
Consumption (MG) 375,171 360,013 (15,158) -5%
Revenue $2,735 $2,625 ($110) -4%
Operations & Maintenance $1,264 $1,358 $94 7%
Debt Service (net) $1,018 $837 ($181) -18%
Rental Payment $194 $169 ($25) -13%
Financial Outlook through FY 2010($ in Millions)
2

Debt Service is Fastest-Growing Cost to Run the Utility
0
500
1000
1500
2000
2500
3000
3500
2002 2006 2010 2011
$ M
illi
on
s
Fiscal Year
Budget Reserve
Cash Financed Construction
Rental Payment
Indirect/Judgments & Claims
Water Board/Water Finance Authority Expenses
Operations & Maintenance Expenses
Debt Service
3

DEP has one of the largest construction programs in the region
$11 billion currently in construction and $3 billion in design and
planning
Capital work will generate approximately 5,000 jobs for each of the
next four years
Capital Investment Program Snapshot
FY 2006 FY 2007 FY 2008 FY 2009 FY 2010 Total
$1.8 $3.7 $3.1 $2.2 $3.2 $14.0
Capital Commitments FYs 2006—2010 (in billions)
4

Capital Outlook FY 2011 and Beyond
FY 2011 FY 2012 FY 2013 FY 2014 Total
$1.6 $ 1.4 $1.3 $ 1.4 $ 5.7
Projected Capital Commitments FYs 2011—2014 (in billions)
We are planning to make $5.7 billion in capital commitments between FY
2011 and FY 2014.
But the pace of capital commitments has increased debt service (net)
obligations by 65% between FY 2006 and FY 2010, and we expect debt
service (net) to increase by $395 million or 47% in 2011 alone
5

Legal Mandates Have Dictated Pace of Capital Investment
6
Of $19 billion in capital commitments for the years FY 2003 to FY
2010, $13 billion, or 69%, has gone to legal mandates
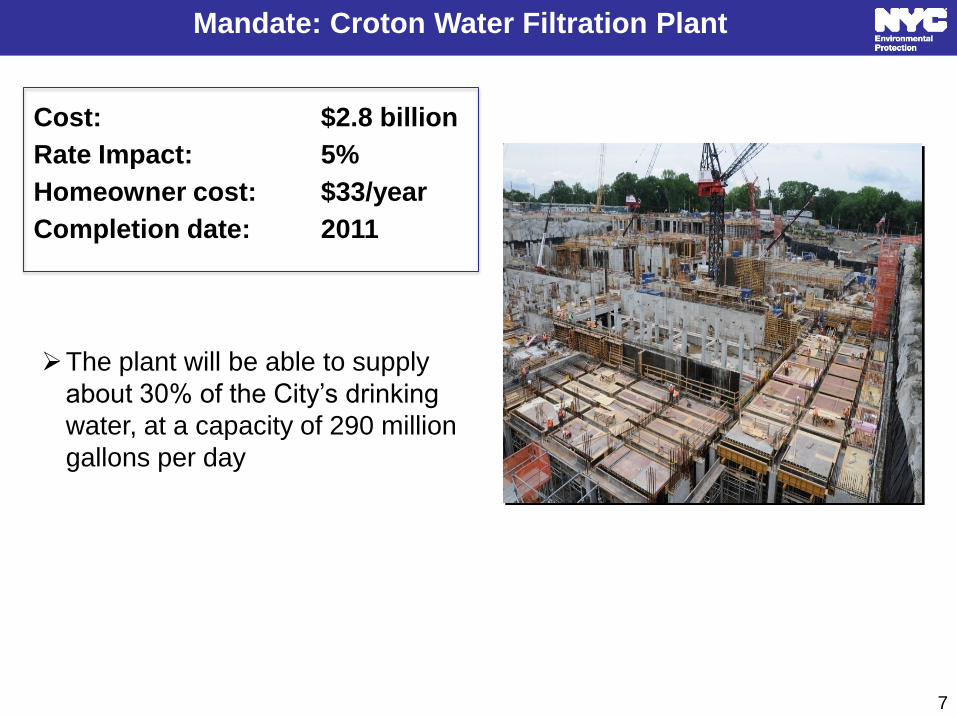
The plant will be able to supply
about 30% of the City’s drinking
water, at a capacity of 290 million
gallons per day
Mandate: Croton Water Filtration Plant
7
Cost: $2.8 billion
Rate Impact: 5%
Homeowner cost: $33/year
Completion date: 2011

The Catskill/Delaware Watershed
Ultraviolet Treatment Facility is a
public health investment to reduce
giardia and cryptosporidia
Mandate: Ultraviolet Disinfection Plant
8
Cost: $1.6 billion
Rate Impact: 3%
Homeowner cost: $18/year
Completion date: 2012

The Newtown Creek Wastewater
Treatment Plant is the last plant to
achieve secondary treatment and is
part of DEP’s long-term commitment to
improving the quality of New York’s
waterways
Mandate: Newtown Creek Wastewater Treatment Plant
9
Cost: $5 billion
Rate Impact: 8%
Homeowner cost: $48/year
Completion Date: 2014

When completed in 2011, this
storage tank will have the capacity to
hold 1.78 billion gallons of
stormwater every year
Will reduce CSO events from 61 to
21 per year, and by over 2.0 bgy
Mandate: Paerdegat Basin CSO Facility
10
Cost: $427 million
Rate Impact: 1%
Homeowner cost: $6/year
Completion date: 2011

Legal Mandates Cost the Average Homeowner $177 This Year
Mandate Cost
($ Billions)
Debt Service Impact*($ Millions)
Household
Cost($/year)
Croton Filtration Plant $2.8 $90 $33
Ultraviolet Disinfection Plant $1.6 $44 $18
Newtown Creek Treatment Plant $5.0 $144 $48
All Other $7.1 $206 $78
Total $16.5 $483 $177
11
Between FY 2002 and FY 2011, legal mandates will have added 24% to
the water rate, increasing the average annual cost of water from $639 to
$816
*Debt Service Impact is net of any surplus for the years in question.

Other Critical Infrastructure
Investments
12

City Water Tunnel No. 3
City Water Tunnel No. 3 will
provide the City with critical
supply capacity to City Water
Tunnel No.1 (1917) and City
Water Tunnel No. 2 (1936)
13
Cost: $5 billion
Rate Impact: 9%
Homeowner cost: $68/year
Completion date: 2013
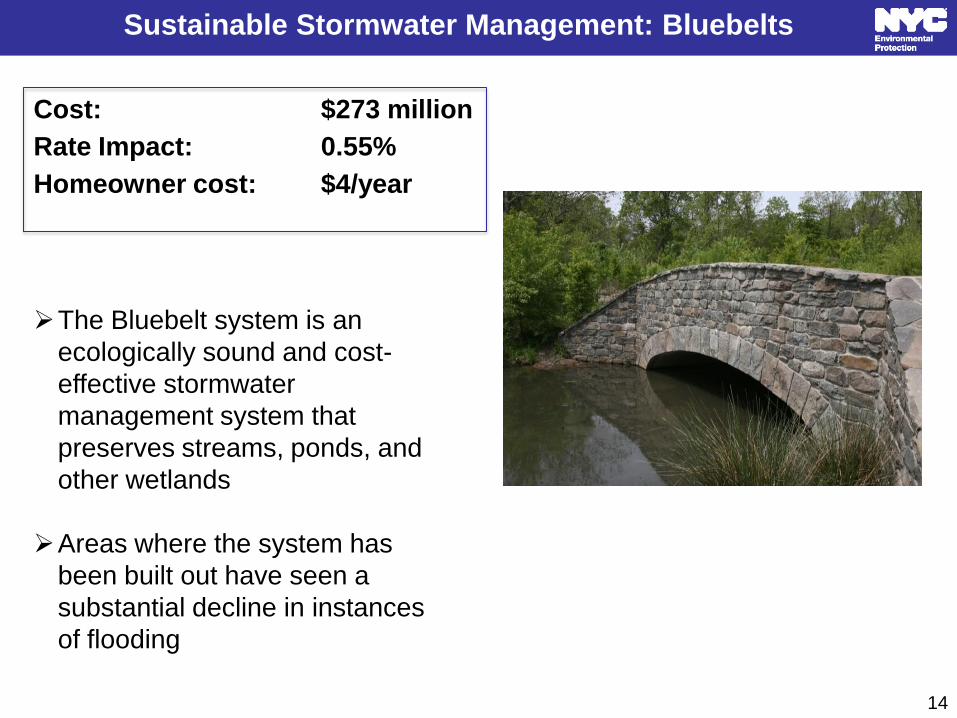
Sustainable Stormwater Management: Bluebelts
The Bluebelt system is an
ecologically sound and cost-
effective stormwater
management system that
preserves streams, ponds, and
other wetlands
Areas where the system has
been built out have seen a
substantial decline in instances
of flooding
14
Cost: $273 million
Rate Impact: 0.55%
Homeowner cost: $4/year

Customer Service: Automated Meter Reading (AMR)
Customers will be able to track their daily water use and manage their
accounts more easily
OLD DEP METER NEW DEP AMR METER
15

FY 2010
Revised(March 2010)
FY 2011(March 2010)
Consumption (MG) 360,013 356,413
Operations & Maintenance $1,358 $1,188
Debt Service (net) $837 $1,231
Rental Payment $169 $220
Financial Outlook for FY 2011($ in Millions)
16

Rate Increase Necessary to Address Shortfall in FY 2011
FY 2011 Rate ModelCost/(Revenue)
(in millions)
Debt Service (net)** $1,231
Expenses and Reserve $1,688
FY 2011 Revenue Requirement $2,952
Upstate and Other Non-City Revenue ($144)
In-City Revenue Need $2,808
FY 2011 Revenue at FY 2010 Rate ($2,486)*
FY 11 Shortfall at Current Rate $322
Increase Required 12.9%
17
*Assumes 1% drop in consumption from FY 2010.
**Debt service is net of any surplus carryover from FY 2010

FY 2011 Rate Proposal
12.9% general rate increase, 1.4% below the 14.3% forecast
1% discount for Direct Debit subscribers
Increased fee for service termination from $500 to $1,000
(actual cost $2,700)
Sewer charge for stormwater pilot for parking lots registered
with Department of Consumer Affairs
1818

Sewer Charge for Stormwater: DCA Parking Lot Pilot
To be implemented January 2011
Applied to approximately 350 stand-alone parking lots licensed by
Consumer Affairs that currently have no water service
Parking lots will be billed a sewer charge for stormwater not to
exceed $0.05 per square foot based on the property size and DEP’s
budgeted expenditures for stormwater
Estimated additional revenue < $0.5 million
Credit program will be in place when we implement this charge
Calculation for Average Parking Lot
Area of Average Parking Lot 14,500 sq. ft.
Charge per ft2 $0.05
Average Charge per year $725
19

Household Impact
Average Increase for Annual Water and Sewer Bills:
Single Family Home direct debit subscriber: $723/year to $808/year
Single Family Home without direct debit: $723/year to $816/year
Multiple Family Unit direct debit subscriber with metered billing:
$470/year/dwelling unit to $526/year/dwelling unit
Multiple Family Unit without direct debit: $470/year/dwelling unit to
$531/year/dwelling unit
20
With Direct Debit
Discount
Without Direct Debit
Discount
Single Family Home
Per year $85 $93
Per quarter $21 $23
Per month $7 $8
Multi-Family Unit
Per year $56 $61
Per quarter $14 $15
Per month $4.65 $5

Rate Increase Comparison: NYC v. Major Urban Markets
21
$0
$200
$400
$600
$800
$1,000
$1,200
$1,400
$1,600
$1,800
$2,000
$2,200
1999 2000 2001 2002 2003 2004 2005 2006 2007 2008 2009 2010
Average 6.8%
Rate Increase of Various Cities over Time
Chicago Average New York Atlanta
Atlanta 12.8%
Chicago 6.4%
NYC 6.5%

Annual Water/Wastewater Charge Comparison
22

Borough Rate Hearing Schedule
23
Borough Date Location Time
Staten Island May 4 Wagner High School 8 pm
Bronx May 6 PS 14 7 pm
Manhattan (I) May 7 22 Reade Street 2 pm
Queens May 11 Edison High School 7 pm
Manhattan (II) May 12 PS 124 7 pm
Brooklyn May 13 PS 102 7 pm

24
Rental Payment to NYC is Below Average for Large Utilities
-30 -25 -20 -15 -10 -5 0
Milwaukee (W)
Los Angeles (WW)
Louisville (W)
Dallas (W/WW)
Pittsburgh (W/WW)
Utica (W)
Los Angeles (W)
New York City (W/WW)
Cleveland (W)
Seattle (W/WW)
Detroit (W/WW)
Washington DC (W/WW)
Philladelphia (W/WW)
San Francisco (W/WW)
San Diego (W)
Boston (W/WW)
Footnote:
1. Payments from Boston & San Diego to Utility exceed
Utilities’ payments to their respective cities.
DEP net payment (Rental Payment
plus Direct/Indirect Costs minus
General Obligation Debt Service minus
water charges from City)
Net transfer between Utility and City/County

Other Fee Changes for FY 2011
Other fees are changing for specialized services DEP provides.
The fees are proposed to cover DEP’s actual costs of
providing such services:
Backflow Prevention Plan Review: New fee $350
Backflow Exemption Approval Fee: New fee $100
Hydrant Flow Test Fees: Increase fee from $250 to $500
2525

26