fiscal policy in an age of inequality
TRANSCRIPT

1
USC Gould School of Law
Fiscal Policy in an Age of Inequality
Edward D. KleinbardJohnson Professor of Law and Business
January 2016
© Edward Kleinbard 2016

2
USC Gould School of Law
Every new tax is immediately felt more or less by the people. It occasions always some murmur, and meets with some opposition.—Adam Smith, The Wealth of Nations, Book V, chap. III

3
U.S. Fiscal Policy• Two sides to fiscal policy
• Taxes, of course, but also public spending
• Annual deficits are a real issue
• Exacerbated by 2015 corporate subsidies, a/k/a tax extenders
• But deficits have no real information content by themselves
• Are taxes too low, or spending too high?
• Or are both inadequate to our needs?
• And who speaks for fiscal policy?
• What bar association? What other group?

4
Three Paramount Economic Issues• Fiscal policy is at the heart of our most pressing issues:
• Inequality
• Stagnant incomes of middle class
• Long-term growth
• In response, government should do more, not less!
• Only government can assure genuine equality of opportunity
• Government investment projects offer jobs with dignity
• Complementary investment is accretive to growth
• Which means we must revisit our inadequate tax base!

5
We Put the Cart Before the Horse• We argue constantly about the harms of taxation
• But tax revenues are not simply consumed by bonfires: they purchase public investment and insurance
• How much do we know about the returns to public investment and insurance?
• Or the opportunity costs of not pursuing a public investment or insurance project?
• Fiscal policy means thinking about the net effect of the totality of spending and taxing
• Including both returns to spending and larger social returns (jobs with dignity, opportunities to succeed)
6
Reframing Government• Government exists to spend, not to tax
• Taxation is just how we finance that spending
• Fiscal policy means measuring returns to government spending net of costs of financing it
• Government investment:• Yields large economic returns
• Complements the private sector, not competes with it
• The only vehicle to ensure genuine equality of opportunity
• Private markets are great, but they inevitably are incomplete in ways that reduce welfare and opportunities
• Government insurance:• Aligns with theory and reflects the contingent nature of our lives
7
Government is Not a Zero-Sum Game• Large positive returns to government spending belie
false narrative of makers vs. takers
• The pie gets larger, and the servings are more broadly shared
• Both narrow economic returns and important social returns
• Think infrastructure jobs, investment in early childhood education
• Government spending is highly progressive in its distributional effects
• Which means we can obtain a more progressive fiscal systemwithout steeply higher progressive tax rates
• Government is not a zero-sum game!
8
Inequality is Real and Corrosive• Inequality threatens our values and economic future
• And threatens to become an hereditable gene
• Government uniquely positioned to respond
• Highest adult poverty rate (18-65) in OECD (GDP %)
• Highest ratios of rich to poor in OECD (S90/S10, P90/P50)
• CBO: Top 1% doubled its share of national market income 1979 – 2007 (to 21%) [16.9% in 2011]
• USA is unique in OECD: high income + high inequality
• “Redistribution” does less in USA than in other rich countries – because we do so little of it!

9
Rising Inequality Is Real

10
Everyone Has Lost Ground Relative to 1%
Shares of Market Income, 1979 and 2007

11
Wealth is Very Highly Concentrated
(Source: Saez & Zucman (2016))
Top 1% total ≈ 42% total U.S. household wealth

12
U.S. Gap Between Rich and Poor is Wide
Sharesof Market Income (1979–2007)
S90/S10 Ratios of household disposable incomes (2010)

13
U.S. Accepts Much More Poverty
Poverty Rate, Poverty Line 50%, Population Ages 18–65, after taxes and transfers (2010)

14
U.S. Does Little “Redistribution”• Comparing the Gini coefficient [a standard measure of inequality] of
market incomes to the Gini of disposable incomes, yields a rough picture of effect of tax + transfer system on inequality remediation
• Market income = cash income + ESI + employer share payroll taxes
• Disposable income = After-tax, After-transfer income
• By this measure US does little redistribution (CBPP 5/14)
• Example: US and Germany have similar market income inequality, but very different disposable income inequality:

15
Gini Coefficients of Market and Disposable Incomes, Working Age Populations, Late 2000’s
Country Market Income Gini
DisposableIncome Gini
Percent DecreaseIn Inequality
Italy 0.4647 0.3342 28%
UK 0.4559 0.3446 24%
USA 0.4527 0.3701 18%
France 0.4310 0.2920 32%
Germany 0.4197 0.3000 28%
Australia 0.4180 0.3236 22%
Canada 0.4158 0.3283 21%
Japan 0.3916 0.3235 17%
Sweden 0.3723 0.2269 39%
Switzerland 0.3380 0.2902 14%
Source: OECD, Divided We Stand (2011), Fig. 6.1 supplemental tables

16
U.S. vs OECD Income Inequality Trendline

17
The Middle Class is Right to be Angry• Male worker median earnings flat for 40 years
• Modest family income gains attributable to women• Long-term trend of women’s entry into workforce
• And slow improvement in wage gap (still unacceptable)
• Where are jobs with dignity?• Not everyone will be a software engineer!
• Importance of construction and allied fields – public investments
• Median adjusted household income (2011 dollars):• 1998: $35,600
• 2011: $35,200

18
Male Workers’ Median Earnings Flat for 40 Years

19
Median Household Incomes Have Only Crept Up
O.5% Per Annum Compounded Growth Over 30 Years

20
Minimum Wage Does Little But Could Help Many
O.5% Per Annum Compounded Growth Over 30 Years
21
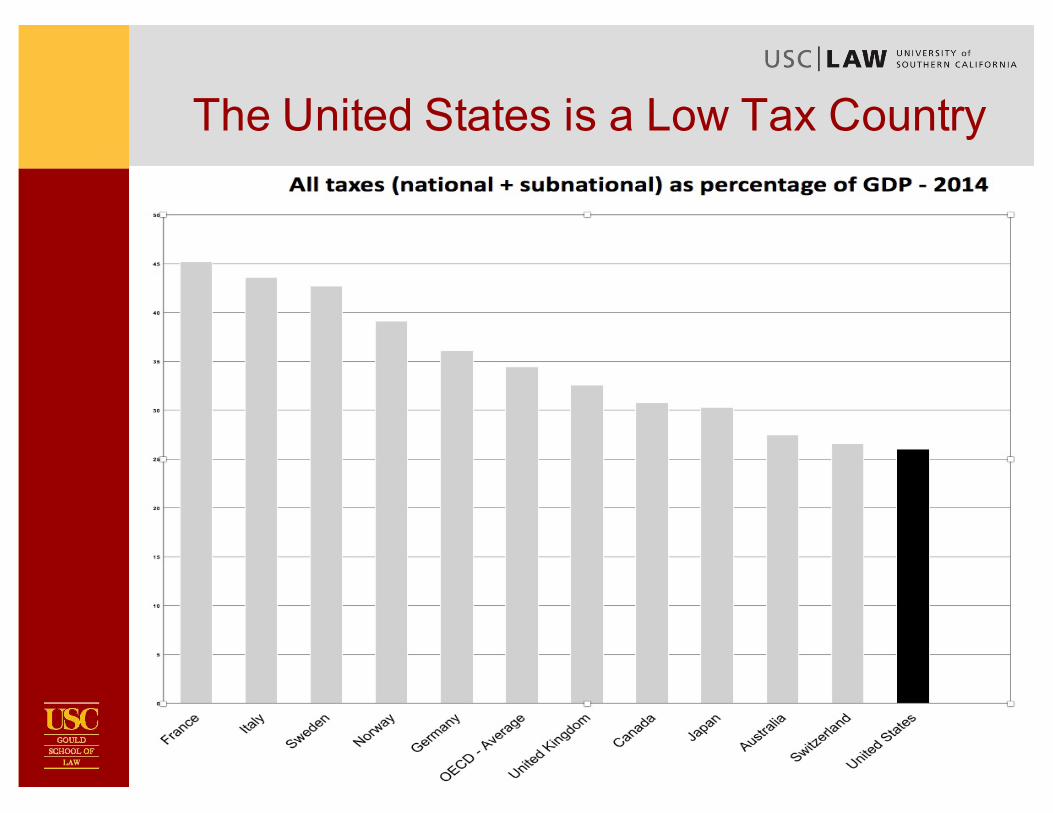
A Low-Tax Small Government Country I• U.S. tax as % of GDP lowest of major OECD countries
• Includes federal, state and local• CBO Jan. 2016: federal tax revenues = 18.1% GDP next 10yrs
• And those taxes in fact shared across all income levels• Total tax system is modestly progressive
• Government is big spender in only two areas• Defense: As much as next 14 countries combined
• 42% of world spending
• Healthcare – Most inefficient system in world
• USA – 17.7% of GDP (public and private)
• Netherlands (#2) – 11.9% of GDP. If we spent at Dutch rate, savings >$10 trillion over decade
.
22
The United States is a Low Tax Country
All taxes (national + subnational) as percentage of GDP

23
Tax Distribution is Not Lopsided
Includes state and local taxes(Source: CTJ)
24
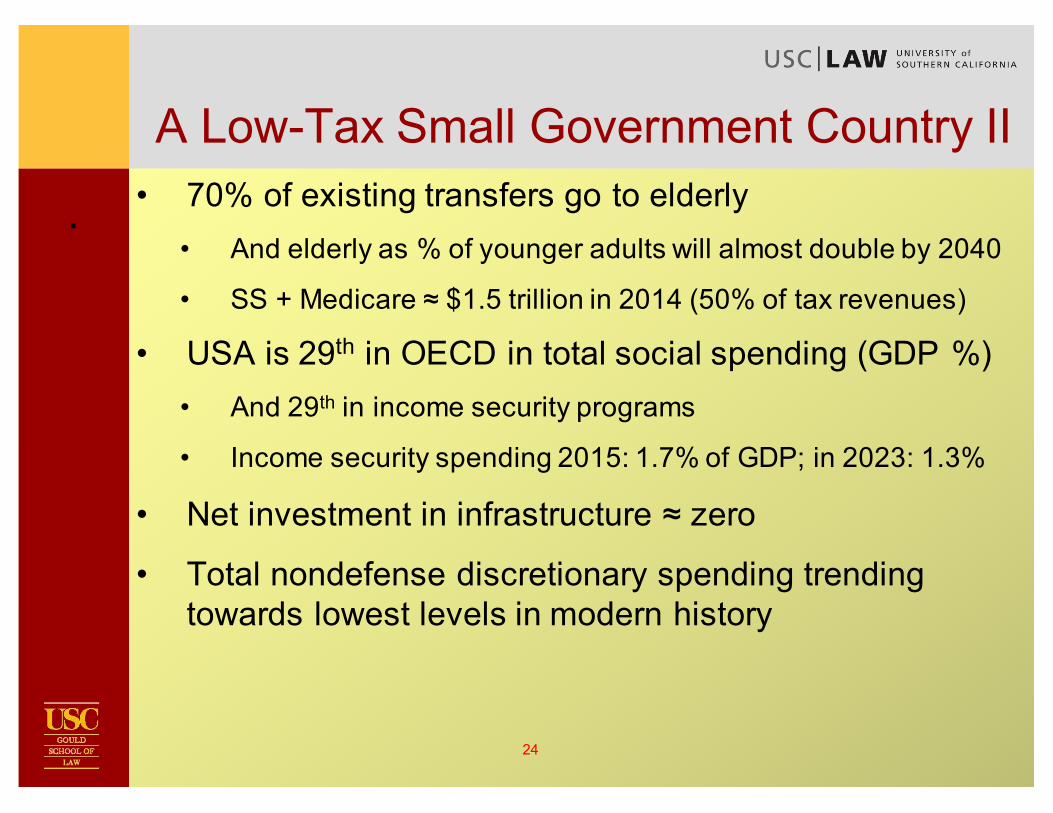
A Low-Tax Small Government Country II• 70% of existing transfers go to elderly
• And elderly as % of younger adults will almost double by 2040
• SS + Medicare ≈ $1.5 trillion in 2014 (50% of tax revenues)
• USA is 29th in OECD in total social spending (GDP %)• And 29th in income security programs
• Income security spending 2015: 1.7% of GDP; in 2023: 1.3%
• Net investment in infrastructure ≈ zero
• Total nondefense discretionary spending trending towards lowest levels in modern history
.

25
Existing Transfers Largely Fund the Elderly

26
U.S. Invests Almost Nothing in Infrastructure
Net government investment in infrastructure as percentage of GDP

27
Our Largest Investment Opportunity - I• Our largest asset class is ourselves
• Our lifetime incomes and satisfaction are directly tied to our investments in ourselves through education
• And the country gets richer when we do so
• Equality of opportunity demands comparable investments in comparably able kids, regardless of parents’ wealth
• Government necessarily must be the investor here
• Private markets do not and cannot invest directly in people
• Form of government investment in education of course can vary

28
Our Largest Investment Opportunity - II• Recent study: 10% > spending K-12 = 7.25% higher
wages for a lifetime
• Yet here are the facts:
• School test scores track median home prices in the area
• Top quintile spends 7x on enrichment vs lowest quintile
• Academic achievement gap 30 – 40% > 20 years ago
• Reason: we are one of 4 OECD countries to spend more on public education of rich kids than poor kids
• We keep company with Slovenia and Turkey

29
Our Largest Investment Opportunity - III• Systematic differences in human capital investment
convert income inequality into an hereditable gene
• Mediocre rich kids get into top colleges and earn more
• Mobility suffers
• Mobility outcomes worse than Canada or much of Europe
• Top and bottom of income distributions are much stickier in USA than in Canada or much of Europe
• Across generations
• And within one generation
30
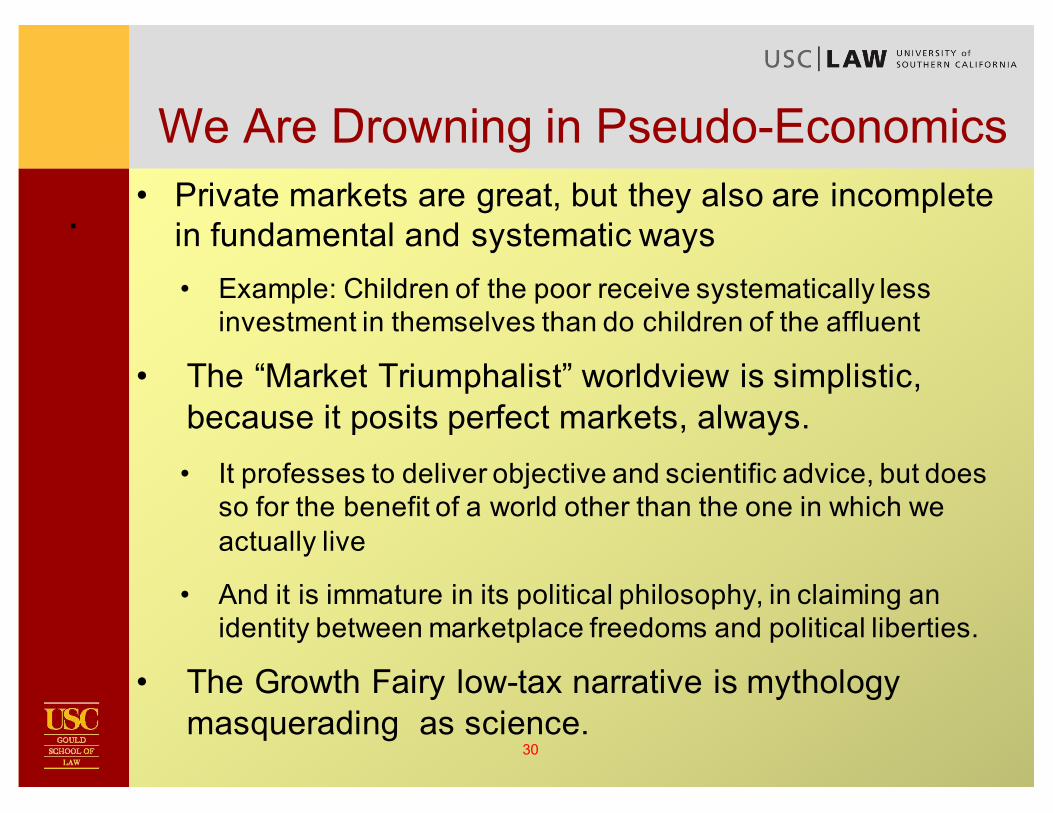
We Are Drowning in Pseudo-Economics• Private markets are great, but they also are incomplete
in fundamental and systematic ways • Example: Children of the poor receive systematically less
investment in themselves than do children of the affluent
• The “Market Triumphalist” worldview is simplistic, because it posits perfect markets, always. • It professes to deliver objective and scientific advice, but does
so for the benefit of a world other than the one in which we actually live
• And it is immature in its political philosophy, in claiming an identity between marketplace freedoms and political liberties.
• The Growth Fairy low-tax narrative is mythology masquerading as science.
.

31
Luck Has Everything to Do With It• Life’s outcomes are highly contingent
• We control less of our personal destinies that we like to admit. Our health, accidents (good and bad), wholly fortuitous events –all these change our outcomes.
• And we do not choose the lives into which we are born – not our parents, not our personal attributes.
• Market Triumphalism misreads market outcomes as efficient outcomes • It ignores the pervasive role of luck in our lives, and the
incomplete nature of markets in the real world
• Government insurance mitigates the consequences of bad luck, in areas that private insurance cannot reach
• Gov’t insurance can increase risk-taking, not laziness

32
Two Levers of Progressivity• The left’s preoccupation with progressive income tax
(higher marginal rates) is self-limiting and self-defeating
• Well-designed public spending by itself is progressive in practice –the benefits of that spending are broadly shared
• Steeply progressive tax rates thus are not necessary to finance progressive fiscal systems (the net of spending and taxing)
• Other countries have figured this out
• Germany or the Nordics have more regressive taxation, but a much more progressive net fiscal system, because their commitment to public investment and insurance is larger
• The spending side dominates – mildly regressive taxes can fund progressive net fiscal systems!

33
Two Percent Solution• We do not need to become France to do better
• Increasing federal government spending by about 2 percent of GDP would open up many new opportunities
• Spending in the range of 24 rather than 22 percent of GDP
• Numbers very sensitive to wars and healthcare spending
• Not a very big change in our relationship to government!
• But doesn’t government often fail?
• Of course it does, but we have reason to work to do better
34
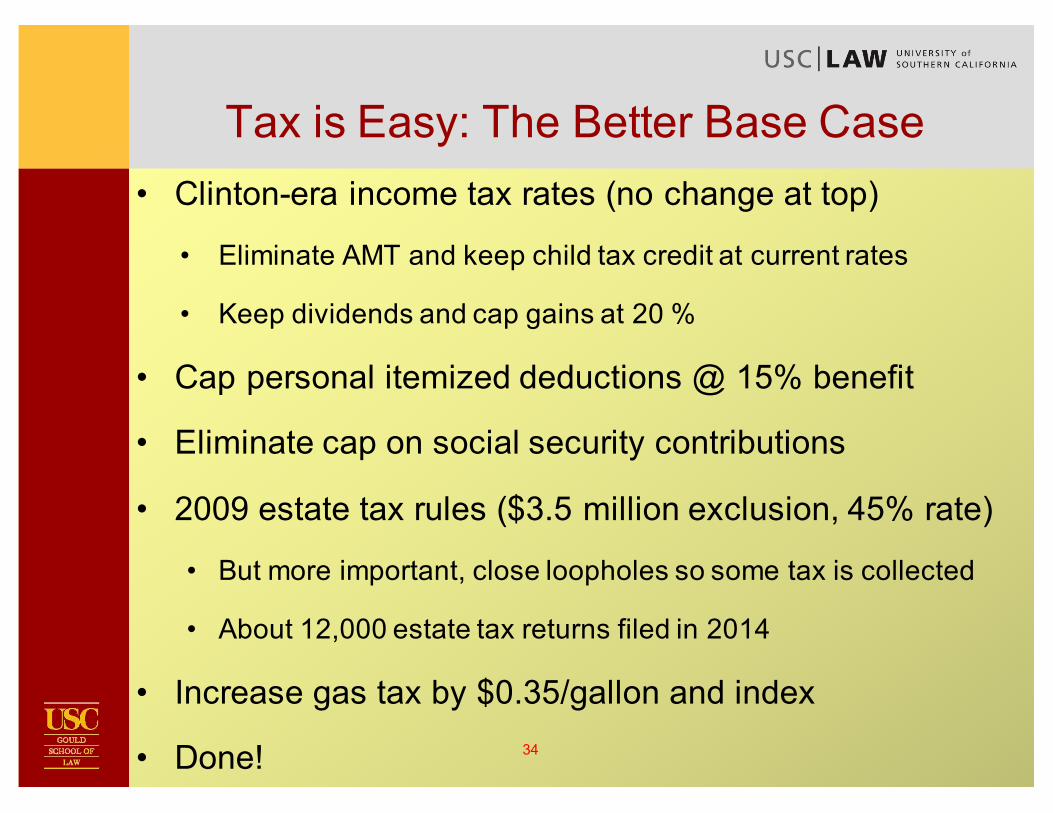
Tax is Easy: The Better Base Case• Clinton-era income tax rates (no change at top)
• Eliminate AMT and keep child tax credit at current rates
• Keep dividends and cap gains at 20 %
• Cap personal itemized deductions @ 15% benefit
• Eliminate cap on social security contributions
• 2009 estate tax rules ($3.5 million exclusion, 45% rate)
• But more important, close loopholes so some tax is collected
• About 12,000 estate tax returns filed in 2014
• Increase gas tax by $0.35/gallon and index
• Done!

35
Reclaiming Our Fiscal Soul• When we choose how government should spend and
tax, we open a window into our national "fiscal soul”
• Thinking about our “fiscal soul” reminds us of our larger obligations, and our opportunities to increase the happiness of society, in the real world – one removed from theoretical models of perfect markets and perfectly rational economic actors
• Fiscal policy thus is about applied moral philosophy as much as it is a story of incentives and preferences
• Both conservatives and progressives get things wrong: We need more government, not less, but we do not need steeply higher top marginal income tax rates to yield a richer, more equal, and happier society
36
Advice from a Dead Moral Philosopher• “Power and riches contrive only to produce a few trifling
conveniencies to the body. They keep off the summer shower, not the winter storm, and leave a man always as much, and sometimes more, exposed than before to anxiety, and to sorrow; to diseases, to danger, and to death.”
• “[W]hat improves the circumstances of the greater part [of society] can never be regarded as an inconveniency to the whole. No society can be flourishing and happy, of which the greater part of its members are poor and miserable.”
– Adam Smith

37
The Book