fiscal policy, monetary policy and inequality in the uk · paul johnson 19/05/2017 fiscal policy,...
TRANSCRIPT

Paul Johnson 19/05/2017
Fiscal Policy, Monetary Policy and Intergenerational Inequality in the UK

Output per head only just above 2008Q1 level
© Institute for Fiscal Studies
90
100
110
120
130
140
2008
Q1
2009
Q1
2010
Q1
2011
Q1
2012
Q1
2013
Q1
2014
Q1
2015
Q1
2016
Q1
2017
Q1
2018
Q1
2019
Q1
2020
Q1
2021
Q1
2022
Q1
2008
Q1
= 10
0
Source: Office for Budget Responsibility
GDP per person aged 16+
2% per year growth
15% gap

And forecast growth also weak …
© Institute for Fiscal Studies
90
100
110
120
130
140
2008
Q1
2009
Q1
2010
Q1
2011
Q1
2012
Q1
2013
Q1
2014
Q1
2015
Q1
2016
Q1
2017
Q1
2018
Q1
2019
Q1
2020
Q1
2021
Q1
2022
Q1
2008
Q1
= 10
0
Source: Office for Budget Responsibility
GDP per person aged 16+
2% per year growth 18% gap

Income and earnings inequality down recently
© Institute for Fiscal Studies Fiscal Policy, Monetary Policy and Inequality in the UK
3.0
3.2
3.4
3.6
3.8
4.0
4.2
4.4
1997 1999 2001 2003 2005 2007 2009 2011 2013 2015
90:10 ratio for UK Net Equivalised Household income and Gross Weekly Earnings
Earnings
Source: Family Expenditure Survey; Family Resources Survey; Annual Survey of Hours and Earnings

Income and earnings inequality down recently
© Institute for Fiscal Studies Fiscal Policy, Monetary Policy and Inequality in the UK
3.0
3.2
3.4
3.6
3.8
4.0
4.2
4.4
1997 1999 2001 2003 2005 2007 2009 2011 2013 2015
90:10 ratio for UK Net Equivalised Household income and Gross Weekly Earnings
Income
Earnings
Source: Family Expenditure Survey; Family Resources Survey; Annual Survey of Hours and Earnings

2.0
2.5
3.0
3.5
4.0
4.5
5.0
0.20
0.22
0.24
0.26
0.28
0.30
0.32
0.34
0.36
0.38
1961 1966 1971 1976 1981 1986 1991 1996 2001 2006 2011
90
:10
ra
tio
Gin
i co
eff
icie
nt
Gini coefficient
90:10 ratio
2.0
2.5
3.0
3.5
4.0
4.5
5.0
0.20
0.22
0.24
0.26
0.28
0.30
0.32
0.34
0.36
0.38
1961 1966 1971 1976 1981 1986 1991 1996 2001 2006 2011
90
:10
ra
tio
Gin
i co
eff
icie
nt
Source: Figures 3.6 and 3.7 of Living Standards, Poverty and Inequality: 2016
Having grown sharply over 1980s
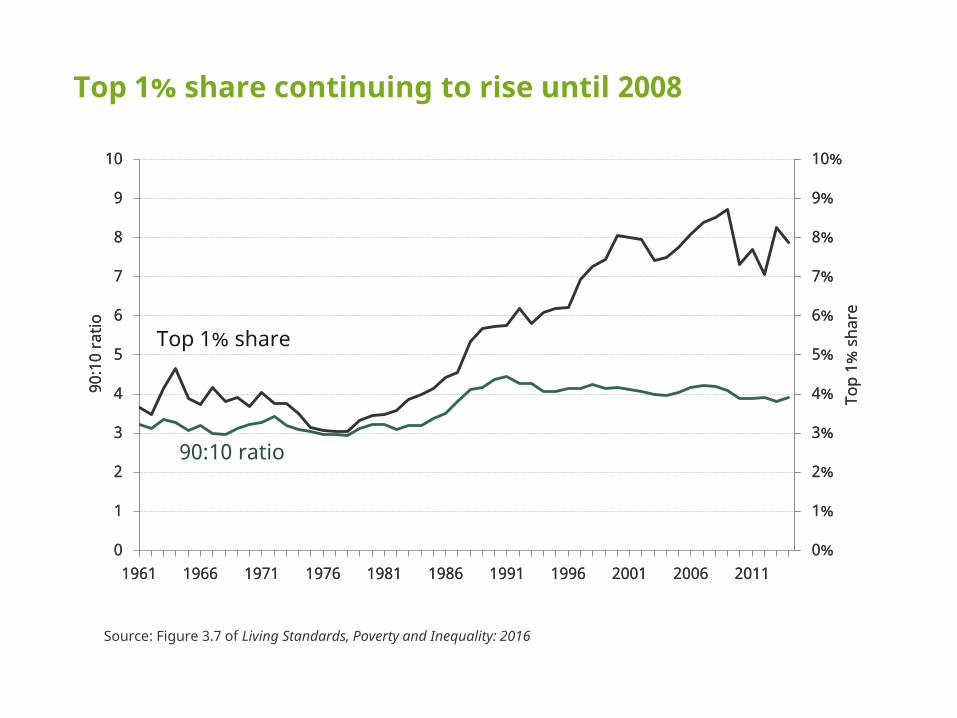
0%
1%
2%
3%
4%
5%
6%
7%
8%
9%
10%
0
1
2
3
4
5
6
7
8
9
10
1961 1966 1971 1976 1981 1986 1991 1996 2001 2006 2011
Top
1% s
hare
90:1
0 ra
tio
90:10 ratio
Top 1% share
0%
1%
2%
3%
4%
5%
6%
7%
8%
9%
10%
0
1
2
3
4
5
6
7
8
9
10
1961 1966 1971 1976 1981 1986 1991 1996 2001 2006 2011
Top
1% s
hare
90:1
0 ra
tio
Source: Figure 3.7 of Living Standards, Poverty and Inequality: 2016
Top 1% share continuing to rise until 2008
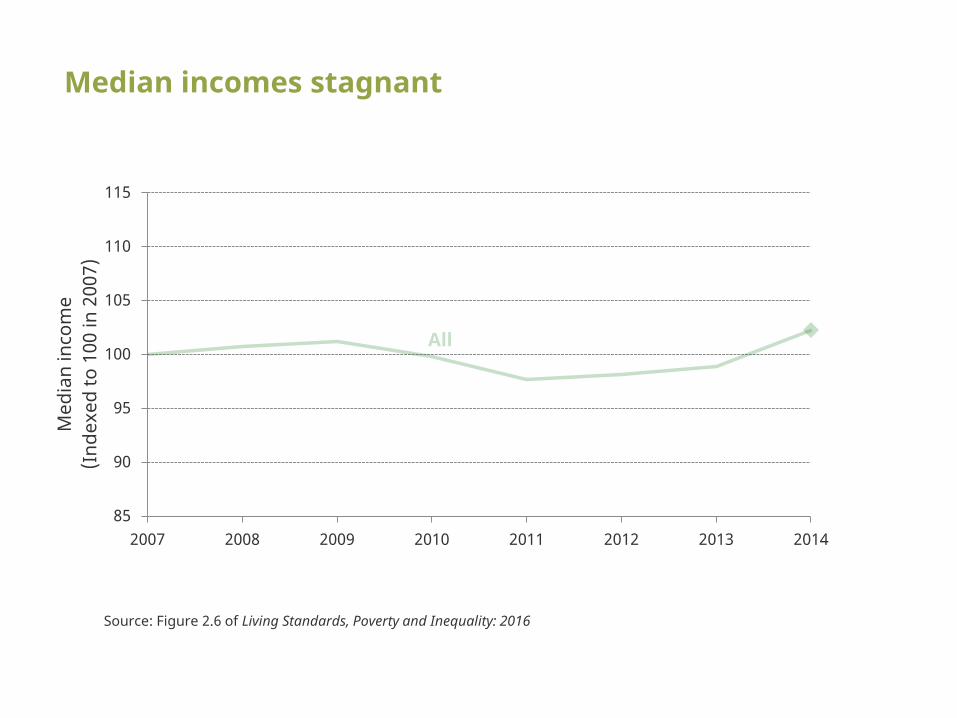
Median incomes stagnant
85
90
95
100
105
110
115
2007 2008 2009 2010 2011 2012 2013 2014
Med
ian
inco
me
(Ind
exed
to 1
00 in
200
7)
Source: Figure 2.6 of Living Standards, Poverty and Inequality: 2016

Much worse for the young
85
90
95
100
105
110
115
2007 2008 2009 2010 2011 2012 2013 2014
Med
ian
inco
me
(Ind
exed
to 1
00 in
200
7)
-7%
Source: Figure 2.6 of Living Standards, Poverty and Inequality: 2016
22-30

Much better for the old
85
90
95
100
105
110
115
2007 2008 2009 2010 2011 2012 2013 2014
Med
ian
inco
me
(Ind
exed
to 1
00 in
200
7)
-7%
0%
Source: Figure 2.6 of Living Standards, Poverty and Inequality: 2016
22-30
31-59
60+
+11%

The distribution of wealth
© Institute for Fiscal Studies Fiscal Policy, Monetary Policy and Inequality in the UK

And concentrated at older ages
© Institute for Fiscal Studies Fiscal Policy, Monetary Policy and Inequality in the UK
£0
£100,000
£200,000
£300,000
£400,000
£500,000
£600,000
£700,000
£800,000
£900,000
16
-24
25
-34
35
-44
45
-54
55
-64
65
-74
75
-84
85
+
All
Net
ho
us
eh
old
wealth
Age group
Mean p25 p75 Median

Of course the old hold the cash
© Institute for Fiscal Studies Fiscal Policy, Monetary Policy and Inequality in the UK
£0
£5,000
£10,000
£15,000
£20,000
£25,000
£30,000
£35,000
£40,000
£45,000
20-24 25-29 30-34 35-39 40-44 45-49 50-54 55-59 60-64 65-69 70-74 75-79 80+
Cash
/nea
r ca
sh h
oldi
ngs
Age-group
25th percentile Median 75th percentile

But it’s the young who can’t build up savings
If you work until 67, die at 90, and have earnings that grow 2% p.a.
With 4% real interest rate you need to save 10% of income to replace 50% in retirement
With 0% real interest rate saving rate needs to be 30%
© Institute for Fiscal Studies Fiscal Policy, Monetary Policy and Inequality in the UK

The old also hold the housing wealth
0%
10%
20%
30%
40%
50%
60%
70%
80%
90%
16-24 25-34 35-44 45-64 65-74 75+
Perc
enta
ge o
f ind
ivid
uals
who
ow
n th
eir
own
hom
e
Home-ownership rates by age-group
2013/14
© Institute for Fiscal Studies Fiscal Policy, Monetary Policy and Inequality in the UK
Source: English Housing Survey
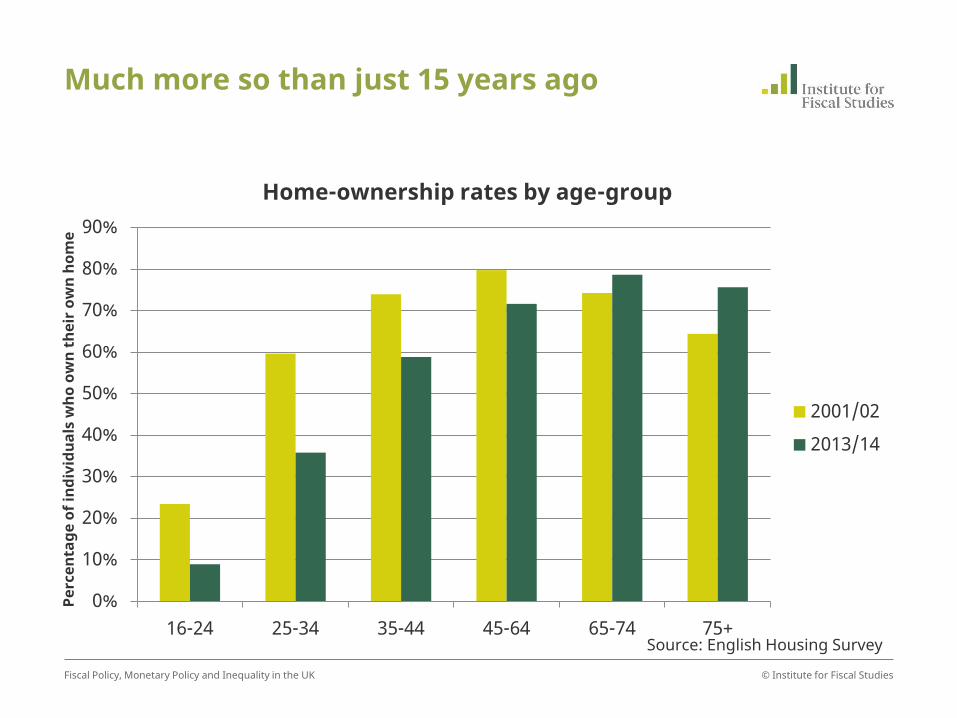
Much more so than just 15 years ago
0%
10%
20%
30%
40%
50%
60%
70%
80%
90%
16-24 25-34 35-44 45-64 65-74 75+
Perc
enta
ge o
f ind
ivid
uals
who
ow
n th
eir
own
hom
e
Home-ownership rates by age-group
2001/02
2013/14
© Institute for Fiscal Studies Fiscal Policy, Monetary Policy and Inequality in the UK
Source: English Housing Survey

Younger cohorts much less likely to be owner occupiers
20%
30%
40%
50%
60%
70%
80%
90%
25 30 35 40 45 50 55 60
Hom
eow
ners
hip
rate
Age
1930s
1940s 1950s
1960s 1970s
Early 1980s

And DB pensions have collapsed
0%
10%
20%
30%
40%
50%
60%
16 - 21 22 - 29 30 - 39 40 - 49 50 - 54 55 - 59 60 - 64 Age-group of employee
Percentage of employee jobs in a defined benefit pension scheme
1997
2016
© Institute for Fiscal Studies Fiscal Policy, Monetary Policy and Inequality in the UK
Source: ONS

Proportion of private sector employees in DB scheme 1997 and 2015
© Institute for Fiscal Studies
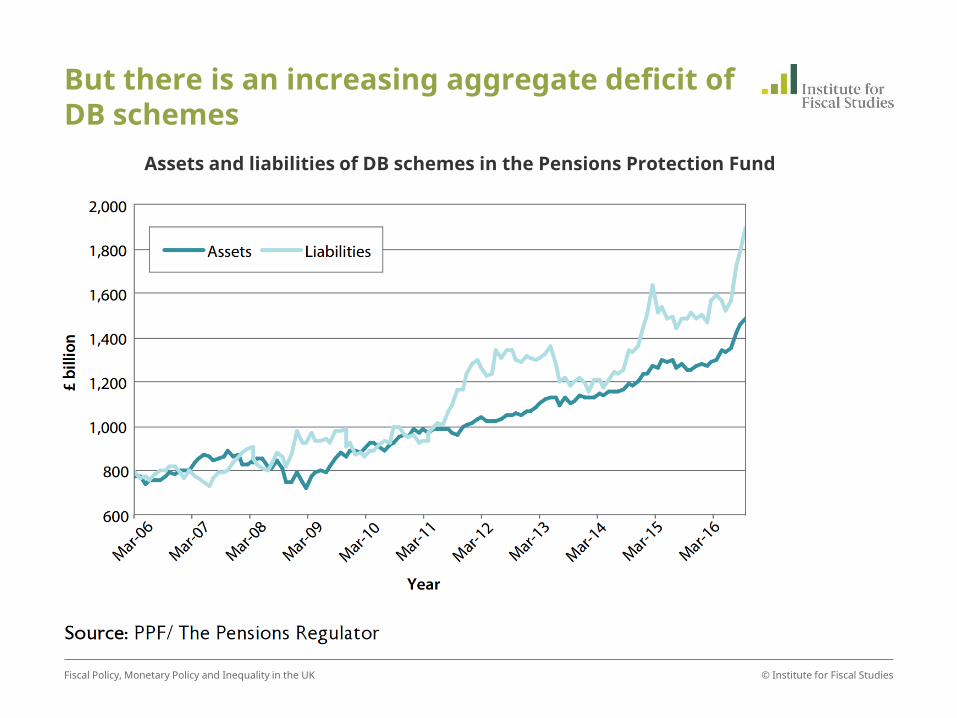
But there is an increasing aggregate deficit of DB schemes
© Institute for Fiscal Studies Fiscal Policy, Monetary Policy and Inequality in the UK
Assets and liabilities of DB schemes in the Pensions Protection Fund

Overall younger cohorts accumulating less wealth
© Institute for Fiscal Studies Fiscal Policy, Monetary Policy and Inequality in the UK

Loose monetary policy supporting tight fiscal policy
30%
32%
34%
36%
38%
40%
42%
44%
46%
2007
-08
2008
-09
2009
-10
2010
-11
2011
-12
2012
-13
2013
-14
2014
-15
2015
-16
2016
-17
2017
-18
2018
-19
2019
-20
2020
-21
2021
-22
Latest outturn and forecast for total Government spending and receipts
Spending
Receipts
© Institute for Fiscal Studies Fiscal Policy, Monetary Policy and Inequality in the UK
Source: OBR

Crucial point: after 8 years of “austerity” the size of the state is just back at pre crisis levels
© Institute for Fiscal Studies Budget 2017: the fastest u-turn since Budget 2016?
39.0 39.3
37
38
39
40
41
42 Sp
endi
ng in
200
7–08
Pens
ione
r ben
efits
Hea
lth
Ove
rsea
s ai
d
Wor
king
-age
be
nefit
s
Deb
t int
eres
t
Scho
ols
Def
ence
Oth
er
Publ
ic o
rder
& s
afet
y
Spen
ding
in 2
016–
17
Per c
ent o
f nat
iona
l inc
ome

Increases in spending on pensions and health offset cuts elsewhere
© Institute for Fiscal Studies Budget 2017: the fastest u-turn since Budget 2016?
39.0 39.3
+0.8
+0.7
+0.3 0.2 –0.2
–0.3 –0.3
–0.4 –0.5
37
38
39
40
41
42 Sp
endi
ng in
200
7–08
Pens
ione
r ben
efits
Hea
lth
Ove
rsea
s ai
d
Wor
king
-age
be
nefit
s
Deb
t int
eres
t
Scho
ols
Def
ence
Oth
er
Publ
ic o
rder
& s
afet
y
Spen
ding
in 2
016–
17
Per c
ent o
f nat
iona
l inc
ome

Tax and benefit changes have hit the bottom half and the very top
-5%
-4%
-3%
-2%
-1%
0%
1%
2%
Perc
enta
ge c
hang
e in
net
hou
seho
ld in
com
e
Income decile
Percentage change in net household income as a result of tax and benefit policies implemented under the coalition government
Benefits
Taxes
All
© Institute for Fiscal Studies Fiscal Policy, Monetary Policy and Inequality in the UK
Source: IFS

Pensioners protected, those with children hit hardest
-7%
-6%
-5%
-4%
-3%
-2%
-1%
0%
1%
2%
Perc
enta
ge c
hang
e in
net
hou
seho
ld in
com
e
Income decile
Impact of coalition government tax and benefit policies by group
Working-age without children Working-age with children
© Institute for Fiscal Studies Fiscal Policy, Monetary Policy and Inequality in the UK
Source: IFS
Fiscal policy has worked with monetary policy and underlying trends to protect the old and hit the young
1. Triple lock means basic state pension has grown 9%pts more than average earnings since 2010-11.
© Institute for Fiscal Studies Fiscal Policy, Monetary Policy and Inequality in the UK

The triple lock
85
90
95
100
105
110
115
Inde
x of
sta
te p
ensi
on le
vel
Growth rate of basic state pension compared to average earnings (2010-11 level = 100)
Actual
Earnings
Double Lock
CPI
© Institute for Fiscal Studies Fiscal Policy, Monetary Policy and Inequality in the UK
Source: OBR and author’s calculations

Policy changes have exacerbated existing trends
1. Triple lock means basic state pension has grown 9%pts more than average earnings since 2010-11.
2. The state pension age for men has not kept up with increasing longevity
© Institute for Fiscal Studies Fiscal Policy, Monetary Policy and Inequality in the UK

Dramatic increase in numbers living longer in recent decades
0%
10%
20%
30%
40%
50%
60%
70%
80%
90%
100%
65 70 75 80 85 90 95 100
Proportion of male 65-year-olds surviving to given age
65 in 1987
65 in 2017
© Institute for Fiscal Studies Fiscal Policy, Monetary Policy and Inequality in the UK
Source: ONS Life Tables

Policy changes have exacerbated existing trends
1. Triple lock means basic state pension has grown 9%pts more than average earnings since 2010-11.
2. The state pension age for men has not kept up with increasing longevity
Without further rises in the state pension age, pension spending will rise rapidly as a share of GDP, and require other spending cuts or tax rises.
© Institute for Fiscal Studies Fiscal Policy, Monetary Policy and Inequality in the UK

Even without triple lock, state pension spending will rise as a share of GDP
© Institute for Fiscal Studies Fiscal Policy, Monetary Policy and Inequality in the UK
4.0%
4.5%
5.0%
5.5%
6.0%
6.5%
7.0%
7.5%
8.0%
2016
-17
2018
-19
2020
-21
2022
-23
2024
-25
2026
-27
2028
-29
2030
-31
2032
-33
2034
-35
2036
-37
2038
-39
2040
-41
2042
-43
2044
-45
2046
-47
2048
-49
2050
-51
2052
-53
2054
-55
2056
-57
2058
-59
2060
-61
2062
-63
2064
-65
2066
-67
Perc
enta
ge p
oint
s of
GD
P
Long-term State Pension Spending Projections
FSR 2017 central
FSR 2017 (No triple lock)
FSR 2017 (Only legislated changes to SPA)
Source: OBR Fiscal Sustainability Report
Policy changes have exacerbated existing trends
1. Triple lock means basic state pension has grown 9%pts more than average earnings since 2010-11.
2. The state pension age for men has not kept up with increasing longevity
3. Reductions in pensions lifetime allowance have not hurt current pensioners but those who are currently of working age.
4. Cuts to public service pensions mostly impact those of working age
5. Taxation of housing continues to favour those who already own
© Institute for Fiscal Studies Fiscal Policy, Monetary Policy and Inequality in the UK

Fiscal attempts to offset have been minimal, counter-productive or ineffective
1. Ending requirement to annuitise pensions
response to low interest rates
2. “Help-to-buy” intended to help first time buyers
has likely raised prices
3. Attempts to increase housebuilding ineffective
4. Taxes on buy-to-let as a ‘third best’ response
© Institute for Fiscal Studies Fiscal Policy, Monetary Policy and Inequality in the UK
Fiscal and monetary policies together
Distributional effects of fiscal policy regularly analysed:
• Increasing focus on impact by age, not just income
Impacts of monetary policy less easy to define:
• What is the counterfactual?
• Would need to know impact of monetary policy on asset markets
Attitudes matter
• Changes to asset values seen as “act of God” • Impacts via e.g. DB schemes may not be visible
• Those who already have money notice changes to interest rates • But bigger impact on those looking to build savings
• Fiscal policies reducing entitlements of old seen as “retrospective”
• Tax increases/benefit cuts for working age deemed acceptable
© Institute for Fiscal Studies Fiscal Policy, Monetary Policy and Inequality in the UK