fiscal policy for growth and development further analysis ... · for growth and development further...
TRANSCRIPT

INTERNATIONAL BANK FOR RECONSTRUCTION AND DEVELOPMENT AND THE INTERNATIONAL DEVELOPMENT ASSOCIATION
FISCAL POLICY FOR GROWTH AND DEVELOPMENT
Further Analysis and Lessons
from Country Case Studies
March 22, 2007

ACRONYMS
AAC Aid Access Countries AIDS Acquired Immune Deficiency Syndrome CEM Country Economic Memorandum DEC Development Economics, World Bank ESW Economic and Sector Work GBC Government Budget Constraint GDP Gross Domestic Product GFS Government Finance Statistics Hi-AAC Aid Access Countries with high aid inflows Hi-MAC Market Access Countries with a relatively high level of public expenditure HICs High Income Countries HIV Human Immunodeficiency Virus HIPC Heavily Indebted Poor Country IMF International Monetary Fund LICs Low Income Countries Low-AAC Aid Access Countries with low aid inflows Low-MAC Market Access Countries with a relatively low level of public expenditure MAC Market Access Countries MICs Middle Income Countries MTEF Medium Term Expenditure Framework MAMS Maquette for MDG Simulations MDGs Millennium Development Goals MDG-1 Target 1 of Millennium Development Goals MDRI Multilateral Debt Relief Initiative OECD Organization for Economic Cooperation and Development PEFA Public Expenditure and Financial Accountability PER Public Expenditure Review PFM Public Financial Management PPP Public Private Partnership PRSP Poverty Reduction Strategy T&C Transport and Communication VAT Value-Added Tax
ACKNOWLEDGEMENTS This paper was prepared under the supervision of D. Leipziger (PREM VP), directed by S. Pradhan
(Director, PRMPS) and task managed by A. Rajaram (Lead Economist, PRMPS).
S. Shetty (Director, AFR PREM) and K. Krumm (Sector Manager, AFR PREM) provided guidance.
UContributors from the PREM, HD and INF Networks and country teams:
D. Benitez, Prof. D. Bevan (consultant), B. Bidani,, N. Biletska, M. Brownbridge (consultant), W. Butterfield (consultant), C. Briceno Garmendia,, J. L. Calix, S. Canagarajah, A. Estache, K. Ezemenari, V. Foster, K. Gassner, Prof. N. Gemmell (consultant), P. Gottret, D. Haazen, P. Kumar, T.M. Le, E. Ley, A. Manroth, D. L. Merotto, M. Mills, B. Moreno-Dodson, C. Obidegwu, B. Pinto, J. Rojchaichaninthorn, P.
Saavedra, A. Seck, V. Songwe, L. Sondergaard, A. Soucat, P. Suriyaarachchi (consultant), Z. Swift, M. Thomas, M. Vagliasindi, A. Varoudakis, S. von Klaudy, M. Vujicic, P. Wade, E. Weisman and M. Wes.

Fiscal Policy for Growth and Development
Further Analysis and Lessons from Country Case Studies
March 22, 2007
Contents
Executive Summary ........................................................................................i I Introduction........................................................................................1 II. The Debate over “Fiscal Space” ........................................................3 III. Evidence on Public Spending and Growth ........................................6 IV. A Growth-Oriented Approach to Fiscal Policy .................................7 V. Country Case Studies.......................................................................10 VI. Conclusions and Operational Implications ......................................29 Boxes Box 1: Iteration between Goals and Resource Constraints...............9 Box 2: Modeling Public Expenditure and Growth .........................10 Box 3: Country Case Studies ..........................................................14 Figures Figure 1: Growth-Oriented Fiscal Policy Schematic ........................8 Figure 2: Expenditure, Revenue and Deficit Levels.......................11 Figure 3: Navigating in Fiscal Space ..............................................13 Annex Material ............................................................................................36 Table A1: Economic Growth and Fiscal Indicators 2003-05 .........37 Table A2: Summary of Recent Results for Developed Countries ..44 Table A3: Summary of Recent Results for Developing Countries.45 Annex 1: The Microeconomics of Expenditure Decisions .............38 Annex 2: Theory and Evidence on Public Expenditure and Growth 41 Annex 3: Public Expenditure in Six High Growth Countries.........47 Annex 4: Revenue Mobilization .....................................................50 References........................................................................................51

i
EXECUTIVE SUMMARY
A. Introduction i. In September 2005 the Development Committee requested Bank management to provide advice on using fiscal policy to better support growth and development. The request reflected the widely held perception that the conventional approach to fiscal policy largely focused on the macroeconomic stabilization objective and: (a) neglected the role of fiscal policy in helping achieve the objective of higher economic growth, and (b) did not sufficiently tailor fiscal policy advice to the needs of countries at different stages of development. ii. In an interim 2006 report, the Bank suggested that the design of fiscal policy should incorporate both the stabilization and growth objectives explicitly.TPF
1FPT It
concurred with the view that in the 1980s and 1990s, fiscal policy focused largely on the goal of stabilization and under-emphasized the growth objective. The assumption that stabilization will lead to higher growth has not always been borne out. With stabilization having been achieved in many countries, the design of fiscal policy needs to identify and incorporate how public spending, taxation, aid and borrowing may stimulate long-term growth and poverty reduction. The report proposed to undertake a number of country case studies to consider how an approach to fiscal policy could be developed that would be responsive to the growth needs of countries at different stages of development while maintaining macroeconomic stability. iii. The goals of macroeconomic stability and growth are related and fiscal policy design must reflect this complex relationship. There is consensus that macroeconomic stability is a necessary condition for sustainable growth and that the design of stabilization programs must be improved to enhance growth prospects. The quality (speed and composition) of fiscal adjustment during stabilization often impinges on growth. A fiscal adjustment that relies unduly on cuts in investment or excessive revenue enhancements may lower an economy’s growth trajectory. Fiscal policy design therefore needs to ensure that the quality of fiscal adjustment minimizes adverse consequence for growth. Even after successful stabilization, a growth-oriented fiscal policy, together with monetary and exchange rate policies, will need to maintain macroeconomic stability. iv. Countries at different stages of development face different needs and constraints that need to be reflected in fiscal policy design. All countries and their governments are subject to the inter-temporal budget constraint which defines the limits of the room for fiscal maneuver. But poorer countries face a particularly large mismatch between their growth and development needs (physical infrastructure, delivery of critical health and educational services, protection of the vulnerable) and their public financing TP
1PT Development Committee (2006), “Fiscal Policy for Growth and Development: An Interim Report”,
background paper for the April 2006 meeting of the Development Committee of the World Bank and the IMF.

ii
capabilities (a narrow tax base, limited ability to borrow and service debt). Access to external aid potentially narrows the gap, but raises issues of predictability and donor earmarking of aid resources. Demographics and health issues also play an important role. AIDS has a large development as well as fiscal impact, reducing the productive and fiscal potential of affected economies. Many middle and higher income countries face the fiscal challenge of providing for aging populations while also mobilizing resources for investment. v. The report focuses on the challenge of designing a growth-oriented fiscal policy for economies where higher growth is presumed to be constrained by fiscal policies. While recognizing that the over-arching objective is sustained poverty reduction, the paper focuses on economic growth as an important and necessary means to reduce poverty, and investigates the role of fiscal policy in that regard. Fiscal policy may be discouraging growth either because (i) the tax system has major disincentive effects, (ii) the level of expenditure is inadequate or the efficiency of spending is very poor, or (iii) the composition of expenditure is tilted away from productive activities. Alternatively, the credibility of fiscal policy itself may be an issue because of past policy performance. vi. Fiscal policy decisions reflect the societal preferences and political economy of a country. Public expenditure and taxation policies are fundamentally political choices which reflect the political economy and institutional arrangements in a country. While acknowledging this fact, the presumption underlying this paper is that the quality of fiscal policy decisions could be improved if: (a) they were informed by ex-ante policy analysis that clarified the likely growth and distributional consequences of alternative choices; and (b) planning and fiscal institutions enabled political actors to take a longer term perspective and supported a contestable process for determining policy decisions. vii. This report synthesizes insights from good practice in public finance as well as twelve ongoing country case studies which pilot a growth-oriented approach to fiscal policy design. The purpose of the case studies is to learn when and how fiscal policy can be shaped to usefully contribute to growth. A related objective is to identify what aspects of the Bank’s work can be enhanced in order to assist governments develop viable medium-term growth strategies that enable countries to aim higher yet stay within the limits that macroeconomic stability requires. B. A Growth-Oriented Approach to Fiscal Policy viii. A common diagnostic approach was used to guide the design of a growth-oriented fiscal policy in the country case studies. Study teams sought to identify constraints to higher growth and to assess if these were “fiscal constraints”, requiring changes in public expenditure or taxation to address them. The diagnostic was used to identify whether improvements in efficiency of expenditure or taxation would remove the constraint or if it would be possible to shift resources from less productive uses by changing the composition of expenditure. The case studies attempt to identify the efficiency of expenditure in key sectors, a difficult exercise given problems of data availability. An increase in the level of expenditure may also be considered to address the growth constraint if possible fiscal savings from efficiency or cuts in low value

iii
expenditure are inadequate or not possible. Where a level shift is required, the implications for financing are to be considered and the costs of such financing compared to the benefits. For a realistic fiscal policy that is consistent with stability to take shape iteration between growth goals and constraints will be necessary, making the resource constraint endogenous to the iterative process. Appropriate fiscal institutions (deliberations between planning and finance ministries, for example), and coordination between the Bank and the IMF, can help discipline and inform this iteration process. C. Country Case Studies ix. Twelve countries with different fiscal/development profiles were selected for the case studies.TPF
2FPT Their per capita incomes range from $230 (Rwanda) to $4710
(Turkey). Growth rates in the twelve countries over the most recent 3 year period ranged from 9.2 percent in Tajikistan to 2.6 percent in Brazil, with a median growth rate of 5.1 percent per annum. Six of the countries have some degree of access to grant aid, in terms of their primary source of external financing, and the remaining six generally rely on market-based borrowing to supplement domestic revenue. Accordingly, we classify the countries as Aid Access countries (AAC) or Market Access countries (MAC). x. Domestic revenue effort varies significantly across the 12 countries. Brazil, Turkey and Ukraine cluster towards the high end of the scale with high revenue and expenditure shares of GDP and are classified as Hi-MAC for the purpose of the study. Rwanda, Uganda, and Madagascar raise only 10-14 percent of revenue, but spend 20-28 percent of GDP. Their large fiscal deficits are financed by high aid inflows of 10-14 percent of GDP and these countries are classified as Hi-AAC. The other six countries have revenue and expenditure shares in the 15-30 percent range. We classify Cameroon, Kenya and Tajikistan as low-AAC since grant aid shares are low while India, Morocco and Philippines are classified as low-MAC, since size of government is low relative to the Hi-MACs. xi. The case studies reveal a variety of “fiscal constraints” to growth. While the case studies are illustrative, they do highlight key issues in each country. In many, the constraints to higher growth or continued high growth were identified as relating to physical public infrastructure – for example, Uganda, Kenya, Rwanda, Madagascar, Brazil, India, and Turkey. In some, the tax burden was identified as a disincentive for private investment and growth – for example, Brazil, Turkey, Ukraine, Morocco, Rwanda. In Uganda, Rwanda, and Madagascar, while governments confront the challenge of providing basic education to a predominantly young population, the lack of skilled labor was also seen as limiting foreign investment and future growth. Health investments are under-funded in Morocco. In Morocco and Tajikistan, infrastructure was not seen to be a constraint to growth, but the maintenance of existing infrastructure was felt to be important for sustained growth. In Tajikistan, non-fiscal constraints relating to regulation and the investment climate were seen to be more critical constraints to growth. TP
2PT The countries are Brazil, Cameroon, India, Kenya, Madagascar, Morocco, Philippines, Rwanda,
Tajikistan, Turkey, Uganda and Ukraine.
iv
xii. The case studies confirm that the appropriate way to enhance the growth impact of fiscal policy varies with country characteristics. In most countries, improvements in efficiency provide a potentially important means to improve sector outputs and enhance growth. Estimating fiscal savings or growth effects from efficiency gains requires detailed sectoral assessments which are made difficult because of data limitations.TPF
3FPT Shifting the composition of expenditure from low priority to growth related
expenditure is also likely to be a significant basis for improving the growth impact of fiscal policy in many countries. Brazil, Ukraine and Turkey would have a stronger growth stimulus if they relied on improved composition and efficiency of expenditure. In some countries, such as India and Morocco, improving the efficiency of tax policy would improve the growth orientation of fiscal policy and, in India’s case, enable the government to enhance revenue collection and reduce the fiscal deficit. An increase in the overall level of public expenditure to address the constraints to growth appears to be suggested mainly for Rwanda, Madagascar and Uganda. In these countries, the increased expenditure would need to be financed by predictable aid, appropriately linked to improvements in outcomes. In some countries, governance concerns will have to be addressed to permit higher aid flows. D. Conclusions and Implications xiii. A major conclusion that emerges is the need for explicit development of growth-oriented fiscal policy scenarios to inform the design of an overall macroeconomic policy package. This would allow countries to identify and address country-specific constraints to higher growth. Some iteration between growth objectives and resource constraints will be required to achieve the appropriate design of fiscal policy for achieving higher growth with stability, consistent with the inter-temporal budget constraint. Operationalizing such an approach will require scenario analysis because it is difficult to accurately anticipate the growth impact of fiscal policy. The development of growth scenarios will require detailed, country specific analysis of key fiscal-growth linkages. Such analysis will help inform policy makers on the inter-temporal trade-offs involved in various policy choices. xiv. The growth impact of fiscal policy is directly related to the efficiency of resource use. The quality of governance and management in the public sector has a major influence on the efficiency of resource use and therefore on the growth impact of any particular category of public expenditure. Improving efficiency will require efforts to address the governance and management constraints specific to each sector while also strengthening budgetary processes. xv. The composition of expenditure is another fundamental determinant of the growth impact of fiscal policy. Governments that aim to achieve higher growth have to align the composition of expenditure to address country-specific constraints to growth, allocating resources to areas with the highest economic or social returns. Identifying and assessing such trade-offs may help governments adjust their policy priorities and expenditure choices. TP
3PT The country cases attempt to assess the scope for efficiency gains in the health, education and
infrastructure, using pragmatic approaches to assess cost efficiency and effectiveness

v
xvi. The level of expenditure that can be sustained is related to the capacity of a country to raise revenue efficiently. This underlines the importance of establishing a broad based and income-elastic tax system with a capable and efficient tax administration. The greater the efficiency of taxation and expenditure policies, the higher the level of expenditure that can be sustained. xvii. Fiscal institutions and budget processes determine the capability to undertake an effective growth-enhancing fiscal policy. Embedding a longer term growth objective in an operational fiscal strategy requires a high degree of government planning, coordination and implementation. Governments need effective institutions to raise revenue, to maintain fiscal discipline, to determine the composition of the budget and to utilize resources efficiently. Most countries require sustained effort to strengthen these capabilities across the public sector. Implications for Country Authorities xviii. Institutions that enable a government to adopt and implement a long term perspective can support a growth-oriented approach.TPF
4FPT Many countries have initiated
long term vision statements or commitments to the MDGs that will require stronger institutional support. Close coordination between planning, finance and sector ministries is often critical to a longer-term growth strategy that is consistent with macroeconomic stability. xix. A transparent, evidence-based approach can help governments make informed policy choices. Most decisions on resource allocation will involve trade-offs, including inter-temporal ones, that will have political economy implications. Policy analysis that makes the trade-offs explicit may help improve policy decisions. Highlighting the adverse growth implications of decisions to cut investment may help governments to protect such expenditure. xx. Indicators of longer term fiscal health could guide fiscal management. Conventional fiscal indicators provide an inadequate basis for long term decisions. Indicators that approximate a net worth measure of the public sector balance sheet could complement the fiscal deficit and provide a better basis for fiscal management but should be pragmatically implemented, taking account of country circumstances. A first step could be to record and report an inventory of public sector assets in addition to a full record of liabilities. xxi. Measures to improve the composition and efficiency of the budget have a high growth payoff. Too often fiscal policy choices are viewed in terms of the scope to increase expenditure through borrowing. Periodic public expenditure reviews and tracking surveys could help country authorities identify ways to achieve higher growth
TP
4PT As noted, a number of the case study countries have initiated long term development vision statements,
such as the Kenya 2030, Rwanda and Madagascar MAP These will need to be supported by fiscal strategies and coordinated implementation.

vi
with available resources. Performance oriented management in the sectors would also help address specific sources of inefficiency and waste. xxii. Governments could strengthen key aspects of budget formulation and execution to improve the growth impact. Ongoing efforts to implement the MTEF in many countries will help governments articulate growth oriented fiscal scenarios and link budget decisions to address fiscal constraints to growth. Strengthening the process for selection and implementation of investment projects will also have a significant payoff. Implications for Development Partners xxiii. Donor governments can support country authorities if they follow through on commitments to provide aid that is more predictable and subject to fewer conditions and earmarks. While aid should be linked to performance, the trend towards greater use of aid earmarked to particular goals is problematic. The task of fiscal policy management will be made more difficult if aid flows are unreliable and unpredictable and if aid quality is seen as poorly aligned with country priorities. xxiv. Development partners may need to extend the time horizon for high aid flows for some countries. If some low-income countries are unable to raise domestic revenue shares significantly because of structural constraints, aid-flows may have to be sustained over a longer time horizon so long as aid is effectively utilized. Implications for the Bank xxv. The Bank will have to play a significant role in developing techniques to better assess the impact of fiscal policy on growth. Both sector level data collection and analysis of the effectiveness of public spending, including systematic cost benefit analysis of major public programs, would help improve resource allocation. The development and use of models such as MAMS for evaluating the growth implications of alternative fiscal policy scenarios will have to be encouraged. xxvi. While enhancing its work on fiscal policy, the Bank will need to continue its support to public finance management. Over the last decade the Bank has focused a good deal of its attention on public finance management. Helping countries strengthen budget systems and implement a Medium Term Expenditure Framework (MTEF) linked to the PRS or similar development strategy will remain highly relevant. It will be especially important to help countries strengthen systems for project and program evaluation to improve the efficiency of public investment, and to support governance reforms that improve transparency and accountability for the use of budget resources. xxvii. The timeliness and content of Bank advice will be critical. In large part, the periodicity of the Bank’s advice will be determined by the budget cycle of member governments as well as the need for effective coordination with the IMF.

vii
Implications for Bank-Fund Collaboration xxviii. Both the Bank and the Fund are committed to assisting countries improve fiscal policy design to promote growth while maintaining stability. Success in this effort requires inputs from both institutions and in that context collaboration will be critical. An upstream exchange of views on longer-term growth-related aspects of fiscal policy would help both the Bank and the Fund better frame their advice. This is likely to involve some iterative process that could be usefully structured to ensure that it is timely and institutionally supported on both sides. A joint effort to improve the quality and availability of public finance data will also enable important empirical analysis to guide policy advice from both institutions. E. Actions to be Considered
1) Stronger growth-oriented public finance work: A set of workshops will be held to review and enhance Bank guidance for public finance reviews to enable staff to consider the dynamics of fiscal policy and address the fiscal-growth linkage in ESW.
2) Wider application of modeling techniques: The MAMS model has now been
applied in a number of countries and has proven useful for scenario analysis for economic goals, including growth, poverty reduction and the achievement of the MDGs. The Bank could take steps to encourage application of this technique for a broader range of countries as part of a roll-out of the new guidance.
3) Joint initiative with IMF to improve public finance data: Both the Bank and
the IMF have an interest in improving the quality and usefulness of GFS data for policy analysis. It is proposed that the Bank initiate a dialogue with the IMF on specific actions that will achieve this.
4) Bank-wide effort to improve data and methods of efficiency analysis:
Building on work initiated for the case studies with the Human Development and Infrastructure Networks, an inter-network initiative is proposed to enhance the development of methods, as well as collection and use of data, to strengthen efficiency analysis.
5) Program of research on public expenditure, taxation and growth in
collaboration with Regions and DEC. The profile of fiscal policy concerns justifies a strong Bank-supported research effort to develop further insights on a range of relevant issues, including the role of fiscal policy, fiscal institutions and governance on growth and poverty objectives.

Fiscal Policy for Growth and Development Further Analysis and Lessons from Country Case Studies
I. Introduction 1. In September 2005 the Development Committee requested Bank management to provide advice on using fiscal policy to better support its growth and development goals. The request reflected the widely held perception that the conventional approach to fiscal policy largely emphasized the macroeconomic stability objective and: (a) neglected the role of fiscal policy in supporting higher growth, and (b) did not sufficiently tailor fiscal policy advice to initial conditions of countries at different stages of development. 2. The Bank provided its perspective in an interim report (2006) to which the current report is a sequel. The interim report made the following main points – (a) that macroeconomic stability was a necessary but not a sufficient condition for economic growth and development, (b) that the design of fiscal policy should explicitly seek to take account of both objectives – macroeconomic stability and long term growth, (c) that the design of an appropriate growth-oriented fiscal policy for any country should factor in the initial conditions in that country, including its fiscal history and reputation, its public finance potential and its growth and development needs, (d) that a key link between fiscal policy and growth or other development objectives would benefit from a deeper understanding of the effects of public expenditure levels, composition and efficiency, and (e) that the role of institutions and governance are critical to ensuring that public spending has the desired impact on policy objectives, including growth. 3. Countries at different stages of development face different needs and constraints that need to be reflected in fiscal policy design. All countries and their governments are subject to the inter-temporal budget constraint which limits the room for fiscal maneuver. But poorer countries face a particularly large mismatch between their growth and development needs (physical infrastructure, delivery of critical health and educational services, protection of the vulnerable) and their public financing capabilities (a narrow tax base, limited ability to borrow and service debt). Access to external aid potentially narrows the gap, but raises issues of predictability and earmarking of resources. Demographics also play an important role. Many middle and higher income countries face the fiscal challenge of providing social security and social assistance programs for aging populations while also maintaining adequate levels of public investment. 4. Fiscal policy decisions reflect societal preferences and the political economy of a country. Public expenditure and taxation policies have implications for the scope and incidence of government services, for growth and for income distribution. As such, they are fundamentally political choices that may be derived from the country’s process for articulating and debating policy objectives and options and obtaining political endorsement through a legislative process. That process, which reflects the political

2
economy and institutional arrangements in the country, will determine the shape of fiscal policy and the composition of expenditure and taxation. In many countries, fiscal policy changes that would promote growth, such as eliminating unproductive subsidies or closing tax loopholes, may be blocked by political opposition from vested interests.TPF
5FPT The
presumption underlying this paper is that the quality of fiscal policy decisions could be improved if: (a) they are informed by ex-ante policy analysis that clarifies the likely growth and distributional consequences of alternative choices; and (b) planning and fiscal institutions enable political actors to take a longer term perspective and support a contestable process for determining policy decisions. 5. The current paper describes a growth-oriented approach to fiscal policy design and reports on insights, including from the ongoing case studies which have sought to apply the approach. Economic growth is not an end in itself but a means to the overall objective of sustained poverty reduction. As such, governments have to also ensure that the quality of growth is pro-poor, is environmentally sustainable, and is supplemented with direct interventions that help the poor and vulnerable. The purpose of the case studies is to learn when fiscal policy could usefully be reshaped to further growth objectives and how this might be achieved in different circumstances. Growth may often be constrained for a variety of non-fiscal reasons (e.g., political uncertainty, poor enforcement of property rights.); however, this assessment focuses on cases where the initial conditions are such that the limitations to higher growth are prima facie felt to be of a fiscal nature. A related objective is to identify what aspects of the Bank’s work would need to be enhanced in order to assist governments better develop viable medium-term growth and fiscal strategies that are consistent with macroeconomic stability. 6. The paper is structured as follows: Section II provides a brief discussion of the main perspectives in the debate on “fiscal space for growth” and indicates a potentially unifying perspective to reconcile the various views. Section III provides a summary of Annexes 2 and 3 which review the evidence linking public expenditure and growth in developed and developing countries, identifying typical expenditures that are shown to be growth-related. Section IV then proposes a “growth-oriented approach” to fiscal policy design that provides a diagnostic to guide the use of fiscal policy to address constraints to growth. Section V reports on the highlights and lessons learnt from application of this approach to 12 country case studies. Section VI draws conclusions and implications for country authorities and development partners as well as specific operational implications for the Bank’s analytical approach and work on fiscal/public expenditure issues. It also provides some views on the possible improvements in the Bank’s guidance and tool kit and arrangements for Bank-Fund collaboration to ensure appropriate coordination of views on growth and stability. Annex material provides additional detail for specific discussion referenced in the text.
TP
5PT There is a growing literature on the political economy of budgeting which, while relevant, is beyond the
scope of this paper. See Keefer and Khemani (World Bank, 2003) and Besley and Burgess (QJE 2002) for examples and further references.

3
II. The Debate Over “Fiscal Space” 7. The renewed focus on fiscal policy and growth has spawned a lively debate over demands for greater “fiscal space” to support growth. Some proponents question the design of fiscal policy at the macroeconomic level, suggesting that stabilization has often been achieved by cutting expenditures that are productive, thereby sacrificing growth. Others base their argument for “fiscal space” for growth or welfare promoting activities on the basis of micro-economic criteria, suggesting that conventional fiscal policy and associated fiscal rules distort sensible micro-economic choices that would improve government net worth or overall welfare. It has also been suggested that the approach to fiscal policy has a bias that ignores the development payback from human capital investments. The macro-micro interface therefore needs to be clarified to identify the real issues around fiscal policy and growth, acknowledging the key role of the inter-temporal budget constraint. 8. Without seeking to address all the nuances of the debate, this paper offers an integrated perspective which may prove useful in framing the fiscal policy discussion. First, it acknowledges that a full understanding of fiscal policy and growth with stability requires integration of three related perspectives – (a) macroeconomic (b) microeconomic and (c) institutional. Macroeconomic considerations are clearly relevant for aggregate fiscal policy and the fiscal deficit and related measures are necessary for defining a stabilization program, but how such a program can be reconciled with growth needs to be clarified. How project or program level micro-economic decisions should be undertaken so that governments can promote economic or social objectives consistent with the inter-temporal budget constraint also needs to be better understood. And most critically, the importance of institutions for policy design and implementation to support fiscal policy needs to be highlighted. Institutions create the incentives for fiscal discipline, prioritization in expenditure composition, and efficiency in public sector performance and are often the weakest link between fiscal policy, growth and welfare outcomes. 9. With regard to the macroeconomic perspective, there are a number of constituencies that believe policy packages could be improved to deliver more growth without sacrificing stability. In many developing countries, there has been a significant improvement in the quality of macroeconomic management, in general, and fiscal policy, in particular. For these countries, stabilization has been substantially achieved, though ensuring maintenance of this stability will remain a policy concern for the indefinite future. Despite this success, there remains pervasive disquiet about the current formulation and conduct of fiscal policy based partly on the perception that stabilization and the maintenance of stability may have been purchased at an unnecessarily high price in terms of foregone output and welfare.TPF
6FPT
TP
6PT In the interim report (DC 2006), this had been expressed in terms of the need to consider whether there
was unexploited “macroeconomic space” that would enable governments to better accommodate growth related expenditure without risking macroeconomic stability.

4
10. Fiscal policy design could better incorporate growth objectives if stabilization programs adapted the speed and composition of fiscal adjustment. There is a consensus that macroeconomic stability is a necessary condition for growth, but also a widespread conviction that the design of stabilization programs should be improved to enhance growth prospects. Both the speed and composition of fiscal adjustment during stabilization may impinge on growth and on the durability of stabilization itself. Country experience suggests that very rapid adjustments may cause severe output losses under some circumstances. As regards composition, a fiscal adjustment that relies disproportionately on cuts in investment or other productive expenditure may lower an economy’s growth trajectory. In some countries, an adjustment based on excessive revenue enhancement may depress private investment incentives and thus growth. The quality of fiscal adjustment during stabilization should therefore be factored into fiscal policy design to minimize any adverse consequence for growth. TPF
7FPT
11. The principal avenue for fiscal policy to influence growth comes from adopting a longer-term perspective. The range of options that are available with regard to tax and expenditure policies is necessarily restricted in the short to medium term. A longer time horizon, however, provides both a better way to consider inter-temporal trade-offs and offers increased scope to shift expenditure and tax policies in ways that might be significantly more growth promoting. The challenge is that policy makers typically have limited information and analysis to support decisions involving inter-temporal trade-offs. This is an area where further work is needed, but where growth scenario analysis may provide some basis for improving fiscal decisions. 12. The microeconomic perspective is a complementary view that is relevant for public expenditure decisions but needs to be consistent with overall macroeconomic judgments. The example of a project that would provide a financial return higher than its financial cost but is rejected by a deficit criterion is often cited to illustrate a possible inconsistency between macroeconomic fiscal rules and microeconomic criteria.TPF
8FPT If both
approaches were derived from a fully consistent general equilibrium framework, the possibility of inconsistency would not arise. In reality, given the lack of such a framework, a conflict is in principle possible. Faced with the possible exclusion of a high fiscal value project because of a rule, the first step would be to check that the existing planned expenditures also satisfied the macroeconomic criteria. If not, a switch in composition would make it possible to add the project without breaching the macroeconomic criteria. If this possibility has been excluded, and unless the project is very large relative to the economy, an additional project of this type could be accommodated by raising the deficit target, provided the returns are robustly estimated, have little uncertainty, and allow government to recoup its investment over time.TPF
9FPT
TP
7PT A recent review by the IMF’s Independent Evaluation Office (IEO) points to the need for Fund programs
to take account of sectoral constraints and opportunities that may be identified in Bank analysis and which may suggest ways to shape fiscal programs. See IEO (2007). TP
8PT See Easterly and Serven (2003).
TP
9PT This is intentionally a tall hurdle that should be used to ensure that projected rates of return are realistic,
factoring in past performance and credibility of the implementing agency.

5
13. The financing of public goods and merit goods is another aspect of the debate. How should microeconomic criteria be applied to projects where the financial return may not cover costs but where significant indirect, non-financial benefits are expected, as with many public goods and externality generating activities? Annex 1 provides a technical discussion of the criteria that would apply to public expenditures that may generate financial benefits for the private sector or non-financial benefits for citizens at large. It is clear that to be economically viable and sustainable, such projects will have to be financed in full or in part by general tax revenue and therefore the decision criteria must include consideration of the marginal cost of taxation. Even for projects with a high development payback, decisions must be based on sound cost benefit analysis in order to be consistent with the government’s inter-temporal budget constraint. 14. Macroeconomic and microeconomic policy decisions are assisted and sustained by institutions that will create the necessary information and incentives. Effective budgetary institutions (including rules and procedures that limit discretion) and management and staff incentives in public sector agencies are critical to ensuring that fiscal policy and public expenditure have a positive effect on long term growth and development performance. It is also clear that the quality of institutions contributes to the government’s fiscal reputation – a bad reputation (past deficits, debt defaults, high inflation, or public sector corruption and waste) reflects weak institutions and limits the government’s room to maneuver by limiting access to credit or aid and through reducing tax compliance. 15. Fiscal institutions must be capable of managing the specific challenges that confront a particular country. In general, fiscal institutions should be able to adopt a longer term perspective, looking beyond the typical annual budget. Uncertainty with regard to revenue, including aid predictability, is a problem in many countries. Commodity price shocks can pose particular challenges for countries that rely on commodity revenue to finance the government budget. In general, policy advice is to save the windfall in good times in order to ride out the downturns. The same advice holds for governments during a business cycle, with automatic stabilizers used to provide some countercyclical thrust. However, when fiscal discipline is weak, countries display pro-cyclical behavior, ratcheting up expenditure or cutting taxes during good times when revenue is high. This tends to increase the debt level over successive business cycles, ultimately leaving little room for deficit financing during a downturn. Countries with high debt levels face problems of access to market financing precisely when countercyclical borrowing would be required. 16. Fiscal rules or fiscal responsibility laws work when the underlying institutions and political commitment are supportive.TP
F
10FPT The underlying cause of pro-
TP
10PT Rules are often bent or broken and offer no guarantee. See IMF (2005) for a discussion of various forms
of such rules and conditions under which they improve fiscal outcomes. Other rules are discussed in Easterly, et. al. (2006). Some countries have adopted fiscal rules to protect public investment from limits imposed by the fiscal deficit. The U.K. adopted the “golden rule” which allows the government to borrow for public investment, subject to a limit on the debt stock.

6
cyclicality is often a problem of fiscal discipline such that governments have little scope to maneuver to offset cyclical downturns. The main purpose of a fiscal rule is to signal that a government intends to restrict its scope for discretionary action in the fiscal sphere. For this to be credible, governments must adhere to good practice with regard to comprehensiveness and transparency in the reporting of fiscal accounts so that violations of the rule can be observed, providing a measure of self-restraint.TPF
11FPT
17. International experience suggests that institutional strengthening efforts should focus on four key areas: (i) ensuring credible control over the level of the fiscal deficit, including measures to limit pro-cyclical discretionary policy; (ii) encouraging transparency and contestability in policy to establish and enforce decisions on strategic priorities for public spending; (iii) establishing a well-functioning system for public investment selection and implementation; and (iv) enhancing efficiency of public spending through resource management procedures that enforce accountability for results at all levels of government. These are difficult reforms that require sustained effort over a period of years but where pragmatic initiatives can yield high dividends. III. Evidence on Public Spending and Growth 18. Economic theory supports the idea that public spending and taxation are important channels of transmission between fiscal policy and growth. In the 1990s developments in the theory of growth recognized that there might be a larger role for public expenditure in determining an economy’s growth rate.TPF
12FPT Theory recognized that
(a) some public expenditures affect the productivity of the private sector, other ‘unproductive’ expenditures only raise citizens’ welfare or are a waste and do neither; (b) public provision of capital affects private production; and (c) it was already well known that some taxes distort investment decisions. This suggested that changes in expenditure composition, tax design and deficit financing might alter the economy’s growth path. 19. Recent empirical studies have identified which public expenditures tend to be “productive” in the sense of being growth-enhancing. In general, empirical studies are limited by the availability and quality of data for developing countries, including sub-national data. Nevertheless, a review of a large number of cross-country studies, which are discussed in Annex 2, find that capital expenditure, as well as spending on education, health, transport and communication can be favorable to growth. The extent to which these expenditures contribute to growth in any country depend on country-specific factors, including the efficiency of resource use and the quality of governance. The effects may be large when their cumulative effect over time is taken into account. Although the evidence on causality is not conclusive, they do seem to run from
TP
11PT With regard to the problem of pro-cyclicality, a number of countries refer to the cyclically adjusted
balance (CAB) in setting their fiscal targets. Chile uses a sophisticated variation of the CAB that incorporates the effect of copper prices to ensure a countercyclical capability. TP
12PT See Barro (1990), Barro and Sala-i-Martin (1992), Futagami et al. (1993), and Devarajan et al. (1996).
Futagami et al. (1993) use the same model as Barro (1990), but assume that public services are derived from the stock of public capital instead of the flow of public expenditure. For a survey of recent endogenous growth models in which fiscal policy continues to have long-run effects See Gemmell (2007)

7
expenditure to growth and not the other way about.TPF
13FPT Put differently, sustained effort to
build both physical and human capital is necessary for higher growth. TPF
14FPT
20. Another source of evidence is the experience of high growth countries. A background studyTPF
15FPT of six high growth countries provides the following findings: (a)
except for brief periods, high levels of deficit financing does not appear to have been a major feature of fiscal policy; (b) there is some evidence of convergence in the level of expenditure, with countries with high initial expenditure tending to reduce it and those with low expenditure tending to increase; (c) while capital expenditure shares differ across the countries, they tend to be relatively stable suggesting that fiscal policy protected growth related expenditure categories; and (d) most of the countries reduced the share of public administration in total expenditure. IV. A Growth-Oriented Approach to Fiscal Policy 21. The conventional approach to fiscal policy design has limitations. It starts with an assessment of revenue prospects, factors in any grant aid flows that may be anticipated and adds in an assessment of the deficit that could be financed through prudent borrowing and non-inflationary monetary financing of the deficit. Revenue forecasts in particular are subject to a judgment on the rate of growth of the tax base which in turn depends on the rate of growth of the economy and on improvements in tax administration. Aid flows may be subject to conditionality or to unpredictable parliamentary processes in donor countries. In any case, the level of expenditure is determined as a residual in this process. 22. There are a number of reasons why this might be an inadequate way to ensure a growth supportive fiscal policy. First, quite often medium term prospects for aid or revenue may be defined too conservatively or too optimistically and both can have adverse consequences for fiscal policy design.TPF
16FPT Second, and more importantly, there is
inadequate focus on the link between the judgments on fiscal policy and the underlying constraints to higher growth in the economy. Third, issues about the quality of fiscal policy and essential questions about the role of public expenditure levels, composition and efficiency which are critical for long term growth are not adequately factored into fiscal policy design. 23. Figure 1 suggests a more explicit growth-oriented approach to fiscal policy design. A schematic description of this approach is provided which indicates the central role of political choices and institutional capacity in influencing key aspects of fiscal policy. Starting with the policy goal for growth, and following the counter-clockwise arrows, this approach would first look to identify the constraints to higher growth, and TP
13PT See annex 2 and Gemmell (2007) for details.
TP
14PT The role of public spending is important but, as noted in annex 3, private expenditure can often comprise
a significant share of investment in human capital. TP
15PT The countries are Botswana, Chile, Ireland, Korea, Malaysia and Thailand. .See annex 3 and Biletska and
Rajaram (2007). TP
16PT See Heller et. al. (2006) for a discussion of the constraint due to conventional IMF approach to
programming grant aid in the medium term fiscal framework.

8
ask whether fiscal considerations (public expenditure and taxation) could be used to address the constraints to those goals. In some cases the appropriate intervention may be regulatory reform that enables private initiative to address the constraint. 24. Identifying the constraints to higher growth is the first step. Policy makers and their advisors have to pragmatically determine whether private investment and growth is being constrained by public sector outputs (e.g., transport bottlenecks, erratic power supply, or a high tax burden) that may be addressed by fiscal policy. The constraints and the remedies are likely to be highly country and context-specific. Empirical evidence, investment climate surveys and the exercise of good judgment will be useful in making a pragmatic determination on the constraints. As with all policy making, an evidence based “error-correction mechanism” would be an asset to improving policy decisions over time.
Figure 1: Growth-Oriented Fiscal Policy Schematic
25. A diagnostic approach would help guide fiscal decisions. As indicated by the counter-clockwise green arrows in the schematic, if it is determined that public expenditure is the appropriate policy instrument to address the public sector output constraint, then it would be necessary to go further to ask whether improved efficiency in existing public spending or shifts in the composition of expenditure would enable the constraints to be addressed. Fiscal measures of this kind would not impose any additional cost to the economy in the form of taxation or debt and would be the preferred way to address the constraint.
A Growth-Oriented Approach to Fiscal Policy
1Policy Goals:
Growth, Macro Stability, MDGs
4Resource
Mobilization(Revenue, Aid,
Borrowing)
2Public Sector
Outputs(goods, services,
investment)
3Level,
Composition & Efficiency of Expenditure
Politica
l
Choices/
Institutio
nal
Capac
ity
Private-PublicNexus

9
26. It may be necessary to raise the level of expenditure to address the constraint under some circumstances. If efficiency or compositional shifts are insufficient or only achievable over time, a government may conclude that an increase in the level of expenditure is necessary to address the constraint to ensure macro-sustainability. Where a level shift is required, the implications for financing should be considered. As shown by the schematic, the financing options include revenue, aid and borrowing of which the least cost option should be preferred.
Box 1: Iteration between Goals and Resource Constraints
What is critical to achieving a sensible balance between the government’s goal regarding the rate of growth of GDP and its constraints is a process of iteration. If the goals appear over-ambitious given assumptions about available resources, then either more resources must be found, or the goals must be trimmed. The converse is also true. One possibility, subject to respecting the inter-temporal budget constraint, may be to borrow resources from the future. Another may be to raise more resources from taxation or aid. If the pay-off to these resources is very high at the margin, it makes sense to look for ways of enhancing them; on the other hand, if the pay-off is very low, it makes no sense to mobilize them at the originally projected volume. Hence goals become endogenous to the iterative process. It is equally true that it does not make sense to stipulate what the available resources are without considering how they may be deployed. 27. The costs of financing added expenditure must be compared to the benefits from the goals. It is conceivable that the costs of raising resources in some situations may exceed the benefits (for example, macroeconomic implications in terms of inflation, interest rates, exchange rates), in which case addressing the constraint by increasing expenditure is not a desirable policy option. In such a situation, the government may have to consider adjusting its policy goals which may have to be scaled down appropriately. This process of iteration is indicated in part by the clockwise arrows. 28. Economic modeling can help define potential growth scenarios that relate to alternative fiscal strategies. An empirical assessment of the growth impact of improvements in expenditure efficiency, shifts in the composition, or higher levels of spending would benefit from appropriate methods, including but not limited to economic modeling. While this is a challenging area that requires further work and where data availability is a major constraint, it is clear that greater knowledge on this key linkage would enable fiscal policy design to adopt a more appropriate stance in situations where expenditure would need to be scaled up (see Box 2). 29. The goal is to find a reliable way of ensuring that fiscal policy is well-designed both to maintain stability and to promote growth. In the past fiscal policy has often started from a relatively conservative view of available resources and allowed this view to constrain goals and aspirations, sometimes excessively. More recently, some countries have used MTEFs to improve fiscal policy formation by defining realistic medium term resource prospects, while strengthening the link between policy objectives and budget allocations. Countries with better budgetary processes also show promise of improving fiscal policy design by linking PRS-derived budget allocations to growth and the MDGs.

10
Box 2: Modeling Public Expenditure and Growth
The approach suggested in this paper emphasizes the need to identify fiscal constraints to growth in order to identify the appropriate areas to enhance public expenditure. But it will need to be supplemented with analysis of the likely growth impact of such expenditure and the knock-on effects on the economy. This is best done through formal economic modeling. Computable general equilibrium models which use a consistent economy-wide set of accounts and incorporate economic behavior provide one way to undertake such modeling. The Bank often uses the 1-2-3 model which is an aggregate CGE model that allows for economic behavior. More recently, the Bank has developed MAMS (Maquette for MDG Simulations), a model that is intended to help policy makers consider the implications of alternative financing and expenditure strategies on macroeconomic variables, including growth. MAMS integrates a detailed portrayal of public expenditure on health, education and infrastructure and the resulting human development outcomes within a consistent economy-wide framework that considers key policy handles and feedback linkages. It provides a conceptual framework for evaluating efforts to improve human and social indicators in low- and middle-income countries. MAMS also has an explicit focus on the inter-temporal nature of the growth and MDG challenge and allows policy makers to confront difficult choices of sequencing and allocating public spending within an explicit time horizon. MAMS has a flexible framework that allows for different degrees of dis-aggregation depending on data availability and policy context. It has been applied to Ethiopia and Uganda. Applications are under way in some 25 countries in Latin America and sub-Saharan Africa, including Kenya and Madagascar, which are part of the fiscal policy study. Such modeling will need to be supplemented with a parallel effort to improve data and deepen sector level analysis to help identify reasonable parameters. Also, other complementary approaches to assessing fiscal-growth linkages should be encouraged, including efforts to assess the impact of public expenditure on private investment Source: Bourguignon, Francois, Carolina Diaz-Bonilla, and Hans Lofgren. 2006. “Aid, service delivery and the MDGs in an economy-wide framework.” Draft. December 20. V. Country Case StudiesTPF
17FPT
30. Twelve countries with different fiscal/development profiles were selected for the case studies to help inform how fiscal policy could catalyze higher growth. The twelve countries’ per capita incomes range from $230 (Rwanda) to $4710 (Turkey) and include six low income countries, five lower-middle income countries and one upper-middle income country. Six of the countries have some degree of access to grant aid, in terms of their primary source of external financing, and the remaining six generally do not, relying instead on market-based borrowing to supplement domestic revenue. Accordingly, we classify the countries as Aid Access countries (AAC) or Market Access countries (MAC).TPF
18FPT
TP
17PT This section draws on ongoing case studies. As such it highlights findings that are relatively
unambiguous and useful for considering the implications for a long term growth-oriented fiscal strategy. The final country case studies will include more detailed discussion of sectoral issues as well as trade-offs in determining the composition of expenditure. TP
18PT The distinction is clearly not airtight but we find this classification useful in distinguishing the fiscal
characteristics of the countries for the purpose of this study. Kenya is classified as low aid access in the aggregate but specific sectors may be quite aid dependent. It should also be noted that countries may move

11
Hi-AAC
• UGA
• RWA
• MDG Low-AAC
• CMR
• KEN
• TJK Hi-MAC
• BRA
• TUR
• UKR Low-MAC
• IND
• PHL
• MOR
Revenue and Expenditure(% GDP)
BRATUR
UKR
M OR
IND
PHL KEN
CM R
TJK
RWA
UGA
M DG
0
5
10
15
20
25
30
35
40
45
50
0 5 10 15 20 25 30 35 40 45 50Revenue
Expe
nditu
re
Figure 2: Expenditure, Revenue and Deficit Levels 31. Countries vary in their fiscal characteristics but some natural “clusters” can be observed across the 12 countries (see fig.2). Brazil, Turkey and Ukraine cluster towards the high end of the scale with high revenue shares of GDP and are classified as Hi-MAC for the purpose of the study. At the other end, Rwanda, Uganda, and Madagascar raise only 10-14 percent of revenue but spend 20-28 percent of GDP. Their large fiscal deficits are financed by high aid inflows of 10-14 percent of GDP and these countries are classified as Hi-AAC. The other six countries have revenue and expenditure shares in the 15-30 percent range. We classify Cameroon, Kenya and Tajikistan as low-AAC with grant aid below 1.5 percent of GDP, while India, Morocco and Philippines are classified as low-MAC, reflecting the lower levels of revenue and expenditure relative to the Hi-MACs. 32. Borrowing capacity differs across the countries. Among the 12 countries, the stock of debt as a share of GDP is relatively high (greater than 70 percent) in five of the six MAC countries (Ukraine being the exception), while five of the AACs display relatively low ratios because of debt relief, including the MDRI (see Annex table 1). In the Hi-MAC group, both Turkey and Brazil have relatively high debt levels and a past history that suggests that markets may be “debt intolerant.” This forces such governments to run large primary surpluses, constraining fiscal policy. Ukraine has a relatively low debt to GDP ratio and therefore more room to maneuver, but has to take account of significant contingent liabilities. India, Philippines and Morocco all have relatively high debt levels which limits further borrowing, but do not appear to face the
from one category to another as a result of policy decisions. For example, Ireland moved from being a Hi-MAC to Lo-MAC by undertaking a significant rationalization that reduced expenditure from above 50 percent of GDP to about 30 percent in the late 1980s, while improving growth outcomes.

12
problem of debt intolerance. Cameroon, Uganda, Rwanda and Madagascar have benefited from debt relief in the form of HIPC and MDRI which potentially gives them room to borrow subject to their debt sustainability assessments. Tajikistan has received MDRI on IMF debt which has also lowered its debt ratio to below 50 percent. Kenya has a debt ratio of about 54 percent. For countries that have received debt relief, there is in principle more room to borrow, but this “fiscal space” has to be used sparingly, consistent with debt sustainability analysis, to finance productive expenditure. 33. The “fiscal diamond” presents a broad public finance perspective and enables a heuristic description of the financing options for each of the four subgroups. The diamond illustrates the scope for a government to: (a) generate fiscal savings from improved allocative and technical efficiency of existing spending, and (b) to raise additional fiscal resources through new revenue measures, additional aid or new borrowing. To the extent that a country already raises a significant amount in revenue, has a high initial stock of debt, or receives high aid inflows, the scope to raise additional revenue from any of those avenues would be small. Conversely, the lower the allocative and technical efficiency of the existing budget, and the larger the volume of such spending, the greater would be the scope for efficiency gain as a source of fiscal space. TPF
19FPT
The scope for additional aid or borrowing could in principle be estimated with reference to donor commitments or debt sustainability analysis. Although technically challenging, the costs of raising more revenue from different tax instruments can also be assessed. The scope for expenditure efficiency improvements requires a more painstaking assessment. A detailed program-by-program evaluation could yield a specific estimate of the amount of resources that would be available from improvements that both improve the composition (i.e. improve allocative efficiency) and improve cost efficiency.TPF
20FPT By
comparison, the case studies attempt a more selective and indicative assessment of expenditure efficiency.TPF
21FPT
34. Figure 3 illustrates the most likely ways to finance a growth-oriented fiscal policy in each group of countries.TPF
22FPT Although the Hi-AAC currently receive relatively
high shares of GDP in grant aid, given their large development needs, there are indications of a further scale up of aid. Aid could be supplemented with more revenue effort as well as improved efficiency of expenditure, while deficit financing will need to be limited, given recent debt relief (see fig. 3(a)). The low-AACs (fig. 3(b)) reflect lower prospects on the revenue dimension relative to Hi-AACs, but there is scope for fiscal savings from efficiency gains due to allocative and technical improvements. While aid
TP
19PT The fiscal diamond represents the supply side of fiscal policy. By placing all four sources of fiscal
resources in one graphic it allows a more useful discussion of the possibilities for fiscal policy, avoiding the narrow focus on justification for higher deficits. It should be clear that the figures are simplified representations of countries that differ in many important respects, even within a particular classification. TP
20PT In fact, governments often make an effort to identify such savings. In 2005, the Canadian government
undertook an Expenditure Review which identified $11 billion in new savings over 5 years from improved efficiency. The Gershon report in the U.K. similarly identified GBP 20 billion in efficiency improvements in 2004. TP
21PT For a discussion of the limitations imposed by data on estimating efficiency using parametric and non-
parametric methods, see Estache et. al. (2006). TP
22PT Heuristic judgments of this kind must be corroborated with more detailed country specific analysis.

13
flows are currently low, institutional and governance reforms could increase aid access over the medium term. Given the high initial levels of revenue as well as debt in Hi-MACs such as Brazil and Turkey, any enhanced growth-orientation to fiscal policy is unlikely to be based on raising further revenue or borrowing. It is instead likely to rest on improvements in the composition and efficiency of expenditure (see fig. 3(c)). By contrast, for some of the Low-MAC (fig. 3(d)), the fiscal options include both revenue enhancement and improvements in expenditure efficiency.
3 (a) Hi-AAC 3 (b) Low-AAC
Uganda, Rwanda & Madagascar
Aid
Borrow ing
Revenue Expenditure Efficiency
Cameroon, Kenya & Tajikistan
Expenditure Eff iciency Revenue
Borrow ing
Aid
3 (c) Hi-MAC 3 (d) Low-MAC
Brazil, Turkey & Ukraine
Aid
Borrow ing
Revenue Expenditure Eff iciency
India, Philippines & Morocco
Expenditure Eff iciency Revenue
Borrow ing
Aid
Figure 3: Navigating in Fiscal Space
35. The simplified fiscal diamond graphics are useful, but do not alleviate the need for more detailed analysis. Countries differ also in terms of their demand side, represented by their policy objectives, constraints, demographic characteristics, and
14
demand for public services.TPF
23FPT In some countries, such as Brazil and India, issues of fiscal
federalism are central to any discussion of fiscal policy, with sub-national entities having specific functions. And countries may also differ in terms of their macroeconomic status – some countries may still be undertaking stabilization while others may have achieved it and seek to sustain macro-stability. Thus, while the fiscal diamond provides a simple visual way to distinguish the fiscal options for various country cases, specific design will need to take account of the nature of the constraints to growth and welfare in the individual country case discussions below.
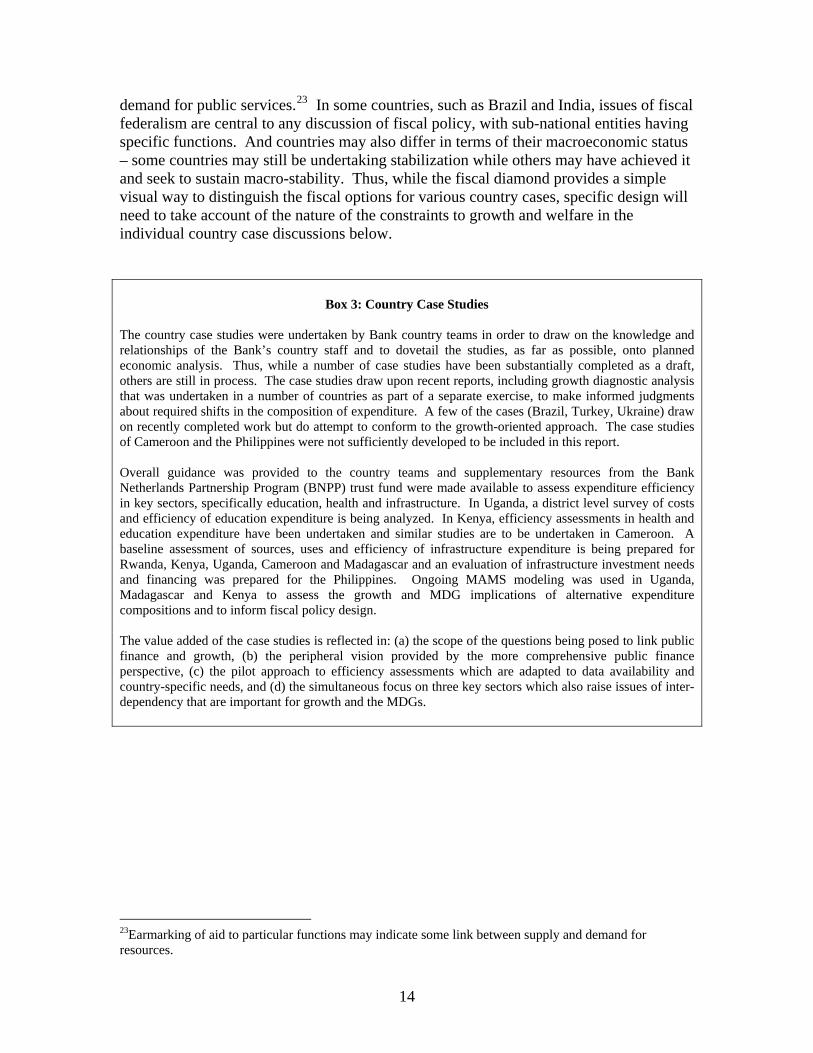
Box 3: Country Case Studies
The country case studies were undertaken by Bank country teams in order to draw on the knowledge and relationships of the Bank’s country staff and to dovetail the studies, as far as possible, onto planned economic analysis. Thus, while a number of case studies have been substantially completed as a draft, others are still in process. The case studies draw upon recent reports, including growth diagnostic analysis that was undertaken in a number of countries as part of a separate exercise, to make informed judgments about required shifts in the composition of expenditure. A few of the cases (Brazil, Turkey, Ukraine) draw on recently completed work but do attempt to conform to the growth-oriented approach. The case studies of Cameroon and the Philippines were not sufficiently developed to be included in this report. Overall guidance was provided to the country teams and supplementary resources from the Bank Netherlands Partnership Program (BNPP) trust fund were made available to assess expenditure efficiency in key sectors, specifically education, health and infrastructure. In Uganda, a district level survey of costs and efficiency of education expenditure is being analyzed. In Kenya, efficiency assessments in health and education expenditure have been undertaken and similar studies are to be undertaken in Cameroon. A baseline assessment of sources, uses and efficiency of infrastructure expenditure is being prepared for Rwanda, Kenya, Uganda, Cameroon and Madagascar and an evaluation of infrastructure investment needs and financing was prepared for the Philippines. Ongoing MAMS modeling was used in Uganda, Madagascar and Kenya to assess the growth and MDG implications of alternative expenditure compositions and to inform fiscal policy design. The value added of the case studies is reflected in: (a) the scope of the questions being posed to link public finance and growth, (b) the peripheral vision provided by the more comprehensive public finance perspective, (c) the pilot approach to efficiency assessments which are adapted to data availability and country-specific needs, and (d) the simultaneous focus on three key sectors which also raise issues of inter-dependency that are important for growth and the MDGs.
TP
23PTEarmarking of aid to particular functions may indicate some link between supply and demand for
resources.

15
HI-AAC SECTIONAL SUMMARY
36. Uganda, Rwanda, and Madagascar have all achieved and sustained macroeconomic stability but growth in per capita GDP is inadequate to achieve the MDGs.TP
F
24FPT Average inflation has been held around or below 10 percent in all three
countries and there are no pressing macro-stability concerns. While GDP growth in all three countries has averaged about 5 percent per annum in recent years, it is estimated that a rate of 7 percent p.a. is needed to reach MDG-1, halving the number of poor. Uganda Highlights 37. Poorly maintained road network and power supply shortages are key constraints to Uganda’s growth. Given Uganda’s landlocked situation, high transport costs are a hurdle for growth. Infrastructure (roads and power) development in Uganda is believed to be critical to stimulating a higher rate of sustained export-led growth. TPF
25FPT
Another constraint that will need to be addressed over time is a shortage of technical skills of the domestic labor force. Institutional arrangements are also a constraint to effective infrastructure investment. 38. The composition and efficiency of expenditure could be improved. Uganda has received on average 10 percent of GDP in aid over the past decade, and aid-earmarking and moral hazard issues may have influenced the quality of spending. It is appropriate to review the efficiency and composition of spending before considering the need for an increase in the level of expenditure. While further analysis is needed, a number of inefficiencies can be identified. Administration expenses and defense consume almost 48 percent of the budget and divert resources away from productive expenditure. Insufficient maintenance expenditures result in a poor maintenance for the trunk and urban roads; losses in electricity and unaccounted water are in the range of 35-45 percent. 39. A survey of education costs and outputs undertaken as part of the study has stimulated policy discussion on value for money. Preliminary results suggest that leakages in government recurrent expenditure on primary education, which include “ghost workers”, excessive administrative overheads, teacher absenteeism and other waste, are substantial. Inefficiencies in teacher deployment are suggested by data on pupil teacher ratios in different grades. Overall, the case study has highlighted the inefficiencies in expenditure within high priority sectors. 40. The case study also highlighted the importance of revenue policy for growth. Work on revenue buoyancy and tax expenditures revealed issues that were previously
TP
24PT The three Hi-AAC countries have comparable per capita income – US$230, 280 and 290, respectively,
for Rwanda, Uganda and Madagascar. TP
25PT Over 2001-1005, Uganda managed to attract more private sector financing to telecom and energy sectors
than other SSA countries. However, private sector participation in infrastructure is still a relatively low 14 percent of total infrastructure spending.

16
overlooked. In Uganda, new VAT and customs tax incentives for hotel construction coupled with generous income tax allowances for investment contrast with high customs duty and VAT on transport equipment, to bias new investment in favor of property rather than transport equipment. Consequently Kampala is enjoying a property boom. Yet income growth for most people in Uganda’s highly rural economy would benefit more from lower transport costs, which could be achieved by lowering taxes on trucks and fuel, and building better roads. 41. Model based simulations can help inform governments of the nature of trade-offs in making fiscal policy decisions. In order to consider the potential growth and MDG impact of alternative fiscal strategies, including the composition of expenditure and financing, simulations with the MAMS were undertaken. The simulations take account of the interdependence between infrastructure and human development and the trade-offs in terms of growth and the MDGs due to changes in the composition of a given level of spending or in varying the level of aid or direct taxation. The baseline scenario assumes a gradual increase in revenue collection from 11 to 18 percent by 2020 and most other variables growing at the same rate as GDP. Cutting unproductive government services and reallocating savings from improved efficiency to high priority areas such as infrastructure, education, health and water, has the most positive impact on raising the growth rate (by an estimated 0.4-0.5 percent p.a.) and improves a broad range of MDG indicators. Similar results occur if aid levels are scaled up and allocated to growth and MDG oriented functions. If expenditure is reallocated within the productive categories, from infrastructure to education and health, the growth rate decreases (by 0.2 percent p.a.), while the individual MDG outcomes are differentially affected. Increasing expenditure by raising tax revenues, however, results in a decline (by 0.3-0.4 percent p.a.) in rates of private investment growth and little change in GDP growth relative to the baseline scenario, indicating the effects of taxation crowding out private consumption and investment. 42. The analysis provides some important though tentative conclusions for a growth oriented fiscal policy for Uganda. It suggests that attention be given to improving overall efficiency as well as shifting the composition of expenditure away from general administration to infrastructure and human development. As noted, intra-sector efficiencies are also important and require attention for growth related outcomes. With regard to any increase in the level of expenditure, it also emphasizes the value of continuing to make effective use of aid inflows, while persisting with gradual efforts to raise revenue collections from a broad based tax system. The government has indicated its desire to reduce reliance on aid even as its development needs remain large. An announced intention to raise revenue mobilization from 12 to 16 percent of GDP may be consistent with the intention to reduce aid dependence and in principle is the correct direction for fiscal policy. However, the appropriate phasing and design will require careful consideration. Revenue enhancement must not reduce the incentives for private sector investment.

17
Rwanda Highlights 43. Rwanda’s Vision 2020 of trebling per capita income requires sustained growth rates of 6-7 percent per annum over the long term. To achieve this Rwanda needs to transform its agriculture and diversify its economy with manufacturing and services. Major constraints to growth include poor infrastructure (transport, energy and water), lack of skilled labor, and low productivity. As a landlocked country, Rwanda’s transport costs depend on the quality of its own roads as well as those of its neighbors. It has an unusually dense road network which is poorly maintained both because of limited funding and maintenance costs that are twice as high as in other countries because of the terrain and climatic conditions. Energy supply and costs are also problematic since electricity coverage nationally is only 6 percent, and power outages are common. 44. Rwanda requires substantial levels of public spending to address these constraints and to leverage private investment. Significant investments are necessary in hydro-power generation (including for regional exports) as well as in methane gas-fuelled generation. Rwanda also faces large commitments to its health and education goals. With 49 percent of its population below the age of 15, the importance of educational services is self-evident. High child and maternal mortality rates necessitate high priority in public policy and budget allocation which are also needed to reduce the current HIV/AIDS prevalence rate of 3 percent of the population. 45. There is some scope for improving expenditure composition and efficiency to improve program outcomes and growth impact. By prioritizing public interventions and addressing expenditure composition and efficiency issues, Rwanda can improve the growth and MDG impact of public spending. Currently, spending on infrastructure and agriculture are very low. Education expenditure receives the largest share of the budget, but nearly a third of the recurrent budget is spent on higher education. Further improvements in outcomes could be achieved through a reduction in subsidies to higher education, accompanied by increased allocations toward teaching materials, teacher training and school construction, particularly at the primary level. In health, only a small fraction of donor aid enters the government budget; the rest is managed directly by donors and channeled through NGOs, mainly to single issue vertical programs. Meanwhile, key government-run health programs such as malaria control, maternal mortality, and management of childhood diseases are badly under-funded. Encouragingly, several initiatives have been started to strengthen public resource management, improve expenditure programming, budgeting, procurement, and expenditure management and monitoring processes. Rwanda has also initiated efforts to improve efficiency through tracking surveys and community based interventions. These efforts, however, will take time and potential savings from them are not large relative to needs. 46. Achieving the growth goals in Rwanda will therefore require significant scaling up of aid. Rwanda has raised revenue collection substantially over the past few years, but given the narrow tax base, there are limits on further revenue enhancements. Although debt levels have been reduced by HIPC and MDRI, new borrowing should also
18
be limited and undertaken only on highly concessional terms. So the main prospect for financing increases in spending to address growth needs is higher aid flows. For such aid to be effective, however, it will need to be aligned more closely with government programs that support Rwanda’s needs. Moreover, given structural constraints to broadening the tax base, such aid flows may have to be sustained for a much longer period than currently envisaged. Madagascar Highlights 47. The country’s development strategy, the Madagascar Action Plan (MAP) 2007-12, calls for high growth rates accelerating from current levels to between 7 and 10 percent. These ambitious growth rates are predicated on higher investment levels financed by higher levels of external assistance and domestic revenue mobilization. Annual growth rates in Madagascar have averaged 5 percent after the post-crisis rebound of 2003. Growth in Madagascar is constrained by the quality of public infrastructure as well as an under-developed financial sector and low skill levels. When it became independent, Madagascar had 50,000 kilometers of roads, but this has deteriorated to 31,612 kilometers of national road network, of which only 4,074 kilometers are paved and 5,855 kilometers are in good or fair condition. The main port, which handles almost three-quarters of the traffic, is among the most inefficient in the Indian Ocean, handling about 6.3 containers per hour. Limited energy coverage (15% of households) and high tariffs present another constraint to future growth. 48. There is scope for improving revenue generation in Madagascar from its current low levels. The share of tax revenues in GDP is estimated at 10. percent in 2006. Consistent revenue shortfalls over the last two years led to mid-year expenditure cuts which hampered execution of the government’s program. Volatility in aid flows further exacerbated budget execution with the government borrowing on the domestic market crowding out the private sector. While there are limits to increasing revenue mobilization in a primarily agricultural economy, it is estimated that the tax mobilization is below its potential by at least 3 percent of GDP. One of the main priorities of the MAP in 2007 is to undertake major tax reform, rationalizing tax policy and procedures, modernizing tax and customs administration, and improving human resource capabilities with the overall objectives of revenue generation, improved service quality and establishing a favorable climate for investment. 49. There are positive trends and some further potential for improving the composition and efficiency of expenditure to improve the growth and poverty reduction impact. Overall, the budget is aligned to the priorities of the government with roads and primary education jointly receiving 34 percent of the non-interest budgetTPF
26FPT and
with both the health and education sectors prioritizing primary level services. The share of administration in overall expenditures has also continued to decline. However, the balance between investment and recurrent spending could be further improved to enhance operations and maintenance spending. Second, more resources could be provided to TP
26PT This is the average for 2004-2006 allocated to education and transport using a functional classification of
the budget.

19
communes which only control 3-4 percent of resources. Third, allocation to poorer districts could be improved since they receive fewer resources and have fewer qualified personnel than would be justified by their poverty rates. 50. Achieving the MDG/MAP goals will also require higher aid. Preliminary results applying the MAMS model and taking account of cross-sectoral synergies suggests that while Madagascar may not attain the health or water and sanitation goals, it comes close to achieving universal primary education if the spending on education is sustained. Child and maternal mortality, in particular, may remain high, in part due to slow progress in improving sanitation. Scenario analysis indicates that the full attainment of each of the MDGs will require almost doubling of financing requirements over the baseline for both current and capital spending. The financing growth requirements are higher for the health MDG (almost triple for current and quadruple for capital expenditure) but near baseline rates for education and infrastructure MDGs. The importance of synergies show up in the MDG scenario that targets all the MDGs simultaneously: the growth rates necessary for achieving multiple MDGs are lower than what the single-sector costing analysis dictates. But even in the full MDG scenario, per capita consumption does not grow by enough to achieve MDG-1, i.e. to reduce the 1990 poverty level in half by 2015. While further analysis is underway, overall, the results suggest that significantly higher aid inflows and revenue effort are needed for Madagascar to attain the MDGs.
LOW AAC SECTIONAL SUMMARY
51. Kenya and Tajikistan share some fiscal characteristics but differ in many respects, including their political and economic histories.TPF
27FPT Revenue effort is
relatively strong in both countries. Access to aid has often been limited because of concerns regarding governance. Donors have provided relatively low and volatile aid flows or have channeled aid outside the budget due to problems of public expenditure management. Kenya Highlights 52. Kenyan authorities are attempting to reverse the effects of many years of economic decline. Kenya experienced low GDP growth in the 1990s that saw per capita income decline to 1970 levels. The period was also marked by deterioration of public infrastructure and adverse trends in key indicators such as school enrollment rates, infant and maternal mortality, life expectancy, and incidence of infectious diseases and HIV/AIDS. Since the political transition to a new government in 2003, growth performance has improved and real interest rates have declined, reflecting perceptions of reduced political risk and uncertainty. TP
27PT Per capita income in the Low-AAC countries ranges from $330 (Tajikistan), $530 (Kenya) to $1010
(Cameroon).
20
53. Accelerating growth in income and employment is central to the government’s Vision 2030 strategy which targets 10 percent annual GDP growth over 2007-2030. Growth diagnostic analysis suggests that constraints to growth in Kenya are linked to quality and cost of infrastructure, with business costs affected by high cost of internal transport and unreliable electricity and communications. TPF
28FPT While the
road network is adequate, only 12 percent is paved and the main highways are in poor condition. 54. Infrastructure spending in Kenya is moderate but its efficiency is low. A baseline estimate indicates that total infrastructure spending in Kenya is about 5 percent of GDP, the bulk of which is public (including state enterprise) investment.TP
F
29FPT
Infrastructure spending has been compressed by fiscal adjustment and the decline of external budget support. However, there are substantial inefficiencies within the sector which, if reduced, would provide part of the necessary fiscal space to improve the stock of infrastructure. Transmission, distribution, and collection losses are significant and administrative expenses are high in the state electricity enterprise and drain resources that could be available for reinvestment. The current level of resources available from the Kenya Roads Board is adequate for routine maintenance but would not address the rehabilitation and backlog of maintenance. Road maintenance could be improved if more “economic” criteria were used for allocation of existing maintenance funds for different parts of the road network, shifting funding to the main highways and to segments that impact leading economic sectors such as tourism and horticulture. And the quality of budget execution and project management could be significantly improved to ensure that investment spending is efficiently translated into productive infrastructure assets.TPF
30FPT
55. Expenditure on education is high, but could be more efficiently deployed. Public spending on education in Kenya is 6.6 percent of GDP, more than half of which is allocated to the free primary education program initiated in 2003. This level of education spending is high relative to most countries and, given competing demands, improvement in educational outcomes will have to rely on achieving efficiency within the public sector and encouraging private provision and financing wherever possible. Unit costs in public primary, secondary, technical and university education are estimated to be about $90, $300, $360 and $2000 respectively. Measures to improve completion rates and reduce repetition rates will remain important at both primary and secondary levels, while improvement in staffing norms will help contain costs at the secondary level. University education has both the highest cost and gets the highest public subsidy with 92 percent of the $2000 cost being covered by the budget. In contrast, technical education costs a sixth of university education with 75 percent of the total cost borne by the participants. Given
TP
28PT Growth is also constrained by institutional/governance issues related to corruption, crime and protection
of property rights. TP
29PT At present the private sector provides only 1.4 percent of GDP in infrastructure spending. Greater
private participation would reduce the burden on the budget – a recent successful sale of shares in a power generation investment (KenGen) indicates the potential in key subsectors. The 2006 joint concession for the Kenya-Uganda railway is likely to improve options for transport between Mombasa and Kampala. In prospect are PPPs for a number of energy projects, the Nairobi UrbanToll Road and Mombasa Port. TP
30PT Kenya – A Pilot study on Infrastructure Public Expenditure Efficiency – draft, World Bank, 2007.

21
limited fiscal space, reducing the university subsidy and shifting expenditure to technical education would improve the growth orientation of the education budget. 56. Overall spending on health is reasonable at 5 percent of GDP; but it is inefficiently deployed. Although aid flows into the health sector have risen rapidly in recent years, much of it is channeled directly to donor-managed programs outside the budget, with the result that critical government programs remain significantly under-funded. Moreover, within government programs, resources are poorly allocated.TPF
31FPT A
large part of the budget is spent on wages and salaries; actual spending on drugs and medicines, equipment and maintenance has been far below allocations; with a wastage/leakage rate estimated at 30%. While it is desirable in principle to channel the increasing aid inflows through the budget, progress is likely to depend on improving the utilization and effectiveness of resources in the health sector. 57. Whether a level increase is necessary will require further analysis. There is a clear need to improve the composition and efficiency of expenditure in major sectors to increase the growth impact as well as release resources for reallocation. Given manageable debt levels, a modest increase in productive expenditure could be financed by some borrowing and raising revenue through tax base broadening. Kenya could also benefit from additional aid flows, but that will require sustained measures to address well publicized concerns about governance and accountability. Tajikistan Highlights 58. High economic growth is needed to address elevated poverty levels. Tajikistan has only partially recovered from a severe economic collapse after the break-up of the Soviet Union in 1991 and a civil war which fuelled hyperinflation and reduced 1996 GDP to a third of its 1990 level. The provision of basic social services, such as education and health care, has deteriorated dramatically. The incidence of poverty is estimated at 64 percent and a third of children suffer from chronic malnutrition. To eradicate mass poverty it will be necessary to maintain high rates of economic growth, with the benefits well distributed, and to rebuild basic public services. 59. Sustaining the growth recovery will require more private investment. A fiscal adjustment in the mid-1990s based on drastic cuts in expenditure reduced subsidies and wages, while subsequent tax administration reforms resulted in revenue growth that allowed a recovery in expenditure levels by 2000. Stabilization spurred economic growth, which has averaged 9 percent over the past few years. However, these rates are unlikely to be sustained over the long term without a strong rise in private investment and an improvement in labour productivity. 60. Non–fiscal factors (the quality of regulation and governance) may be the binding constraint to private investment. Private investment is constrained by a non-transparent, unpredictable and excessively regulated business climate. Surveys indicate TP
31PT For example, 66% of the sector budget in 2003 was allocated to curative care and urban hospitals, and
only 16% for rural health services and preventive care- both of which are high priorities.

22
that corruption is pervasive, with private firms having to bribe tax and customs inspectors, local authorities, and to get access to utilities. Under these conditions, it is unlikely that there will be a growth in private investment. Thus, the key constraint to growth in Tajikistan in the near to medium term is not fiscal but regulatory in nature. 61. Nevertheless, fiscal policies are needed to address complementary growth-supporting factors. A key role for government is to improve the quality and access to education and health services and the maintenance of existing public infrastructure. Spending on education receives about 22 percent of the budget. Maintenance of the road network is severely under-funded, as is health expenditure. Addressing the quasi-fiscal deficit due to electricity pricing policies would also strengthen the ability of the power sector to sustain its capacity. The need to address these issues creates a prima facie case for increasing the level of spending. However, the government also faces the challenge of improving the efficiency and effectiveness of its expenditure as well as the need to allocate more resources to priorities. 62. Having observed a period of borrowing restraint and having received debt relief, Tajikistan will need to continue to be prudent with new borrowing. Over 2004-06, Tajikistan received significant debt relief from bilateral donors and the IMF. In 2006, Tajikistan contracted large new loans totalling $604 million to finance infrastructure projects. New borrowing to finance infrastructure may be justifiable but should be subjected to a proper cost benefit analysis and debt sustainability evaluation. 63. Addressing the quality of regulation would facilitate private investment, raise the productivity of expenditure and improve access to aid flows. While it should be possible for the government to mobilize sufficient resources to increase primary expenditures by 5-6 percent of GDP per year over the next decade, the experience of the transition economies of Europe and Central Asia underlines the importance of the quality of governance to growth. Higher total government expenditure tends to depress economic growth in countries with poor governance, and even expenditures on what should be productive sectors such as education appear to have little impact on growth. If the country is to benefit from an expansion in the size of the budget to accommodate the priority expenditures of education, health and infrastructure maintenance, this must be accompanied by major improvements in expenditure efficiency and the quality of regulation.
HI-MAC - SECTIONAL SUMMARY
64. High expenditure levels characterize the Hi-MACs. Brazil, Turkey and Ukraine all reflect the pressures in middle income countries to increase welfare related expenditure on pensions, social assistance and related entitlements.TPF
32FPT These pressures do
two things – they raise the overall level of expenditure and they shift the composition of
TP
32PT Per capita income in the three countries ranges from $1520 (Ukraine), $3460 (Brazil), and $4710
(Turkey).

23
spending away from growth related expenditure. In the case of Ukraine, expenditures have grown rapidly from 35 percent of GDP in 2001 to 44 percent in 2006. In Turkey, wages, social security, and transfers and subsidies drove an increase in primary expenditure to 33 percent of GDP between 1995 and 1999. Subsequent fiscal adjustment restrained primary expenditure to 34 percent of GDP. In Brazil, general government expenditure increased from an already high 40 percent of GDP in 1995 to 43 percent of GDP in 2004. 65. Countries have raised revenue rather than cut expenditure to achieve fiscal balance. All three countries have relied principally on revenue increases supplemented by cuts in investment expenditure to generate the primary surpluses necessary to restore market confidence and sustain the debt. Both of these responses, raising revenue and cutting investment, however, undermine incentives for growth. In Ukraine, revenues have been sharply raised from 33 to 42 percent, in Turkey from 34 to 40 percent, and in Brazil tax revenues have been increased from about 28 percent in the 1990s to 38 percent. 66. But the underlying threat to fiscal balance is likely to re-emerge from further pressures to increase social security expenditure. In Turkey, despite favorable demographics, the pension/social security related deficit increased from 1.9 percent of GDP in 2000 to 4 percent of GDP in 2005, owing to low retirement ages, disincentives to remain in the formal labor force, and weak cost containment in health care. Although a major pension reform was proposed in 2006, it has yet to be enacted. In Ukraine, an aging population implies that demographic factors will continue to exert long term pressures to increase pensions and age-related spending. In Brazil, it is estimated that legally mandated social security and health related expenditure could raise total expenditure above 50 percent of GDP in the coming years unless appropriate reforms are implemented. Thus, managing long term expenditure pressures is a critical component of each country’s ability to maintain fiscal space for a growth-oriented fiscal policy. 67. Both the level and composition of expenditure undermine the scope for fiscal policy to support sustained high growth. The high level of expenditure translates into a higher tax burden, which discourages private investment. At the same time, an expenditure program that is heavily weighted towards public consumption and transfers has little positive impact on the long-term growth of the economy. Each of the countries thus faces the need to contain or reduce the level and improve the composition and efficiency of public expenditure to generate the necessary growth stimulus. Ukraine Highlights 68. Ukraine faces constraints to growth due to a high tax burden and poor expenditure composition. Bank analysis suggests the key constraints to long term growth in Ukraine relate to the disincentives created by the high burden of taxation and by the poor composition and efficiency of public expenditure. On the revenue side, reforms that gradually reduce the overall tax burden, particularly by reducing marginal payroll tax rates and increasing reliance on consumption taxes, would improve production and savings incentives and thus growth.

24
69. The share of expenditure that does not contribute to growth is high. The case study suggests that from an allocative perspective, too much is allocated to transfers, wages and subsidies. Social protection and social assistance constitutes the single largest functional expenditure with almost 20 percent of GDP in 2005. However, targeting of social assistance expenditure is weak. Subsidies to the energy enterprises have reduced incentives for investment and efficiency in energy use, and subsidies to the agriculture sector have hampered the sector’s productivity. 70. The composition and efficiency of productive expenditure could be improved. With the economy growing over the last seven years, capacity utilization has been increasing and infrastructure bottlenecks may soon emerge as a significant obstacle to growth. TPF
33FPT Capital investment and maintenance is under-funded – road maintenance gets
a third of what is required. Expenditure on education is high but inefficiently deployed; over-staffing and an excessively large network of facilities contribute to a teacher to student ratio of 10, one of the lowest in Eastern Europe. Similar inefficiencies characterize health expenditure: seventy percent of health expenditure is allocated to hospital care.TPF
34FPT This is reflected in health outcomes – while infant and maternal mortality
rates have declined, some critical indicators such as incidence of tuberculosis and HIV have increased. Brazil Highlights 71. Brazil faces a tough set of policy choices complicated by political economy influences. Attempts to generate a primary surplus have relied on revenue enhancements and cuts in public investment, both of which have created adverse incentives for private investment and growth. Public investment by the general government has shrunk by about 50 percent since 1998 and represents about 2 percent of GDP. The inadequate investment in infrastructure is indicated by a number of revealing facts – 42 percent of the road network is believed to be in poor or extremely poor condition, generation capacity has grown at only 3 percent per annum over 1980-2000 and has resulted in blackouts and energy rationing in recent years. Modifying the composition of expenditure is difficult because the government is legally mandated to earmark a significant share of tax revenue for social security and social assistance programs. Social security represents over 12 percent of GDP and combined with social sector spending requirements implies that less than 20 percent of the budget is discretionary. 72. Studies show that Brazilian growth would be enhanced by improving the composition of expenditure, not by raising the deficit. A number of empirical studies have estimated the impact of shifting the composition of spending towards public investment in infrastructure and expenditure on education and found consistently that this
TP
33PT Estimated infrastructure needs are about US$ 100 billion over the next ten years.
TP
34PT The number of hospital beds in per capita terms is more than thirty times the average in the new EU
members.

25
would improve growth outcomes. TPF
35FPT Bank analysis found that increases in public
investment and a reduction in the tax burden would both have a positive growth impact, whereas an increase in government consumption, social security and social assistance would reduce growth. A shift in the composition of expenditure from social security to public infrastructure would likely have a sizeable growth impact. Evidence is suggestive that reducing unproductive expenditure and taxes in tandem would likely lead to a significant and additive positive growth impact. 73. Brazil faces many institutional challenges to adopting a more growth-oriented fiscal policy. While the simulations suggest a strong growth payoff to an appropriately crafted fiscal policy, there are a number of significant institutional challenges to be addressed if any such change is to be implemented. As noted earlier, an expenditure reduction and any compositional shifts would require changes in earmarking legislation. Secondly, an aging population creates tendencies for further growth in social security and assistance expenditure which will have to be restrained and reversed through appropriate reforms. Thirdly, there is a need to strengthen budget formulation, execution and accountability arrangements to improve the efficiency of public spending, including public investment. All this suggests that the fiscal strategy must take a long term perspective and address each of the components in order to deliver a fiscal policy that has a strong growth impact. Turkey Highlights 74. Turkey faces the need to undertake a growth-enhancing fiscal consolidation involving a reduction in primary expenditure and the tax burden. Turkey’s primary expenditure level of 34 percent is comparable to OECD countries such as Ireland, Portugal and Spain whose per capita income is a multiple of Turkey’s. As such, the level and composition of expenditure and taxation are likely to be a significant drag on economic growth in the long term. While recent growth has been high, averaging 7.7 percent over 2002-2005, there has been little improvement in unemployment. Macroeconomic stability is still vulnerable as demonstrated by a widening external current account deficit and higher interest rates on domestic debt since mid 2006. And while large primary surpluses have been helpful in improving the debt dynamics and restoring macroeconomic stability, the quality of public expenditure remains to be addressed. 75. Turkey needs to create fiscal space for investments that are necessary for sustained growth, but must do so in a way that continues to enhance fiscal credibility with the markets. The government would benefit from a social security reform that would lay the groundwork for containing future pension deficits. Cost containment on the universal health insurance program, civil service reform that enhances incentives and accountability in the public sector, and tax reform are identified as urgent priorities. The education sector will require additional resources to finance non-salary
TP
35PT See for example, Ferreira and Araujo (2006), “On the Economic and Fiscal Effects of Infrastructure
Investment in Brazil”, mimeo, World Bank, and Adrogue, Cerilosa and Gelos (2006), “Brazil’s Long-Term Growth Performance – Trying to Explain the Puzzle, IMF Working Paper.

26
expenditure, while the health sector offers the opportunity to increase fiscal savings from efficiency enhancements and cost containment.
LOW MAC – SECTIONAL SUMMARY
76. The low MAC countries represent a wider range of initial fiscal conditions, although all carry a relatively high debt to GDP ratio.TPF
36FPT Morocco with about 28
percent of GDP in revenue and 31 percent in expenditures represents the lowest deficit case. India with revenue of 19 percent of GDP and expenditure of 27 percent represents the widest deficit relative to GDP, while the Philippines reflects a lower revenue effort (15 percent). Growth and fiscal performance in the three countries has varied and concerns for macroeconomic stability are also distinct. India Highlights 77. India has grown at a high rate for many of the last 20 years and, with the exception of a balance of payments crisis in 1991, has avoided major economic crisis. But its fiscal policy, which involves long periods of high deficits and rising government indebtedness, appears to defy the usual laws of economic gravity. Debt remains high at 82 percent of GDP with 30 percent of general government revenue going just for interest payments. The fact that the deficits are not used for critical public investments, but are largely being used to finance public consumption and transfers, highlights the need to remove the fiscal drag on the private sector due to current fiscal policy. As a case study of fiscal policy, it offers interesting lessons and a forward looking challenge. 78. India’s combination of fiscal and growth performance defies conventional wisdom. Despite the adverse fiscal fundamentals, analysts believe India was able to manage for a number of reasons including broad based economic growth at an average rate of 6 percent during the 1990s and an even higher rate of about 8 percent in the 2000s. Trade reforms in the 1990s led to some loss of revenue, but may have contributed to improved competitiveness of industry and subsequent growth. Second, India consistently built up external reserves since the 1991 crisis to an estimated $150 billion in 2005/06, allaying market concerns about a payments crisis. Third, India had the advantage that it was “debt tolerant” because of its good credit history and track record of low inflation. Fourth, the government shifted to relying on domestic debt to finance its deficit. The dominance of state owned banks which willingly held government debt together with restrictions on capital account convertibility, enabled it to finance its deficit relatively cheaply and without risk of speculative attack.
TP
36PT Per capita income in the three countries in this group ranges from $720 (India), $1300 (Philippines) to
$1730 (Morocco).
27
79. A fundamental challenge facing India now is that greater public investment and developmental spending are needed to address future constraints to growth. The Bank (DPR 2006) argued that the most binding constraints on aggregate growth in India in the medium term are public infrastructure and the fiscal deficit. Recent estimates produced by the Bank suggest that India might need to invest 8 percent or more of GDP in public capital over the period 2006–10 to sustain annual GDP growth at near 8 percent. 80. Public finance reforms are needed to reduce fiscal deficits. With India becoming increasingly integrated into the world markets with diminishing scope for capital financing, maintaining a macroeconomic environment conducive to high sustained growth will require reduction of deficits. All these point to the need for far-reaching public finance reform. In the long-run, debt holders have to believe that the government will generate the requisite primary surpluses to balance its inter-temporal budget constraint. 81. India’s fiscal options are in improving the composition and efficiency of expenditure and raising revenue. Looking at the fiscal diamond for India, it is clear that it could find fiscal space for its development needs by: (a) increasing revenue generation as a percent of GDP, a still significantly under-used source of public financing, and (b) generating fiscal savings by cutting unproductive spending and improving efficiency of resource use at all levels of government. Given the scale of the investment needs, and the time required to make such adjustments on the revenue and expenditure side, both will need to be aggressively pursued to ensure that the level of expenditure can be sustainably financed and the composition of the expenditure so financed is appropriate to the growth and development needs of the country. One scenario outlined in World Bank (2006) suggests that public investment can be increased by 3 percentage points of GDP over 2006-10 while keeping the overall level of expenditure roughly stable at 27 percent. This would require a cut in current expenditure of 2 percent of GDP and an increase in revenue of about 3.5 percent of GDP. 82. Revenue mobilization on a significant scale is critical for this fiscal strategy to work. India is widely regarded as an under-taxed country with considerable potential for increasing tax revenue through base broadening, lowering statutory rates, reducing exemptions, and simplifying the tax system. India’s indirect tax system is very complex and hampers tax administration and compliance. Estimates suggest that there is a scope to increase revenues as a share of GDP by 3-4 percentage points over the medium term. The potential for fiscal savings from efficiency improvements is also significant. Unproductive spending at both the center and the state levels offers potential fiscal space. A key issue is that of salaries and pensions which account for roughly 25 percent of general government spending. 83. A growth-enhancing fiscal policy in India would need to create fiscal space for infrastructure within the framework of a comprehensive overhaul of the public finances. Given the significance of sub-national fiscal entities, the strategy would need to encompass fiscal adjustment across levels of government and would have to be based on both significant additional revenue mobilization and restructuring of current expenditure.

28
Morocco Highlights 84. Morocco has made considerable progress in stabilizing its economy, reviving economic growth and reducing poverty in the past five years. Since 2001, the economy has grown at an average rate of 4.5 percent, while the overall fiscal deficit has been reduced from 6 percent of GDP in 2001 to 3 percent in 2006, gross debt from 75 to 67 percent, and the inflation rate from 6 to 2 percent, and public investment has been sustained at 5 percent of GDP. However, growth has been highly volatile. Sustained high growth is needed to reduce poverty levels and to create enough jobs for the unemployed – currently estimated at 15 percent in urban areas and at 20 percent among the youth – and new entrants to the labor force. Unlike in many countries, inadequate infrastructure is not a binding constraint to growth in Morocco. Infrastructure coverage (roads, ports, electricity, and water) is better in Morocco than in most MICs, although further public investment is needed to improve trade logistics and the quality and standards of service. There is no perception that private investment, which has risen by 4 percentage points of GDP over the past five years, has been crowded out. 85. The main fiscal constraint to growth is a burdensome tax regime.TPF
37FPT. Tax rates
are high and create disincentives for investment. In addition, there are significant tax exemptions which cost roughly 3.5 percent of GDP in 2005. Tax policy reforms covering the VAT and income tax regime as well as tax administration improvements would help address this problem. 86. Managing fiscal policy to promote faster growth is still a challenge in Morocco. Fiscal policy should focus on a growth-enhancing fiscal contraction that is supportive of private sector development, rather than on increasing public spending. Staff estimates suggest that the reform of the current poorly designed and burdensome tax system along with improvements in tax administration could lead to a revenue loss of about 1.5 percent of GDP annually, while additional spending of about 1.5 percent of GDP will be needed in areas which are substantially under-funded at present – such as health and water supply. These needs can be accommodated within the existing expenditure program, without looking for alternative financing options. 87. There is considerable scope for improving the composition of expenditure and increasing the efficiency of spending. Currently, Morocco’s expenditure program is heavily tilted towards consumption. In 2005, wages alone accounted for 13.6 percent of GDP or 40 percent of public spending, with another 20 percent for food and oil subsidies, pensions and social insurance. Overall spending on the social sectors has been high with– over half the budget in 2006 – including 6.4 percent of GDP for education and another 6 percent of GDP for social protection and pensions. However, 94 percent of the education budget is spent on wages, leaving very little for school supplies, teaching materials and repair and maintenance of facilities. At the other extreme, health, with 1.2 percent of
TP
37PT Tax rates on corporate and personal incomes are high, while a multiplicity of exemptions undercuts the
tax base of the VAT.

29
GDP, is poorly funded; and 75 percent of it goes for urban hospitals and clinics, leaving little for basic health care in rural areas and preventive services. 88. The government is fully committed to fiscal consolidation as a critical part of its development strategy and is addressing five critical actions: tax reform, reduction of the public sector wage bill to 10 percent of GDP by 2011, reducing energy subsidies, phasing out food subsidies with targeted support for vulnerable groups, and the adoption of an MTEF with performance budgeting. It has also informally adopted the Maastricht rules on the budget deficit (3 percent of GDP) and public debt (60 percent of GDP); and has cut back overall public spending from 31.7 percent of GDP in 2001 to 30.8 percent in 2006. Further expenditure consolidation and restructuring and reduction of the overall deficit, as envisaged, would allow the government more scope to support critical priorities for growth, while reducing the tax burden. 89. In summary, for these countries, the fiscal challenges are largely with regard to improving the efficiency of taxation while also improving expenditure composition and efficiency. In terms of the level of public spending, there appear to be no compelling reasons to believe that the countries should seek to increase aggregate expenditure. For India this would increase the extent of additional revenue mobilization needed beyond the amount that is already required and that may be unrealistic and counterproductive. VI. Conclusions and Operational Implications 90. This paper provides an approach to fiscal policy design that responds to the request of the Development Committee. Following the earlier interim report, this report draws on good practice in public finance and recent thinking on growth constraints to propose a growth-oriented approach to fiscal policy design. The approach is used to consider the implications for a number of case study countries. Some conclusions are suggested that provide a clear sense of the direction and issues for fiscal policy design. The principal challenge facing policy makers is the way in which they address the inter-temporal budget constraint. 91. A major conclusion that emerges is the need for explicit development of growth-oriented fiscal policy scenarios to inform the design of an overall macroeconomic policy package. This allows countries the opportunity to identify the country-specific constraints to growth and to address those that can be influenced by spending or tax policies. The approach suggested would complement conventional financial programming approaches to fiscal policy, providing greater assurance that growth objectives can be achieved without risking macroeconomic stability. Some iteration between growth objectives and resource constraints will be required to achieve the appropriate design of fiscal policy. 92. Operationalizing such an approach will require scenario analysis because it is difficult to accurately anticipate the growth impact of fiscal policy. The development of growth scenarios will require detailed, country specific analysis of key

30
fiscal-growth linkages. There are two major channels to such linkages – expenditure policy and tax policy. 93. The growth impact of fiscal policy is directly related to the efficiency of resource use. The quality of governance and management in the public sector has a major influence on the efficiency of resource use and therefore on the growth impact of any particular category of public expenditure. For many countries, efficiency is the weak link in the chain linking public expenditure to public sector outputs and to growth. Any effort to assess the growth impact of public expenditure must therefore factor the efficiency of spending into its calculation. Improving efficiency will require efforts to address the governance and management constraints specific to each sector as well as initiatives to strengthen broader budgetary processes. 94. The composition of expenditure is another fundamental determinant of the growth impact of fiscal policy. While empirical evidence points to the importance of adequate public expenditure on infrastructure, education and health for economic growth, it is clear that the appropriate level of expenditure on any function will depend on country characteristics. Governments that aim to achieve higher growth have to align the composition of expenditure to address country-specific constraints to growth, allocating resources to where economic or social returns are the highest. Where policy objectives other than growth are sought, the necessary composition of expenditure may imply a lower rate of growth. Identifying and assessing such trade-offs may help governments adjust their policy priorities and expenditure choices. 95. The level of expenditure that can be sustained without adverse impact on macroeconomic stability is related to the capacity of a country to raise revenue while minimizing the disincentives for investment and growth. When governments rely on tax levels and instruments that discourage savings and investment, they offset, in part or whole, any growth benefits that may result from the expenditure it finances. On the other hand, when governments do not mobilize adequate resources, their ability to finance expenditure, including through borrowing, is limited. This underlines the importance of establishing a broad based and income-elastic tax system with a capable and efficient tax administration. The greater the efficiency of taxation and expenditure policies, the higher the level of expenditure that can be sustained. 96. Fiscal institutions and budget processes are key elements that determine the capability to undertake effective fiscal policy. Governments need effective institutions for revenue mobilization, to establish priorities that determine the composition of the budget, and to maintain fiscal discipline. Embedding a longer term growth objective in an operational fiscal strategy requires a high degree of government planning, coordination and implementation. Most countries require sustained effort to strengthen these capabilities.

31
Implications for Country Authorities 97. Government credibility with three key financing constituencies – tax payers, creditors, and grant providing donors – is key to ensuring reliable financing for a growth oriented fiscal policy. An effective fiscal policy is one that enlarges fiscal space through consistent actions that enhance government credibility over time. Many countries face donors who are unwilling to make long term aid commitments or who choose to earmark aid due to concerns about effective use of aid. Others confront the problems of debt intolerance or taxpayer non-compliance due to past policy volatility or perceptions of waste in government. A strategy to address such issues would be key to providing the foundation for a growth-oriented fiscal policy. In general, credibility would be significantly enhanced through steps that improve fiscal transparency as part of a broader commitment to fiscal responsibility and accountability for public service quality. Governments should seek to activate a virtuous cycle of fiscal responsibility and accountability to generate reliable low cost public financing for growth and development.TPF
38FPT
98. Institutions that enable a government to adopt and implement a long term perspective can support a growth-oriented approach.TPF
39FPT Many countries have initiated
long term vision statements or commitments to the MDGs that will require stronger institutional support. Close coordination between planning, finance and sector ministries is often critical to a longer-term growth strategy that is consistent with macroeconomic stability.TPF
40FPT
99. A transparent, evidence-based approach can help governments make informed policy choices. Fiscal policy decisions that involve upfront costs (such as a trimming of subsidies) will often be resisted by affected groups, in part because the benefits of the policy are not visible or not explained. Most decisions on resource allocation will involve trade-offs, including inter-temporal ones, that should be made explicit. Inevitably, fiscal decisions will have consequences for growth as well as other policy objectives, including income distribution. But if policy goals are well defined, governments are best-served by making decisions on the basis of the best evidence that policy analysis can provide. Governments should develop and encourage such policy analysis. External agencies such as the World Bank could support this process by undertaking analysis and scenario modeling that can demonstrate the trade-offs, and develop, as far as possible, the longer term implications of alternative policy options.
TP
38PT A recent review of Fiscal Responsibility Laws by the IMF concluded that compliance with numerical
fiscal rules has been weak, suggesting that such laws only work if there is underlying social and political support for fiscal responsibility. IMF (2005) TP
39PT As noted, a number of the case study countries have initiated long term development vision statements,
such as the Kenya 2030, Rwanda 2020 and Madagascar MAP These will need to be supported by fiscal strategies and coordinated implementation. TP
40PT Examples of effective coordination include Korea’s Economic Planning Board in the 1960s which
integrated planning and budgeting functions and was led by a deputy prime minister with the authority to coordinate economic development and fiscal policy. Botswana has effectively linked its national development plan to its budget with an appropriate fiscal strategy and effective institutions.

32
100. Indicators of longer term fiscal health could guide fiscal management. Conventional fiscal indicators provide an inadequate basis for long term decisions. Indicators that approximate a net worth measure of the public sector balance sheet could complement the fiscal deficit and provide a better basis for fiscal management.TPF
41FPT The use
of such indicators should be consistent with government data capabilities. A first step could be to record and report an inventory of public sector assets in addition to a full record of liabilities. Efforts to review and report on the quality of service and performance in key government functions would provide ministries and departments with incentives to allocate adequate resources to support government functions. 101. Governments could strengthen key aspects of budget formulation and execution to improve the growth impact. Ongoing efforts to implement the MTEF in many countries will help governments articulate growth oriented fiscal scenarios and link budget decisions to address fiscal constraints to growth. Strengthening the process for selection and implementation of investment projects will also have a significant payoff since implementation delays and cost-escalation significantly diminish the growth impact of public investment projects in many countries. Country-specific weaknesses in public financial management should be addressed to ensure that fiscal policy is well executed. 102. Measures to improve the composition and efficiency of the budget can have a high growth payoff. Too often fiscal policy choices are viewed in terms of the scope to increase expenditure through borrowing. Periodic public expenditure reviews and tracking surveys could help country authorities identify ways to achieve higher growth with available resources. Pragmatic initiatives to encourage performance oriented management in the sectors would also help reduce inefficiency and waste. 103. There are no easy rules of thumb to ensure a growth-oriented fiscal policy. In many case study countries, public infrastructure is revealed as a constraint to growth. A government commitment to fiscal responsibility that includes maintenance of an appropriate share of public investment and maintenance expenditure would support growth. Highlighting the adverse growth implications of decisions to cut maintenance or investment as part of a commitment to fiscal responsibility may help governments to resist pressures to cut such expenditure. Making these trade-offs explicit may help ensure a growth-oriented composition of the budget. Implications for Development Partners 104. The review also has important implications for development partners with regard to the composition and volume of aid. There has been significant progress in recent years with development partners acknowledging the importance of country-led approaches to growth, development, and the MDGs. Summits such as those at Monterrey and Johannesburg have produced commitments to the notion of mutual accountability for
TP
41PT Accrual accounting and long term fiscal projections are used by some countries to assess the impact of
policies on government net worth. Of these, the latter may be preferred although its value will depend on the objectivity of the underlying analysis and the credibility of the agency preparing such forecasts. See Easterly, Irwin and Serven (2006).

33
achievement of the goals established. This has included commitments to scale up aid while making aid more predictable and subject to fewer conditions.TPF
42FPT
105. However, the last few years have also seen the emergence of a preference among many donors to use aid earmarking to particular goals or objectives. With private and official aid flows in some cases taking this route in significant amounts, there is a risk that government systems will be unable to sustain a broad range of necessary capabilities when swamped with resources that are allocated to a narrow range of functions tied to specific goals corresponding to donor priorities, particularly in the health sector. This may set back the capability of health systems in many countries, with attendant perverse consequences for health outcomes. 106. Both private and public donors need to be aware of the potential adverse impact of narrowly earmarked aid on weak government systems. This awareness may help adapt aid modalities so that the risk of damage is minimized. A government that is motivated to design a growth-oriented fiscal policy will have its task made more difficult if large aid flows continue to be highly volatile, committed only on short horizons, and heavily earmarked. Both the inter-temporal and compositional dimensions of policy will be compromised in this case. 107. Development partners may also need to revisit the fiscal implications of the time horizon and volume of aid flows for some countries. This follows from the recognition of the limits on what some low-income countries may be able to generate in additional tax revenue over a longish horizon. Given the narrow tax base, economies are often unable to generate sufficient levels of revenue without adversely affecting economic incentives. Ambitious growth and development goals will require a long period of large and reliable flows of grant aid, possibly for a decade or more. It is not clear if the need for this longer time horizon is adequately acknowledged in most discussions of development aid. Such aid flows will need to be linked to performance through appropriate monitoring and evaluation of performance, reinforcing the need for governments to improve efficiency and demonstrate aid-effectiveness. Implications for the Bank 108. Making the growth-oriented approach to fiscal policy operational has significant resource implications for the Bank’s work. Encouraging a comprehensive public finance perspective and developing the link between fiscal policy and growth will, in the first instance, require the Bank to develop and mainstream tools, and techniques for staff undertaking fiscal analysis. More empirical research on the links between public expenditure and growth and to support the development of the necessary databases would help support this initiative. In parallel, it will also be necessary for the Bank to develop
TP
42PT The High-Level Forum on Harmonization met in Rome (2003) and Paris (2004) to affirm the intention to
align donor assistance to country-owned development/poverty reduction strategies; harmonize aid policies around country systems which are to be strengthened; provide reliable and predictable aid commitments and disbursements; and improve donor coordination at the country level.

34
the capacity to provide advice and support to country authorities to strengthen their own fiscal capacity to assess fiscal trade-offs that have inter-temporal implications. 109. Over the past decade the Bank’s work on public expenditure management has been significantly improved with the focus on budget institutions and financial management. The Public Expenditure and Financial Accountability (PEFA) framework provides an important and broadly applied tool to diagnose PFM systems, enabling governments to take ownership of the design of reforms and monitor progress. Technical assistance to support improvements in budget formulation, execution, procurement, reporting and auditing will remain important for a broad range of countries. Institutional analysis and advice on implementing a MTEF remains an important and vital area to support fiscal policy. While the experience with efforts to introduce cost-benefit analysis in government decision making have generally been disappointing, it may be useful to encourage governments to re-establish basic systems for project and program evaluation to improve efficiency of public investment. 110. The Bank’s techniques for analysis of public expenditure composition and efficiency will have to be significantly enhanced. Relative to the focus on institutional issues, there has been a decline in the focus on expenditure policy issues over the past decade. The case studies demonstrate that: (a) country level analysis will benefit from adopting a broader “public finance” perspective that is linked to development of a growth-oriented fiscal strategy; (b) the approach to growth diagnostics will need to be refined and improved to better identify fiscal constraints to growth; (c) models and techniques for analysis of the growth implications of alternative fiscal policy scenarios will need to be developed and applied; (d) sector level analysis will require a stronger focus on issues of technical efficiency and effectiveness as well as cross-sectoral trade-offs and complementarities. Alternative scenarios will help to advise governments that are faced with the need to make key policy choices involving inter-temporal trade-offs. 111. Timeliness of Bank advice is a key consideration in any policy discussion. The periodicity and format of Bank public expenditure analysis may need to be reviewed and reconfigured to balance the need for timely and comprehensive advice with the need for in-depth sector analysis. In large part, the periodicity of the Bank’s advice will be determined by the budget cycle of member governments. But it should also factor in some appropriate way into improved coordination with the IMF so that the interplay between fiscal policy and medium term growth scenarios are effectively considered. Operational Implications for Bank-Fund Collaboration 112. Both Bank and Fund are committed to exploring how a country’s fiscal policy can be designed in a way that promotes growth while maintaining stability. Success in this effort requires inputs from both institutions, drawing on their respective
35
comparative advantage.TPF
43FPT Collaboration modalities will be critical and will need to be
developed. 113. Bank-Fund collaboration will have to ensure coverage of revenue issues. For the Bank to strengthen a “public finance” perspective in its work, it will have to rely on an exchange of views on revenue issues since that is the Fund’s area of expertise. Although the Bank is often involved in technical assistance for customs and tax administration reform, it will need to draw on the Fund’s perspective on revenue prospects over the medium to long term. A mutual understanding based on a longer term perspective would enhance the work of both institutions. Both institutions will also have to address that the issue of tax expenditure that has been relatively understudied and which often accounts for the weak revenue effort of some countries. 114. Collaboration on Data Issues: It is widely known that the quality of empirical work on the links between public expenditure and growth in developing countries is handicapped by the lack of public expenditure data by functional and economic classification. This is a critical public good that needs to be developed. A joint Bank-Fund effort to improve the coverage and timeliness of Government Finance Statistics (GFS) is essential in this regard. 115. The principal challenge for collaboration will be to establish processes that facilitate the iteration between medium term expenditure and growth. An early and continuous exchange of views on growth related aspects of fiscal policy would help both the Bank and the Fund provide consistent advice on sustainable growth. Upstream discussions of the Bank’s view on growth needs and constraints would enable Fund missions to craft programs that address the quality of fiscal policy, making more appropriate judgments on the speed and composition of any required fiscal adjustments. In turn, the Bank’s growth-oriented public finance work could be informed by the design of the macro-fiscal framework and realistic revenue forecasts. This is likely to involve some iterative process that could be usefully structured to ensure that it is practical and institutionally supported by both institutions.
TP
43PT The Bank’s contribution will draw on its knowledge of growth and the productive sectors. The Fund’s
contribution will draw on its expertise in macroeconomic stabilization, revenue policy and administration. Both institutions have expertise in public finance management.

36
ANNEX MATERIAL

General Government 1/
GDP Per capita
US$
GDP
Growth Rate
Overall Balance
Revenue & Grants
Revenue Grants
2/ Total exp. & net
lending Gross Debt
Public Capital
Formation
1 H-AAC Rwanda 230 3.6 -1.2 23.7 13.7 10.0 25.0 15.0 8.1 2 H-AAC Uganda 280 5.3 -2.2 20.7 12.7 8.0 22.9 31.5 5.0 3 H-AAC Madagascar 290 5.0 -4.9 17.5 10.8 6.7 22.4 36.8 10.2 4 L-AAC Tajikistan 330 9.2 -2.4 18.4 16.5 0.5 20.9 47.1 7.4 5 L-AAC Kenya 530 4.4 -1.7 22.7 21.4 1.3 24.4 53.9 4.3 6 L-AAC Cameroon 1010 3.4 1.4 16.6 16.2 0.3 15.2 2.5 2.2 7 L-MAC India 720 7.9 -7.9 19.7 19.4 0.3 27.6 84.1 6.8 8 L-MAC Philippines 1300 5.4 -3.9 15.0 14.9 0.1 18.9 93.4 2.3 9 L-MAC Morocco 1730 3.8 -4.9 26.0 25.7 0.0 30.9 70.5 2.6 10 H-MAC Ukraine 1520 8.1 -2.6 37.5 37.4 0.1. 40.1 18.7 4.9 11 H-MAC Brazil 3460 2.6 -3.7 45.2 45.2 0.0 48.9 71.1 1.4 12 H-MAC Turkey 4710 7.4 -7.3 39.2 39.1 0.1 46.5 71.5 4.0
Sources: World Economic Outlook, IMF, and WDI and regional databases,World Bank, February, 2007. Notes: 1/Some data may not add up due to period averaging. 2/ Data for Cameroon, Kenya, Madagascar, Rwanda, Uganda, and Tajikistan refer to 2003-04; 3/ Debt statistics refer to latest available year. Data for Kenya is from the African regional database as 2004. Data for Cameroon, Madagascar, Rwanda, and Uganda reflect the MDRI effects (2006). Source for general government data for Turkey and Ukraine are World Bank Public Expenditure Reviews. Data for Philippines refer to national government from IMF Article IV report. Source for India general government data is IMF article IV report.
Table A1: Economic Growth and Fiscal Indicators, 2003-05 (Annual average, in percent of GDP, unless otherwise specified)
Annex 1: The Microeconomics of Expenditure Decisions
1. The argument that public spending may have a positive effect on an economy’s growth performance hinges on such spending being relatively efficient in creating public sector outputs and services that either directly or indirectly have high economic returns. Potentially the weakest link in this argument is that the efficiency of public spending is often very low. Governments may spend on programs that do not contribute to growth or welfare; or they may spend in ways that are costly and ineffective in providing critical public goods and services. The quality of public spending depends both on the effective application of microeconomic concepts of efficiency and on the quality of budgetary institutions that provide incentives for efficient management. It also depends on political will to support these institutions. 2. Given that resources are scarce and taxation imposes a rising marginal cost on society, public spending ideally has to prioritize and ration the provision of those public goods and services that are most critical to efficient functioning of the economy and to maximizing the level of social welfare. Governments will face demands from constituents, from private sector representatives and from civil society organizations to provide or expand various goods and services as well as to subsidize various private initiatives. These demands may provide government with some indication of areas where public sector constraints are binding and where public expenditure may yield high returns or high welfare impact. However, it is likely that some of the lobbying will be of a rent-seeking nature or to gain a regulatory advantage over competitors without a beneficial net impact on income or welfare. The government will need some criterion for eliminating the worst of these proposals and choosing intelligently amongst the rest. 3. We focus on the range of interventions for which there is some microeconomic justification. It is assumed that it will be necessary to borrow to finance an additional project, of whatever type. Since the debt has to be serviced, the key question concerns how this future financial cost will be met. First consider a project whose financial returns to government, for example from user charges, cover its costs. Then no additional finance has to be raised to meet the debt service. At the other extreme would be a project whose returns took a wholly non-pecuniary form, so generating no revenue for government. In this case, all the debt service would have to be raised from additional (distortionary) taxation. In between there would be projects that made some contribution to revenues, but insufficient to fully cover their costs. Examples would include income from user charges below cost, or from tax revenues levied with existing taxes on the enhanced private income the projects created. 4. A formal exposition of this issue follows below, using three simple examples. The first is a project whose return is fully appropriated by government. The second is a project whose return is entirely monetary, but with all of this additional income accruing initially to the private sector. The third is a project whose return again accrues to the private sector, but now in a non-pecuniary form. An interesting implication of these stylized calculations is that there is a relatively sharp distinction between the first case and the other two. The investment criteria for the latter two cases are likely to be quite close to each other for reasonable parameter values, but substantially tougher than for the first, reflecting their need for expensive marginal tax revenue. Hence the cost benefit

39
criterion for a project with a “purely social” payoff is likely to be very similar to that for a project with a conventional monetary payoff, but one which accrues to the private sector. The very different first sort of case, arguably, is less interesting, since it could probably be left to the private sector.
5. This discussion underlines the inter-connectedness of public finance, and the fact that spending decisions must be considered in light of information on how such spending will be financed and the costs of such financing. The efficiency of taxation is a key issue and an aspect of fiscal policy that requires equal attention, particularly in cases where general taxation must cover all or part of the ongoing cost of the project. It also underlines the fact that projects which are not self-financing must be financed from somewhere else. Proper project appraisal must spell out where this somewhere else is. 6. Micro-Macro Issues: This discussion has identified conditions under which public spending would be consistent with macroeconomic stability and with microeconomic efficiency. In principle, the microeconomic decision criteria should be derived from a fully consistent general equilibrium framework, and the possibility of inconsistency would not arise. In the presence of various imperfections, the criteria would include appropriate shadow prices that would incorporate precisely those features which might otherwise drive a wedge between microeconomic choices and macroeconomic constraints. In practice, this is an unrealistic requirement, and care will need to be taken at this interface. Financial and Social Returns 7. Government investments may produce returns of different types; they may be direct and financial, indirect and financial, or indirect and social. The benefit-cost criteria for deciding whether to undertake these investments need to be varied to take this into account. To illustrate, consider three versions of a very simple, infinitely lived, project profile. The projects differ according to the form the benefit takes and to whom it accrues. In each case the project requires an initial cash investment of 1, which is financed by borrowing; project i then yields a constant flow of benefit, b Bi B and has a constant cash operating cost, cBi B. The discount rate, r, is constant and common to both government and the representative private agent. The government receives revenue from an income tax at rate τ . This inflicts a deadweight loss on the private agent at an average rate Aθ and a higher marginal rate Mθ per unit of revenue raised. Project 1: Direct Financial Benefits 8. This has a benefit flow which is all appropriable by government, for example via user charges. To the extent that this appropriability property also held for a private investor, there is no necessity for the public sector to undertake the project, which could be left to the private sector, but it provides a useful benchmark. The present value criterion is to undertake the project if:
1 1
1
( ) 1(1 )t
b cr
∞ −≥
+∑ . Summing the left hand side yields 1 1( )b cr− , so the benefit-cost test in this
case is to require that:

40
1 1b r c≥ + (1) Project 2: Indirect Financial Benefits 9. This has a benefit flow that accrues entirely as an addition to private cash income and not as project return to government. However, the addition to private income is taxable, so does generate some additional revenue. Existing taxes reduce the benefit received by the private agent to [ ]2 1 (1 Ab τ θ− + , but that is not the end of the story. The natural case to consider has 2 2b r cτ < + , so that additional taxation equal to 2 2r c b τ+ − must be levied. This lowers private benefit by a further 2 2( )(1 )Mr c b τ θ+ − + . There is no net revenue left in the hands of the government, so all the net benefit is private. Hence social net benefit is given by: [ ] [ ]2 2 2 2 21 (1 ( )(1 ) 1 ( ) ( )(1 )A M M A Mb r c b b r cτ θ τ θ τ θ θ θ− + − + − + = + − − + + .
For the project to be worth undertaking, this must be non-negative. Hence the benefit-cost test in this case is:
22
( )(1 )1 ( )
M
M A
r cb θτ θ θ+ +
≥+ −
(2)
The case where the indirect benefits are sufficient to more than fully finance the project is symmetric. Having to levy additional taxes is very costly, as measured by Mθ , but being able to lower taxes is equally valuable. Condition (2) therefore covers both of these cases. Project 3: Indirect Social Benefits 10. This has a benefit flow which takes a ‘psychic’ form, so that none of the benefit is monetary. Hence it gives rise to no additional revenue under existing taxes, and outgoings must be fully covered by additional tax measures. The additional revenue flow must equal 3( )r c+ , imposing a cost on the private agent of 3( )(1 )Mr c θ+ + . The private (and social) net benefit flow is therefore 3 3( )(1 )Mb r c θ− + + . For this to be positive, the benefit-cost condition becomes: 3 3( )(1 )Mb r c θ≥ + + (3) It is apparent that, for given c, 123 bbb >> . For example r = 0.05, and c = 0.05,
0.20, 0.20, 0.40A Mτ θ θ= = = . Then 1 2 30.10, 0.1346, 0.14b b b≥ ≥ ≥ . The interesting feature, that the tests for cases 2 and 3 are very similar to each other, but different from that for case 1, appears to be a general feature for reasonable parameter values. For public projects that generate private returns, it does not matter much whether they accrue as monetary or psychic income. Source: Background paper by David Bevan (2007)

41
Annex 2: Theory and Evidence on Public Expenditure and Growth
1. Since the mid-1990s a number of papers have argued that there is robust evidence of long-run impacts of fiscal policy on GDP growth, at least for OECD countries.TPF
44FPT Each
of these papers finds that some elements of the tax structure and/or some components of public expenditure are correlated with growth. Evidence from studies of developed countries shows that education, health and/or transport & communication spending show positive growth effects. For developing countries, a number of recent papers also find that at least some ‘productive’ public expenditures have positive growth effects.TPF
45FPT
Despite weaknesses in terms of country coverage and data quality, it seems that the types of result established for OECD countries can be extended to developing countries also. 2. There have been a number of previous reviews of the empirical literature (mainly pre-2000) on fiscal policy and growth including Agell et al, (1997), Tanzi and Zee (1997), Myles (2000), and Gemmell (2004). Much of this literature did not focus specifically on public expenditure and suffered from various methodological weaknesses.TPF
46FPT This summary focuses on evidence for public expenditure in developing
countries, and which are relatively recent (2000 and after) and/or use more reliable testing techniques. In particular it is now recognized that tests of the growth effects of public expenditure decompositions must accommodate the total government budget (expenditures, revenues, deficits). Summaries of recent evidence on the growth effects of public expenditures are given in Tables A1 (developed countries) and A2 (developing countries). 3. Table A1 shows that, for developed countries, though some non-robustness remains in the evidence, this largely applies to studies before 2000, or where the government budget constraint (GBC) is ignored in regression specifications. (Theory predicts that total public expenditure includes elements with positive, negative and no growth effects; regressions need to accommodate this). Where decompositions have been examined for high income countries, education, health and/or transport & communication (T&C) spending show some evidence of positive growth effects. Even the meta-analysis of Nijkamp and Poot (2004), which covers many studies almost all of which ignore the government budget constraint, finds evidence of strong growth effects for education and infrastructure spending.PF
47FP
4. For developing countries, a number of recent papers have challenged the Devarajan et al. (1996) result – that in low and middle income countries capital (current) spending has negative (positive) growth effects. These studies reverse the earlier findings, and now find strong positive growth effects from public capital spending. See, TP
44PT For example, Kneller et al. (1999) and Bleaney, et al. (2001) argued that, at least to some extent, the
ambiguous nature of previous evidence arose from inadequate research methodologies and misinterpretation of research results. A number of subsequent studies appear to back up this claim (see Padovano and Galli, 2002; Li and Sarte, 2004; and Lee and Gordon, 2005. TP
45PTHaque and Kim (2003), Bose et al. (2005) and Adam and Bevan (2005),
TP
46PT See Gemmell (2004) for details.
TP
47PT They do not find strong evidence for fiscal variables in general however, which is again not surprising
given the mixture of positive and negative effects expected for many fiscal aggregates, depending on composition and financing methods.

42
for example, Aschauer (2000), Dessus and Herrera (2000), Milbourne et al. (2003), Ramirez and Nazmi (2003), Haque (2004), Bose et al. (2005), Gupta et al. (2005), Adam and Bevan (2005), and M’Amanja and Morrissey (2005).PF
48FP Haque (2004) in particular
demonstrates that the Devarajan et al. result can be replicated using panel data which fails to correct for non-stationarity in the variables, while with this correction capital (current) spending is found to impact positively (negatively) on growth. 5. Focusing on sectoral classifications, Bose et al. (2005), Haque and Kim (2005), and Adam and Bevan (2005) show that sectors usually regarded as ‘productive’ (transport and communication, education, health, etc.) have significant positive long-run growth effects in low and middle income countries. These are supported by a number of studies on particular types of expenditures such as: infrastructure spending (Albala-Bertrand and Mamatzakis, 2001; Milbourne et al., 2003; Fedderke, et al., 2006); education spending (Milbourne et al., 2003; Ramirez and Nazmi, 2003; Bose et al. (2005); health spending or health indices (Bhargava, 2001; Ramirez and Nazmi, 2003; Bloom, 2004). 6. Several studies now also confirm harmful growth effects from public deficits or debt (e.g. Adam and Bevan, 2005; Gupta et al., 2004, 2005a; Segura-Ubiego et al., 2006). In addition, Gupta et al. (2004, 2005b) suggest that the persistence of fiscal adjustment in low and middle income countries, following initial reforms, can be influenced by the public expenditure composition of fiscal consolidations. In particular they find that growth outcomes were better where capital spending was relatively protected, while current expenditures (wages and salaries, transfers) were cut. 7. The evidence for deficits, and that in some cases resources can be over-allocated to ‘productive’ spending (see Dessus and Herrera, 2000), is consistent with the models of Barro (1990), Devarajan et al. (1996), Blankenau and Simpson (2003) and others, who each demonstrate how public spending which benefits private sector production or efficiency can be beneficial for growth at low levels of financing, but harmful to growth when produced ‘excessively’ such that they require high tax or deficit levels to finance them. 8. Areas of research that remain relatively under-explored are (i) the impact of public expenditure directly on private investment (a primary channel through which public spending is typically hypothesized to affect economic growth), and (ii) how far public spending and growth are mutually causal variables. On (i), some evidence for Latin America from Ramirez and Nazmi (2003) suggests beneficial effects of public, on private, investment. On (ii) various authors claim that their expenditure-growth results are not contaminated by endogeneity via bi-directional causality. However, evidence from Akitoby et al. (2006) of strong causality running from output to government spending (Wagner’s Law) in many developing countries, suggests that this debate is not yet fully resolved. 9. Thus, despite weaknesses in terms of country coverage, data quality and testing methodologies, it seems that developing country studies are increasingly finding evidence TP
48PT A recent paper which does support Devarajan et al. (1996) is Ghosh and Gregoriou (2006) but, unlike
Devarajan et al., they do not control for tax effects and results are of questionable reliability.
43
in support of positive medium-to-long-run growth effects from a number of public spending categories. These are usually the ones where theory would lead us to expect such effects – infrastructure (especially transport and communication), education and health. Further work to refine samples and fiscal data may be able to resolve some remaining uncertainties and improve the robustness of the evidence.

44
Table A2: Summary of Recent Results for Developed Countries Dataset Dependent Method Growth Effect (?)P
*P Comments Study
Variable positive negative none DEVELOPED COUNTRIES
Devarajan et al (1996)
21 OECD 1970-90
GDP per cap growth
panel capital exp T&C health (?)
current exp defence (?) education (?)
controls for total tax/GDP; poor regression fits
Priv. Inv panel total gov’t exp Mendoza et al (1997)
18 OECD 1965-91
GDP per cap growth
panel total gov’t exp
Main focus is effective tax rates;uses gov’t exp as control var; no gov’t decompositions examined
GDP growth panel gov’t exp (tax-financed)
GDP levels gov’t exp (tax-financed)
de la Fuente (1997)
21 OECD 1965-85
Priv. Invest. consumption exp
Miller & Russek (1997)
16 OECD 1975-84
GDP per cap growth
panel education gov’t exp (tax-financed) health (?) soc sec. (?) econ affairs (?)
gov’t exp (debt-financed) defence (?) T&C (?)
Generally non-robust results for DCs; debt-financing of exp decompositions.
Kneller et al (1999) & Bleaney et al (2001)
21 OECD 1970-95
GDP per cap growth
dynamic panel productive exp health ‘other productive’
distortionary taxes budget deficits
non-productive exp social security exp
explicit inclusion of gov’t bud contraint
Blanchard & Perotti (2002)
US (1960-91 & 1947-91; quarterly)
GDP levels Invest. levels
VAR
gov’t exp defence & non-def.
gov’t exp
tax levels also +ve. tax levels also –ve.
Perotti (2002)
5 OECD (1960-2000; quarterly)
GDP levels
VAR
gov’t exp (“small“) gov’t exp (pre-1980)
gov’t exp (post-1980) (?)
gov’t exp also affects price level (+ve)
Nijkamp & Poot (2004)
93 studies, 1983-88 123 meta-obs.
GDP or GDP percap growth
meta analysis techniques (various)
(“strong”) education infrastructure
(“weak”) fiscal vars. overall
Almost all 1st or 2nd generation studies
Schuknecht & Tanzi (2005)
22 HICs 19602-2002
GDP growth, employment, Social indicators
Descript stats comparing pre-& post fiscal reform
total exp. decreases assoc with increased trend growth & employment
no or little impact on social indicators
gov’t exp reducing countries mainly cut transfers and interest payments
Note: * (?) indicates that there is some doubt over the estimated effect (usually relatively large standard errors).

45
Table A3: Summary of Recent Results for Developing Countries Dataset Dependent Method Growth Effect (?) P
*P Comments Study
Variable positive negative none DEVELOPING COUNTRIES
Devarajan et al (1996)
43 LICs, MICs 1970-90
GDP per cap growth
panel current exp
capital exp T&C, defence (?), health (?), educ (?)
controls for total tax/GDP
Miller & Russek (1997)
23 LICs, MICs 1975-84
GDP per cap growth
panel gov’t exp (tax-financed) T&C (?)
gov’t exp (debt-financed) educ, health, soc sec.; econ affairs
Aschauer (2000)
46 LICs, MICs 1970-90
GDP per cap growth
cross-section gov’t capital exp ‘effective’ gov’t cap
gov’t debt gov’t debt used to control for (future) tax burden; effective gov’t capital measured from quality indices (e.g. faulty phone lines).
Dessus & Herrera (2000)
28 LICs, MICs 1981-91
GDP annual panel
gov’t invest ‘excessive’ gov’tinvest (relative to private inv)
only tests for effects from investment; production function approach; ‘excessive’where MPKBG B < MPKBPBBB
Albala-Bertrand & Mamatzakis (2001)
Chile 1960-95
GDP & Investment
VAR public infrastructure
Production function with public infrastructure as input; public infrastructure ‘causes’ output & private investment.
Bhergava et al. (2001)
92 HICs & LICs, MICs
GDP growth
panel
health index (many LICs, MICs)
(some HICs)
Impact of health indicators on growth (adult survival rates = life expectancy)
Haque & Kim (2003)
15 LICs, MICs 1970-87
GDP growth
dynamic panel (IV) & causality tests
T&C Examines only T&C; T&C Granger-causes growth; no reverse causality
capital exp, defence educ, educ invest T&C, T&C invest
14 other exp categories
excluding GBC Bose et al (2003)
30 LICs, MICs 1970-90
GDP growth
dynamic panel (IV)
capital exp educ exp educ invest ‘other’ exp
current exp including GBC explicitly; passes endogeneity tests; separate data on total exp and investment component
Milbourne et al. (2003)
74 HICs & LICs, MICs
GDP per cap cross-section gov’t inv (long-run, OLS) gov’t inv, educ, T&C (short-run, OLS & IV)
gov’t consumption (OLS & IV)
gov’t inv (?) (long-run, IV)
tests for transitional impact as in Solow model; no GBC control

46
Dataset Dependent Method Growth Effect (?) P
*P Comments Study
Variable positive negative none DEVELOPING COUNTRIES
Ramirez & Nazmi (2003)
9 LAC countries 1983-93
GDP per cap growth; Pte inv/GDP
annual panel
gov’t inv educ exp health exp [also affects pte inv]
gov’t consumption [gov’t inv and defense exp affect pte inv]
no GBC control [human capital also affects private investment positively]
Bloom (2004)
104 HICs & LICs, MICs
GDP growth panel health index Estimates productions function with human capital affected by health, schooling and work experience
Haque (2004)
33 LICs, MICs 1970-89
GDP per cap growth
cross section & panel
capital exp (in c-s, and panel with non-stationarity corrected)
current exp (in c-s, and panel with non-stationarity corrected)
includes GBC explicitly; Replicates Devarajan et al (1996) result using panel regression when no correction for non-stationarity
Adam & Bevan (2005)
40-45 LICs, MICs 1970-99
GDP per cap growth
dynamic panel
total exp+net lending productive exp (?) interest exp deficits (<1.5% of GDP)
total rev+grants total tax rev non-tax rev deficits (>1.5% of GDP)
grants all exp financed by ‘residual exp’; allows non-linearities in deficit; growth-max deficit = 1.5% of GDP; methods of financing deficits & debt levels important
Gupta et al. (2005)
39 LICs 1990s GDP per cap growth (& changes in)
annual panel
gov’t cap exp non-wage G&S exp (esp for pre-stabilization cases)
wage G&S exp deficits
weaker effect for post-stabilization cases
only countries with IMF-supported adjustment programs; includes GBC; impact of deficits worse if domestic financing than international
M’Amanja & Morrissey (2005)
Kenya 1964-2002
Real GDP time-series (ADL) & causality tests
gov’t invest. exp gov’t current exp on educ, health, econ. serv.
other current exp
includes GBC; causality from gov’t inv to growth
Akitoby et al. (2006)
51 LICs, MICs 1970-2002
gov’t exp time-series (ECMs)
income affects gov’t exp (long-run) in 70% of countries; highest for gov’t capital exp. Short-run income increases raise gov’t exp which not reduced in downturns (ratchet effect)
Focuses on Wagner’s Law; finds (more than proportional) long-run increases in gov’t exp in assoc with incomes.
Fedderke et al. (2006)
South Africa 1875 - 2001
GDP per cap time-series infrastructure inv leads growth (especially roads)
direct and indirect (via private sector MPK) effect of gov’t infrastructure exp; evidence of bi-directional causality.
Segura-Ubiergo et al. (2006)
26 transition economies 1992-2001
GDP growth panel ECM
gov’t borrowing (especially ‘monetized deficits’)
Focuses on ‘fiscal adjustment’ (deficit reductions). Positive growth effects till macro stab. achieved, then less clear.
Note: * (?) indicates that there is some doubt over the estimated effect (usually relatively large standard errors).

47
Annex 3: Public Expenditure in Six High Growth Countries
1. Is there any evidence suggesting that high growth countries have common trends or composition in public expenditure? A background study of the levels and composition of expenditure in a selected group of high growth countries provides some useful further evidence of the importance of public expenditure in supporting growth.TPF
49FPT
Six countries that sustained growth in GDP per capita in excess of four percent (Botswana, South Korea, Malaysia, Thailand, Chile and Ireland) were identified for study.TPF
50FPT The study examines trends in the level of public spending in these countries
and investigates the following hypotheses (1) whether countries have run significant fiscal deficits preceding or during periods of high growth, and (2) whether there has been any convergence in the functional and economic composition of public expenditure in these countries, specifically whether spending has been biased towards functions and categories of expenditure that are thought to be relevant for economic growth 2. The question regarding whether there is a pattern of convergence in the level of public spending has policy relevance for a broad range of countries. Evidence of convergence may lend some credibility to the idea that there is a notional “optimal size” of government that allows governments to sustain high growth and development and that a smaller or larger size of government would be less desirable. This notional size of government may differ for countries at different income levels. Arguments for scaling up flows of development assistance to developing countries implicitly are based on the idea that low income country governments are operating below some necessary scale – under-providing critical public goods and services. Conversely, there are a number of middle income countries that have experienced repeated fiscal instability and debt related stress and it could be argued that this reflects a size of government expenditure that is above some level and therefore cannot be sustained. 3. Some weak evidence of convergence in levels does exist. While the heterogeneity of the sample in levels of per capita income must qualify any conclusions that can be drawn, this analysis does provide some limited evidence of a tendency towards convergence of the level of government spending across the sample of high growth countries. Countries with high initial levels of spending (Ireland, Chile) tended to undertake expenditure reductions while those with low initial levels (Korea, Thailand) raised their spending levels as a share of GDP (see figure ). Countries with intermediate levels of initial spending (Botswana, Malaysia) displayed less clear cut behavior – Malaysian spending stabilized around 30 percent of GDP whereas Botswana increased it by a relatively significant 7-9 percent of GDP.TPF
51FPT This finding of possible convergence in
levels is an interesting result that merits further study.
TP
49PT See Biletska and Rajaram (2007), “Public Expenditure and Economic Growth: Insights from a Review
of Evidence from Six Growth Success Stories”, background paper. TP
50PT The countries represent a range of per capita income levels. In 1970, per capita income in constant terms
ranged from US$ 371 to US$ 7,095 in Botswana, Malaysia, Thailand, Korea, Chile and Ireland. In 2000, per capita income ranged from levels of US$ 1,998 to US$ 24,902 for the same group of countries. TP
51PT One could treat Botswana as an outlier with the results influenced by its natural resource revenues.

48
4. Deficit financing did not play a major part in the six countries for most of their high growth phase. Consistent with findings in the literature reviewed in Gemmell (2007), most countries appeared to be fiscally prudent. Only Malaysia, with deficits ranging from 10-18 percent of GDP for a three year period 1981-83, ran significant fiscal deficits that corresponded to a period of high public investment and high growth. The other cases reflect either relatively small deficits TPF
52FPT or extended periods of fiscal balance
with small deficits offset by periods of surplus. Thus, in most cases, high growth was achieved without recourse to large fiscal deficits. 5. Patterns in functional and economic composition of expenditure require further study. Some common patterns are observed: (a) general public administration expenditures tended to decline in most of the countries. Four countries reduced the share of public administration in GDP. For Chile, the reduction was dramatic, from about 12 percent of GDP in the early 1970s to about 4 percent by 1990. Korea and Thailand also reduced the public administration share of expenditure in GDP and in total expenditure relatively sharply.TPF
53FPT (b) education expenditure trends tend to be rather flat, showing little
growth in levels in most cases. The exception is Botswana which has sharply increased its educational expenditure commitments since the early 1990s. In most countries education outlays have been at least as high as in countries in the reference lower middle income group. Korea is the only country in which public expenditure on education is relatively low but a high level of private education expenditure, close to 60 percent of the total, explains its remarkable education outcomes. (c) the level of infrastructure expenditure by government is typically is in the 2-3 percent of GDP range with some variance around that band. Whether high growth countries go through a period when there is a significant surge in infrastructure expenditure is less evident. Malaysia and Botswana display such a surge in the early 1980s and in the 1970s respectively, and Thailand and Korea in the late 1990s. It should be noted that these figures do not include infrastructure expenditures undertaken by public enterprises so this conclusion is highly qualified.
TP
52PT Thailand had deficits of up to 5 percent of GDP 1977-87.
TP
53PT Botswana however more than doubled its share of expenditure on general administration from 6 to 12
percent of GDP between 1975 and 2003 while Malaysia increased it marginally from 6 to 7 percent.

49
Public Expenditure in High Growth Countries (% of GDP)
Korea Consolidated Central Government
-10
-5
0
5
10
15
20
25
30
1970
1972
1974
1976
1978
1980
1982
1984
1986
1988
1990
1992
1994
1996
1998
2000
2002
2004
% G
DP
0
2
4
6
8
10
12
14
INFRASTRUCTURE EXPEND & NET LENDING
OVERALL DEFICIT/SURPLUS CAPITAL EXPENDITURE
Thailand Consolidated Central Government
-15
-10
-5
0
5
10
15
20
25
30
1972
1974
1976
1978
1980
1982
1984
1986
1988
1990
1992
1994
1996
1998
2000
% G
DP
0
1
2
3
4
5
6
7
8
INFRASTRUCTURE (right axis) EXPEND & NET LENDING
OVERALL DEFICIT/SURPLUS CAPITAL EXPENDITURE Botswana Budgetary Central Government
-30
-20
-10
0
10
20
30
40
50
1971
1973
1975
1977
1979
1981
1983
1985
1987
1989
1991
1993
1995
1997
1999
2001
2003
% G
DP
0
2
4
6
8
10
12
14
16
INFRASTRUCTURE EXPEND & NET LENDING
OVERALL DEFICIT/SURPLUS CAPITAL EXPENDITURE
Malaysia Consolidated Federal Government
-20
-10
0
10
20
30
40
50
1972
1974
1976
1978
1980
1982
1984
1986
1988
1990
1992
1994
1996
1998
2000
2002
% G
DP
0
1
2
3
4
5
6
7
8
INFRASTRUCTURE EXPEND & NET LENDING
OVERALL DEFICIT/SURPLUS CAPITAL EXPENDITURE Chile Consolidated Central Government
-20
-10
0
10
20
30
40
50
1972
1974
1976
1978
1980
1982
1984
1986
1988
1990
1992
1994
1996
1998
2000
% G
DP
0
1
2
3
4
5
6
7
8
INFRASTRUCTURE EXPEND & NET LENDING
OVERALL DEFICIT/SURPLUS CAPITAL EXPENDITURE
Ireland General Government
-20.0
-10.0
0.0
10.0
20.0
30.0
40.0
50.0
60.0
1980
1982
1984
1986
1988
1990
1992
1994
1996
1998
2000
2002
2004
% G
DP
Total expenditure Fiscal balance Investment
Note: All but the infrastructure expenditure bar charts should be read off the left hand scale. Infrastructure expenditure data for Ireland is missing.
50
Annex 4: Revenue Mobilization
1. Tax reform measures should not be determined on the basis of short term objectives. Many developing countries frequently introduce changes to their tax regimes to bridge the immediate short fall in revenues without regards to the stability of a long term tax system. In the short run, the discretionary changes in tax policies may help keep the system buoyant, but they create more uncertainty for investments and raise both compliance and collection costs. Experience shows that there are no credible short-term solutions for enhancing long term revenue performance. 2. Initial conditions will determine the appropriate approach to revenue reforms. The scope and pace of tax reforms are dependent on the existing tax system, available tax handles, administrative capabilities, financing needs for development, and other historical, cultural and political factors. These pose the preconditions for and constraints to tax reforms. The right policy priorities are necessary but not sufficient; there must be political will to implement difficult reforms. 3. A desirable tax system is one that raises the required level of revenue while minimizing tax-induced disincentives for savings and investment. A good tax system should be able to balance both macroeconomic (level and composition of revenue collection) and microeconomic (specific design of major taxes) objectives. There is a general consensus that a desirable tax system would: (1) shift the tax burden away from factors of production toward broad-based consumption sources (e.g., the VAT); (2) broaden the base and reduce rates. The tax base could be broadened by rationalizing the exemptions and expanding the tax net to cover emerging dynamic economic sectors; and (3) encouraging the informal sector to join the formal sector through regulatory reform 4. Tax reforms should be considered as part of the overall growth strategy and should be appropriately sequenced with other fiscal or public administration reforms. In a number of transition countries, tax reforms have been introduced in conjunction with trade and industrial policy reforms. Trade liberalization poses the necessity of coordinating tax reforms to raise domestic revenues in order to compensate for the loss of trade taxes. On the other hand, corruption or wasteful spending of public expenditures undermines tax compliance and may imply that expenditure reforms should precede tax reform. Sometimes a comprehensive approach may be appropriate and possible: tax reforms in Latvia were successfully aligned with the broader reforms of the state administration, which inter alia aims to improve the capacity of its civil service, rationalize public sector wages, strengthen management of public expenditures, and reduce its vulnerability to corruption. 5. The reforms of tax policy and tax administration should be undertaken in tandem. In many developing countries, tax administration is critical to tax policy, and the limited administrative capacity has become a binding institutional constraint to tax reforms. Hence tax policy reform should take the administrative capacity into account. Tax administration reforms require strong political commitment particularly in environments of perceived high corruption and vested interests. Even with political support they are potentially risky and require appropriate reform strategies.

51
References
Adam, C.S. and Bevan, D.L. (2005) Fiscal deficits and growth in developing countries,
Journal of Public Economics, 89, 571-597. Akitoby, B., Clements, B. Gupta, S. and Inchauste, G. (2006) Public spending, voracity,
and Wagner’s law in developing countries, European Journal of Political Economy, 22, 908 – 924.
Albala-Bertrand, J.M. and Mamatzakis, E.C. (2001) Is public infrastructure productive? Evidence from Chile, Applied Economics Letters, 8, 195-98.
Aschauer, D.A. (2000) Public capital and economic growth: issues of quantity, finance, and efficiency, Economic Development and Cultural Change, 48, 391-406.
Barro, R., 1990. Government spending in a simple model of endogenous growth, Journal of Political Economy, 98, S103– S125.
Barro, R., Sala-I-Martin, X. (1992) Public finance in models of economic growth, Review of Economic Studies, 59, 645–661.
Bevan, D. (2007) Fiscal policy for growth with stability, background paper for Fiscal Policy for Growth and Development project, World Bank.
Bhargava A., Jamison D.T., Lau, L.J. and Murray, C.J.L. (2001) Modeling the effects of health on economic growth, Journal of Health Economics, 20, 423–440.
Besley, T. and R. Burgess (2002), The Political Economy of Government Responsiveness: Theory and Evidence from India, Quarterly Journal of Economics, 1415-1451.
Biletska, N. and Rajaram, A. (2007), Public expenditure and economic growth: insights from a review of evidence from six growth success stories, background paper for Fiscal Policy for Growth and Development project, World Bank.
Blanchard, O. and Perotti, R. (2002) An empirical characterization of the dynamic effects of changes in government spending and taxes on output, Quarterly Journal of Economics, 117, 1329-1368.
Blankenau, W.F. and Simpson, N.B (2004) Public education expenditures and growth, Journal of Development Economics, 73, 583-605.
Bleaney, M, Gemmell, N. and Kneller R. (2001) Testing the endogenous growth model: public expenditure, taxation and growth over the long run, Canadian Journal of Economics, 34, 36-57.
Bloom, D, Canning, D. and Sevilla, J (2004) The effect of health on economic growth: a production function approach ,World Development, 32, 1–13.
Bose, N., Haque, M.E and Osborne, D. (2003) Public expenditure and economic growth. A disaggregated analysis for developing countries. Centre for Growth and Business Cycle Research, Economic Studies, University of Manchester; unpublished.
Bourguignon, F., Carolina, D.-B., and Lofgren, H. (2006) Aid, service delivery and the MDGs in an economy-wide framework, World Bank paper (draft), December 20.
De Avila, D.R and Strauch, R. (2003) Public finances and long-term growth in Europe – evidence from a panel analysis, European Central Bank Working Paper No. 246.
de la Fuente A. (1997) Fiscal policy and growth in the OECD, CEPR Discussion Paper No. 1755.
Dessus, S. and Herrera, R. (2000) Public capital and growth revisited: a panel data assessment, Economic Development and Cultural Change, 48, 407-418.
52
Devarajan S., Swaroop V., and Zou H. (1996), The composition of public expenditure and economic growth, Journal of Monetary Economics, 37, 313-344.
Development Committee (2006), “Fiscal Policy for Growth and Development: An Interim Report”, background paper for the April 2006 meeting of the Development Committee of the World Bank and the IMF.
Easterly, W. (2006) An identity crisis? Examining IMF financial programming, World Development, 34 (6), 964-980.
Easterly, W., T. Irwin and L. Serven (2006), Walking Up the Down Escalator: Public Investment and Fiscal Stability, World Bank mimeo.
Estache, A., M. Gonzales and L. Trujillo (2006), Government Expenditures on Education, Health and Infrastructure: A Naive Look at Levels, Outcomes and Efficiency, World Bank mimeo.
Fedderke, J.W., Perkins, P. and Lutz, J.M. (2006) Infrastructural investment in long-run economic growth: South Africa 1875–2001, World Development, 34, 1037–1059.
Futagami, K.Y, Morita, Y. and Shibata, A (1993) Dynamic analysis of an endogenous growth model with public capital, Scandinavian Journal of Economics, 95, 606-625.
Gemmell, N. (2004), Fiscal policy in a growth framework. Chapter 7 in T. Addison and A. Roe (eds.) TFiscal Policy for Development: Poverty, Reconstruction and Growth. Palgrave MacmillanT, 149-176.
Gemmell, N. (2007) The composition of public expenditure and growth, background paper for Fiscal Policy for Growth and Development project, World Bank.
Ghosh, S. and Gregoriou, A. On the composition of government spending, optimal fiscal policy and endogenous growth: theory and evidence, unpublished paper, World Bank.
Goldsbrough, D. (2006) The nature of the debate between the IMF and its critics, background note for the Working Group on IMF-Supported Programs and Health Expenditure, Center for Global Development.
Gupta, S., Clements, B., Baldacci, E. and Mulas-Granados, C. (2004) The persistence of fiscal adjustments in developing countries, Applied Economics Letters, 11, 209-212.
Gupta, S., Clements, B., Baldacci, E. and Mulas-Granados, C. (2005a), Fiscal policy, expenditure composition, and growth in low-income countries, Journal of International Money and Finance, 24, 441-463.
Gupta S., Baldacci, E., Clements, B., and. Tiongson, E.R. (2005b) What sustains fiscal consolidations in emerging market countries? International Journal of Finance and Economics, 10, 307–321.
Haque, M.E. (2004) The composition of government expenditure and economic growth in developing countries, Global Journal of Finance and Economics, 1, 97-117.
Haque, M.E. and Kim, D.H. (2003) Public investment in transportation and communications and growth: a dynamic panel approach. Centre for Growth and Business Cycle Research, Economic Studies, University of Manchester. Discussion Paper No. 031.
Harberger, A., (1982) The incidence of taxes on income from capital in an open economy: a review of current thinking, HIID Development Discussion Paper No. 139, August, 1982.
Heller, P.S., M. Katz, et.al. (2006), Making Fiscal Space Happen: Managing Fiscal Policy in a World of Scaled-Up Aid, IMF Working Paper, 270.

53
IEO (2007), The IMF and Aid to Sub-Saharan Africa, Independent Evaluation Office report, IMF.
IMF (2005), Fiscal Responsibility Laws, November 2005, IMF. Keefer, P. and S. Khemani (2003), The Political Economy of Public Expenditures, World
Bank Working Paper, 26953. Kneller, R., Bleaney, M. and Gemmell, N. (1999) Fiscal policy and growth: evidence
from OECD countries, Journal of Public Economics, 74, 171-190. Le, Minh Tuan; Blanca Moreno-Dodson; and Jeep Rojchaichaninthorn. 2007.
Expanding Taxable Capacity and Reaching Revenue Potential—Empirical Evidence and Lessons Learned, Background paper for Fiscal Policy for Growth and Development project, World Bank.
Lee, Y. and Gordon, R.H. (2005) Tax structure and economic growth, Journal of Public Economics, 89, 1027-1043.
Li, W. and Sarte, P.-D. (2004) Progressive taxation and long-run growth, American Economic Review, 94, 1705-1716.
M’Amanja, D. and Morrissey (2005) Fiscal policy and economic growth in Kenya. University of Nottingham, CREDIT Research Paper No. 05/06
Milbourne, R., Otto, G. and Voss, G. (2003) Public investment and economic growth, Applied Economics, 35, 527–540.
Miller S., and Russek F. (1997) Fiscal structures and economic growth: international evidence, Economic Inquiry, 35, 603-613.
Myles, D. (2000) Taxation and economic growth, Fiscal Studies, 21, 141-168. Nijkamp, P. and Poot, J (2004) Meta-analysis of the effects of fiscal policies on long-run
growth, European Journal of Political Economy, 20, 91-124. Padovano, F. and Galli, E. (2002) Comparing the growth effects of marginal vs.
average tax rates and progressivity, European Journal of Political Economy, 18, 529-544.
Paternostro, S., Rajaram, A. and Tiongson, E (2007) How does the composition of public spending matter? Oxford Development Studies, 35 (1).
Perotti, R. (2002) Estimating the effects of fiscal policy in OECD countries. Bocconi University, IGIER Working Paper No. 276.
Roy, R., Heuty. A. and Letouze, E. Fiscal space for public investment: Towards a human development approach, UNDP Paper prepared for the G-24 Technical Meeting, Singapore, September 2006.
Schuknecht, L. and Tanzi, V. (2005) Reforming public expenditure in industrialized countries. Are there trade-offs? European Central Bank Working Paper No. 435.
Segura-Ubiergo, A., Simone, A. and Gupta, S. (2006) New evidence on fiscal adjustment and growth in transition economies. IMF Working Paper No. WP/06/244.
Tanzi, V. (2006) Death of an Illusion? Decline and Fall of High Tax Economies. Politea: London.
Zee, H. (2004) World Trends in Tax Policy: An Economic Perspective. Intertax, Vol. 32, Issue 8/9.