fiscal development and state finances -...
TRANSCRIPT

The State of Karnataka's finances is good as gauged from the performance of broad fiscal indicators and has largely been within the fiscal rules prescribed. Driven by various fiscal consolidation measures, Karnataka has managed its expenditure well, even while enhancing its revenues. The State's fiscal deficit declined marginally from 2.98% in 2013-14(RE)to 2.92% of GSDP in 2014-15(BE), while the capital outlay has increased marginally from 99.02 % in 2013-14(RE) to 99.86% of Gross Fiscal Deficit in 2014-15(BE).The State's revenue receipts have revealed further gains with their share increasing to 16.21% of GSDP in 2014-15 from 15.67% in 2013-14(RE). Further it is encouraging to note that the growth in Revenue receipts is primarily due to the growth of tax revenue. The State continues to have an overall revenue surplus, albeit at reduced levels. In 2014-15 development expenditure increased by about 15% compared to 2013-14(RE). However, non-tax-revenues continued to remain at low levels. Education, Water resources, Agriculture and Allied Services are significant components to the State's
development expenditure. Although, capital outlay has increased in its absolute size, decline in its share to Gross State Domestic Product is a matter of concern.
3.1 FISCAL CONSOLIDATION
The State's fiscal consolidation efforts have continued to be effective with all the fiscal indicators contained within the stipulated limits of the Karnataka Fiscal Responsibility Act, 2002 (KFRA). The State has chosen on its own volition to bring in fiscal discipline in the management of its finances. The Government has been maintaining revenue surplus since 2004-05, as mandated by the KFRA. Over the last few years, the fiscal deficit could also be maintained within 3% of GSDP as mandated by the KFRA, except in 2008-09 and 2009-10 when it went up to 3.2%, as a result of additional expenditure for economic stimulation prompted by the Government of India.
Time trends in fiscal and revenue deficits for the period 2004-05 to 2014-15 are presented in Figure 3.1.
27Economic Survey of Karnataka 2014-15
2.30 2.01
2.28 2.22
3.23 3.24
2.80 2.83
2.78
2.982.92
-1.14
-1.37
-2.02
-1.47
-0.6 -0.44
-1.1
-1.08
-0.36 -0.01 -0.04
0.00
0.50
1.00
1.50
2.00
2.50
3.00
3.50
RD
FD
Figure 3.1: Revenue Deficit/Fiscal Deficit as a % GSDP
FISCAL DEVELOPMENT AND STATE FINANCES
3

3.2 KARNATAKA VIS-A-VIS-OTHER STATES
Over the years, the State's major fiscal indicators have compared well with the 'All states' average. This is reflected in the information on various fiscal indicators presented in Table 3.1. The State has achieved revenue surplus consistently. Further, the State has a capital outlay of 101.03% in the GFD as compared to 110.52% of all States average in 2013-14(BE). The fact that the entire fiscal deficit is devoted to capital Expenditure is welcome as it helps sustain rapid growth. However, the State has a challenging task of restoring the larger revenue surpluses achieved in the recent past to enable higher infrastructure investments. Other important expenditure indicators such as proportion of State tax revenue in the revenue expenditure and non-development expenditure in aggregate disbursements place Karnataka in a better position.
A comparative perspective of Karnataka's fiscal deficit with other Southern states is presented in Figure 3.2.
3.3 STATE FINANCES
The state's fiscal consolidation efforts have been largely revenue led owing to tax reforms and toning up of tax administration that have yielded buoyant revenue since the enactment of the FRA. The State's revenue receipts, as a percent of GSDP has increased marginally from 15.23% in 2007-08 to 16.21% in 2014-15 (Table 3.2). The global economic meltdown has a considerable negative impact on the State's tax revenues during 2008-09 and 2009-10 bringing down the share of revenue receipts to GSDP to 14.07% and 14.26% respectively. However, the State's revenue resources are showing signs of recovery from 2010-11 (15.28%) and further estimated to increase to 16.21% in 2014-15.
On the expenditure front, capital (net) outlay as percent of GSDP has decreased from 3.11 in 2007-08 to 2.91 in 2014-15. This poses a great challenge and is a matter of concern for Karnataka due to the
28 Economic Survey of Karnataka 2014-15
Table 3.1: Major Fiscal Indicators of Karnataka
RD = Revenue Deficit; GFD = Gross Fiscal Deficit; STR =State Tax Revenue Source: RBI-Study of budget, 2013-14, Statement 4.
Fiscal Indicators
2008-09 (Accounts)
2009-10 (Accounts)
2010-11 (Accounts)
2011-12 (Accounts)
2012-13 (RE)
2013-14 (BE)
KAR All
States KAR
All States
KAR All
States KAR
All States
KAR All
States KAR
All States
RD/GFD -18.70 -9.4 -14.90 16.40 -39.00 -1.90 -38.13 -14.23 -6.17 -8.41 -3.44 -19.48
Capital Outlay/ GFD
113.00 106.00 111.60 79.00 125.00 94.10 126.10 101.72 97.64 99.23 101.03 110.52
Non-devpt. Expenditure/ Aggregate disbursement
23.60 28.90 21.10 30.30 20.20 30.80 20.00 29.70 21.00 28.10 22.00 28.90
STR/RE 66.40 47.20 64.3 45.40 71.20 49.40 88.38 75.66 78.62 72.41 79.60 74.95

0
1
2
3
4
5
6
7
AP Karnataka Kerala TN
29Economic Survey of Karnataka 2014-15
Figure 3.2: Karnataka's Fiscal Deficit (as a % of GSDP) Compared with the Southern States
infrastructure inadequacies prevailing in the State. In this context, the Expenditure Reforms Commission (ERC) constituted by the Government of Karnataka has recommended that capital outlay needs to be insulated from revenue adversities.
Revenue receipts and Composition:
The composition of revenue receipts from 2007-08 to 2014-15, accounts for the State's remarkable performance in its own tax collections (Table 3.3). The State's own tax revenue constitutes the largest share, it has increased from 9.62% of GSDP in 2007-08 to 10.20% of GSDP in 2014-15 (BE). There is a slight decrease in the share of central taxes from 2007-08(2.51%) to 2014-15 (2.42%). Share of grants from the central Government has increased 1.86% of GSDP to 2.94% of GSDP, during the reference period. However, non-tax revenue revealed a decline and warrants attention.
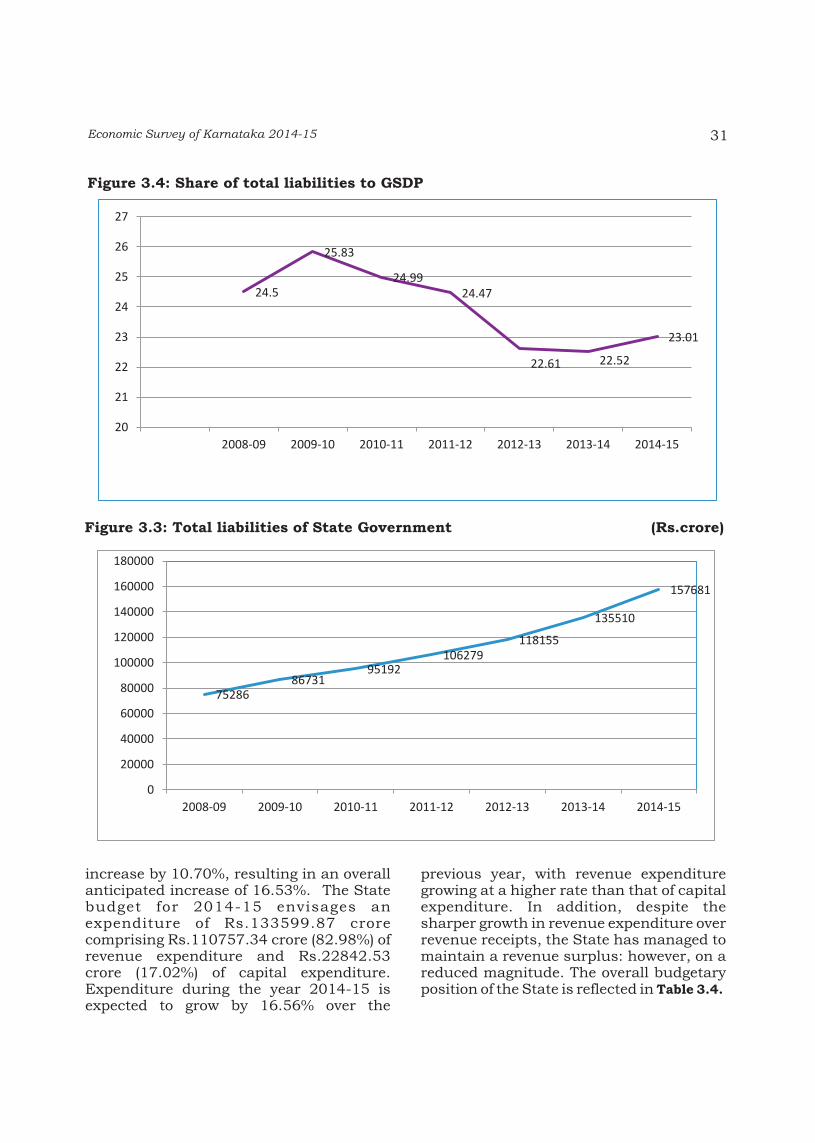
Liabilities
The total liabilities of the State Government increased from Rs.75286 crore in 2008-09 to Rs.157681 crore in 2014-15BE growing at a CAGR of 13.11%. The total liabilities are however, within the limit of 25% of GSDP prescribed by the 13th Finance Commission (Figures 3.3 & 3.4).
3.4 BUDGETARY DEVELOPMENTS IN2014-15
3.4.1 Highlights
Owing to a recovery in the macroeconomic situation, the State has been in a position to enhance revenue collection in 2014-15. Receipts are expected to be Rs.133573.34 crore in 2014-15BE, compris ing Rs.111038.62 crore (83.13%) of revenue receipts and Rs.22534.72 crore (16.87%) of capital receipts. As compared to 2013-14, revenue receipts are expected to increase by 17.79% and capital receipts are expected to
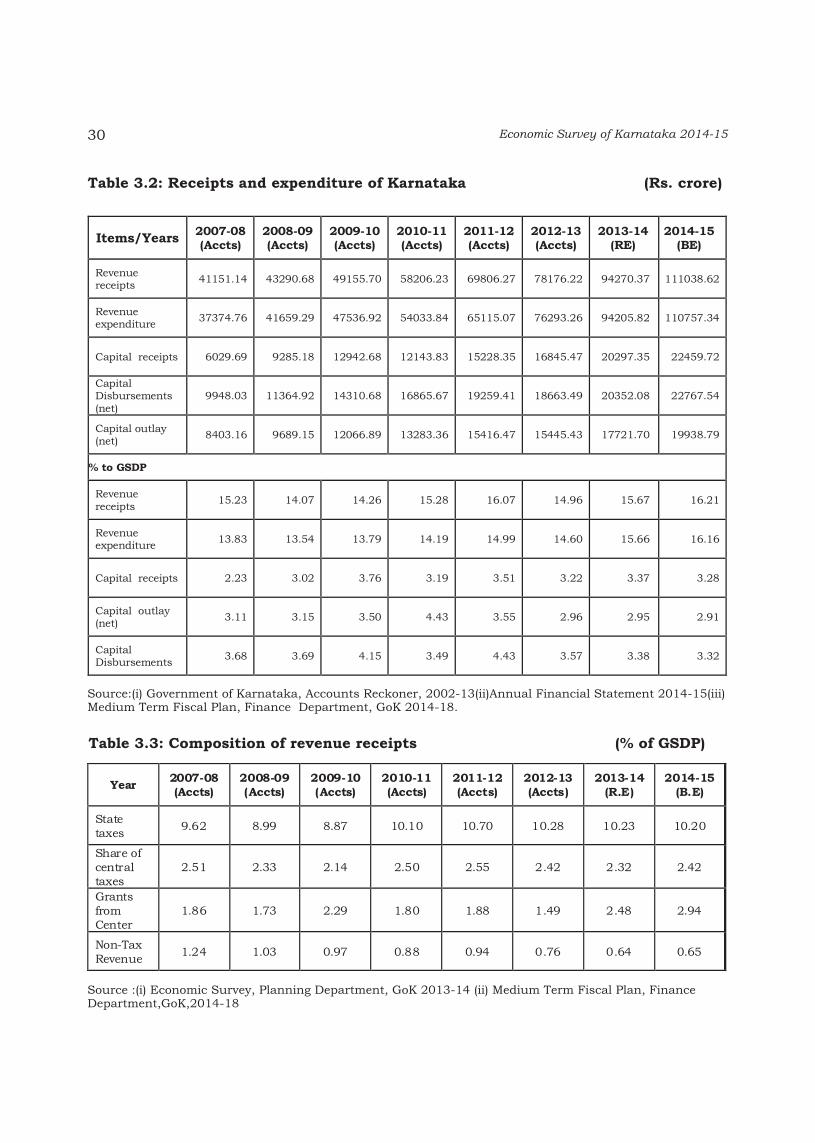
Table 3.3: Composition of revenue receipts (% of GSDP)
Source :(i) Economic Survey, Planning Department, GoK 2013-14 (ii) Medium Term Fiscal Plan, Finance Department,GoK,2014-18
30 Economic Survey of Karnataka 2014-15
Table 3.2: Receipts and expenditure of Karnataka (Rs. crore)
Source:(i) Government of Karnataka, Accounts Reckoner, 2002-13(ii)Annual Financial Statement 2014-15(iii) Medium Term Fiscal Plan, Finance Department, GoK 2014-18.
Items/Years 2007-08 (Accts)
2008-09 (Accts)
2009-10 (Accts)
2010-11 (Accts)
2011-12 (Accts)
2012-13 (Accts)
2013-14 (RE)
2014-15 (BE)
Revenue receipts
41151.14 43290.68 49155.70 58206.23 69806.27 78176.22 94270.37 111038.62
Revenue expenditure
37374.76 41659.29 47536.92 54033.84 65115.07 76293.26 94205.82 110757.34
Capital receipts 6029.69 9285.18 12942.68 12143.83 15228.35 16845.47 20297.35 22459.72
Capital Disbursements (net)
9948.03 11364.92 14310.68 16865.67 19259.41 18663.49 20352.08 22767.54
Capital outlay (net)
8403.16 9689.15 12066.89 13283.36 15416.47 15445.43 17721.70 19938.79
% to GSDP
Revenue receipts
15.23 14.07 14.26 15.28 16.07 14.96 15.67 16.21
Revenue expenditure
13.83 13.54 13.79 14.19 14.99 14.60 15.66 16.16
Capital receipts 2.23 3.02 3.76 3.19 3.51 3.22 3.37 3.28
Capital outlay (net)
3.11 3.15 3.50 4.43 3.55 2.96 2.95 2.91
Capital Disbursements
3.68 3.69 4.15 3.49 4.43 3.57 3.38 3.32
Year 2007-08 (Accts)
2008-09 (Accts)
2009-10 (Accts)
2010-11 (Accts)
2011-12 (Accts)
2012-13 (Accts)
2013-14 (R.E)
2014-15 (B.E)
State taxes
9.62 8.99 8.87 10.10 10.70 10.28 10.23 10.20
Share of central taxes
2.51 2.33 2.14 2.50 2.55 2.42 2.32 2.42
Grants from Center
1.86 1.73 2.29 1.80 1.88 1.49 2.48 2.94
Non-Tax Revenue
1.24 1.03 0.97 0.88 0.94 0.76 0.64 0.65
31Economic Survey of Karnataka 2014-15
Figure 3.3: Total liabilities of State Government (Rs.crore)
75286 86731
95192 106279
118155
135510
157681
0
20000
40000
60000
80000
100000
120000
140000
160000
180000
2008-09 2009-10 2010-11 2011-12 2012-13 2013-14 2014-15
Figure 3.4: Share of total liabilities to GSDP
24.5
25.83
24.99 24.47
22.61 22.52
23.01
20
21
22
23
24
25
26
27
2008-09 2009-10 2010-11 2011-12 2012-13 2013-14 2014-15
increase by 10.70%, resulting in an overall anticipated increase of 16.53%. The State budget for 2014-15 envisages an expenditure of Rs.133599.87 crore comprising Rs.110757.34 crore (82.98%) of revenue expenditure and Rs.22842.53 crore (17.02%) of capital expenditure. Expenditure during the year 2014-15 is expected to grow by 16.56% over the
previous year, with revenue expenditure growing at a higher rate than that of capital expenditure. In addition, despite the sharper growth in revenue expenditure over revenue receipts, the State has managed to maintain a revenue surplus: however, on a reduced magnitude. The overall budgetary position of the State is reflected in Table 3.4.
32 Economic Survey of Karnataka 2014-15
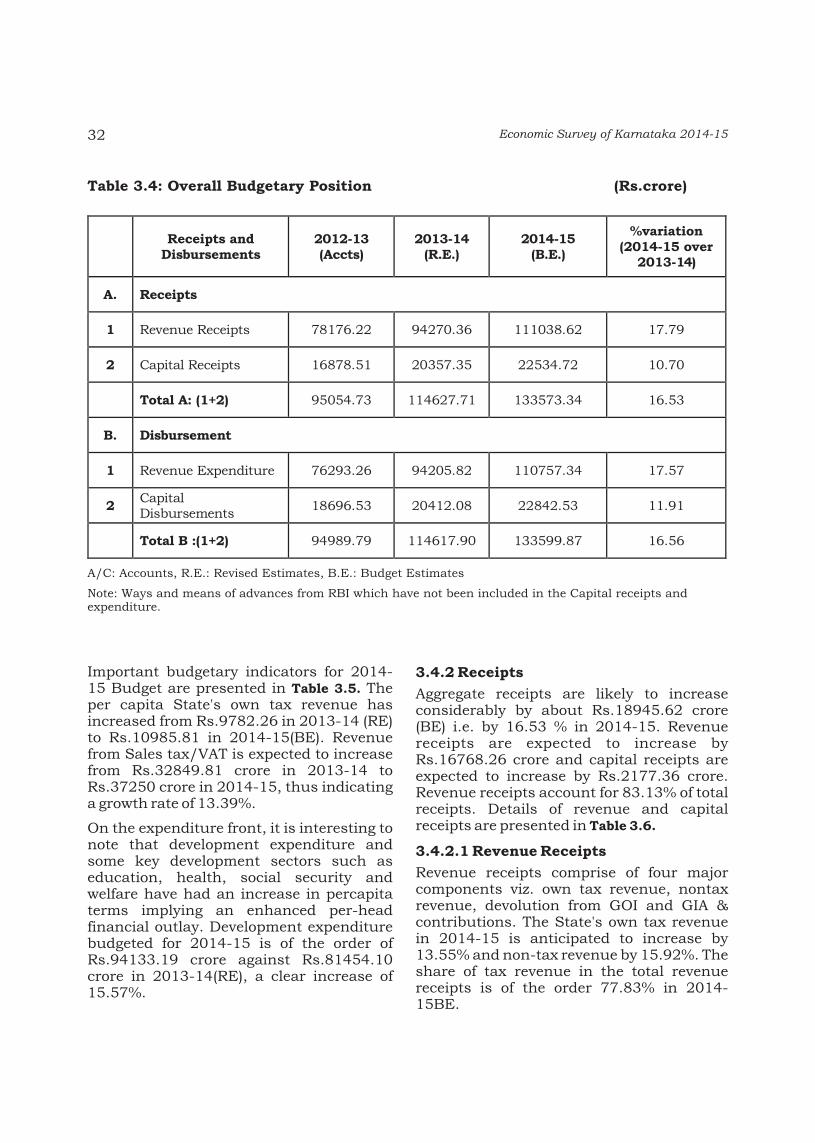
Table 3.4: Overall Budgetary Position (Rs.crore)
A/C: Accounts, R.E.: Revised Estimates, B.E.: Budget Estimates
Note: Ways and means of advances from RBI which have not been included in the Capital receipts and expenditure.
Receipts and
Disbursements 2012-13 (Accts)
2013-14 (R.E.)
2014-15 (B.E.)
%variation (2014-15 over
2013-14)
A. Receipts
1 Revenue Receipts 78176.22 94270.36 111038.62 17.79
2 Capital Receipts 16878.51 20357.35 22534.72 10.70
Total A: (1+2) 95054.73 114627.71 133573.34 16.53
B. Disbursement
1 Revenue Expenditure 76293.26 94205.82 110757.34 17.57
2 Capital Disbursements
18696.53 20412.08 22842.53 11.91
Total B :(1+2) 94989.79 114617.90 133599.87 16.56
Important budgetary indicators for 2014-15 Budget are presented in Table 3.5. The per capita State's own tax revenue has increased from Rs.9782.26 in 2013-14 (RE) to Rs.10985.81 in 2014-15(BE). Revenue from Sales tax/VAT is expected to increase from Rs.32849.81 crore in 2013-14 to Rs.37250 crore in 2014-15, thus indicating a growth rate of 13.39%.
On the expenditure front, it is interesting to note that development expenditure and some key development sectors such as education, health, social security and welfare have had an increase in percapita terms implying an enhanced per-head financial outlay. Development expenditure budgeted for 2014-15 is of the order of Rs.94133.19 crore against Rs.81454.10 crore in 2013-14(RE), a clear increase of 15.57%.
3.4.2 Receipts
Aggregate receipts are likely to increase considerably by about Rs.18945.62 crore (BE) i.e. by 16.53 % in 2014-15. Revenue receipts are expected to increase by Rs.16768.26 crore and capital receipts are expected to increase by Rs.2177.36 crore. Revenue receipts account for 83.13% of total receipts. Details of revenue and capital receipts are presented in Table 3.6.
3.4.2.1 Revenue Receipts
Revenue receipts comprise of four major components viz. own tax revenue, nontax revenue, devolution from GOI and GIA & contributions. The State's own tax revenue in 2014-15 is anticipated to increase by 13.55% and non-tax revenue by 15.92%. The share of tax revenue in the total revenue receipts is of the order 77.83% in 2014-15BE.

33Economic Survey of Karnataka 2014-15
Table 3.5 Important Budgetary Indicators: Karnataka
R.E.: Revised Estimates, B.E.: Budget Estimate
Per capita are calculated on projected population of 2013 and 2014 which is based on 2001&2011 population census
Indicator Unit 2013-14
(R.E.)
2014-15
(B.E)
1. Aggregate Receipts (Revenue + Capital) Rs. crore 114627.71 133573.34
2. Revenue Receipts Rs. crore 94270.36 111038.62
3. State's Own Tax Revenue Rs.crore 61530.40 69869.75
4. Per Capita State's Own Tax Revenue Rupees 9782.26 10985.81
5. Sales Tax / VAT Collection Rs. crore 32849.81 37250.00
6. Share of Sales Tax /VAT in the State's Own Tax Revenue
% 53.39 53.31
7. Non-Tax Revenue including Grants from the Centre
Rs. crore 18764.97 24608.86
8. Share of Non-Tax Revenue in Revenue Receipts
% 19.91 22.16
9. Debt Receipts Rs.crore 17978.85 25042.26
10. Share of Debts Receipts in Aggregate Receipts
% 15.68 18.75
11. Per Capita Receipts Rupees 18223.80 21002.10
12. Aggregate Expenditure (Revenue +
Capital)
Rs. crore 114617.90 133599.87
13. Developmental Expenditure Rs. crore 81454.10 94133.19
14. Per Capita Development Expenditure Rupees 12949.78 14800.82
15. Share of Developmental Expenditure in
Total Expenditure
% 71.07 70.46
16. Per Capita Expenditure - Social Security & Welfare
Rupees 1488.87 1730.58
17. Per Capita Expenditure on Health, Family Welfare, Water Supply and Sanitation
Rupees 1195.21 1365.95
18. Per capita Expenditure on Education,
Sports, Art and Culture
Rupees 2807.59 3290.89
a) Tax Revenues: Karnataka's Tax to GSDP ratio (tax effort), has been good and compares well with other Indian States. The State's own tax revenues (SOTR) increased from Rs.27646 crore in 2008-09 to
Rs.69869.75 crore during 2014-15 at a CAGR of 16.71% (Figure 3.5).
Composition of the revenue receipts as described earlier reveals that the State's own tax revenue has performed very well

34 Economic Survey of Karnataka 2014-15
Table 3.6: Revenue and Capital Receipts, Karnataka 2012-13 to 2014-15
(Rs.crore)
A/C: Accounts, RE: Revised Estimates. BE: Budget Estimates, W & M = Ways & Means, MB =Market Borrowings
Source: Annual Financial Statement 2014-15
C ategory o f R ece ip ts 2012 -13 (A ccts)
2013 -14 (R E )
2014 -15 (B .E )
% V ariation 2014 -15
over 2013 -14
2012 -13
(A ccts)
2013 -14
(R .E )
2014 -15 (B .E )
L R even u e R ece ip ts % to to ta l Reven ue Rece ipts
A . S ta te 's Tax R even u e
66400 .70 75505 .40 86429 .76 14 .47 84 .94 80 .09 77 .84
(i) Taxes on In com e an d E xpend itu re
715 .15 850 .00 973 .00 14 .47 0 .91 0 .90 0 .88
(ii)
Taxes on P roperty & C ap ita l T ran saction s o f w h ich
53038 .40 60680 .40 68896 .75 13 .54 67 .84 64 .37 62 .05
(a ) S a les Tax / V A T
28414 .44 32849 .81 37250 .00 13 .39 36 .35 34 .85 33 .55
(b ) Taxes on veh ic les
3829 .52 3800 .00 4350 .00 14 .47 4 .90 4 .03 3 .92
(c ) S ta te E xcise 11069 .73 12600 .00 14430 .00 14 .52 14 .16 13 .37 13 .00
(d ) Taxes on G oods & Passengers
2180 .71 2525 .00 2890 .00 14 .46 2 .79 2 .68 2 .60
(e ) O th ers 7544 .00 8905 .59 9976 .75 12 .03 9 .65 9 .45 8 .98
S ta te 's O w n Tax R even u e(i+ ii)
53753 .56 61530 .40 69869 .75 13 .55 68 .75 65 .27 62 .93
(iii) Tax D evo lu tion from C en tre
12647 .14 13975 .00 16560 .01 18 .50 16 .18 14 .82 14 .91
B . N on -tax R even u es
3966 .11 3859 .03 4473 .43 15 .92 5 .07 4 .09 4 .03
C . G ran ts - in - a id from C en tra l G overn m en t
7809 .42 14905 .94 20135 .43 35 .08 9 .99 15 .81 18 .03
Tota l I: R even u e R ece ip ts (A +B +C )
78176 .22 94270 .37 111038 .62 17 .79 100 .00 100 .00 100 .00
II. C ap ita l R ece ip ts
(i) Loan s from G ovt. o f In d ia
1348 .98 1227 .85 1729 .93 40 .89 7 .99 6 .03 7 .68
(ii) In tern a l D eb t (N et o f W & M & M B )
10504 .31 15156 .39 18904 .04 24 .73 62 .23 74 .45 83 .89
(iii) Pu b lic A /c (N e t) 4834 .06 3799 .97 1733 .02 -54 .39 28 .64 18 .67 7 .69
(iv ) R ecovery o f Loan s & A dvan ces
157 .61 113 .14 92 .73 -18 .04 0 .93 0 .56 0 .41
(v ) C on tin gen cy Fu n d (N et)
0 .51 0 .00 0 .00 0 .00 0 .00 0 .00 0 .00
(v i) M isc . C ap ita l R ece ip ts
33 .04 60 .00 75 .00 25 .00 0 .20 0 .29 0 .00
Tota l II: C ap ita l R ece ip ts (i) to (v i)
16878 .51 20357 .35 22534 .72 10 .70 100 .00 100 .00 100 .0
A G G R E G A TE R E C E IPTS : I+ II
95054 .73 114627 .72 133573 .34 16 .53
C O N S O LID A TE D FU N D O F R E C E IPTS
91831 .53 112422 .35 136248 .61 21 .19
To ta l Tax R even u e as p er cen t o f Tota l R ece ip ts
69 .90 65 .90 64 .70 -1 .77

35Economic Survey of Karnataka 2014-15
during the period under reference. Tax revenue mainly includes taxes on income & expenditure, entry tax, property and capital transactions, VAT, sale of goods, commodities & services, State excise, motor vehicle taxes and the State's share in central taxes. The budgeted tax revenue is anticipated at Rs.86429.76 crore in 2014-15 as against Rs.75505.40 crore in 2013-14. Sales tax/VAT is the main source of tax revenue comprising about 53.31% of own tax revenue in 2014-15, with a growth rate of 13.39%. Revenue from State excise is expected to increase by 14.52%. Taxes on income and expenditure will be 14.47% high as compared to the previous year. Taxes on goods and passenger services have increased by 14.46 %. The increase in overall revenue receipts is 17.79 %.
b) The State's share in central taxes is budgeted to increase by Rs.2585.01crore i.e. by 18.50%.
c) Non - tax Revenues: Non-tax revenue includes receipts from social, economic and general services, interest and dividends. The budget for 2014-15 has revenue from the above three services is Rs.4473.43 crore as against Rs.3859.03 crore in 2013-14(RE) (indicating an increase of 15.92%). This is an important fiscal challenge faced by the State which warrants necessary measures to recover user charges at optimal levels. The ratio of non-tax revenue to total receipts has been continuously declining over the years. Further, the State has one of the lowest non-tax revenues to the GSDP ratios in the country. It hovered around the 1% mark over the past two to three years.
Figure 3.5 State's own tax revenue
27646 30579 38473
46476 53754
61530 69870
0
10000
20000
30000
40000
50000
60000
70000
80000
2008-09 2009-10 2010-11 2011-12 2012-13 2013-14 BE 2014-15
Rs.
cro
re
Yr
Figure 3.6: Tax effort (Tax/GSDP)
9 9.1
10.1
10.7
10.28
10.23
10.20
8
8.5
9
9.5
10
10.5
11
2008-09 2009-10 2010-11 2011-12 2012-13 2013-14(RE) 2014-15(BE)
Pe
rce
nta
ge
Yr

36 Economic Survey of Karnataka 2014-15
This is due to low recovery of costs. In many departments, the revision of user charges, fees, fines and other such non-tax receipts have not taken place for many years. Even with revision of rates and better collection mechanisms, increase in revenues from this avenue may not be large due to existing low base. Expenditure Reform Commission has made a number of recommendations to enhance revenues from user charges.
d) Grants from the Government of India: Grants are expected to increase from Rs.14905.94 crore in 2013-14(RE) to Rs.20135.43 crore in 2014-15(BE)(an increase of 35.08%). The GoI has initiated the process in 2014-15 to route all the central grants of CSS/CPS through State Plan.
Table 3.7: Expenditure Indicators in Karnataka (Rs. crore)
Particulars 2008-09
Accts 2009-10
Accts 2010-11
Accts 2011-12
Accts 2012-13
Accts 2013-14
(R.E) 2014-15
(B.E)
Revenue Receipts 43290.68 49155.70 58206.23 69806.27 78176.22 94270.37 111038.62
Revenue Expenditure
41659.29 47536.92 54033.83 65115.07 76293.26 94205.82 110757.34
Development Expenditure
27009.63 32300.57 51626.38 60929.69 68067.53 81454.10 94133.19
Social Services 15872.99 19118.86 22107.82 29413.15 34151.07 39526.30 47095.96
Economic Services 11136.64 13181.71 14892.44 31516.54 33916.47 41927.79 47037.23
General Services 12275.57 12762.34 14055.09 17070.97 20770.32 24577.14 30341.16
Interest Payments 4532.00 5213.00 5641.00 6061.85 6833.00 7800.00 9700.00
Wage Bill 9927.00 10296.00 11086.00 11543.00 15700.00 16757.00 23315.00
Pensions 4113.00 3408.00 4070.00 5436.00 7227.00 8100.00 9350.00
Capital Expenditure
9870.29 12136.68 13355.16 15505.65 15478.47 17781.70 20013.78
Total Expenditure (RE+CE)
51529.58 59673.60 67388.99 80620.72 91771.73 111987.52 130771.12
Consolidated Debt 71410.00 83482.00 91943.00 103030.00 116767.00 133432.00 153447.00
Total Consolidated Fund
60178.38 62963.51 71934.07 85756.15 96601.16 116212.51 138008.16

37Economic Survey of Karnataka 2014-15
3.4.2.2 Capital Receipts
Capital receipts include loans from Government of India, internal debt - ways and means, open market loans (net), public account, recoveries of loans and advances and contingency funds (net). Capital receipts of Rs.22534.72 crore in 2014-15(BE) accounts for an increase of 10.70% over 2013-14(RE) level. Loans from the Government of India account for Rs. 1729.93 crore i.e. 7.68% of the capital receipts and are expected to increase by 40.89% as compared to the previous year. There is an increase in internal debt-open market loans (Net) by 24.73% in 2014-15 as compared to the previous year whereas recovery of loans and advances has decreased by 18.04%.
3.4.3 Expenditure
Expenditure indicators (Table 3.8) reveal that the State's total expenditure under Consolidated Fund as a proportion of the GSDP has marginally declined from 22.44% in 2008-09 to 20.14% in 2014-15 B.E. The share of expenditure on social services has increased from 5.92% of GSDP in 2008-09 to 6.87 % in 2014-15 while the share of capital expenditure decreased from 3.68% of GSDP to 2.92% of GSDP during the same period which is a matter of concern. The share of development expenditure has significantly increased from 10.07% to 13.74% while the share of interest payments has declined from 1.69% to 1.42%.
3.4.3.1 Functional Categories of Expenditure
Services provided by the Government are categorized broadly under three functional categories-General, Social and Community and Economic services and reflect the priorities of the Government by its various functions performed. The trends and composition of the functional categories of expenditure from 2008-09 reveal that the focus on social services covering the sectors such as education, health, housing, water supply etc., has significantly increased as
reflected in the share of expenditure from 5.92% of GSDP in 2008-09 to 6.87% of GSDP in 2014-15. The share of expenditure on economic services has sharply increased from 4.15% of GSDP to 6.86% of GSDP while that of general services has declined from 4.58% of GSDP to 4.43% of GSDP during the reference period. The increase in social and economic services is a welcome development given the human development and infrastructure concerns of the state.
3.4.3.2 Development Expenditure: An Inter-State Comparison
The State has a larger size of per capita development expenditure as compared to the National average and that of many other States. Development expenditure comprises of spending incurred by the Government on programs relating to the social and economic services which, in turn, contribute to the social and economic development of the State. The per capita development expenditure in Karnataka during 2011-12, 2012-13(RE) and 2013-14(BE) was Rs.9972, Rs.11853 and Rs.13246 respectively as compared to all State's average of Rs.7044, Rs.8778 and Rs.9535. Karnataka has the highest level of per capita development expenditure compared to major states as can be seen in Table 3.9.
3.4.3.3 Expenditure Highlights: 2014-15
Sector wise break-up of development and non-development expenditures is presented in Table 3.10 and the corresponding revenue, capital and loan accounts are given in Appendix 3.3. The broad trends in development and non-development expenditure are depicted in Figure 3.7.
The expenditure on social services is anticipated to increase by 19.15 %with a net increase of Rs.7569.66 crore, from Rs.39526.31 crore in 2013-14 to Rs .47095 .96 c r o r e i n 2014 -15 . Expenditure on economic services is expected to increase by 12.19% from Rs.41927.79 crore in 2013-14 to

38
Rs .47037 .23 c r o r e i n 2014 -15 . Development expenditure on social security and social welfare in 2014-15 is anticipated to go up by 17.53%; housing and urban development has increased by 44.50% over the previous year. Water and power development followed by agriculture and allied services have large share in the economic Services, while in social services, education sector followed by Social security and welfare gets the largest share.
Non-development expenditure is expected to increase to Rs.39466.69 crore in 2014-15 from Rs.33163.80 crore in 2013-14, accounting for 19.01% increase. Repayment of loans to Government of India and discharge of internal debt
account has increased to Rs.2352.15 crore in 2014-15 compared to Rs.2216.27 crore in 2013-14. Interest payments in the current year have increased to Rs.10200.00 crore compared to Rs.7800 crore in 2013-14. Expenditure on administrative services is anticipated to increase by 30.81%, while on pension and miscellaneous general services, an increase of 15.30% is seen as compared to 2013-14. Expenditure on the organs of the State has increased marginally by 3.84% over the previous year.
3.4.3.4 Plan and Non-Plan Expenditure
Plan and non-plan expenditure details are presented in Table 3.11. Of the aggregate expenditure of Rs.133599.87 crore
Economic Survey of Karnataka 2014-15
Table: 3.8: Expenditure Indicators in Karnataka (%of GSDP)
Particulars 2008-09
Accts 2009-10
Accts 2010-11
Accts 2011-12
Accts 2012-13
Accts 2013-14
(R.E) 2014-15
(B.E)
Revenue Receipts 16.14 14.64 15.28 16.07 14.96 15.67 16.20
Revenue Expenditure 15.54 14.16 14.19 14.99 14.60 15.66 16.16
Development Expenditure
10.07 13.38 13.55 14.03 13.02 13.54 13.74
Social Services 5.92 5.69 5.80 6.77 6.53 6.57 6.87
Economic Services 4.15 3.93 3.91 7.26 6.49 6.97 6.86
General Services 4.58 3.80 3.69 3.93 3.97 4.08 4.43
Interest Payments 1.69 1.55 1.48 1.40 1.31 1.30 1.42
Wage Bill 3.70 3.07 2.91 2.66 3.00 2.79 3.40
Pensions 1.53 1.02 1.07 1.25 1.38 1.35 1.36
Capital Expenditure 3.68 3.61 3.51 3.57 2.96 2.95 2.92
Total Expenditure (RE+CE)
19.22 17.78 17.69 18.56 17.56 18.61 19.08
Consolidated Debt 26.63 24.86 24.14 23.72 22.34 22.18 22.39
Total Consolidated Fund
22.44 18.75 18.89 19.75 18.48 19.31 20.14

39Economic Survey of Karnataka 2014-15
State 2011-12 (Accts) 2012-13 (R.E) 2013-14 (B.E)
Andhra Pradesh 9308.51 11282.51 12895.59
Assam 5434.08 8911.35 10062.42
Bihar 3741.35 5605.68 5688.22
Gujarat 8600.33 11064.52 11857.83
Karnataka 9972.18 11853.30 13246.12
Kerala 8120.12 10210.21 12086.04
Madhya Pradesh 7987.59 7991.61 8607.73
Maharashtra 8687.44 9940.83 10544.17
Orissa 6625.30 7701.79 8851.89
Punjab 6151.62 10228.05 10867.24
Rajasthan 6224.49 8589.15 9307.64
Tamilnadu 9553.40 11303.40 11884.88
Total: All States 7044.13 8778.48 9534.56
Table 3.9: Per- Capita Development Expenditure in select states (Rs.)
Note: Per- capita development expenditure is calculated using the projected population of 2011, 2012 and 2013
Source: RBI-A Study of Budget 2013-14, Statement 11
Figure 3.7: Development and Non Development Expenditure
10.51 10.07
13.38 13.55 14.03 13.02 13.54 13.74
5.47 5.46 5.06 5.08 5.42 5.15 5.51 5.76
0
2
4
6
8
10
12
14
16
2007-08 2008-09 209-010 2010-11 2011-12 2012-13 2013-14 2014-15
% t
o G
SDP
Year
Development Exp Non-Development Exp

40 Economic Survey of Karnataka 2014-15
Table 3.10: Trends in Key Expenditure Components (Rs.crore)
Category of Expenditure 2012-13 (Accts)
% 2013-14
(R.E) %
2014-15 (B.E)
%
Percent Variation
(2014-15over
2013-14)
I Developmental Expenditure
A Economic Services (of which)
33916.46 49.83 41927.79 51.47 47037.23 49.97 12.19
1 Agriculture & Allied Services
8214.44 12.07 14634.02 17.97 14190.27 15.07 -3.03
2 Rural Development 2377.75 3.49 3229.00 3.96 5143.74 5.46 59.30
3 General Economic Services
1346.55 1.98 1669.10 2.05 2002.25 2.13 19.96
4 Water & Power Development
14188.39 20.84 13116.10 16.10 17008.51 18.07 29.68
5 Industry and Minerals
919.27 1.35 1374.62 1.69 1420.82 1.51 3.36
6 Transport and Communication
6707.24 9.85 7638.56 9.38 6895.98 7.33 -9.72
7 Others 162.82 0.24 266.39 0.33 375.66 0.40 41.02
B Social Services (of which)
34151.07 50.17 39526.31 48.53 47095.97 50.03 19.15
8 Education, Sports, Art and Culture
14985.70 22.02 17659.77 21.68 20930.09 22.23 18.52
9
Medical & Public Health, Family Welfare, Water supply & Sanitation
6461.50 9.49 7517.86 9.23 8687.45 9.23 15.56
10 Social Security & Welfare Including SC & ST Welfare
7800.32 11.46 9365.02 11.50 11006.46 11.69 17.53
11 Housing and Urban Development
2404.08 3.53 2679.21 3.29 3871.36 4.11 44.50
12 Information and Publicity
76.97 0.11 84.95 0.10 91.86 0.10 8.13
13 Others 2422.50 3.56 2219.50 2.72 2508.75 2.67 13.03
Total Development Expd. (A+B)
68067.53 100.00 81454.10 100.00 94133.20 100.00 15.57
Contd....

41Economic Survey of Karnataka 2014-15
II Non-developmental Expenditure
(a) Revenue Expenditure under General services
20180.84 74.96 23988.05 72.33 29570.19 74.92 23.27
(i) Organs of the State 779.10 2.89 1174.49 3.54 1219.57 3.09 3.84
( i i ) Fiscal Services 820.77 3.05 1073.74 3.24 1183.36 3.00 10.21
( i i i ) Interest payment & servicing of debts
6833.43 25.38 7800.00 23.52 10200.00 25.84 30.77
( iv ) Administrative Services
4455.93 16.55 5769.42 17.40 7546.95 19.12 30.81
(v) Pension & Miscellaneous General Services
7219.62 27.08 8170.40 24.64 9420.32 23.87 15.30
(b) Compensation & Assignment to Local Bodies and PRIs
4018.42 14.93 6330.44 19.09 6671.60 16.90 5.39
(c) Capital Expenditure 2722.99 10.11 2845.31 8.58 3224.89 8.17 13.34
(i) General Services 589.47 2.19 589.09 1.78 770.97 1.95 30.87
( i i ) Discharge of Internal Debt (Net)
1419.16 5.27 1534.52 4.63 1577.72 4.00 2.82
( i i i ) Repayment of Loans to G.O.I.
696.53 2.59 681.75 2.06 774.43 1.96 13.59
( iv ) Loans & Advances to Govt. Servants
17.83 0.07 39.95 0.12 101.77 0.26 154.74
Total non-development Expenditure
26922.26 100.00 33163.80 100.00 39466.69 100.00 19.01
Aggregate Expenditure I + II
94989.79 114617.90 133599.89 16.56
Developmental Exp as % of total Exp
71.66 71.07 70.46 -0.85
Per Capita Development Expenditure(Rs)
10978.63 12949.78 14800.82 14.29
III.Ways & Means & Market Borrowings
1611.37 1594.61 4408.29 22.64
Consolidated Fund 96601.16 116212.51 138008.16 18.75
R.E: Revised Estimates, B.E.: Budget EstimatesNote: Per capita is based on the projected population of 2012, 2013 and 2014Source: Appendix 3.3 based on Budget Documents: 2014-15
Category of Expenditure 2012-13 (Accts)
% 2013-14
(R.E) %
2014-15 (B.E)
%
Percent Variation (2014-15over
2013-14)

42 Economic Survey of Karnataka 2014-15
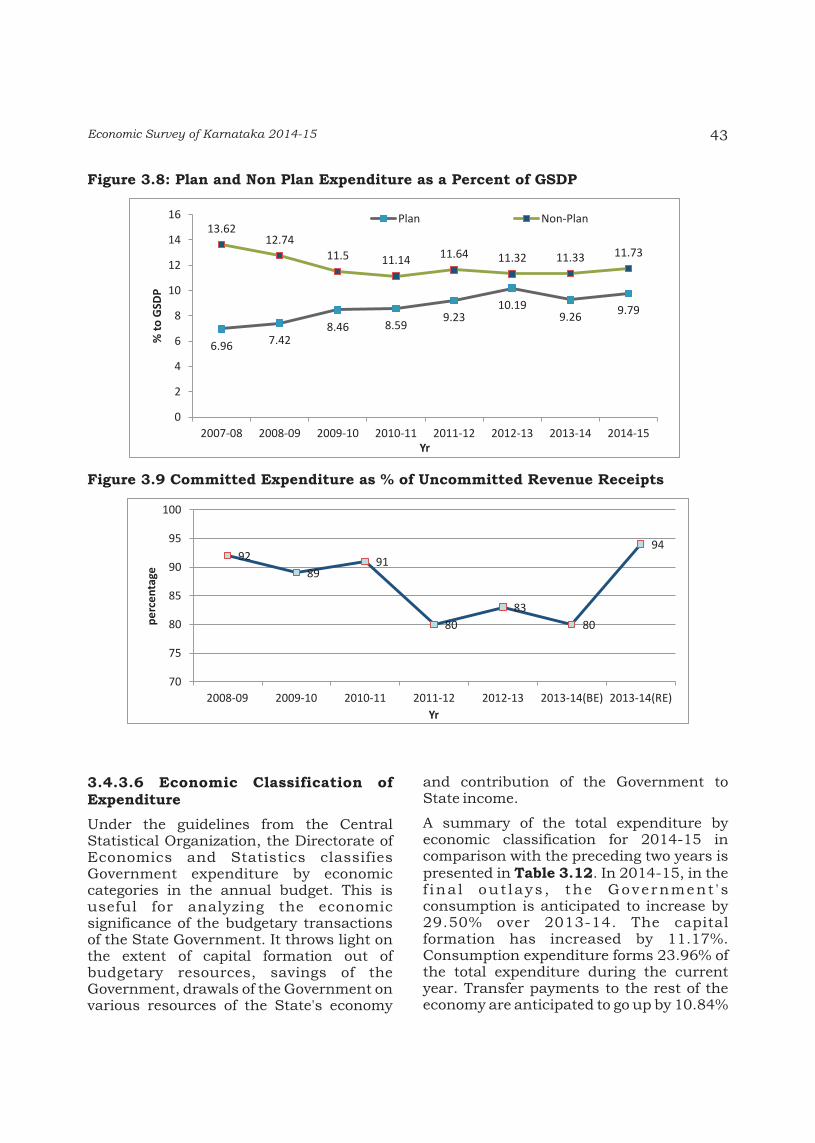
budgeted for 2014-15, plan outlay amounts to Rs.67077.00 crore. There has been a significant increase in the State plan outlay by Rs.17150.00 crore from Rs.48450.00 crore in2013-14(RE) to Rs.65600.00 crore in 2014-15B.E. The central Plan component has decreased by Rs.5766.00 crore from Rs.7243.00 crore in 2013-14 (RE) to Rs.1477.00 crore during the current year. This is because all central assistance to CSS/CPS schemes got transferred to State Plan under Central Assistance to State Plan. Non-Plan expenditure is expected to increase by 17.91% from Rs.68179.00 crore in 2013-14 to Rs.80389.00 crore in 2014-15. While the relevance of plan and non plan categorization is being increasingly questioned, the composition in the current context helps understand the distribution of expenditure between fresh programs and past commitments.
Trends in the share of plan and non-plan expenditure in the GSDP during 2007-08 to 2014-15 are presented in Figure 3.8. It can be seen that there has been a gradual increase in the plan expenditure of the State. Restricting the non-plan expenditure has been possible due to the austerity measures adopted by the Government from time to time such as restrictions on fresh recruitment, vehicle purchases, foreign
tours and training, holding Government functions in star hotels and total ban on travel in business class in flights. However, the State government still has a fairly large amount of expenditure locked up under “committed expenditure” category discussed below.
3.4.3.5 Committed Expenditure
Committed expenditure on salaries, p e n s i o n s , i n t e r e s t , s u b s i d i e s , administrative expenditure, devolution to PRIs and ULBs, etc constitute about 94 percent of the total uncommitted revenue receipts i.e. total revenue receipts less tied grants from Government of India, during the year 2013-14(BE) (Figure 3.9). The graph below traces the trends in the share of committed expenditure to the uncommitted receipts. As is evident from the graph, approximately 94% of uncommitted revenue receipts in 2013-14(RE) are committed. Hence, only 6% of uncommitted revenue receipts are available for new initiatives and meeting existing capital expenditure commitment of the Government. With such limited fiscal space available for manoeuvrability, containing the committed expenditure which is largely revenue in nature via-a-via capital expenditure would be one of the key challenges currently faced by the state.
Table No. 3.11: Plan and Non-plan Expenditure, Karnataka (Rs.crore)
Sl.No. Items 2012-
13(Accts) 2013-14(RE)
2014-15 (BE)
I. Plan
1 State Plan 39764.00
(74.64) 48450.00 (86.99)
65600.00 (97.80)
2 Centrally Sponsored Schemes (including Central sector)
3208.00 (6.02)
7243.00 (13.01)
1477.00 (2.20)
Total Plan Outlay 53272.00 55693.00 67077.00
II. Non-Plan Expenditure 59148.00 68179.00 80389.00
Note: values in the bracket indicate percentage to grand total. R.E: Revised Estimates, B.E: Budget Estimates
43Economic Survey of Karnataka 2014-15
Figure 3.8: Plan and Non Plan Expenditure as a Percent of GSDP
6.96 7.42
8.46 8.59 9.23
10.19 9.26 9.79
13.62 12.74
11.5 11.14 11.64 11.32 11.33 11.73
0
2
4
6
8
10
12
14
16
2007-08 2008-09 2009-10 2010-11 2011-12 2012-13 2013-14 2014-15
% t
o G
SDP
Yr
Plan Non-Plan
Figure 3.9 Committed Expenditure as % of Uncommitted Revenue Receipts
92
89 91
80
83
80
94
70
75
80
85
90
95
100
2008-09 2009-10 2010-11 2011-12 2012-13 2013-14(BE) 2013-14(RE)
pe
rce
nta
ge
Yr
3.4.3.6 Economic Classification of Expenditure
Under the guidelines from the Central Statistical Organization, the Directorate of Economics and Statistics classifies Government expenditure by economic categories in the annual budget. This is useful for analyzing the economic significance of the budgetary transactions of the State Government. It throws light on the extent of capital formation out of budgetary resources, savings of the Government, drawals of the Government on various resources of the State's economy
and contribution of the Government to State income.
A summary of the total expenditure by economic classification for 2014-15 in comparison with the preceding two years is presented in Table 3.12. In 2014-15, in the f ina l out lays , the Government ' s consumption is anticipated to increase by 29.50% over 2013-14. The capital formation has increased by 11.17%. Consumption expenditure forms 23.96% of the total expenditure during the current year. Transfer payments to the rest of the economy are anticipated to go up by 10.84%

44 Economic Survey of Karnataka 2014-15
during the current year. The share of transfer payments to the rest of the economy in total expenditure is 54.65%. Within transfer payments, current transfers, which include interest and subsidies, are a major component (98.12%). Financial investments and loans to the rest of the economy that amounted to Rs.5671.23 crore in 2013-14 have increased to 6685.78 crore in 2014-15.
3.5 CAPITAL FORMATION BYGOVERNMENT
Details of capital formation by the Government are presented in Table 3.13. Gross capital formation by the Government is expected to increase by 12.18% in 2014-15. The value of assets anticipated to be created in 2014-15 is Rs.22404.25 crore of which Rs.18322.96 crore will be created by departmental commercial undertakings and Rs.4081.29 crore by the Government.
3.6 INVESTMENT UNDER PLAN:STATE BUDGETARY SUPPORT (SBS)FOR PLAN
Karnataka's plan SBS (excluding IEBR/ CESS) has increased from Rs.22844 crore to Rs.56096 crore during the period (2009-10 and 2014-15) growing at a CAGR of 19.68 % (Figure 3.10). The plan SBS as a percentage of the budget increased from 36.30% to 40.65% during the same period (Figure 3.11). Relative to the GSDP, the plan SBS increased from 6.8 % to 8.2% during the period (Figure 3.12).
a) Twelfth Five Year Plan (2012-17): The State's plan spending has been growing significantly. The outlay for the 12th Five Year Plan is at Rs. 255250.00 crore. Out of this around 40% is from Borrowings (net), 36% is from own resources, 13% from IEBR and remaining 11 % is from central assistance to State Plan. In respect of %
Table 3.12: Economic Classification of Expenditure of Karnataka State Budget for 2014-15 (Rs.crore)
* Includes interest and subsidy also R.E.: Revised Estimates, B.E.: Budget EstimatesSource: An Economic-cum-Purpose Classification of the Karnataka Government Budget 2004-05 to 2014-15, Directorate of Economics and Statistics, Government of Karnataka.
Sl. No.
Description 2012-13 (Accts)
2013-14 (R.E)
2014-15 (B.E)
Percent Variat ion (2014-15
over 2013-14)
1 Final Outlays 32581.3 4 4299 8.53 52194.69 2 1.39
(a ) Government consumption Expenditure
18755.8 9 2403 1.07 31119.34 2 9.50
(b) Gross C apital Form ation 13852.5 1 1901 8.56 21142.09 1 1.17
(c) Acquisition of Fixed Assets (- )27.06 (-)51.10 (-)66.74 3 0.61
2 Transfer Paym ents to the Rest of the Economy
53198.0 1 6401 8.73 70961.18 1 0.84
(a ) Current Transfers * 52261.4 1 6301 9.10 69632.28 1 0.49
Capital Transfers 936.60 999 .63 1328.90 3 2.94
3 Financial Investm ents and Loans to
the rest o f the Economy 6084.80 5671.23 6685.78 1 7.89
Total Expenditure (1+2+3 ) 91864.15 112688.49 129841.65 15 .22

45Economic Survey of Karnataka 2014-15
Table 3.13: Capital Formation by the Government of Karnataka: 2014-15 (Rs.crore)
Source: An Economic-cum-Purpose Classification of the Karnataka Government Budget 2004-05 to 2014-15, Directorate of Economics and Statistics, Government of Karnataka
S l.No. Description 2012-13 (A ccts)
2013-14 (R.E)
2014-15 (B.E)
Percent V ariation
(2014-15 over 2013 -14 )
1 Value of Assets Created 14762.05 19967.09 22404 .25 12.21
(a ) By Departmenta l Com mercial Undertakings
12298.16 17009.36 18322 .96 7.72
(b) By Governm ent Adm inistration 2463.89 295 7.73 4081.29 37.99
2 Change in S tock in (a) & (b) above
(- )0.79 (- )20.04 (-)28.62 42.81
Total: Gross Capita l
Format ion 14761.26 19947 .05 22375 .63 12 .18
Figure 3.10: Plan State Budgetary Support
22844 27918
33584 34201
40745
56096
0
10000
20000
30000
40000
50000
60000
2009-10 2010-11 2011-12 2012-13 2013-14 2014-15
Rs.
cro
re
Yr
Figure 3.11: Share of plan SBS in Budget
36.30
39.64
39.15
35.40 35.06
40.65
32
33
34
35
36
37
38
39
40
41
42
2009-10 2010-11 2011-12 2012-13 2013-14 2014-15
%
Yr

46 Economic Survey of Karnataka 2014-15
anticipated utilisation of resources in the first 3 years, it is high in Central Assistance (74.76%) followed by State Own Resources (71.55%), IEBR (57.93%) and State Borrowings (net) at 46.80% (Table 3.14). The State has one of the highest per-capita plan expenditure among major states in the country at Rs.7472 in 2013-14.
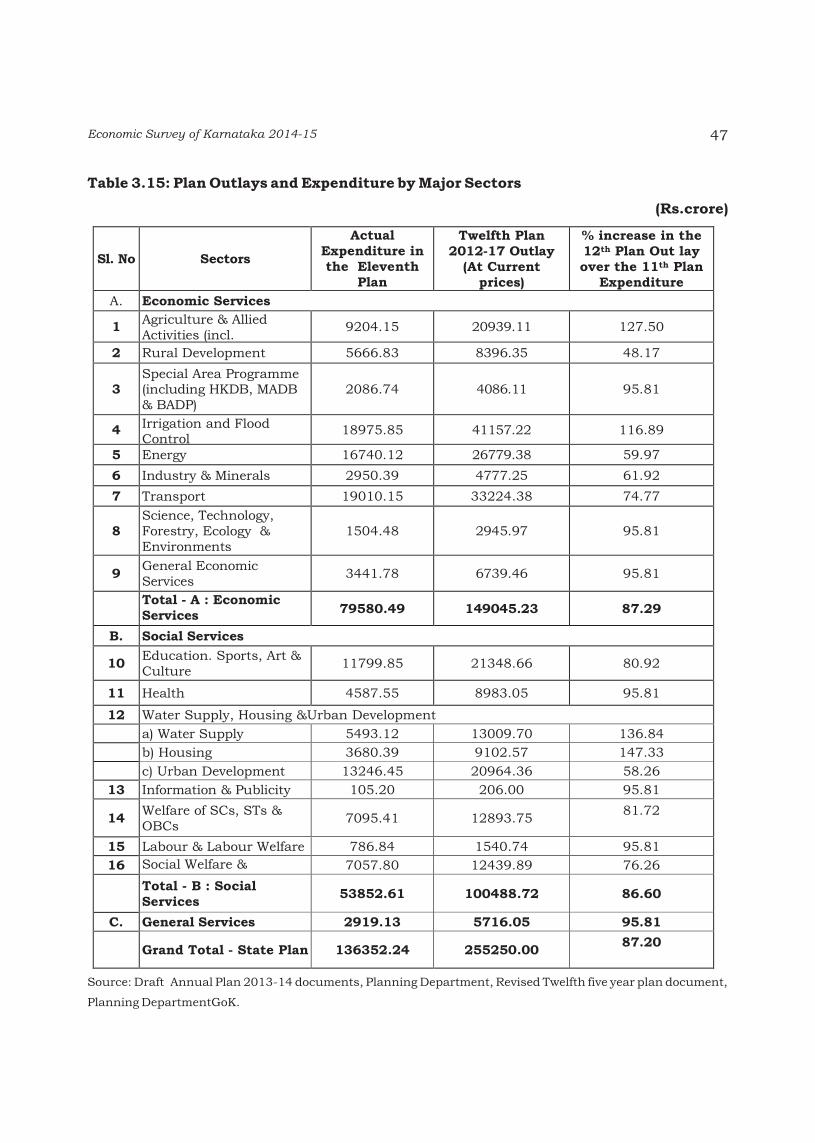
b) Inter-sectoral Outlays: The sectors which have performed well in eleventh plan including Agriculture and Allied Activities,
Irrigation and Flood Control, Energy, Industries and Minerals, Transport, Science, Technology and Environment, General Economic Services, Education, Health, Information and Publicity, Welfare of SCs,STs and OBCs, Labour and Employment and Social Security. The plan performance by the major sectors during the eleventh five year plan and approved outlays in the Twelfth plan 2012-17 outlay at current prices are presented in Table 3.15.
Figure 3.12: Share of plan SBS to GSDP
6.8 7.3
7.7
6.5 6.8
8.2
0
1
2
3
4
5
6
7
8
9
2009-10 2010-11 2011-12 2012-13 2013-14 2014-15
Perc
enta
ge
Yr.
Table 3.14: Financial Resources of Twelfth Plan, Karnataka (Rs.crore)
Figures in bracket indicate % to totalSource: Finance Department, GoK
Items Twelfth Plan Target (at Current prices)
Anticipated Achievement in
2012-13 to 2014-15
% Utilisation
1 State Borrowings(net) 101654.00(39.83) 47573.22(30.92) 46.80
2 State Own Resources 92095.00(36.08) 65898.38(42.84) 71.55
3 IEBR 33486.00(13.12) 19398.00(12.61) 57.93
4 Central Assistance 28015.00(10.97) 20943.49(13.61) 74.76
Total 255250.00 153813.09 60.26
47Economic Survey of Karnataka 2014-15
Table 3.15: Plan Outlays and Expenditure by Major Sectors
(Rs.crore)
Source: Draft Annual Plan 2013-14 documents, Planning Department, Revised Twelfth five year plan document,
Planning DepartmentGoK.
Sl. No Sectors
Actual Expenditure in the Eleventh
Plan
Twelfth Plan 2012-17 Outlay
(At Current prices)
% increase in the 12th Plan Out lay over the 11th Plan
Expenditure
A. Economic Services
1 Agriculture & Allied Activities (incl. Cooperation)
9204.15 20939.11 127.50
2 Rural Development 5666.83 8396.35 48.17
3 Special Area Programme (including HKDB, MADB & BADP)
2086.74 4086.11 95.81
4 Irrigation and Flood Control
18975.85 41157.22 116.89
5 Energy 16740.12 26779.38 59.97
6 Industry & Minerals 2950.39 4777.25 61.92
7 Transport 19010.15 33224.38 74.77
8 Science, Technology, Forestry, Ecology & Environments
1504.48 2945.97 95.81
9 General Economic Services
3441.78 6739.46 95.81
Total - A : Economic Services
79580.49 149045.23 87.29
B. Social Services
10 Education. Sports, Art & Culture
11799.85 21348.66 80.92
11 Health 4587.55 8983.05 95.81
12 Water Supply, Housing &Urban Development
a) Water Supply 5493.12 13009.70 136.84
b) Housing 3680.39 9102.57 147.33
c) Urban Development 13246.45 20964.36 58.26
13 Information & Publicity 105.20 206.00 95.81
14 Welfare of SCs, STs & OBCs
7095.41 12893.75 81.72
15 Labour & Labour Welfare 786.84 1540.74 95.81
16 Social Welfare & Nutrition
7057.80 12439.89 76.26
Total - B : Social Services
53852.61 100488.72 86.60
C. General Services 2919.13 5716.05 95.81
Grand Total - State Plan 136352.24 255250.00
87.20

48 Economic Survey of Karnataka 2014-15
Sectoral breakup of plan outlays by major sectors for the last three years is presented in Table 3.16.
Table 3.16: Developmental Outlays by Major Sectors (Rs.crore)
Source: 1) Annual Plan (Volume-2)2014-15 2) Details of Estimates of Irrigation, 2014-15BE: Budget Estimates, RE: Revised Estimates and AC: Accounts
Sl.No.
Sectors 2012-13 (Accts)
% to Total
2013-14(RE)
% to Total
2014-15(BE)
% to Total
A. State Plan
L Economic Services
1 Agriculture & Allied Activities (Including Co-operation)
3834.06
7.16 7534.31 13.46 6007.52 8.96
2 Rural Development 1266.50 2.37 1215.66 2.17 3227.81 4.81
3 Special Area Programme (including HKDB, MADB & ADP)
485.29 0.91 996.16 1.78 1377.52 2.05
4 Irrigation and Flood Control 5154.17 9.63 7470.97 13.35 10454.14 15.58
5 Energy 4383.55 8.19 4365.93 7.80 4980.87 7.43
6 Industry and Minerals 590.39 1.10 893.29 1.60 922.15 1.37
7 Transport 5668.44 10.59 6308.18 11.27 5461.23 8.14
8 Science, Technology & Environment
438.53 0.82 540.76 0.97 727.75 1.08
9 General Economic Services 770.15 1.44 837.14 1.50 1113.90 1.66
Total - I: Economic Services 22591.08 42.19 30162.41 53.90 34272.89 51.09
II. Social Services
10 Education, Sports, Art & Culture 3583.66 6.69 3681.75 6.58 8052.55 12.00
11 Health 1292.04 2.41 1917.94 3.43 3095.16 4.61
12 Water Supply, Housing & Urban Development
(a) Water Supply 2225.78 4.16 1640.81 2.93 2501.46 3.73
(b) Housing 1103.26 2.06 1434.01 2.56 2042.57 3.49
(c) Urban Development 2732.86 5.10 4402.13 7.87 5272.35 7.86
13 Information and Publicity 33.31 0.06 32.13 0.06 35.21 0.05
14 Welfare of SCs, STs & OBCs 2867.01 5.35 1936.63 3.46 4949.03 7.38
15 Labour & Labour Welfare 211.53 0.40 290.53 0.52 473.02 0.71
16 Social Welfare & Nutrition 2311.31 4.32 2093.59 3.74 3076.26 4.59
Total - II: Social Services 16360.76 30.55 17429.52 31.15 29797.61 44.42
I. General Services 811.76 1.52 858.50 1.53 1529.27 2.28
Total - A : State Plan 39763.59 74.26 48450.42 86.58 65599.77 97.79
B. Irrigation Projects Pending Approval (Non-Plan)
276.79 0.52 265.48 0.47 3.58 0.01
C. Centrally Sponsored & Central Plan Schemes (GOI Share Outlay)
13508.00 25.23 7243.00 12.94 1477.00 2.20
Grand Total 53548.38 100.00 55958.90 100.00 67080.35 100.00
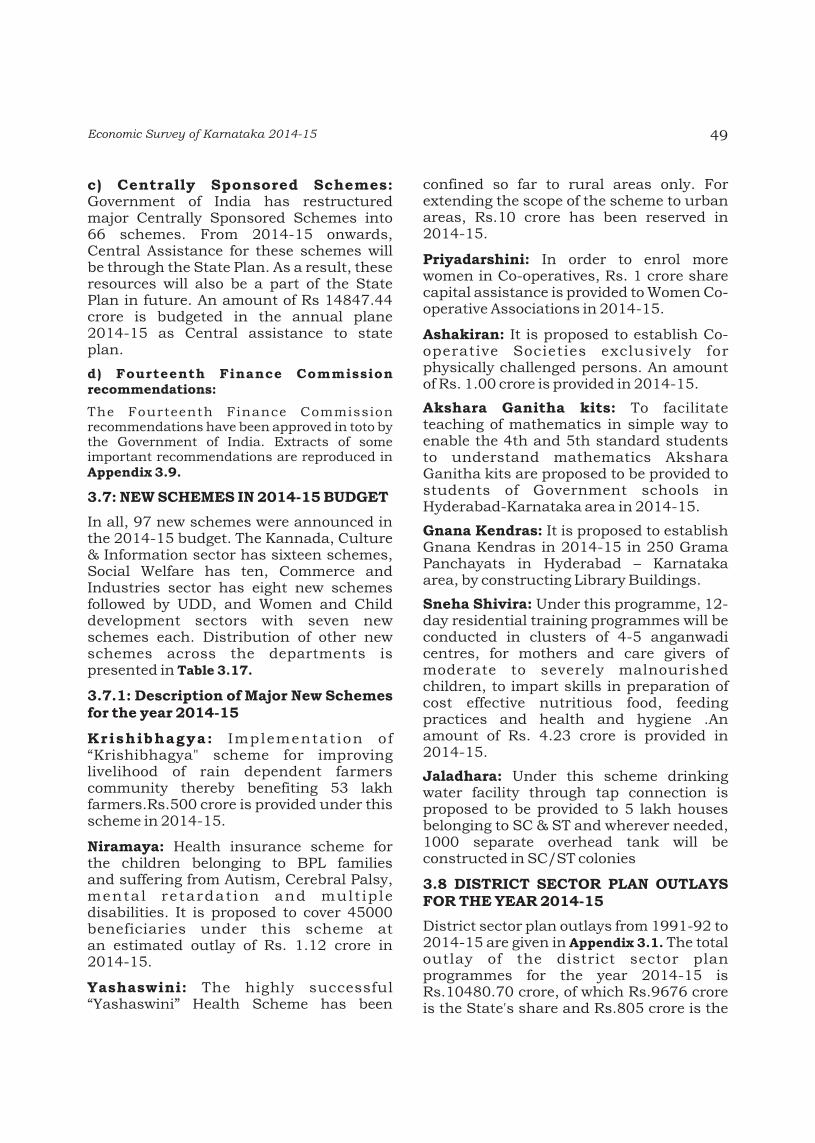
c) Centrally Sponsored Schemes: Government of India has restructured major Centrally Sponsored Schemes into 66 schemes. From 2014-15 onwards, Central Assistance for these schemes will be through the State Plan. As a result, these resources will also be a part of the State Plan in future. An amount of Rs 14847.44 crore is budgeted in the annual plane 2014-15 as Central assistance to state plan.
d) Fourteenth Finance Commission recommendations:
The Fourteenth Finance Commission recommendations have been approved in toto by the Government of India. Extracts of some important recommendations are reproduced in Appendix 3.9.
3.7: NEW SCHEMES IN 2014-15 BUDGET
In all, 97 new schemes were announced in the 2014-15 budget. The Kannada, Culture & Information sector has sixteen schemes, Social Welfare has ten, Commerce and Industries sector has eight new schemes followed by UDD, and Women and Child development sectors with seven new schemes each. Distribution of other new schemes across the departments is presented in Table 3.17.
3.7.1: Description of Major New Schemes for the year 2014-15
Krishibhagya: Implementat ion of “Krishibhagya" scheme for improving livelihood of rain dependent farmers community thereby benefiting 53 lakh farmers.Rs.500 crore is provided under this scheme in 2014-15.
Niramaya: Health insurance scheme for the children belonging to BPL families and suffering from Autism, Cerebral Palsy, mental retardat ion and mult ip le disabilities. It is proposed to cover 45000 beneficiaries under this scheme at an estimated outlay of Rs. 1.12 crore in 2014-15.
Yashaswini: The highly successful “Yashaswini” Health Scheme has been
confined so far to rural areas only. For extending the scope of the scheme to urban areas, Rs.10 crore has been reserved in 2014-15.
Priyadarshini: In order to enrol more women in Co-operatives, Rs. 1 crore share capital assistance is provided to Women Co-operative Associations in 2014-15.
Ashakiran: It is proposed to establish Co-operative Societies exclusively for physically challenged persons. An amount of Rs. 1.00 crore is provided in 2014-15.
Akshara Ganitha kits: To facilitate teaching of mathematics in simple way to enable the 4th and 5th standard students to understand mathematics Akshara Ganitha kits are proposed to be provided to students of Government schools in Hyderabad-Karnataka area in 2014-15.
Gnana Kendras: It is proposed to establish Gnana Kendras in 2014-15 in 250 Grama Panchayats in Hyderabad – Karnataka area, by constructing Library Buildings.
Sneha Shivira: Under this programme, 12-day residential training programmes will be conducted in clusters of 4-5 anganwadi centres, for mothers and care givers of moderate to severely malnourished children, to impart skills in preparation of cost effective nutritious food, feeding practices and health and hygiene .An amount of Rs. 4.23 crore is provided in 2014-15.
Jaladhara: Under this scheme drinking water facility through tap connection is proposed to be provided to 5 lakh houses belonging to SC & ST and wherever needed, 1000 separate overhead tank will be constructed in SC/ST colonies
3.8 DISTRICT SECTOR PLAN OUTLAYS FOR THE YEAR 2014-15
District sector plan outlays from 1991-92 to 2014-15 are given in Appendix 3.1. The total outlay of the district sector plan programmes for the year 2014-15 is Rs.10480.70 crore, of which Rs.9676 crore is the State's share and Rs.805 crore is the
49Economic Survey of Karnataka 2014-15

50 Economic Survey of Karnataka 2014-15
Table 3.17: Department wise New Plan Scheme for the year (2014-15)
Source: PMI division, PlanningDept
Departments N o of schemes
Agriculture 1
An im al Husbandry and Fisheries 4
Co -operation 3
Socia l welfare 10
Backward Classe s 1
Mino rities We lfare 2
Rural development and Panchayat Raj 5
Food and Civil Supplies 1
Comm erce & Industries 8
Higher Education 6
Prim ary Education 4
Health & Family Welfare 4
Medical Education 2
Revenue 2
Kannada, Culture & In fo rm ation 16
Labour 5
UDD 7
Wome n and C hild 7
E-Governance 1
Hom e 1
Spo rts & Youth Services 4
Tourism 3
Total 97
share of the Government of India. This constitutes around 16% of the total State's plan size, in the district sector outlay, the corresponding share of the State and the centre being 92% and 8% respectively. District wise break-up of the plan outlay is presented in Table 3.18.
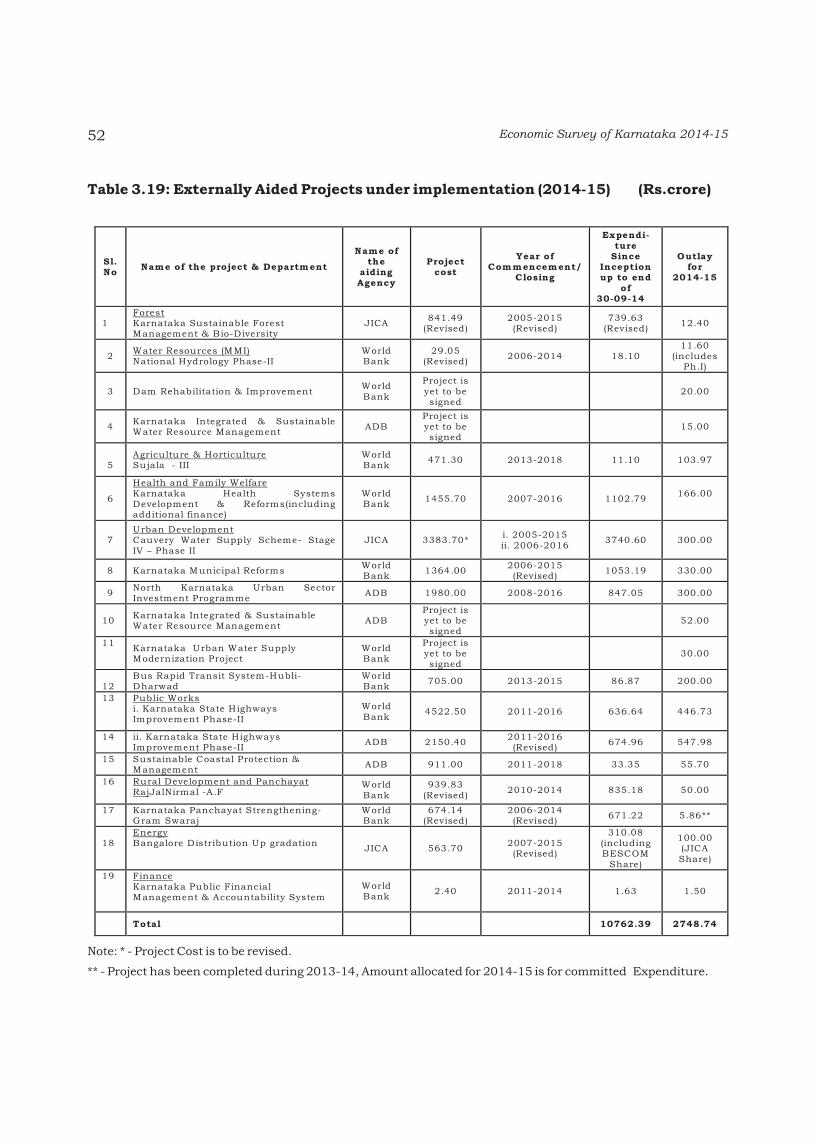
3.9 EXTERNALLY AIDED PROJECTS
There are fifteen external aided projects under implementation with assistance from the World Bank and other external agencies during the year 2014-15. Of these, four are in Urban Development, three in Public Works Department, two in Rural Development and Panchayat Raj department, two in Water Resources and
one each in Health and Family Welfare, Forest, Energy and Finance departments. Another project, namely, Sujala III is being implemented by both Agriculture and Horticulture departments. It is proposed to implement Karnataka Integrated and Sustainable Water Resource Management – Urban Development Sector, Karnataka Integrated and Sustainable Water Resource Management – Irrigation Sector, Karnataka Urban water Supply Modernization Project and Dam Rehabilitation and Improvement Project for the current year. Expenditure incurred on these projects since inception up to 30.09.2014 is Rs.10762.39 crore. Project wise details are presented in Table 3.19.

51Economic Survey of Karnataka 2014-15
Table 3.18: District Plan Outlay for the year 2014-15 (Rs.lakh)
District State % Central % Total %
Bangalore Urban 26612.50 2.54 3265.00 0.31 29877.50 2.85
Bangalore Rural 11195.00 1.07 1699.30 0.16 12894.30 1.23
Bagalkote 25518.62 2.43 2192.51 0.21 27711.13 2.64
Belgaum 53126.76 5.07 7796.24 0.74 60923.00 5.81
Bellary 27262.07 2.60 2335.68 0.22 29597.75 2.82
Bidar 20313.85 1.94 1788.12 0.17 22101.97 2.11
Bijapur 29959.73 2.86 3253.06 0.31 33212.79 3.17
Chamarajanagar 12570.89 1.20 1810.85 0.17 14381.74 1.37
Chikkaballapur 15468.60 1.48 1499.00 0.14 16967.60 1.62
Chickmagalore 16795.52 1.60 2207.50 0.21 19003.02 1.81
Chitradurga 21885.81 2.09 2127.48 0.20 24013.29 2.29
Dakshina Kannada 17585.20 1.68 2839.96 0.27 20425.16 1.95
Davangere 20937.08 2.00 2896.61 0.28 23833.69 2.27
Dharwad 17842.66 1.70 2950.67 0.28 20793.33 1.98
Gadag 13171.56 1.26 1203.14 0.11 14374.70 1.37
Gulbarga 36341.47 3.47 2521.67 0.24 38863.14 3.71
Hassan 20805.37 1.99 3000.87 0.29 23806.24 2.27
Haveri 19788.03 1.89 2337.80 0.22 22125.83 2.11
Kodagu 7138.42 0.68 1208.68 0.12 8347.10 0.80
Kolar 17199.55 1.64 1523.43 0.15 18722.98 1.79
Koppal 18768.18 1.79 2159.48 0.21 20927.66 2.00
Mandya 20310.56 1.94 2782.87 0.27 23093.43 2.20
Mysore 26708.62 2.55 3488.96 0.33 30197.58 2.88
Raichur 27270.18 2.60 3561.00 0.34 30831.18 2.94
Ramanagar 12694.24 1.21 1841.93 0.18 14536.17 1.39
Shimoga 22644.49 2.16 2541.31 0.24 25185.80 2.40
Tumkur 31216.42 2.98 3984.40 0.38 35200.82 3.36
Udupi 10329.81 0.99 1517.05 0.14 11846.86 1.13
Uttar Kannada 23749.61 2.27 3192.88 0.30 26942.49 2.57
Yadgir 14610.93 1.39 1119.61 0.11 15730.54 1.50
Lump sum – ZP 327786.05 31.28 3816.00 0.36 331602.05 31.64
Grand Total 967607.78 92.32 80463.06 7.68 1048070.84 100.00
52 Economic Survey of Karnataka 2014-15
Table 3.19: Externally Aided Projects under implementation (2014-15) (Rs.crore)
Note: * - Project Cost is to be revised.
** - Project has been completed during 2013-14, Amount allocated for 2014-15 is for committed Expenditure.
Sl.No
Name of the project & Department
Name of the
aiding Agency
Project cost
Year of Commencement/
Closing
Expendi-ture
Since Inception up to end
of 30-09-14
Outlay for
2014-15
1
Forest Karnataka Sustainable Forest Management & Bio-Diversity
JICA 841.49
(Revised) 2005-2015 (Revised)
739.63 (Revised)
12.40
2 Water Resources (MMI) National Hydrology Phase-II
World Bank
29.05 (Revised)
2006-2014 18.10 11.60
(includes Ph.I)
3 Dam Rehabilitation & Improvement World Bank
Project is yet to be signed
20.00
4 Karnataka Integrated & Sustainable Water Resource Management
ADB Project is yet to be signed
15.00
5
Agriculture & Horticulture Sujala - III
World Bank
471.30 2013-2018 11.10 103.97
6
Health and Family Welfare Karnataka Health SystemsDevelopment & Reforms(includingadditional finance)
World Bank
1455.70 2007-2016 1102.79 166.00
7 Urban Development Cauvery Water Supply Scheme- Stage IV – Phase II
JICA 3383.70* i. 2005-2015 ii. 2006-2016
3740.60 300.00
8 Karnataka Municipal Reforms World Bank
1364.00 2006-2015 (Revised)
1053.19 330.00
9 North Karnataka Urban SectorInvestment Programme
ADB 1980.00 2008-2016 847.05 300.00
10
Karnataka Integrated & Sustainable Water Resource Management
ADB Project is yet to be signed
52.00
11 Karnataka Urban Water Supply Modernization Project
World Bank
Project is yet to be signed
30.00
12
Bus Rapid Transit System-Hubli-Dharwad
World Bank
705.00 2013-2015 86.87 200.00
13 Public Works i. Karnataka State Highways Improvement Phase-II
World Bank
4522.50 2011-2016 636.64 446.73
14 ii. Karnataka State Highways Improvement Phase-II
ADB 2150.40 2011-2016 (Revised)
674.96 547.98
15 Sustainable Coastal Protection & Management
ADB 911.00 2011-2018 33.35 55.70
16 Rural Development and Panchayat RajJalNirmal -A.F
World Bank
939.83 (Revised)
2010-2014 835.18 50.00
17 Karnataka Panchayat Strengthening- Gram Swaraj
World Bank
674.14 (Revised)
2006-2014 (Revised)
671.22 5.86**
18
Energy Bangalore Distribution Up gradation
JICA 563.70 2007-2015 (Revised)
310.08 (including BESCOM
Share)
100.00 (JICA Share)
19 Finance Karnataka Public Financial Management & Accountability System
World Bank
2.40 2011-2014 1.63 1.50
Total 10762.39 2748.74

53Economic Survey of Karnataka 2014-15
3.10 CURRENT FISCAL CHALLENGES AND WAY FORWARD
Despite the State's broad successes in its fiscal consolidation efforts, the State government faces several fiscal challenges arising from a limited potential for enhancing tax revenue given the current levels of high tax / GSDP ratio, rigidities in the form of committed expenditure, and weak linkages between expenditure and development outcomes as detailed below.
1. Tax effort plateau: Having already achieved the highest tax to GSDP ratio, any further increase in the tax effort is fairly challenging. Similarly, achieving a higher level of tax buoyancy is difficult as the marginal increase in the taxes from a high base is likely to be lower. As a result, until the economy as a whole grows at an accelerated rate, the tax collections will not see a quantum jump like in the past.
2. Low non-tax revenue: While the State has one of the highest own taxes to GSDP ratio, the ratio of non-tax revenue to total receipts has not been increasing over the years on anticipated lines. Apart from enforcement and monitoring of own tax efforts, special emphasis needs to be given for mobilizing non tax revenues during the coming years. Government is committed to rationalizing user changes and reviewing the same regularly. Further, Government is also guided by the recommendations of Expenditure Reform Commission.
3. Low recovery of loans and advances: The State's borrowings are more expensive than the loans advanced by the government. The recipient boards and corporations are unable to service the loans given to them by the State government in view of low recovery of cost of their services from the consumers.
4. Committed expenditure: Committed expenditure on salaries, pensions, interest, subsidies, administrative expenditure, devolution to PRIs and ULBs etc., constitute about 94% of the total uncommitted
revenue receipts during 2013-14(RE). Containing the committed expenditure in light of the ever-expanding demands for welfare programmes, an increase in the employee strength vis-a-vis capital expenditure is one of the key challenges.
5. Non-Plan Expenditure: A large part of non plan expenditure of State consists of Development expenditure, which is primarily spent on Social and Economic Services. The Government strategy is to effectively control non-essential, non developmental expenditure so as to ensure adequate resource al locat ion for development activities in various sectors.
6. Linkage between expenditure and outcomes: In-spite of maintaining one of the highest per capita plan expenditure, the State has been able to achieve economic growth at all-state average level only. Ensuring the desired levels of outcome from ever increasing outlays for the development mandate is one of the key governance challenges. Karnataka continues to be behind Maharashtra, Haryana, Tamil Nadu, Uttarakhanda, Gujarat and West Bengal. District Human Development reports for all the 30 districts are expected by March 2015 which and could be the basis for framing policies for equitable resource allocation which in turn helps in achieving inclusive growth in terms of human development indices. While there is a need for focused investment in these sectors, ensuring effective implementation machinery and monitoring the outcomes closely and equitable resource allocation to districts/blocks based on the District Human Development Reports is a challenge.
7. Goods and Services Tax (GST): The State has supported the introduction of GST but has endeavored to ensure that the fiscal autonomy of the States in mobilizing revenue is not compromised in the proposed GST scheme.
The following initiatives have been taken by the State:
54 Economic Survey of Karnataka 2014-15
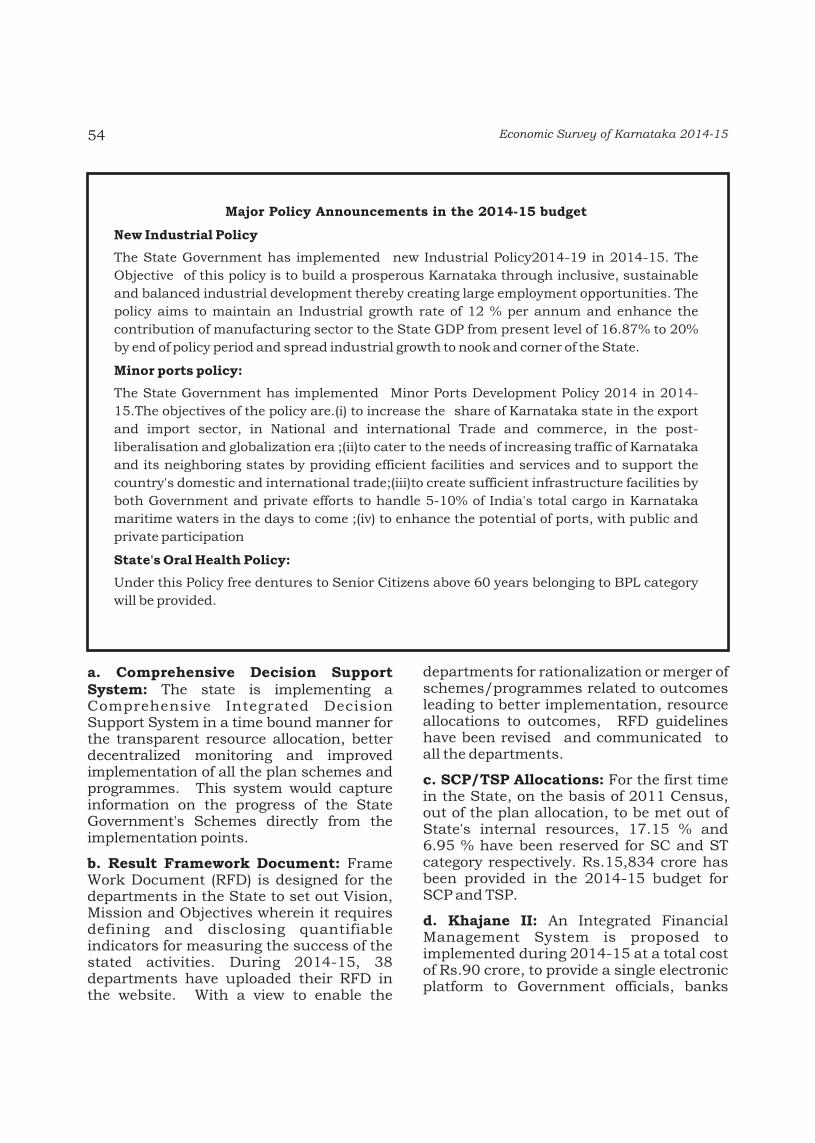
Major Policy Announcements in the 2014-15 budget
New Industrial Policy
The State Government has implemented new Industrial Policy2014-19 in 2014-15. The
Objective of this policy is to build a prosperous Karnataka through inclusive, sustainable
and balanced industrial development thereby creating large employment opportunities. The
policy aims to maintain an Industrial growth rate of 12 % per annum and enhance the
contribution of manufacturing sector to the State GDP from present level of 16.87% to 20%
by end of policy period and spread industrial growth to nook and corner of the State.
Minor ports policy:
The State Government has implemented Minor Ports Development Policy 2014 in 2014-
15.The objectives of the policy are.(i) to increase the share of Karnataka state in the export
and import sector, in National and international Trade and commerce, in the post-
liberalisation and globalization era ;(ii)to cater to the needs of increasing traffic of Karnataka
and its neighboring states by providing efficient facilities and services and to support the
country's domestic and international trade;(iii)to create sufficient infrastructure facilities by
both Government and private efforts to handle 5-10% of India's total cargo in Karnataka
maritime waters in the days to come ;(iv) to enhance the potential of ports, with public and
private participation
State's Oral Health Policy:
Under this Policy free dentures to Senior Citizens above 60 years belonging to BPL category
will be provided.
a. Comprehensive Decision Support System: The state is implementing a Comprehensive Integrated Decision Support System in a time bound manner for the transparent resource allocation, better decentralized monitoring and improved implementation of all the plan schemes and programmes. This system would capture information on the progress of the State Government's Schemes directly from the implementation points.
b. Result Framework Document: Frame Work Document (RFD) is designed for the departments in the State to set out Vision, Mission and Objectives wherein it requires defining and disclosing quantifiable indicators for measuring the success of the stated activities. During 2014-15, 38 departments have uploaded their RFD in the website. With a view to enable the
departments for rationalization or merger of schemes/programmes related to outcomes leading to better implementation, resource allocations to outcomes, RFD guidelines have been revised and communicated to all the departments.
c. SCP/TSP Allocations: For the first time in the State, on the basis of 2011 Census, out of the plan allocation, to be met out of State's internal resources, 17.15 % and 6.95 % have been reserved for SC and ST category respectively. Rs.15,834 crore has been provided in the 2014-15 budget for SCP and TSP.
d. Khajane II: An Integrated Financial Management System is proposed to implemented during 2014-15 at a total cost of Rs.90 crore, to provide a single electronic platform to Government officials, banks
55Economic Survey of Karnataka 2014-15
and public, to carry out all financial transactions pertaining to the State Government.
e. Article371 (J): The inclusion of Article 371 (J) in the Constitution of India for the development of Hyderabad-Karnataka area is a matter of pride. In this regard, action has been taken for providing reservation to the people of this area in employment, higher education, vocational education and to constitute Area Development Board.
f. Delegation of Fund release powers to Administrative Departments: With a view to improve the pace of implementation of
schemes and thereby improve plan expenditure, Finance Department has delegated powers of release of funds to concerned Administrative Secretaries for the first three quarters of the Financial Year up to 75 per cent of the budget provision for almost all the major schemes of departments (except for a few schemes). It is expected that this delegation would improve the pace of plan expenditure incurred by Departments.

56 Economic Survey of Karnataka 2014-15